Oil Icons
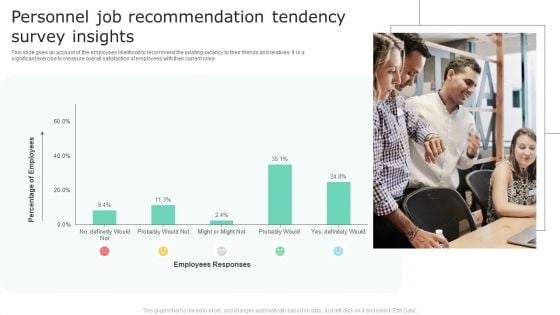
Personnel Job Recommendation Tendency Survey Insights Topics PDF
This slide gives an account of the employees likelihood to recommend the existing vacancy to their friends and relatives. It is a significant exercise to measure overall satisfaction of employees with their current roles. Pitch your topic with ease and precision using this Personnel Job Recommendation Tendency Survey Insights Topics PDF. This layout presents information on Percentage Of Employees, Employees Responses. It is also available for immediate download and adjustment. So, changes can be made in the color, design, graphics or any other component to create a unique layout.
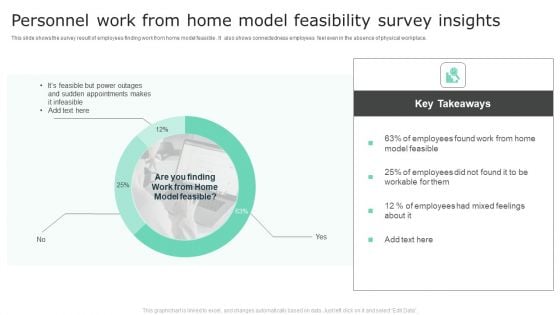
Personnel Work From Home Model Feasibility Survey Insights Portrait PDF
This slide shows the survey result of employees finding work from home model feasible . It also shows connectedness employees feel even in the absence of physical workplace. Pitch your topic with ease and precision using this Personnel Work From Home Model Feasibility Survey Insights Portrait PDF. This layout presents information on Work From Home, Model Feasible, Mixed Feelings. It is also available for immediate download and adjustment. So, changes can be made in the color, design, graphics or any other component to create a unique layout.
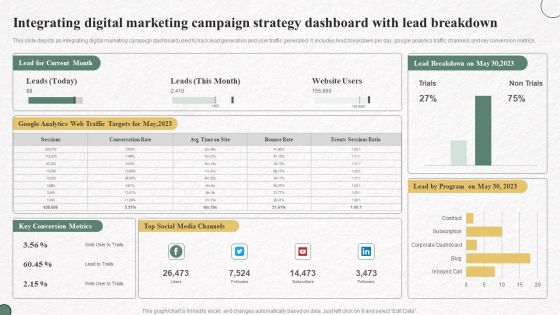
Integrating Digital Marketing Campaign Strategy Dashboard With Lead Breakdown Slides PDF
This slide depicts an integrating digital marketing campaign dashboard used to track lead generation and user traffic generated. It includes lead breakdown per day, google analytics traffic channels and key conversion metrics. Showcasing this set of slides titled Integrating Digital Marketing Campaign Strategy Dashboard With Lead Breakdown Slides PDF. The topics addressed in these templates are Lead Current Month, Website Users, Top Social Media Channels. All the content presented in this PPT design is completely editable. Download it and make adjustments in color, background, font etc. as per your unique business setting.
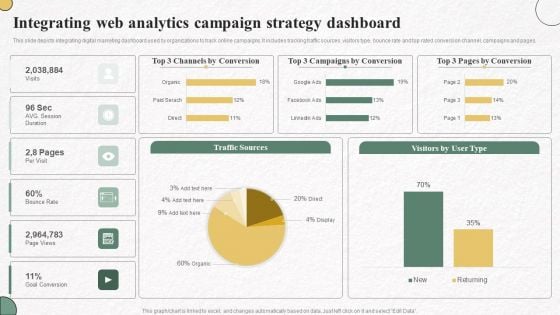
Integrating Web Analytics Campaign Strategy Dashboard Information PDF
This slide depicts integrating digital marketing dashboard used by organizations to track online campaigns. It includes tracking traffic sources, visitors type, bounce rate and top rated conversion channel, campaigns and pages. Showcasing this set of slides titled Integrating Web Analytics Campaign Strategy Dashboard Information PDF. The topics addressed in these templates are Channels By Conversion, Campaigns By Conversion, Pages By Conversion. All the content presented in this PPT design is completely editable. Download it and make adjustments in color, background, font etc. as per your unique business setting.
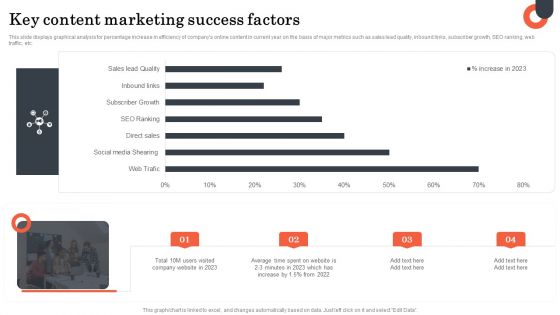
Key Content Marketing Success Factors Microsoft PDF
This slide displays graphical analysis for percentage increase in efficiency of companys online content in current year on the basis of major metrics such as sales lead quality, inbound links, subscriber growth, SEO ranking, web traffic, etc. Pitch your topic with ease and precision using this Key Content Marketing Success Factors Microsoft PDF. This layout presents information on Key Content, Marketing Success Factors. It is also available for immediate download and adjustment. So, changes can be made in the color, design, graphics or any other component to create a unique layout.
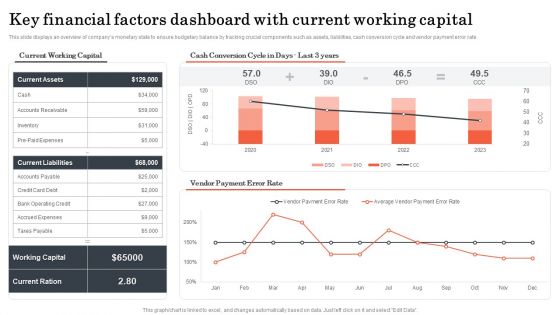
Key Financial Factors Dashboard With Current Working Capital Introduction PDF
This slide displays an overview of companys monetary state to ensure budgetary balance by tracking crucial components such as assets, liabilities, cash conversion cycle and vendor payment error rate. Showcasing this set of slides titled Key Financial Factors Dashboard With Current Working Capital Introduction PDF. The topics addressed in these templates are Key Financial Factors, Dashboard With Current, Working Capital. All the content presented in this PPT design is completely editable. Download it and make adjustments in color, background, font etc. as per your unique business setting.
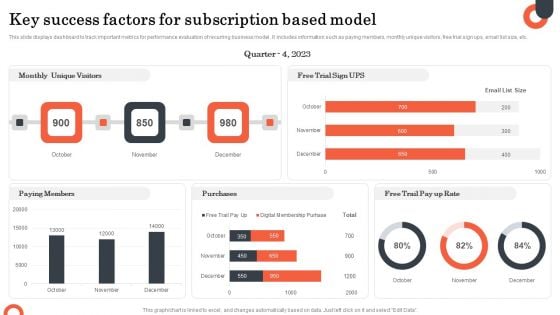
Key Success Factors For Subscription Based Model Formats PDF
This slide displays dashboard to track important metrics for performance evaluation of recurring business model . It includes information such as paying members, monthly unique visitors, free trial sign ups, email list size, etc. Showcasing this set of slides titled Key Success Factors For Subscription Based Model Formats PDF. The topics addressed in these templates are Monthly Unique Visitors, Purchases, Paying Members. All the content presented in this PPT design is completely editable. Download it and make adjustments in color, background, font etc. as per your unique business setting.

KPI Dashboard To Track Sales And Operations Process Of Manufacturing Enterprise Brochure PDF
This slide depicts a dashboard to track the key performance metrics in sales and operations process of a manufacturing enterprise to analyze deviations in the actual and planned output. The key performing indicators are percentage deviation, dollar deviation, inventory in hand etc.Pitch your topic with ease and precision using this KPI Dashboard To Track Sales And Operations Process Of Manufacturing Enterprise Brochure PDF. This layout presents information on Planned Output, Yearly Growth, Inventory Hand. It is also available for immediate download and adjustment. So, changes can be made in the color, design, graphics or any other component to create a unique layout.
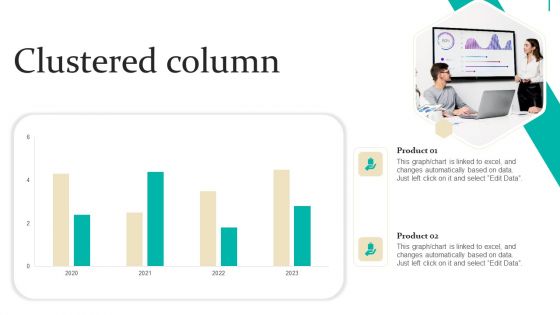
Enterprise Risk Management Clustered Column Ppt File Graphics Example PDF
Find highly impressive Enterprise Risk Management Clustered Column Ppt File Graphics Example PDF on Slidegeeks to deliver a meaningful presentation. You can save an ample amount of time using these presentation templates. No need to worry to prepare everything from scratch because Slidegeeks experts have already done a huge research and work for you. You need to download Enterprise Risk Management Clustered Column Ppt File Graphics Example PDF for your upcoming presentation. All the presentation templates are 100 percent editable and you can change the color and personalize the content accordingly. Download now.
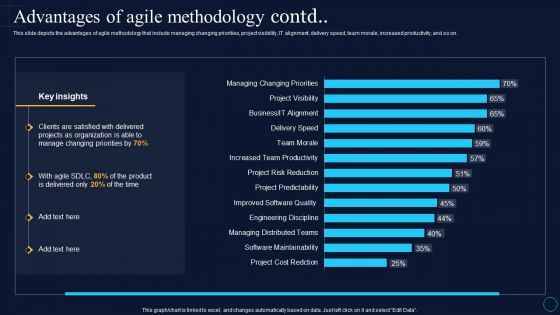
Advantages Of Agile Methodology Contd Software Development Approaches Inspiration PDF
This slide depicts the advantages of agile methodology that include managing changing priorities, project visibility, IT alignment, delivery speed, team morale, increased productivity, and so on.Take your projects to the next level with our ultimate collection of Advantages Of Agile Methodology Contd Software Development Approaches Inspiration PDF. Slidegeeks has designed a range of layouts that are perfect for representing task or activity duration, keeping track of all your deadlines at a glance. Tailor these designs to your exact needs and give them a truly corporate look with your own brand colors they all make your projects stand out from the rest.
Cognitive Analytics Strategy And Techniques Tracking Customer Data Insights Dashboard Demonstration PDF
This slide provides information regarding customer data insights dashboard in terms of average churn risk, segments, high earner, highly engaged customers, etc. Take your projects to the next level with our ultimate collection of Cognitive Analytics Strategy And Techniques Tracking Customer Data Insights Dashboard Demonstration PDF. Slidegeeks has designed a range of layouts that are perfect for representing task or activity duration, keeping track of all your deadlines at a glance. Tailor these designs to your exact needs and give them a truly corporate look with your own brand colors they will make your projects stand out from the rest.
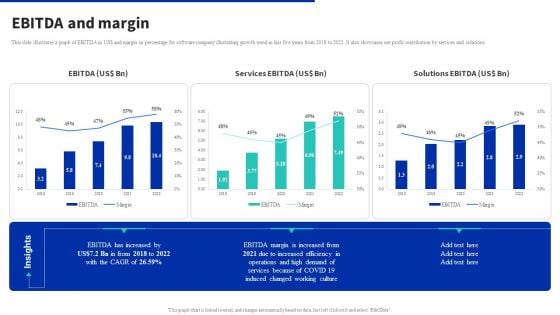
Digital Products Company Outline Ebitda And Margin Inspiration PDF
This slide illustrates a graph of EBITDA in US dollar and margin in percentage for software company illustrating growth trend in last five years from 2018 to 2022. It also showcases net profit contribution by services and solutions. Take your projects to the next level with our ultimate collection of Digital Products Company Outline Ebitda And Margin Inspiration PDF. Slidegeeks has designed a range of layouts that are perfect for representing task or activity duration, keeping track of all your deadlines at a glance. Tailor these designs to your exact needs and give them a truly corporate look with your own brand colors they will make your projects stand out from the rest.
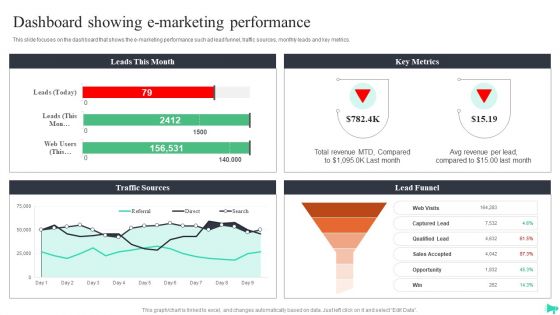
Implementing Ecommerce Marketing Services Plan Dashboard Showing E Marketing Performance Summary PDF
This slide focuses on the dashboard that shows the e marketing performance such ad lead funnel, traffic sources, monthly leads and key metrics. Take your projects to the next level with our ultimate collection of Implementing Ecommerce Marketing Services Plan Dashboard Showing E Marketing Performance Summary PDF. Slidegeeks has designed a range of layouts that are perfect for representing task or activity duration, keeping track of all your deadlines at a glance. Tailor these designs to your exact needs and give them a truly corporate look with your own brand colors they will make your projects stand out from the rest.
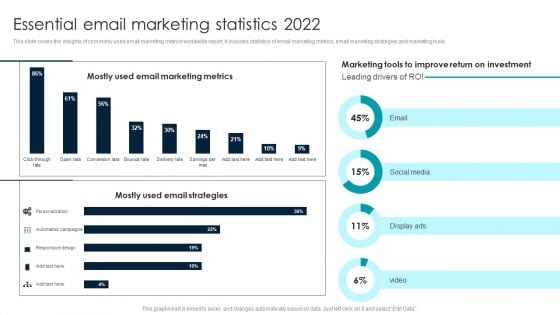
Essential Email Marketing Statistics 2022 Mockup PDF
This slide covers the insights of commonly used email marketing metrics worldwide report. It includes statistics of email marketing metrics, email marketing strategies and marketing tools. Crafting an eye catching presentation has never been more straightforward. Let your presentation shine with this tasteful yet straightforward Essential Email Marketing Statistics 2022 Mockup PDF template. It offers a minimalistic and classy look that is great for making a statement. The colors have been employed intelligently to add a bit of playfulness while still remaining professional. Construct the ideal Essential Email Marketing Statistics 2022 Mockup PDF that effortlessly grabs the attention of your audience Begin now and be certain to wow your customers.

Stock Inventory Acquisition Forecasting Demand Of Different Types Of Products Slides PDF
This slide showcases graphs that can help organization in forecasting different type of products on the basis of previous data. It showcases quarterly data of three product types. Take your projects to the next level with our ultimate collection of Stock Inventory Acquisition Forecasting Demand Of Different Types Of Products Slides PDF. Slidegeeks has designed a range of layouts that are perfect for representing task or activity duration, keeping track of all your deadlines at a glance. Tailor these designs to your exact needs and give them a truly corporate look with your own brand colors theyll make your projects stand out from the rest.
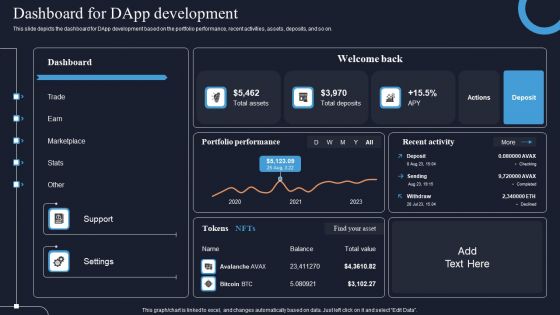
Decentralization App Development Dashboard For Dapp Development Slides PDF
This slide depicts the dashboard for DApp development based on the portfolio performance, recent activities, assets, deposits, and so on. Take your projects to the next level with our ultimate collection of Decentralization App Development Dashboard For Dapp Development Slides PDF. Slidegeeks has designed a range of layouts that are perfect for representing task or activity duration, keeping track of all your deadlines at a glance. Tailor these designs to your exact needs and give them a truly corporate look with your own brand colors they will make your projects stand out from the rest.
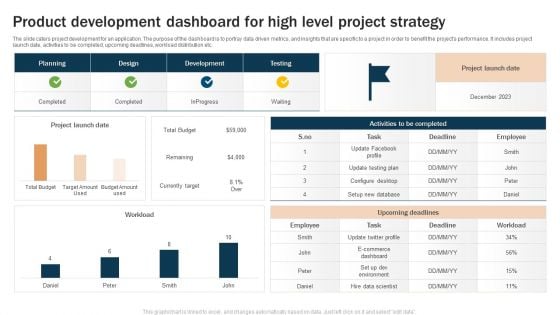
Product Development Dashboard For High Level Project Strategy Microsoft PDF
The slide caters project development for an application. The purpose of the dashboard is to portray data driven metrics, and insights that are specific to a project in order to benefit the projects performance. It includes project launch date, activities to be completed, upcoming deadlines, workload distribution etc. Showcasing this set of slides titled Product Development Dashboard For High Level Project Strategy Microsoft PDF. The topics addressed in these templates are Upcoming Deadlines, Project Launch, Upcoming Deadlines. All the content presented in this PPT design is completely editable. Download it and make adjustments in color, background, font etc. as per your unique business setting.
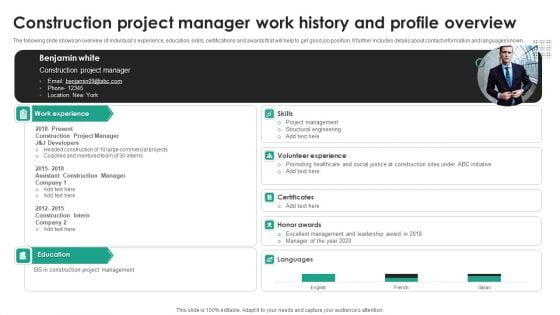
Construction Project Manager Work History And Profile Overview Information PDF
The following slide shows an overview of individuals experience, education, skills, certifications and awards that will help to get good job position. It further includes details about contact information and languages known. Pitch your topic with ease and precision using this Construction Project Manager Work History And Profile Overview Information PDF. This layout presents information on Work Experience, Education, Project Management. It is also available for immediate download and adjustment. So, changes can be made in the color, design, graphics or any other component to create a unique layout.
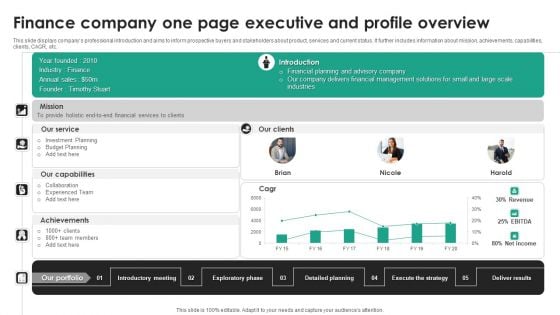
Finance Company One Page Executive And Profile Overview Inspiration PDF
This slide displays companys professional introduction and aims to inform prospective buyers and stakeholders about product, services and current status. It further includes information about mission, achievements, capabilities, clients, CAGR, etc. Pitch your topic with ease and precision using this Finance Company One Page Executive And Profile Overview Inspiration PDF. This layout presents information on Our Service, Our Capabilities, Achievements. It is also available for immediate download and adjustment. So, changes can be made in the color, design, graphics or any other component to create a unique layout.
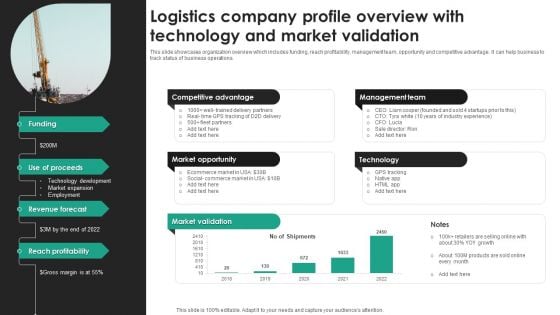
Logistics Company Profile Overview With Technology And Market Validation Demonstration PDF
This slide showcases organization overview which includes funding, reach profitability, management team, opportunity and competitive advantage. It can help business to track status of business operations. Showcasing this set of slides titled Logistics Company Profile Overview With Technology And Market Validation Demonstration PDF. The topics addressed in these templates are Competitive Advantage, Management Team, Market Opportunity, Technology. All the content presented in this PPT design is completely editable. Download it and make adjustments in color, background, font etc. as per your unique business setting.
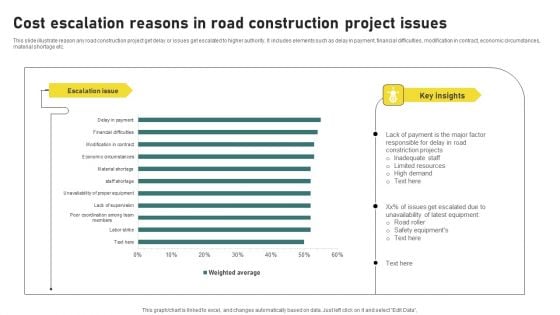
Cost Escalation Reasons In Road Construction Project Issues Information PDF
This slide illustrate reason any road construction project get delay or issues get escalated to higher authority. It includes elements such as delay in payment, financial difficulties, modification in contract, economic circumstances, material shortage etc. Showcasing this set of slides titled Cost Escalation Reasons In Road Construction Project Issues Information PDF. The topics addressed in these templates are Lack Of Payment, Delay In Road, Limited Resources. All the content presented in this PPT design is completely editable. Download it and make adjustments in color, background, font etc. as per your unique business setting.
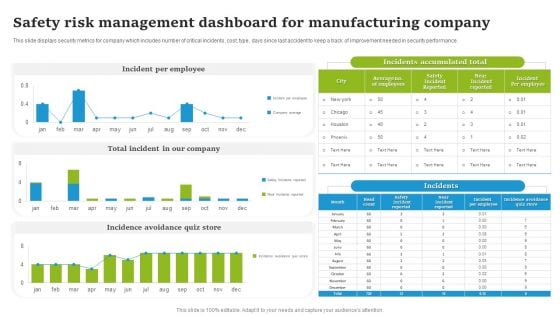
Safety Risk Management Dashboard For Manufacturing Company Introduction PDF
This slide displays security metrics for company which includes number of critical incidents, cost, type, days since last accident to keep a track of Improvement needed in security performance. Showcasing this set of slides titled Safety Risk Management Dashboard For Manufacturing Company Introduction PDF. The topics addressed in these templates are Incident Per Employee, Total Incident Our Company, Incidence Avoidance Quiz Store. All the content presented in this PPT design is completely editable. Download it and make adjustments in color, background, font etc. as per your unique business setting.
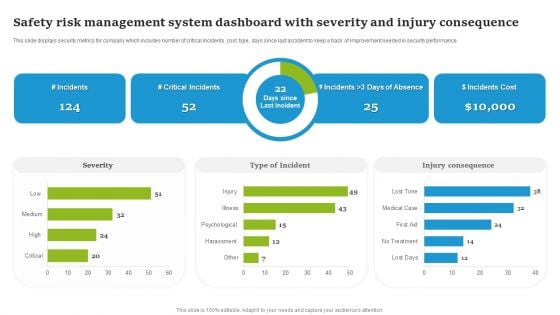
Safety Risk Management System Dashboard With Severity And Injury Consequence Clipart PDF
This slide displays security metrics for company which includes number of critical incidents, cost, type, days since last accident to keep a track of Improvement needed in security performance. Pitch your topic with ease and precision using this Safety Risk Management System Dashboard With Severity And Injury Consequence Clipart PDF. This layout presents information on Severity, Type Of Incident, Injury Consequence . It is also available for immediate download and adjustment. So, changes can be made in the color, design, graphics or any other component to create a unique layout.
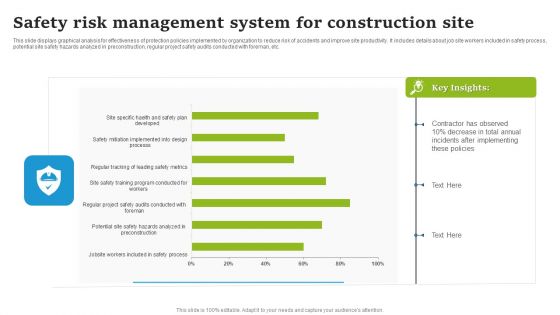
Safety Risk Management System For Construction Site Elements PDF
This slide displays graphical analysis for effectiveness of protection policies implemented by organization to reduce risk of accidents and improve site productivity. It includes details about job site workers included in safety process, potential site safety hazards analyzed in preconstruction, regular project safety audits conducted with foreman, etc. Showcasing this set of slides titled Safety Risk Management System For Construction Site Elements PDF. The topics addressed in these templates are Contractor Has Observed, Total Annual, Incidents After Implementing. All the content presented in this PPT design is completely editable. Download it and make adjustments in color, background, font etc. as per your unique business setting.
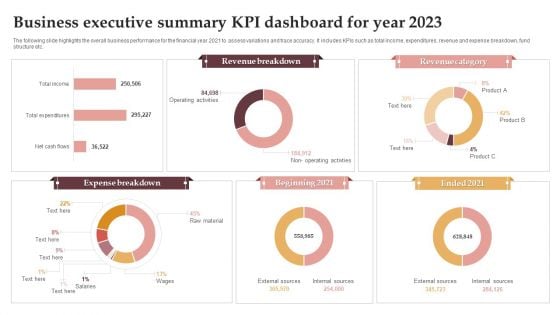
Business Executive Summary KPI Dashboard For Year 2023 Graphics PDF
The following slide highlights the overall business performance for the financial year 2021 to assess variations and trace accuracy. It includes KPIs such as total income, expenditures, revenue and expense breakdown, fund structure etc. Pitch your topic with ease and precision using this Business Executive Summary KPI Dashboard For Year 2023 Graphics PDF. This layout presents information on Revenue Breakdown, Revenue Category, Expense Breakdown. It is also available for immediate download and adjustment. So, changes can be made in the color, design, graphics or any other component to create a unique layout.
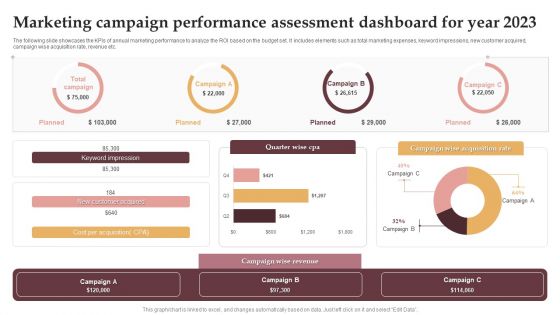
Marketing Campaign Performance Assessment Dashboard For Year 2023 Download PDF
The following slide showcases the KPIs of annual marketing performance to analyze the ROI based on the budget set. It includes elements such as total marketing expenses, keyword impressions, new customer acquired, campaign wise acquisition rate, revenue etc. Showcasing this set of slides titled Marketing Campaign Performance Assessment Dashboard For Year 2023 Download PDF. The topics addressed in these templates are Keyword Impression, New Customer Acquired, Campaign Wise Revenue. All the content presented in this PPT design is completely editable. Download it and make adjustments in color, background, font etc. as per your unique business setting.
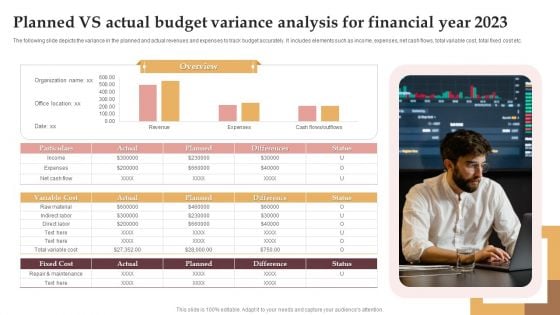
Planned Vs Actual Budget Variance Analysis For Financial Year 2023 Inspiration PDF
The following slide depicts the variance in the planned and actual revenues and expenses to track budget accurately. It includes elements such as income, expenses, net cash flows, total variable cost, total fixed cost etc. Pitch your topic with ease and precision using this Planned Vs Actual Budget Variance Analysis For Financial Year 2023 Inspiration PDF. This layout presents information on Budget Variance Analysis, Variable Cost, Fixed Cost. It is also available for immediate download and adjustment. So, changes can be made in the color, design, graphics or any other component to create a unique layout.
Tracking The Cashflow Improvements With Cash Management Dashboard Download PDF
This slide showcases the KPIs that would help our business organization to track the improvements in the new cash management process. It includes quick ratio, cash balance, current ratio, days inventory outstanding, etc.Take your projects to the next level with our ultimate collection of Tracking The Cashflow Improvements With Cash Management Dashboard Download PDF. Slidegeeks has designed a range of layouts that are perfect for representing task or activity duration, keeping track of all your deadlines at a glance. Tailor these designs to your exact needs and give them a truly corporate look with your own brand colors they all make your projects stand out from the rest.
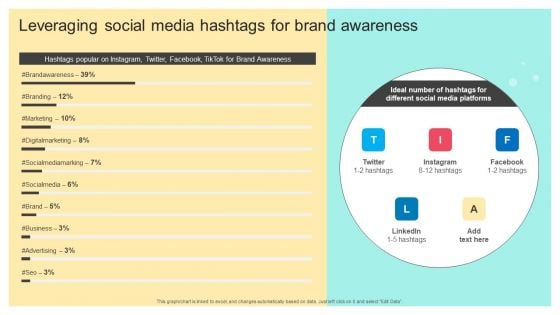
Leveraging Social Media Hashtags For Brand Awareness Online And Offline Brand Designs PDF
This Leveraging Social Media Hashtags For Brand Awareness Online And Offline Brand Designs PDF from Slidegeeks makes it easy to present information on your topic with precision. It provides customization options, so you can make changes to the colors, design, graphics, or any other component to create a unique layout. It is also available for immediate download, so you can begin using it right away. Slidegeeks has done good research to ensure that you have everything you need to make your presentation stand out. Make a name out there for a brilliant performance.
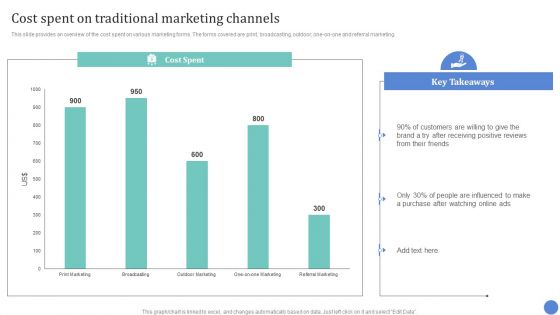
Conventional Media Channels Cost Spent On Traditional Marketing Channels Pictures PDF
This slide provides an overview of the cost spent on various marketing forms. The forms covered are print, broadcasting, outdoor, one-on-one and referral marketing. Take your projects to the next level with our ultimate collection of Conventional Media Channels Cost Spent On Traditional Marketing Channels Pictures PDF. Slidegeeks has designed a range of layouts that are perfect for representing task or activity duration, keeping track of all your deadlines at a glance. Tailor these designs to your exact needs and give them a truly corporate look with your own brand colors they will make your projects stand out from the rest.
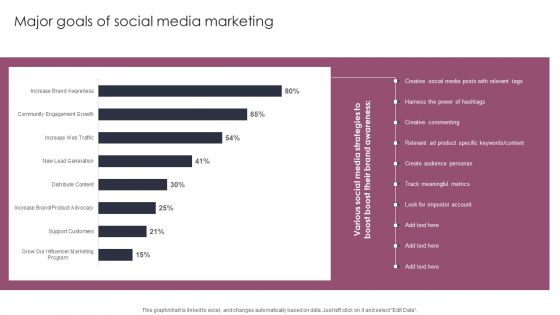
Major Goals Of Social Media Marketing Stages To Develop Demand Generation Tactics Guidelines PDF
This modern and well-arranged Major Goals Of Social Media Marketing Stages To Develop Demand Generation Tactics Guidelines PDF provides lots of creative possibilities. It is very simple to customize and edit with the Powerpoint Software. Just drag and drop your pictures into the shapes. All facets of this template can be edited with Powerpoint no extra software is necessary. Add your own material, put your images in the places assigned for them, adjust the colors, and then you can show your slides to the world, with an animated slide included.

KPI Dashboard Highlighting Marketing Campaign Results Mockup PDF
The purpose of this slide is to highlight a comprehensive dashboard which can assist the organization to evaluate the marketing campaign results. The dashboard covers information about sales performance, product performance, ecommerce conversion rate, etc. Showcasing this set of slides titled KPI Dashboard Highlighting Marketing Campaign Results Mockup PDF. The topics addressed in these templates are Sales Performance, Product Performance Analysis. All the content presented in this PPT design is completely editable. Download it and make adjustments in color, background, font etc. as per your unique business setting.
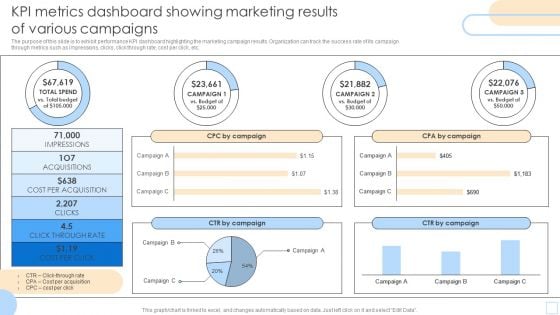
KPI Metrics Dashboard Showing Marketing Results Of Various Campaigns Pictures PDF
The purpose of this slide is to exhibit performance KPI dashboard highlighting the marketing campaign results. Organization can track the success rate of its campaign through metrics such as impressions, clicks, click through rate, cost per click, etc. Pitch your topic with ease and precision using this KPI Metrics Dashboard Showing Marketing Results Of Various Campaigns Pictures PDF. This layout presents information on Impressions, Acquisitions, CPA By Campaign. It is also available for immediate download and adjustment. So, changes can be made in the color, design, graphics or any other component to create a unique layout.
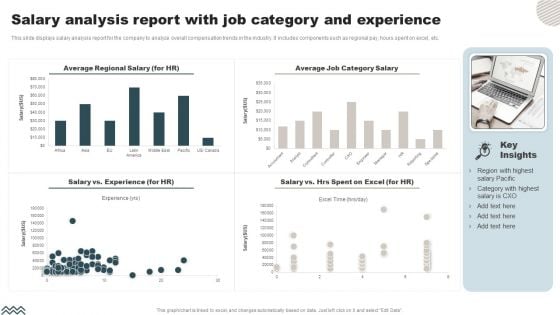
Salary Analysis Report With Job Category And Experience Microsoft PDF
This slide displays salary analysis report for the company to analyze overall compensation trends in the industry. It includes components such as regional pay, hours spent on excel, etc. Pitch your topic with ease and precision using this Salary Analysis Report With Job Category And Experience Microsoft PDF. This layout presents information on Average Regional Salary, Average Job Category Salary . It is also available for immediate download and adjustment. So, changes can be made in the color, design, graphics or any other component to create a unique layout.
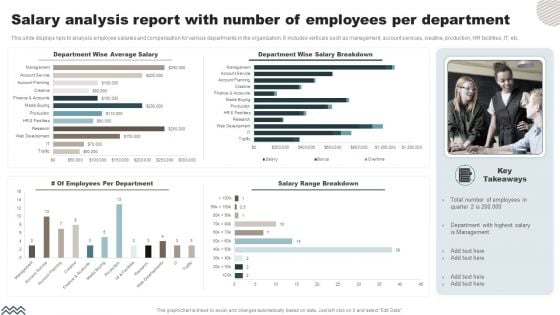
Salary Analysis Report With Number Of Employees Per Department Clipart PDF
This slide displays kpis to analysis employee salaries and compensation for various departments in the organization. It includes verticals such as management, account services, creative, production, HR facilities, IT, etc. Showcasing this set of slides titled Salary Analysis Report With Number Of Employees Per Department Clipart PDF. The topics addressed in these templates are Department Wise Average Salary, Salary Range Breakdown. All the content presented in this PPT design is completely editable. Download it and make adjustments in color, background, font etc. as per your unique business setting.
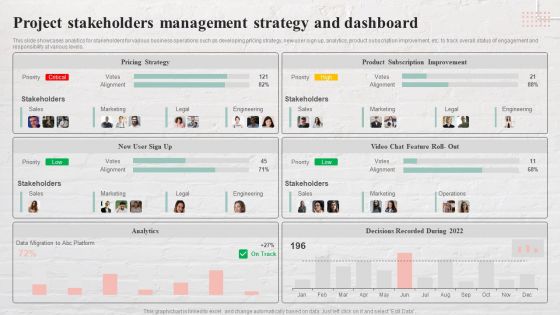
Project Stakeholders Management Strategy And Dashboard Sample PDF
This slide showcases analytics for stakeholders for various business operations such as developing pricing strategy, new user sign up, analytics, product subscription improvement, etc. to track overall status of engagement and responsibility at various levels. Pitch your topic with ease and precision using this Project Stakeholders Management Strategy And Dashboard Sample PDF. This layout presents information on Pricing Strategy, Product Subscription Improvement. It is also available for immediate download and adjustment. So, changes can be made in the color, design, graphics or any other component to create a unique layout.

Stakeholders Management Strategy With Engagement Dashboard Infographics PDF
The following slide displays key parameters to map involvement of stakeholders in the business by analyzing them on the basis of influence, interest and impact to monitor and improve overall communication strategies of organization. Pitch your topic with ease and precision using this Stakeholders Management Strategy With Engagement Dashboard Infographics PDF. This layout presents information on Influence, Interest, Impact. It is also available for immediate download and adjustment. So, changes can be made in the color, design, graphics or any other component to create a unique layout.
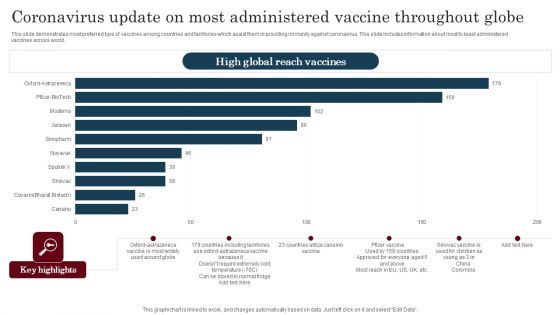
Coronavirus Update On Most Administered Vaccine Throughout Globe Mockup PDF
This slide demonstrates most preferred type of vaccines among countries and territories which assist them in providing immunity against coronavirus. This slide includes information about most to least administered vaccines across world. Pitch your topic with ease and precision using this Coronavirus Update On Most Administered Vaccine Throughout Globe Mockup PDF. This layout presents information on Coronavirus Update, Most Administered Vaccine. It is also available for immediate download and adjustment. So, changes can be made in the color, design, graphics or any other component to create a unique layout.
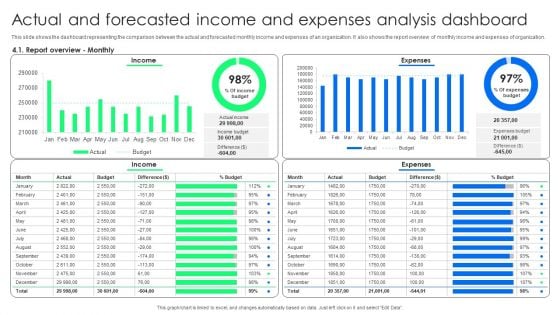
Actual And Forecasted Income And Expenses Analysis Dashboard Portrait PDF
This slide shows the dashboard representing the comparison between the actual and forecasted monthly income and expenses of an organization. It also shows the report overview of monthly income and expenses of organization. Showcasing this set of slides titled Actual And Forecasted Income And Expenses Analysis Dashboard Portrait PDF. The topics addressed in these templates are Expenses, Income, Expenses. All the content presented in this PPT design is completely editable. Download it and make adjustments in color, background, font etc. as per your unique business setting.
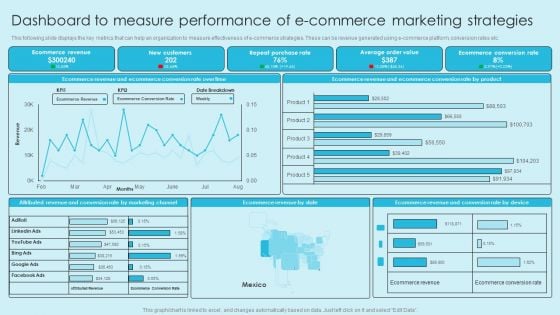
Online Marketing Techniques For Acquiring Clients Dashboard To Measure Performance Information PDF
This following slide displays the key metrics that can help an organization to measure effectiveness of social media strategies. These can be leads generated, leads by region, web traffic targets etc. Take your projects to the next level with our ultimate collection of Online Marketing Techniques For Acquiring Clients Dashboard To Measure Performance Information PDF. Slidegeeks has designed a range of layouts that are perfect for representing task or activity duration, keeping track of all your deadlines at a glance. Tailor these designs to your exact needs and give them a truly corporate look with your own brand colors they will make your projects stand out from the rest.
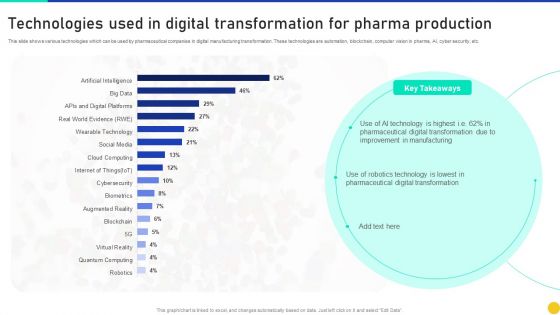
Technologies Used In Digital Transformation For Pharma Production Information PDF
This slide shows various technologies which can be used by pharmaceutical companies in digital manufacturing transformation. These technologies are automation, blockchain, computer vision in pharma, AI, cyber security, etc. Showcasing this set of slides titled Technologies Used In Digital Transformation For Pharma Production Information PDF. The topics addressed in these templates are Technologies Used Digital Transformation, Pharma Production. All the content presented in this PPT design is completely editable. Download it and make adjustments in color, background, font etc. as per your unique business setting.
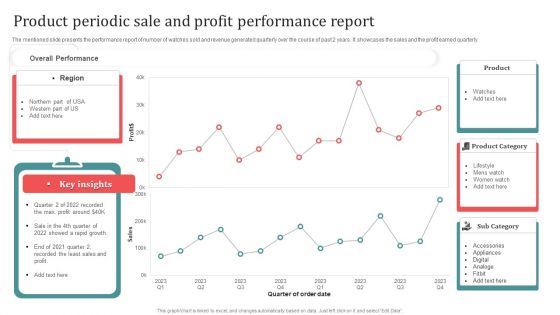
Product Periodic Sale And Profit Performance Report Topics PDF
The mentioned slide presents the performance report of number of watches sold and revenue generated quarterly over the course of past 2 years. It showcases the sales and the profit earned quarterly. Showcasing this set of slides titled Product Periodic Sale And Profit Performance Report Topics PDF. The topics addressed in these templates are Product Category, Sub Category, Product . All the content presented in this PPT design is completely editable. Download it and make adjustments in color, background, font etc. as per your unique business setting.
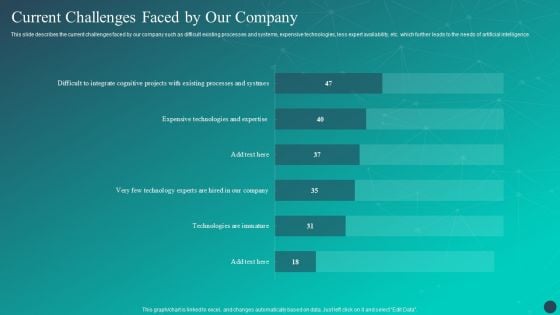
Optimizing AI Strategies To Improve Financial Services Current Challenges Faced By Our Company Introduction PDF
This slide describes the current challenges faced by our company such as difficult existing processes and systems, expensive technologies, less expert availability, etc. which further leads to the needs of artificial intelligence. Take your projects to the next level with our ultimate collection of Optimizing AI Strategies To Improve Financial Services Current Challenges Faced By Our Company Introduction PDF. Slidegeeks has designed a range of layouts that are perfect for representing task or activity duration, keeping track of all your deadlines at a glance. Tailor these designs to your exact needs and give them a truly corporate look with your own brand colors they will make your projects stand out from the rest.
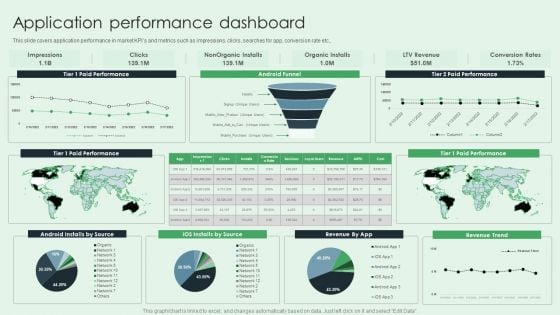
Selling App Development Launch And Marketing Application Performance Dashboard Inspiration PDF
This slide covers application performance in market KPIs and metrics such as impressions, clicks, searches for app, conversion rate etc. This Selling App Development Launch And Marketing Application Performance Dashboard Inspiration PDF from Slidegeeks makes it easy to present information on your topic with precision. It provides customization options, so you can make changes to the colors, design, graphics, or any other component to create a unique layout. It is also available for immediate download, so you can begin using it right away. Slidegeeks has done good research to ensure that you have everything you need to make your presentation stand out. Make a name out there for a brilliant performance.
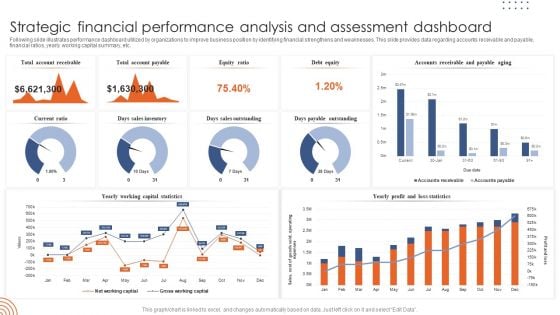
Strategic Financial Performance Analysis And Assessment Dashboard Template PDF
Following slide illustrates performance dashboard utilized by organizations to improve business position by identifying financial strengthens and weaknesses. This slide provides data regarding accounts receivable and payable, financial ratios, yearly working capital summary, etc. Showcasing this set of slides titled Strategic Financial Performance Analysis And Assessment Dashboard Template PDF. The topics addressed in these templates are Strategic Financial Performance, Analysis Assessment Dashboard. All the content presented in this PPT design is completely editable. Download it and make adjustments in color, background, font etc. as per your unique business setting.
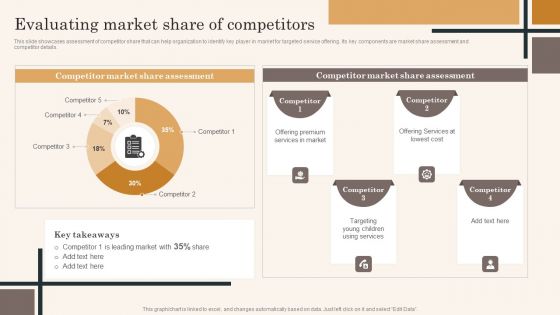
Edtech Service Launch And Promotion Plan Evaluating Market Share Of Competitors Infographics PDF
This slide showcases assessment of competitor share that can help organization to identify key player in market for targeted service offering. Its key components are market share assessment and competitor details. Take your projects to the next level with our ultimate collection of Edtech Service Launch And Promotion Plan Evaluating Market Share Of Competitors Infographics PDF. Slidegeeks has designed a range of layouts that are perfect for representing task or activity duration, keeping track of all your deadlines at a glance. Tailor these designs to your exact needs and give them a truly corporate look with your own brand colors they will make your projects stand out from the rest.
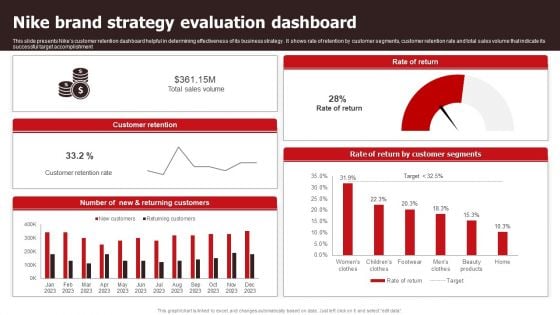
Nike Brand Strategy Evaluation Dashboard Sample PDF
This slide presents Nikes customer retention dashboard helpful in determining effectiveness of its business strategy . It shows rate of retention by customer segments, customer retention rate and total sales volume that indicate its successful target accomplishment. Showcasing this set of slides titled Nike Brand Strategy Evaluation Dashboard Sample PDF. The topics addressed in these templates are Sales Volume, Customer Retention Rate . All the content presented in this PPT design is completely editable. Download it and make adjustments in color, background, font etc. as per your unique business setting.
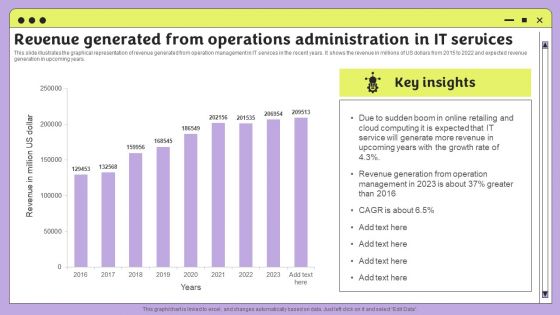
Revenue Generated From Operations Administration In It Services Infographics PDF
This slide illustrates the graphical representation of revenue generated from operation management in IT services in the recent years. It shows the revenue in millions of US dollars from 2015 to 2022 and expected revenue generation in upcoming years. Pitch your topic with ease and precision using this Revenue Generated From Operations Administration In It Services Infographics PDF. This layout presents information on Revenue, Management, Cloud Computing. It is also available for immediate download and adjustment. So, changes can be made in the color, design, graphics or any other component to create a unique layout.
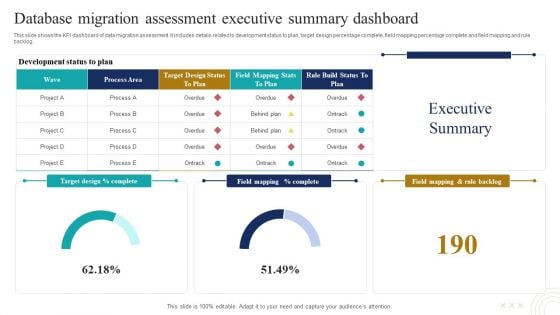
Database Migration Assessment Executive Summary Dashboard Mockup PDF
This slide shows the KPI dashboard of data migration assessment. It includes details related to development status to plan, target design percentage complete, field mapping percentage complete and field mapping and rule backlog. Pitch your topic with ease and precision using this Database Migration Assessment Executive Summary Dashboard Mockup PDF. This layout presents information on Wave, Process Area, Rule Build Status Plan. It is also available for immediate download and adjustment. So, changes can be made in the color, design, graphics or any other component to create a unique layout
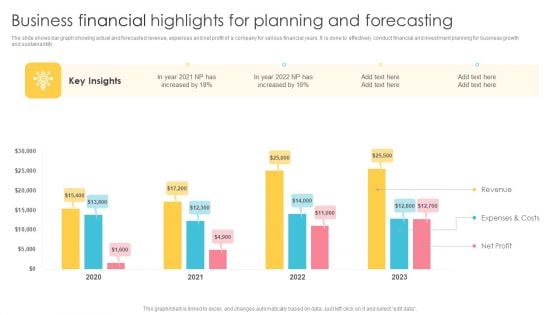
Business Financial Highlights For Planning And Forecasting Background PDF
The slide shows bar graph showing actual and forecasted revenue, expenses and net profit of a company for various financial years. It is done to effectively conduct financial and investment planning for business growth and sustainability. Pitch your topic with ease and precision using this Business Financial Highlights For Planning And Forecasting Background PDF. This layout presents information on Revenue, Expenses And Costs, Net Profit. It is also available for immediate download and adjustment. So, changes can be made in the color, design, graphics or any other component to create a unique layout.
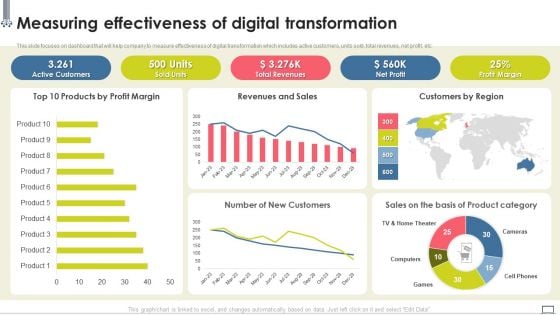
Change Management Strategy Measuring Effectiveness Of Digital Transformation Summary PDF
This slide focuses on dashboard that will help company to measure effectiveness of digital transformation which includes active customers, units sold, total revenues, net profit, etc. This modern and well-arranged Change Management Strategy Measuring Effectiveness Of Digital Transformation Summary PDF provides lots of creative possibilities. It is very simple to customize and edit with the Powerpoint Software. Just drag and drop your pictures into the shapes. All facets of this template can be edited with Powerpoint, no extra software is necessary. Add your own material, put your images in the places assigned for them, adjust the colors, and then you can show your slides to the world, with an animated slide included.
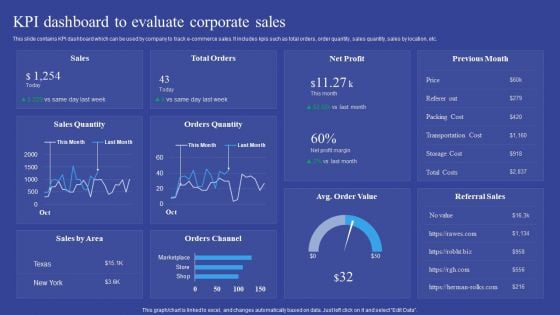
KPI Dashboard To Evaluate Corporate Sales Introduction PDF
This slide contains KPI dashboard which can be used by company to track e-commerce sales. It includes kpis such as total orders, order quantity, sales quantity, sales by location, etc. Pitch your topic with ease and precision using this KPI Dashboard To Evaluate Corporate Sales Introduction PDF. This layout presents information on KPI Dashboard, Evaluate Corporate Sales. It is also available for immediate download and adjustment. So, changes can be made in the color, design, graphics or any other component to create a unique layout.
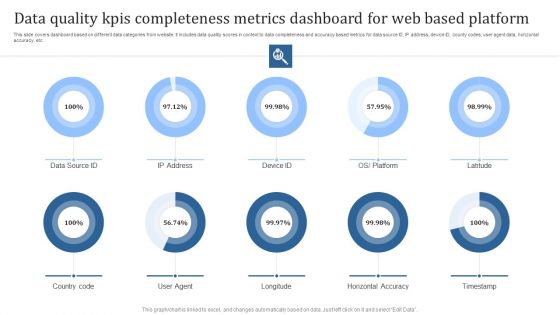
Data Quality Kpis Completeness Metrics Dashboard For Web Based Platform Graphics PDF
This slide covers dashboard based on different data categories from website. It includes data quality scores in context to data completeness and accuracy based metrics for data source ID, IP address, device ID, county codes, user agent data, horizontal accuracy, etc. Pitch your topic with ease and precision using this Data Quality Kpis Completeness Metrics Dashboard For Web Based Platform Graphics PDF. This layout presents information on Country Code, User Agent, Longitude. It is also available for immediate download and adjustment. So, changes can be made in the color, design, graphics or any other component to create a unique layout.
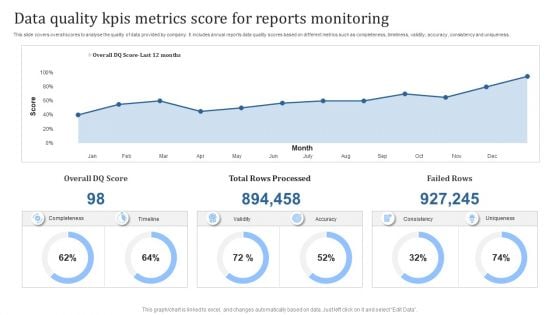
Data Quality Kpis Metrics Score For Reports Monitoring Download PDF
This slide covers overall scores to analyse the quality of data provided by company. It includes annual reports data quality scores based on different metrics such as completeness, timeliness, validity, accuracy, consistency and uniqueness. Showcasing this set of slides titled Data Quality Kpis Metrics Score For Reports Monitoring Download PDF. The topics addressed in these templates are Total Rows Processed, Failed Rows. All the content presented in this PPT design is completely editable. Download it and make adjustments in color, background, font etc. as per your unique business setting.
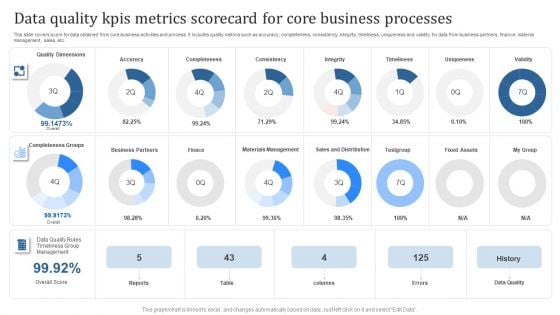
Data Quality Kpis Metrics Scorecard For Core Business Processes Topics PDF
This slide covers score for data obtained from core business activities and process. It includes quality metrics such as accuracy, completeness, consistency, integrity, timeliness, uniqueness and validity for data from business partners, finance, material management, sales, etc. Showcasing this set of slides titled Data Quality Kpis Metrics Scorecard For Core Business Processes Topics PDF. The topics addressed in these templates are Data Quality, Errors, Reports. All the content presented in this PPT design is completely editable. Download it and make adjustments in color, background, font etc. as per your unique business setting.
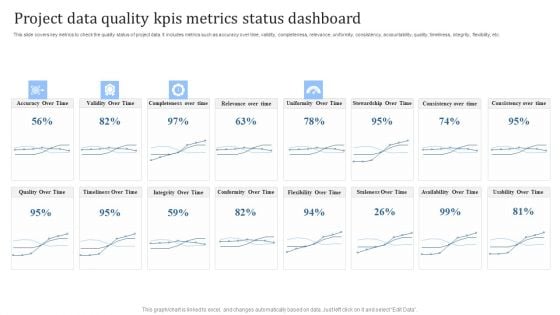
Project Data Quality Kpis Metrics Status Dashboard Designs PDF
This slide covers key metrics to check the quality status of project data. It includes metrics such as accuracy over time, validity, completeness, relevance, uniformity, consistency, accountability, quality, timeliness, integrity, flexibility, etc. Pitch your topic with ease and precision using this Project Data Quality Kpis Metrics Status Dashboard Designs PDF. This layout presents information on Accuracy Over Time, Validity Over Time. It is also available for immediate download and adjustment. So, changes can be made in the color, design, graphics or any other component to create a unique layout.
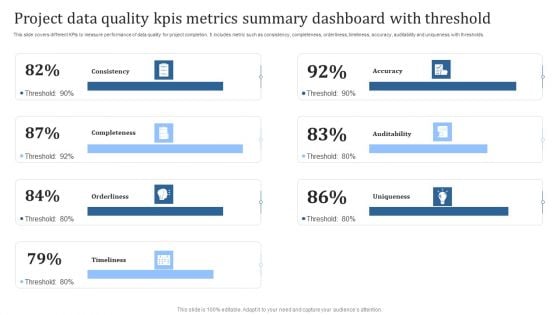
Project Data Quality Kpis Metrics Summary Dashboard With Threshold Guidelines PDF
This slide covers different KPIs to measure performance of data quality for project completion. It includes metric such as consistency, completeness, orderliness, timeliness, accuracy, auditability and uniqueness with thresholds. Pitch your topic with ease and precision using this Project Data Quality Kpis Metrics Summary Dashboard With Threshold Guidelines PDF. This layout presents information on Consistency, Completeness, Orderliness. It is also available for immediate download and adjustment. So, changes can be made in the color, design, graphics or any other component to create a unique layout.
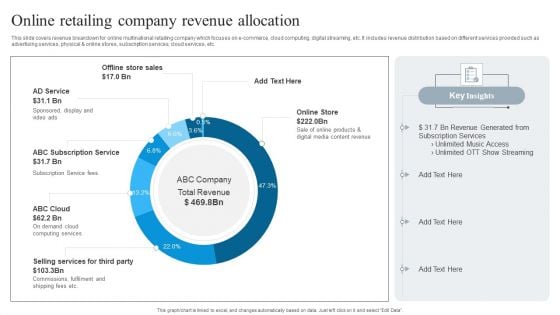
Online Retailing Company Revenue Allocation Rules PDF
This slide covers revenue breakdown for online multinational retailing company which focuses on e-commerce, cloud computing, digital streaming, etc. It includes revenue distribution based on different services provided such as advertising services, physical and online stores, subscription services, cloud services, etc. bShowcasing this set of slides titled Online Retailing Company Revenue Allocation Rules PDF. The topics addressed in these templates are Online Retailing, Company Revenue Allocation. All the content presented in this PPT design is completely editable. Download it and make adjustments in color, background, font etc. as per your unique business setting.
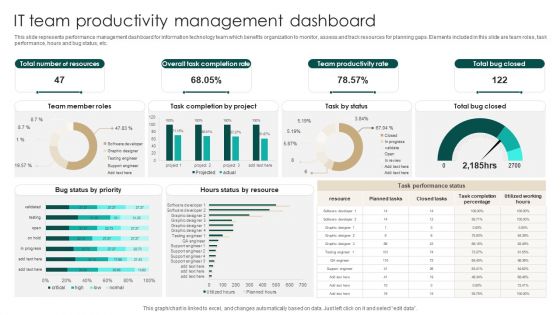
IT Team Productivity Management Dashboard Introduction PDF
This slide represents performance management dashboard for information technology team which benefits organization to monitor, assess and track resources for planning gaps. Elements included in this slide are team roles, task performance, hours and bug status, etc. Pitch your topic with ease and precision using this IT Team Productivity Management Dashboard Introduction PDF. This layout presents information on Total Number Resources, Overall Task Completion Rate, Team Productivity Rate. It is also available for immediate download and adjustment. So, changes can be made in the color, design, graphics or any other component to create a unique layout.
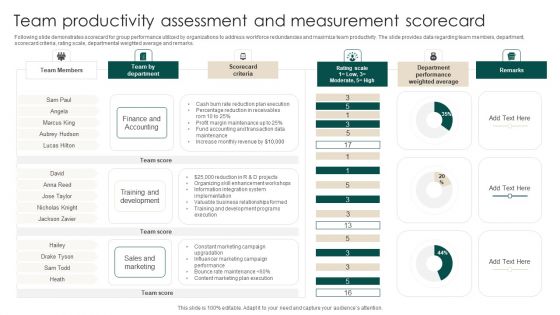
Team Productivity Assessment And Measurement Scorecard Introduction PDF
Following slide demonstrates scorecard for group performance utilized by organizations to address workforce redundancies and maximize team productivity. The slide provides data regarding team members, department, scorecard criteria, rating scale, departmental weighted average and remarks. Showcasing this set of slides titled Team Productivity Assessment And Measurement Scorecard Introduction PDF. The topics addressed in these templates are Finance And Accounting, Training And Development. All the content presented in this PPT design is completely editable. Download it and make adjustments in color, background, font etc. as per your unique business setting.

 Home
Home