Operating Budget
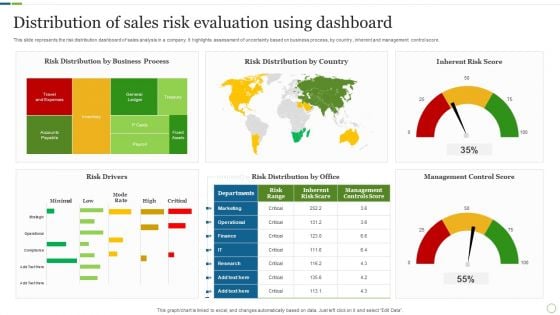
Distribution Of Sales Risk Evaluation Using Dashboard Brochure PDF
This slide represents the risk distribution dashboard of sales analysis in a company. It highlights assessment of uncertainty based on business process, by country , inherent and management control score. Showcasing this set of slides titled Distribution Of Sales Risk Evaluation Using Dashboard Brochure PDF. The topics addressed in these templates are Risk Drivers, Management Control Score, Inherent Risk Score. All the content presented in this PPT design is completely editable. Download it and make adjustments in color, background, font etc. as per your unique business setting.

Graph Indicating Clinical Trial Phases Probability Of Success Medical Research Phases For Clinical Tests Graphics PDF
This slide compares and visually presents the success rate of each stage with preceding one of the clinical research procedures to represent the achievement of the drug efficacy objective of the firm. There are so many reasons you need a Graph Indicating Clinical Trial Phases Probability Of Success Medical Research Phases For Clinical Tests Graphics PDF. The first reason is you can not spend time making everything from scratch, Thus, Slidegeeks has made presentation templates for you too. You can easily download these templates from our website easily.
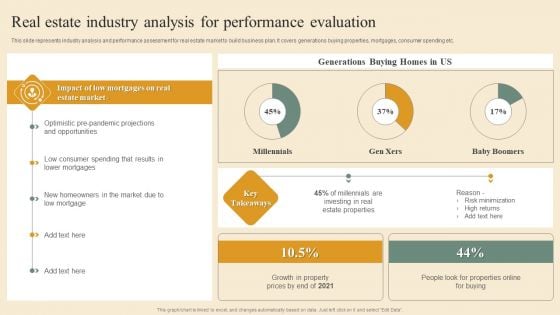
Deploying House Flipping Business Plan Real Estate Industry Analysis For Performance Evaluation Inspiration PDF
This slide represents industry analysis and performance assessment for real estate market to build business plan. It covers generations buying properties, mortgages, consumer spending etc. From laying roadmaps to briefing everything in detail, our templates are perfect for you. You can set the stage with your presentation slides. All you have to do is download these easy to edit and customizable templates. Deploying House Flipping Business Plan Real Estate Industry Analysis For Performance Evaluation Inspiration PDF will help you deliver an outstanding performance that everyone would remember and praise you for. Do download this presentation today.
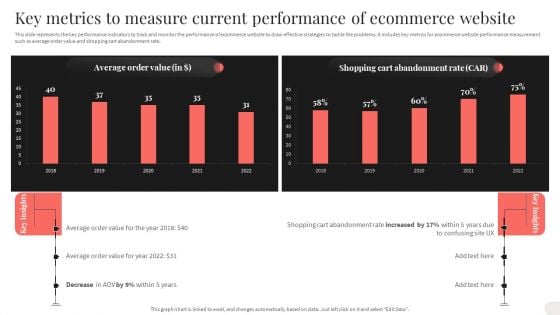
Key Metrics To Measure Current Performance Of Ecommerce Website Structure PDF
This slide represents the key performance indicators to track and monitor the performance of ecommerce website to draw effective strategies to tackle the problems. It includes key metrics for ecommerce website performance measurement such as average order value and shopping cart abandonment rate. There are so many reasons you need a Key Metrics To Measure Current Performance Of Ecommerce Website Structure PDF. The first reason is you can not spend time making everything from scratch, Thus, Slidegeeks has made presentation templates for you too. You can easily download these templates from our website easily.
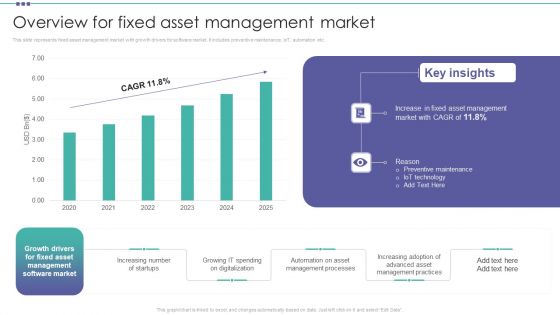
Overview For Fixed Asset Management Market Organization Physical Assets Portrait PDF
This slide represents fixed asset management market with growth drivers for software market. It includes preventive maintenance, IoT, automation etc.This Overview For Fixed Asset Management Market Organization Physical Assets Portrait PDF from Slidegeeks makes it easy to present information on your topic with precision. It provides customization options, so you can make changes to the colors, design, graphics, or any other component to create a unique layout. It is also available for immediate download, so you can begin using it right away. Slidegeeks has done good research to ensure that you have everything you need to make your presentation stand out. Make a name out there for a brilliant performance.
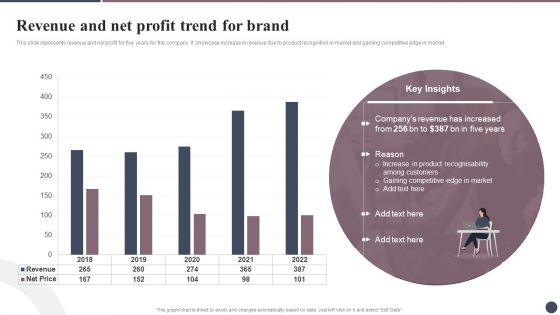
Expanding Target Audience With Cultural Branding Revenue And Net Profit Trend For Brand Clipart PDF
This slide represents revenue and net profit for five years for the company. It showcase increase in revenue due to product recognition in market and gaining competitive edge in market. Want to ace your presentation in front of a live audience Our Expanding Target Audience With Cultural Branding Revenue And Net Profit Trend For Brand Clipart PDF can help you do that by engaging all the users towards you.. Slidegeeks experts have put their efforts and expertise into creating these impeccable powerpoint presentations so that you can communicate your ideas clearly. Moreover, all the templates are customizable, and easy-to-edit and downloadable. Use these for both personal and commercial use.
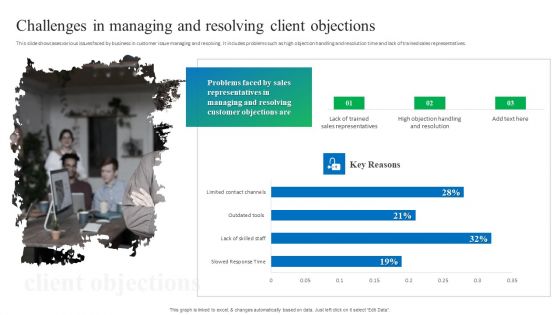
Process Enhancement Plan To Boost Sales Performance Challenges In Managing And Resolving Client Objections Themes PDF
This slide showcases various issues faced by business in customer issue managing and resolving. It includes problems such as high objection handling and resolution time and lack of trained sales representatives. Find a pre designed and impeccable Process Enhancement Plan To Boost Sales Performance Challenges In Managing And Resolving Client Objections Themes PDF. The templates can ace your presentation without additional effort. You can download these easy to edit presentation templates to make your presentation stand out from others. So, what are you waiting for Download the template from Slidegeeks today and give a unique touch to your presentation.
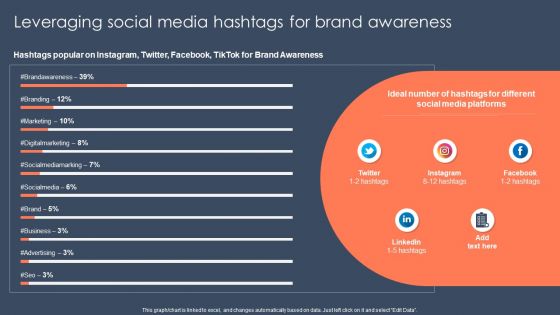
Strategic Promotion Guide To Boost Customer Brand Awareness Leveraging Social Media Hashtags For Brand Awareness Diagrams PDF
Do you have to make sure that everyone on your team knows about any specific topic I yes, then you should give Strategic Promotion Guide To Boost Customer Brand Awareness Leveraging Social Media Hashtags For Brand Awareness Diagrams PDF a try. Our experts have put a lot of knowledge and effort into creating this impeccable Strategic Promotion Guide To Boost Customer Brand Awareness Leveraging Social Media Hashtags For Brand Awareness Diagrams PDF. You can use this template for your upcoming presentations, as the slides are perfect to represent even the tiniest detail. You can download these templates from the Slidegeeks website and these are easy to edit. So grab these today.
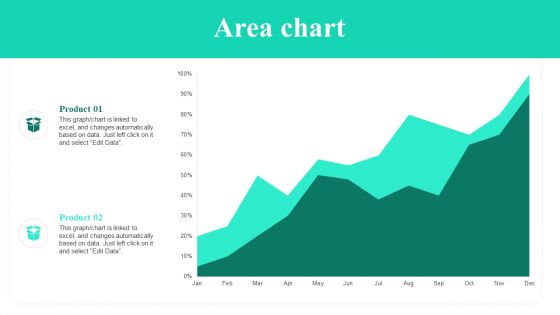
Adopting Flexible Work Policy Area Chart Ppt PowerPoint Presentation File Slideshow PDF
Do you have to make sure that everyone on your team knows about any specific topic I yes, then you should give Adopting Flexible Work Policy Area Chart Ppt PowerPoint Presentation File Slideshow PDF a try. Our experts have put a lot of knowledge and effort into creating this impeccable Adopting Flexible Work Policy Area Chart Ppt PowerPoint Presentation File Slideshow PDF. You can use this template for your upcoming presentations, as the slides are perfect to represent even the tiniest detail. You can download these templates from the Slidegeeks website and these are easy to edit. So grab these today.
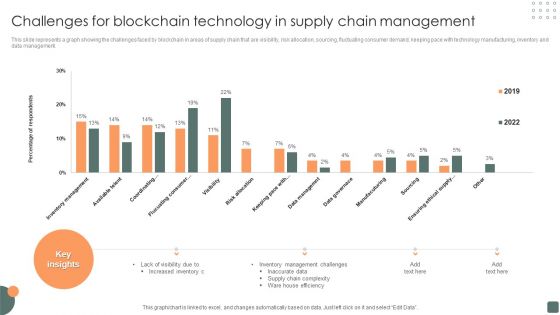
Challenges For Blockchain Technology In Supply Chain Management Demonstration PDF
This slide represents a graph showing the challenges faced by blockchain in areas of supply chain that are visibility, risk allocation, sourcing, fluctuating consumer demand, keeping pace with technology manufacturing, inventory and data management. Showcasing this set of slides titled Challenges For Blockchain Technology In Supply Chain Management Demonstration PDF. The topics addressed in these templates are Inventory Management Challenges, Supply Chain Complexity. All the content presented in this PPT design is completely editable. Download it and make adjustments in color, background, font etc. as per your unique business setting.
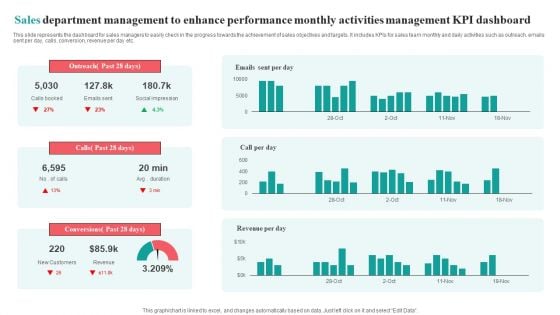
Sales Department Management To Enhance Performance Monthly Activities Management KPI Dashboard Brochure PDF
This slide represents the dashboard for sales managers to easily check in the progress towards the achievement of sales objectives and targets. It includes KPIs for sales team monthly and daily activities such as outreach, emails sent per day, calls, conversion, revenue per day etc.Pitch your topic with ease and precision using this Sales Department Management To Enhance Performance Monthly Activities Management KPI Dashboard Brochure PDF. This layout presents information on Social Impression, Conversions Past, Outreach Past. It is also available for immediate download and adjustment. So, changes can be made in the color, design, graphics or any other component to create a unique layout.
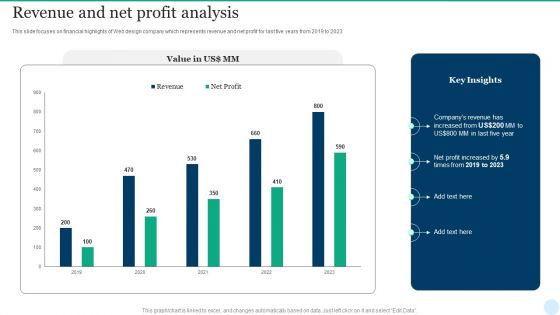
Web Interface Development Services Company Summary Revenue And Net Profit Analysis Slides PDF
This slide focuses on financial highlights of Web design company which represents revenue and net profit for last five years from 2019 to 2023. The Web Interface Development Services Company Summary Revenue And Net Profit Analysis Slides PDF is a compilation of the most recent design trends as a series of slides. It is suitable for any subject or industry presentation, containing attractive visuals and photo spots for businesses to clearly express their messages. This template contains a variety of slides for the user to input data, such as structures to contrast two elements, bullet points, and slides for written information. Slidegeeks is prepared to create an impression.
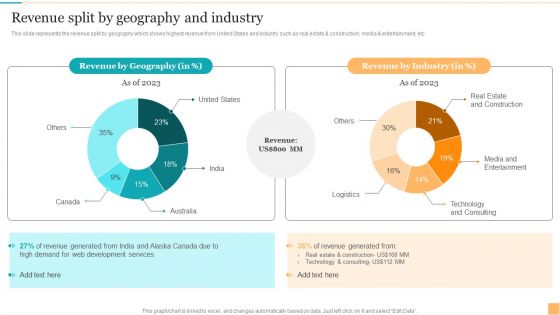
Website Design And Branding Studio Company Profile Revenue Split By Geography And Industry Guidelines PDF
This slide represents the revenue split by geography which shows highest revenue from United States and industry such as real estate and construction, media and entertainment, etc. The Website Design And Branding Studio Company Profile Revenue Split By Geography And Industry Guidelines PDF is a compilation of the most recent design trends as a series of slides. It is suitable for any subject or industry presentation, containing attractive visuals and photo spots for businesses to clearly express their messages. This template contains a variety of slides for the user to input data, such as structures to contrast two elements, bullet points, and slides for written information. Slidegeeks is prepared to create an impression.
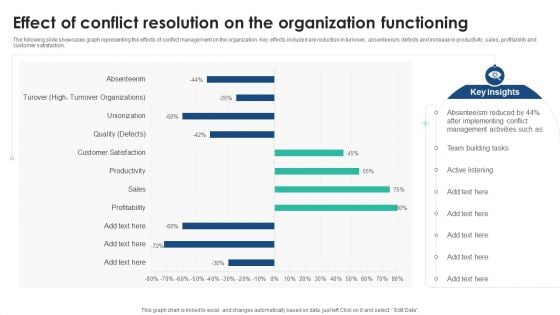
Effect Of Conflict Resolution On The Organization Functioning Pictures PDF
The following slide showcases graph representing the effects of conflict management on the organization. Key effects included are reduction in turnover, absenteeism, defects and increase in productivity, sales, profitability and customer satisfaction. Showcasing this set of slides titled Effect Of Conflict Resolution On The Organization Functioning Topics PDF. The topics addressed in these templates areEffect Of Conflict Resolution On The Organization Functioning Pictures PDF. All the content presented in this PPT design is completely editable. Download it and make adjustments in color, background, font etc. as per your unique business setting.
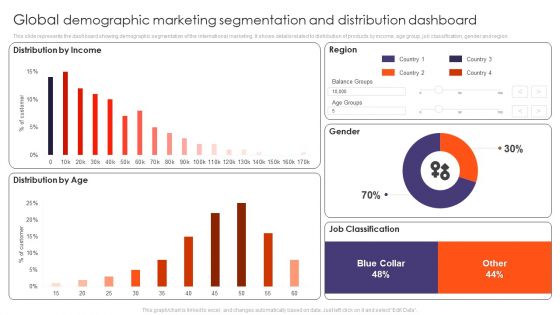
Global Demographic Marketing Segmentation And Distribution Dashboard Ppt Gallery Tips PDF
This slide represents the dashboard showing demographic segmentation of the international marketing. It shows details related to distribution of products by income, age group, job classification, gender and region. Pitch your topic with ease and precision using this Global Demographic Marketing Segmentation And Distribution Dashboard Ppt Gallery Tips PDF. This layout presents information on Distribution Income, Distribution Age, Region, Gender, Job Classification. It is also available for immediate download and adjustment. So, changes can be made in the color, design, graphics or any other component to create a unique layout.
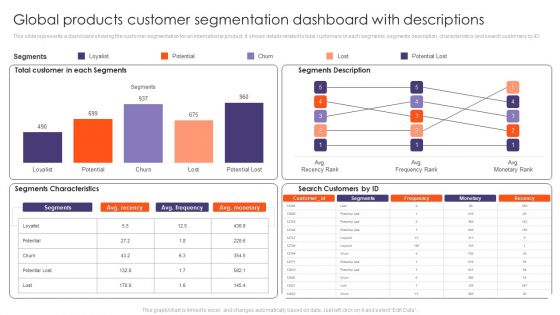
Global Products Customer Segmentation Dashboard With Descriptions Ppt Styles Template PDF
This slide represents a dashboard showing the customer segmentation for an international product. It shows details related to total customers in each segments, segments description, characteristics and search customers by ID. Showcasing this set of slides titled Global Products Customer Segmentation Dashboard With Descriptions Ppt Styles Template PDF. The topics addressed in these templates are Total Customer, Each Segments, Segments Description, Search Customers. All the content presented in this PPT design is completely editable. Download it and make adjustments in color, background, font etc. as per your unique business setting.
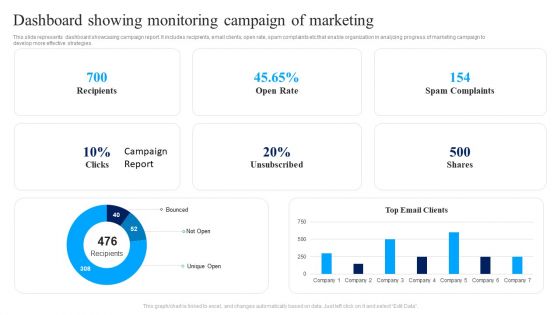
Dashboard Showing Monitoring Campaign Of Marketing Ppt Infographics PDF
This slide represents dashboard showcasing campaign report. It includes recipients, email clients, open rate, spam complaints etc that enable organization in analyzing progress of marketing campaign to develop more effective strategies. Showcasing this set of slides titled Dashboard Showing Monitoring Campaign Of Marketing Ppt Infographics PDF. The topics addressed in these templates are Recipients, Open Rate, Spam Complaints, Shares. All the content presented in this PPT design is completely editable. Download it and make adjustments in color, background, font etc. as per your unique business setting.
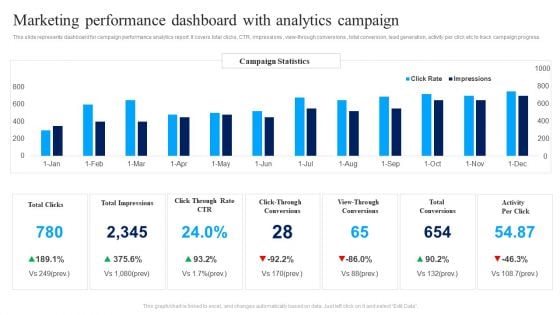
Marketing Performance Dashboard With Analytics Campaign Ppt Infographics Background Images PDF
This slide represents dashboard for campaign performance analytics report. It covers total clicks, CTR, impressions , view-through conversions , total conversion, lead generation, activity per click etc to track campaign progress. Showcasing this set of slides titled Marketing Performance Dashboard With Analytics Campaign Ppt Infographics Background Images PDF. The topics addressed in these templates are Total Clicks, Total Impressions, Total Conversions, Activity Per Click. All the content presented in this PPT design is completely editable. Download it and make adjustments in color, background, font etc. as per your unique business setting.
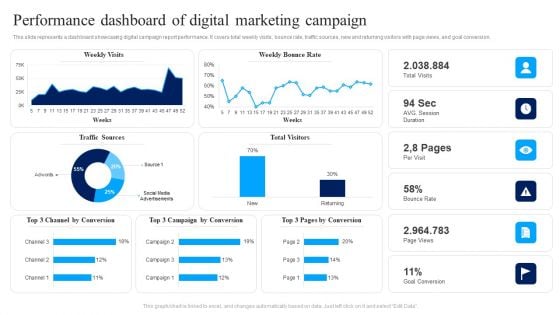
Performance Dashboard Of Digital Marketing Campaign Ppt Show Slide PDF
This slide represents a dashboard showcasing digital campaign report performance. It covers total weekly visits, bounce rate, traffic sources, new and returning visitors with page views, and goal conversion. Pitch your topic with ease and precision using this Performance Dashboard Of Digital Marketing Campaign Ppt Show Slide PDF. This layout presents information on Weekly Visits, Weekly Bounce Rate, Bounce Rate. It is also available for immediate download and adjustment. So, changes can be made in the color, design, graphics or any other component to create a unique layout.
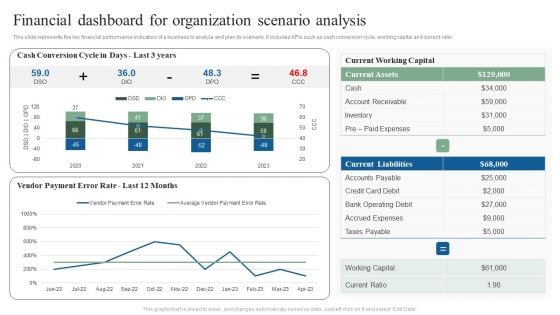
Financial Dashboard For Organization Scenario Analysis Ppt Show Ideas PDF
This slide represents the key financial performance indicators of a business to analyze and plan its scenario. It includes KPIs such as cash conversion cycle, working capital and current ratio. Showcasing this set of slides titled Financial Dashboard For Organization Scenario Analysis Ppt Show Ideas PDF. The topics addressed in these templates are Current Working Capital, Current Liabilities, Current Assets. All the content presented in this PPT design is completely editable. Download it and make adjustments in color, background, font etc. as per your unique business setting.
You Tube Advertising Campaign Performance Analytics Dashboard Ppt Icon Diagrams PDF
This slide represents dashboard showing analytics of performance of you tube marketing campaign. It includes data related to no. of visitors, qualified leads, customers and annual recurring revenue, lifetime value, gross volume etc generated through the campaign. Showcasing this set of slides titled You Tube Advertising Campaign Performance Analytics Dashboard Ppt Icon Diagrams PDF. The topics addressed in these templates are Monthly Recurring Revenue, Bounce Rate, Customer Churn Rate. All the content presented in this PPT design is completely editable. Download it and make adjustments in color, background, font etc. as per your unique business setting.
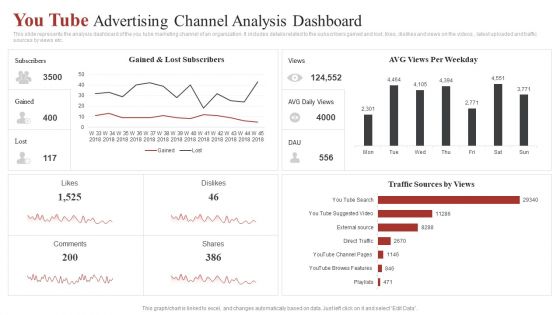
You Tube Advertising Channel Analysis Dashboard Ppt Gallery Clipart Images PDF
This slide represents the analysis dashboard of the you tube marketing channel of an organization. It includes details related to the subscribers gained and lost, likes, dislikes and views on the videos , latest uploaded and traffic sources by views etc. Pitch your topic with ease and precision using this You Tube Advertising Channel Analysis Dashboard Ppt Gallery Clipart Images PDF. This layout presents information on AVG Views, Per Weekday, Traffic Sources Views . It is also available for immediate download and adjustment. So, changes can be made in the color, design, graphics or any other component to create a unique layout.
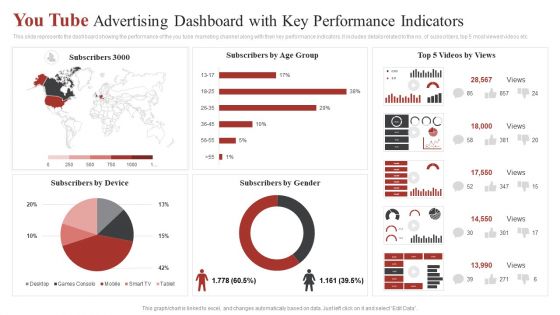
You Tube Advertising Dashboard With Key Performance Indicators Ppt Outline Graphics Example PDF
This slide represents the dashboard showing the performance of the you tube marketing channel along with their key performance indicators. It includes details related to the no. of subscribers, top 5 most viewed videos etc. Showcasing this set of slides titled You Tube Advertising Dashboard With Key Performance Indicators Ppt Outline Graphics Example PDF. The topics addressed in these templates are Subscribers Gender, Subscribers Age Group, Top 5 Videos. All the content presented in this PPT design is completely editable. Download it and make adjustments in color, background, font etc. as per your unique business setting.
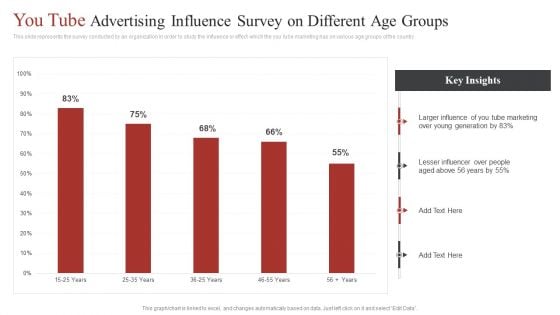
You Tube Advertising Influence Survey On Different Age Groups Ppt Diagram Ppt PDF
This slide represents the survey conducted by an organization in order to study the influence or effect which the you tube marketing has on various age groups of the country. Pitch your topic with ease and precision using this You Tube Advertising Influence Survey On Different Age Groups Ppt Diagram Ppt PDF. This layout presents information on Larger Influence, You Tube Marketing, Young Generation. It is also available for immediate download and adjustment. So, changes can be made in the color, design, graphics or any other component to create a unique layout.
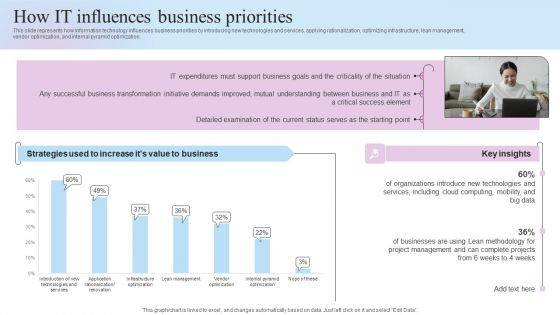
IT Business Alignment Framework How IT Influences Business Priorities Information PDF
This slide represents how information technology influences business priorities by introducing new technologies and services, applying rationalization, optimizing infrastructure, lean management, vendor optimization, and internal pyramid optimization.Find a pre-designed and impeccable IT Business Alignment Framework How IT Influences Business Priorities Information PDF. The templates can ace your presentation without additional effort. You can download these easy-to-edit presentation templates to make your presentation stand out from others. So, what are you waiting for Download the template from Slidegeeks today and give a unique touch to your presentation.
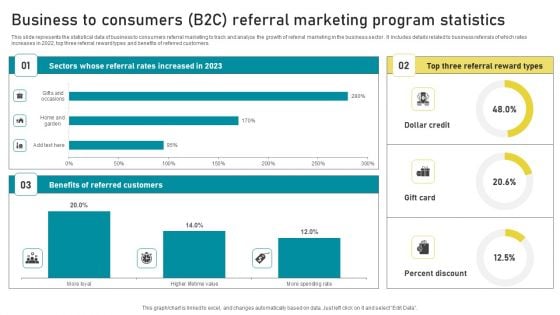
Business To Consumers B2C Referral Marketing Program Statistics Information PDF
This slide represents the statistical data of business to consumers referral marketing to track and analyze the growth of referral marketing in the business sector . It includes details related to business referrals of which rates increases in 2022, top three referral reward types and benefits of referred customers. Pitch your topic with ease and precision using this Business To Consumers B2C Referral Marketing Program Statistics Information PDF. This layout presents information on Top Three Referral, Reward Types, Dollar Credit, Percent Discount, Gift Card. It is also available for immediate download and adjustment. So, changes can be made in the color, design, graphics or any other component to create a unique layout.
Sales L2RM System Tracking Key Metrics Dashboard Ppt Professional Format Ideas PDF
This slide represents the dashboard for tracking the key performance indicators of sales lead to revenue management. It includes key metrics such as leads by campaign, ratings, lead generation rate, top accounts by revenue and top owners by number of accounts. Showcasing this set of slides titled Sales L2RM System Tracking Key Metrics Dashboard Ppt Professional Format Ideas PDF. The topics addressed in these templates are Leads By Campaign, Leads By Rating, Leads Generation Rate. All the content presented in this PPT design is completely editable. Download it and make adjustments in color, background, font etc. as per your unique business setting.
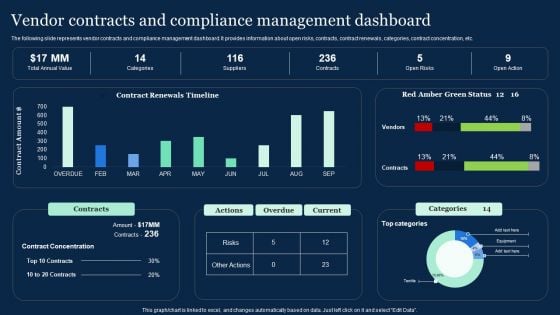
Vendor Contracts And Compliance Management Dashboard Effective Vendor Management For Enhancing Download PDF
The following slide represents vendor contracts and compliance management dashboard. It provides information about open risks, contracts, contract renewals, categories, contract concentration, etc. Get a simple yet stunning designed Vendor Contracts And Compliance Management Dashboard Effective Vendor Management For Enhancing Download PDF. It is the best one to establish the tone in your meetings. It is an excellent way to make your presentations highly effective. So, download this PPT today from Slidegeeks and see the positive impacts. Our easy-to-edit Vendor Contracts And Compliance Management Dashboard Effective Vendor Management For Enhancing Download PDF can be your go-to option for all upcoming conferences and meetings. So, what are you waiting for Grab this template today.
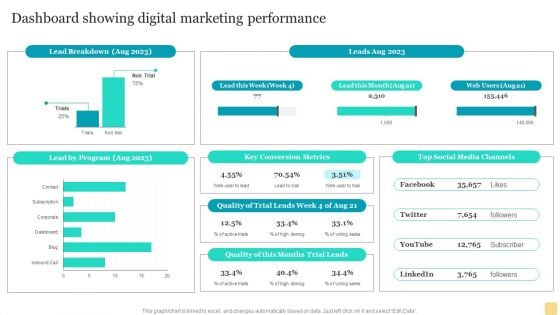
Product Marketing Plan To Enhance Organizational Growth Dashboard Showing Digital Marketing Performance Brochure PDF
Do you have to make sure that everyone on your team knows about any specific topic I yes, then you should give Product Marketing Plan To Enhance Organizational Growth Dashboard Showing Digital Marketing Performance Brochure PDF a try. Our experts have put a lot of knowledge and effort into creating this impeccable Product Marketing Plan To Enhance Organizational Growth Dashboard Showing Digital Marketing Performance Brochure PDF. You can use this template for your upcoming presentations, as the slides are perfect to represent even the tiniest detail. You can download these templates from the Slidegeeks website and these are easy to edit. So grab these today.
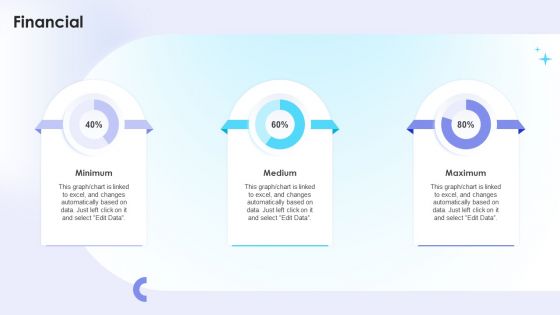
Dual Branding Campaign To Boost Sales Of Product Or Services Financial Structure PDF
Whether you have daily or monthly meetings, a brilliant presentation is necessary. Dual Branding Campaign To Boost Sales Of Product Or Services Financial Structure PDF can be your best option for delivering a presentation. Represent everything in detail using Dual Branding Campaign To Boost Sales Of Product Or Services Financial Structure PDF and make yourself stand out in meetings. The template is versatile and follows a structure that will cater to your requirements. All the templates prepared by Slidegeeks are easy to download and edit. Our research experts have taken care of the corporate themes as well. So, give it a try and see the results.
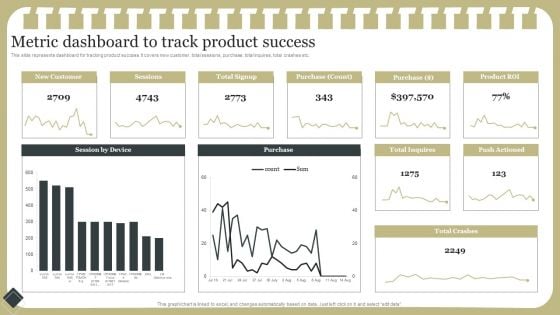
Effective Product Development Strategy Metric Dashboard To Track Product Success Microsoft PDF
This slide represents dashboard for tracking product success. It covers new customer, total sessions, purchase, total inquires, total crashes etc.This modern and well-arranged Effective Product Development Strategy Metric Dashboard To Track Product Success Microsoft PDF provides lots of creative possibilities. It is very simple to customize and edit with the Powerpoint Software. Just drag and drop your pictures into the shapes. All facets of this template can be edited with Powerpoint no extra software is necessary. Add your own material, put your images in the places assigned for them, adjust the colors, and then you can show your slides to the world, with an animated slide included.
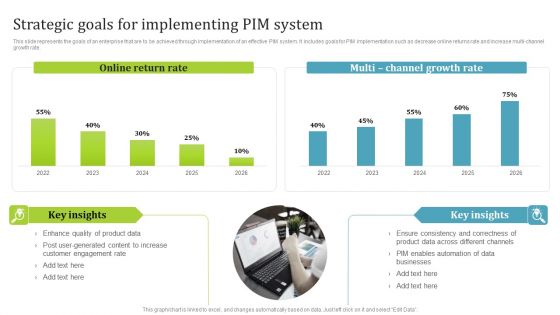
PIM Software Deployment To Enhance Conversion Rates Strategic Goals For Implementing PIM System Formats PDF
This slide represents the goals of an enterprise that are to be achieved through implementation of an effective PIM system. It includes goals for PIM implementation such as decrease online returns rate and increase multi channel growth rate. There are so many reasons you need a PIM Software Deployment To Enhance Conversion Rates Strategic Goals For Implementing PIM System Formats PDF. The first reason is you can not spend time making everything from scratch, Thus, Slidegeeks has made presentation templates for you too. You can easily download these templates from our website easily.
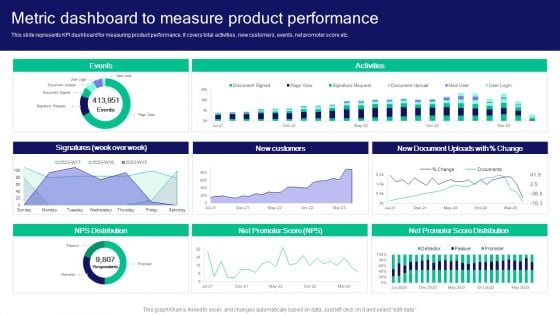
Strategies For Effective Product Metric Dashboard To Measure Product Performance Download PDF
This slide represents KPI dashboard for measuring product performance. It covers total activities, new customers, events, net promoter score etc. Welcome to our selection of the Strategies For Effective Product Metric Dashboard To Measure Product Performance Download PDF. These are designed to help you showcase your creativity and bring your sphere to life. Planning and Innovation are essential for any business that is just starting out. This collection contains the designs that you need for your everyday presentations. All of our PowerPoints are 100 percent editable, so you can customize them to suit your needs. This multi-purpose template can be used in various situations. Grab these presentation templates today.
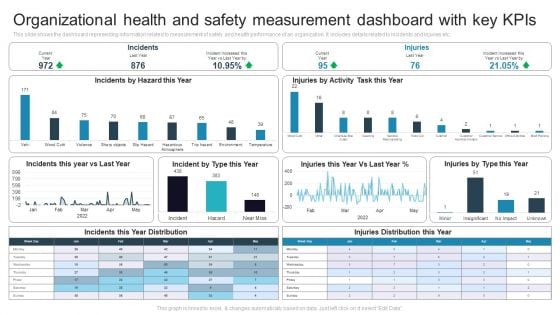
Organizational Health And Safety Measurement Dashboard With Key Kpis Microsoft PDF
This slide shows the dashboard representing information related to measurement of safety and health performance of an organization. It includes details related to incidents and injuries etc. Showcasing this set of slides titled Organizational Health And Safety Measurement Dashboard With Key Kpis Microsoft PDF. The topics addressed in these templates are Hazard This Year, Injuries By Activity, Task This Year. All the content presented in this PPT design is completely editable. Download it and make adjustments in color, background, font etc. as per your unique business setting.
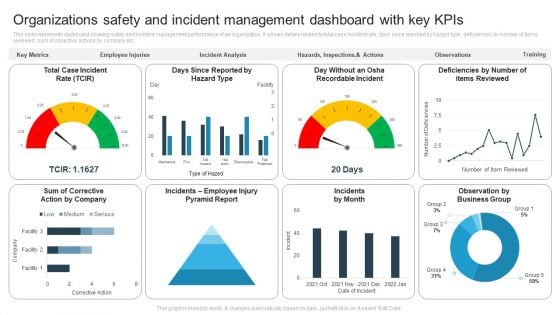
Organizations Safety And Incident Management Dashboard With Key Kpis Themes PDF
This slide represents dashboard showing safety and incident management performance of an organization. It shows details related to total case incident rate, days since reported by hazard type, deficiencies by number of items reviewed, sum of corrective actions by company etc. Showcasing this set of slides titled Organizations Safety And Incident Management Dashboard With Key Kpis Themes PDF. The topics addressed in these templates are Incidents By Month, Observation By Business Group. All the content presented in this PPT design is completely editable. Download it and make adjustments in color, background, font etc. as per your unique business setting.
Safety And Health Kpis For Tracking Performance Graph Mockup PDF
This slide represents graph showing key performance indicators tracked by companies for assessment of safety and health performance of their workplace. It includes key metrics such as workforce awareness, safety meetings held, recordable injuries, lost work days, compliance, severity rates etc. Pitch your topic with ease and precision using this Safety And Health Kpis For Tracking Performance Graph Mockup PDF. This layout presents information on Safety And Health, Kpis For Tracking, Performance Graph. It is also available for immediate download and adjustment. So, changes can be made in the color, design, graphics or any other component to create a unique layout.
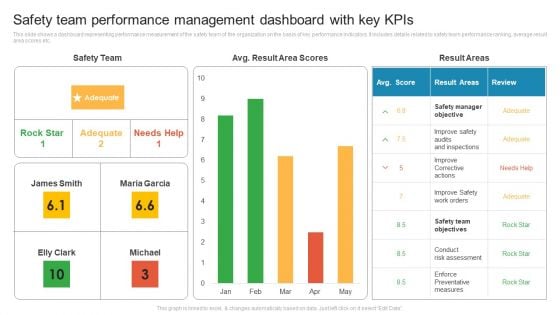
Safety Team Performance Management Dashboard With Key Kpis Rules PDF
This slide shows a dashboard representing performance measurement of the safety team of the organization on the basis of key performance indicators. It includes details related to safety team performance ranking, average result area scores etc. Pitch your topic with ease and precision using this Safety Team Performance Management Dashboard With Key Kpis Rules PDF. This layout presents information on Improve Corrective Actions, Safety Manager Objective, Conduct Risk Assessment. It is also available for immediate download and adjustment. So, changes can be made in the color, design, graphics or any other component to create a unique layout.

Inventory Management Summary By Production Team Summary Designs PDF
This slide shows the dashboard representing the analysis of the inventory management report prepared by the production team manager. It includes information related to total no. of sales, inventory, suppliers, accounts payable etc. Pitch your topic with ease and precision using this Inventory Management Summary By Production Team Summary Designs PDF. This layout presents information on Days Inventory Outstanding, Inventory Value By Item. It is also available for immediate download and adjustment. So, changes can be made in the color, design, graphics or any other component to create a unique layout.
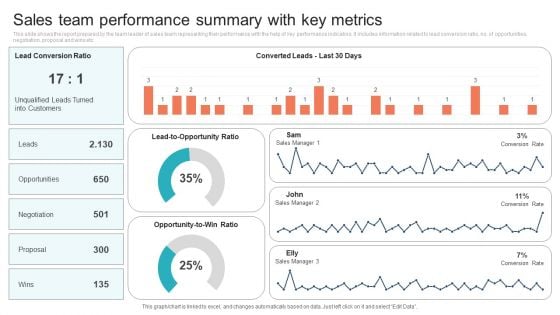
Sales Team Performance Summary With Key Metrics Background PDF
This slide shows the report prepared by the team leader of sales team representing their performance with the help of key performance indicators. It includes information related to lead conversion ratio, no. of opportunities, negotiation, proposal and wins etc. Showcasing this set of slides titled Sales Team Performance Summary With Key Metrics Background PDF. The topics addressed in these templates are Opportunities, Negotiation, Proposal. All the content presented in this PPT design is completely editable. Download it and make adjustments in color, background, font etc. as per your unique business setting.
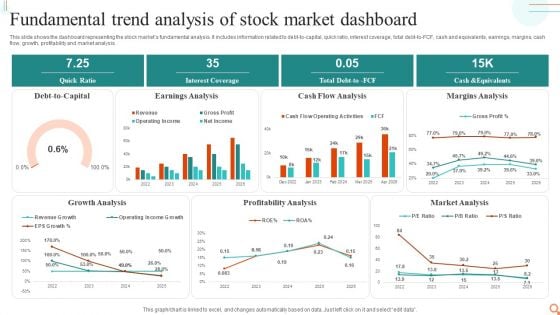
Fundamental Trend Analysis Of Stock Market Dashboard Professional PDF
This slide shows the dashboard representing the stock markets fundamental analysis. It includes information related to debt-to-capital, quick ratio, interest coverage, total debt-to-FCF, cash and equivalents, earnings, margins, cash flow, growth, profitability and market analysis.Showcasing this set of slides titled Fundamental Trend Analysis Of Stock Market Dashboard Professional PDF. The topics addressed in these templates are Earnings Analysis, Cash Flow Analysis, Margins Analysis. All the content presented in this PPT design is completely editable. Download it and make adjustments in color, background, font etc. as per your unique business setting.
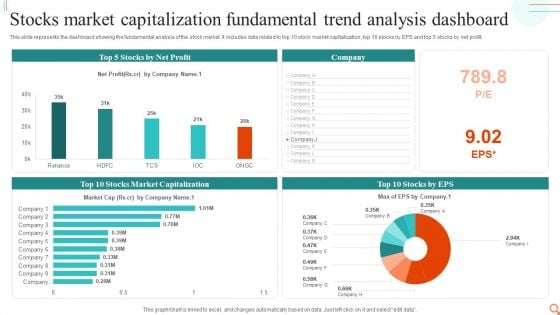
Stocks Market Capitalization Fundamental Trend Analysis Dashboard Designs PDF
This slide represents the dashboard showing the fundamental analysis of the stock market. It includes data related to top 10 stock market capitalization, top 10 stocks by EPS and top 5 stocks by net profit.Showcasing this set of slides titled Stocks Market Capitalization Fundamental Trend Analysis Dashboard Designs PDF. The topics addressed in these templates are Market Capitalization, Net Profit. All the content presented in this PPT design is completely editable. Download it and make adjustments in color, background, font etc. as per your unique business setting.
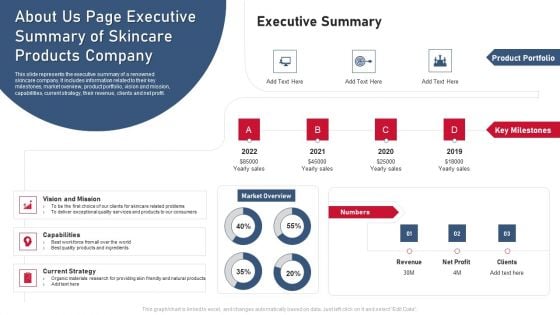
About Us Page Executive Summary Of Skincare Products Company Elements PDF
This slide represents the executive summary of a renowned skincare company. It includes information related to their key milestones, market overview, product portfolio, vision and mission, capabilities, current strategy, their revenue, clients and net profit.Pitch your topic with ease and precision using this About Us Page Executive Summary Of Skincare Products Company Elements PDF. This layout presents information on Choice Clients, Exceptional Quality, Products Ingredients. It is also available for immediate download and adjustment. So, changes can be made in the color, design, graphics or any other component to create a unique layout.
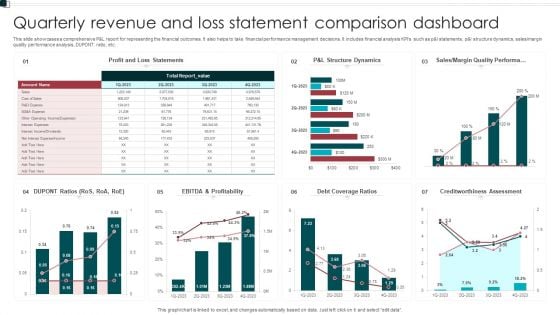
Quarterly Revenue And Loss Statement Comparison Dashboard Portrait PDF
This slide showcases a comprehensive P and L report for representing the financial outcomes. It also helps to take financial performance management decisions. It includes financial analysis KPIs such as p and l statements, p and l structure dynamics, sales or margin quality performance analysis, DUPONT ratio, etc. Showcasing this set of slides titled Quarterly Revenue And Loss Statement Comparison Dashboard Portrait PDF. The topics addressed in these templates are Profitability, Debt Coverage Ratios, Margin Quality Performa. All the content presented in this PPT design is completely editable. Download it and make adjustments in color, background, font etc. as per your unique business setting.
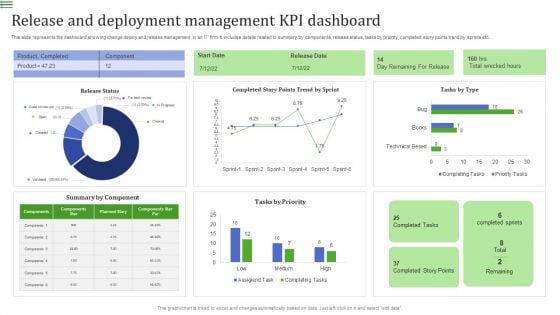
Release And Deployment Management KPI Dashboard Summary PDF
This slide represents the dashboard showing change deploy and release management in an IT firm. It includes details related to summary by components, release status, tasks by priority, completed story points trend by sprints etc.Showcasing this set of slides titled Release And Deployment Management KPI Dashboard Summary PDF. The topics addressed in these templates are Product Completed, Summary Component, Completed Story. All the content presented in this PPT design is completely editable. Download it and make adjustments in color, background, font etc. as per your unique business setting.
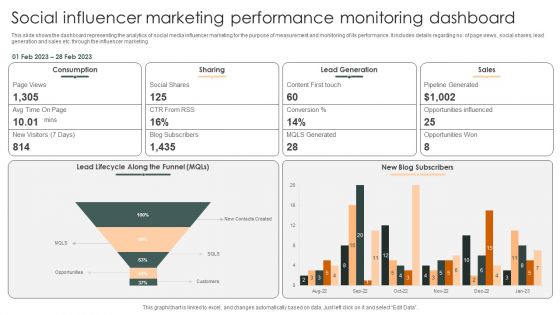
Social Influencer Marketing Performance Monitoring Dashboard Slides PDF
This slide shows the dashboard representing the analytics of social media influencer marketing for the purpose of measurement and monitoring of its performance. It includes details regarding no. of page views, social shares, lead generation and sales etc. through the influencer marketing.Pitch your topic with ease and precision using this Social Influencer Marketing Performance Monitoring Dashboard Slides PDF. This layout presents information on Lead Generation, Pipeline Generated, Opportunities Influenced. It is also available for immediate download and adjustment. So, changes can be made in the color, design, graphics or any other component to create a unique layout.
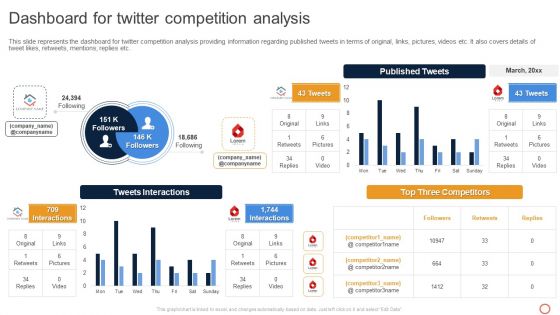
Leveraging Twitter For Social Dashboard For Twitter Competition Analysis Inspiration PDF
This slide represents the dashboard for twitter competition analysis providing information regarding published tweets in terms of original, links, pictures, videos etc. It also covers details of tweet likes, retweets, mentions, replies etc. From laying roadmaps to briefing everything in detail, our templates are perfect for you. You can set the stage with your presentation slides. All you have to do is download these easy-to-edit and customizable templates. Leveraging Twitter For Social Dashboard For Twitter Competition Analysis Inspiration PDF will help you deliver an outstanding performance that everyone would remember and praise you for. Do download this presentation today.

Benefits Of Enterprise Risk Management Experienced By Organizations Template PDF
This slide represents the ways in which enterprise risk management helps organizations to improve decision quality, reduce business liability and frame regulatory issues. It includes details related to results of survey conducted to analyze benefits of ERM experienced by various organizations.Find a pre-designed and impeccable Benefits Of Enterprise Risk Management Experienced By Organizations Template PDF. The templates can ace your presentation without additional effort. You can download these easy-to-edit presentation templates to make your presentation stand out from others. So, what are you waiting for Download the template from Slidegeeks today and give a unique touch to your presentation.
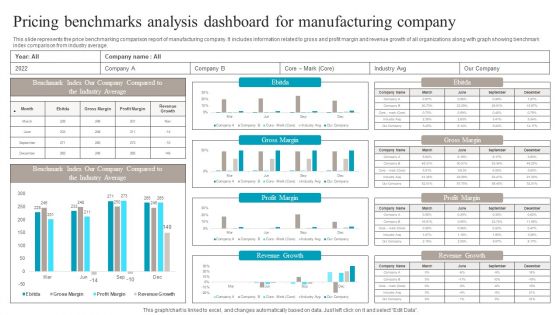
Pricing Benchmarks Analysis Dashboard For Manufacturing Company Structure PDF
This slide represents the price benchmarking comparison report of manufacturing company. It includes information related to gross and profit margin and revenue growth of all organizations along with graph showing benchmark index comparison from industry average. Pitch your topic with ease and precision using this Pricing Benchmarks Analysis Dashboard For Manufacturing Company Structure PDF. This layout presents information on Pricing Benchmarks Analysis, Dashboard For Manufacturing Company. It is also available for immediate download and adjustment. So, changes can be made in the color, design, graphics or any other component to create a unique layout.
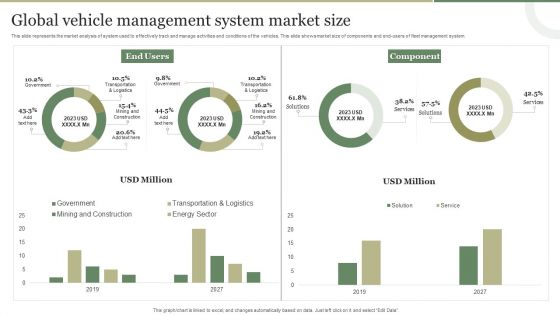
Global Vehicle Management System Market Size Guidelines PDF
This slide represents the market analysis of system used to effectively track and manage activities and conditions of the vehicles. This slide shows market size of components and end-users of fleet management system. Pitch your topic with ease and precision using this Global Vehicle Management System Market Size Guidelines PDF. This layout presents information on Global Vehicle, Management System, Market Size. It is also available for immediate download and adjustment. So, changes can be made in the color, design, graphics or any other component to create a unique layout.
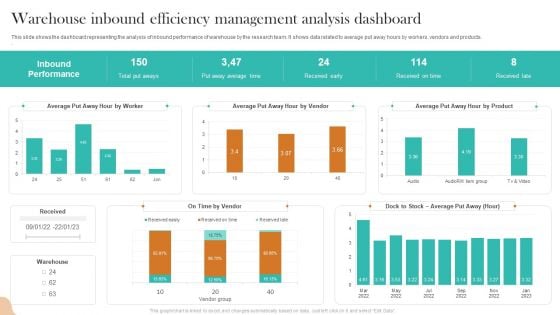
Warehouse Inbound Efficiency Management Analysis Dashboard Topics PDF
This slide shows the dashboard representing the analysis of inbound performance of warehouse by the research team. It shows data related to average put away hours by workers, vendors and products. Showcasing this set of slides titled Warehouse Inbound Efficiency Management Analysis Dashboard Topics PDF. The topics addressed in these templates are Inbound Performance, Total Put Aways, Received Early. All the content presented in this PPT design is completely editable. Download it and make adjustments in color, background, font etc. as per your unique business setting.
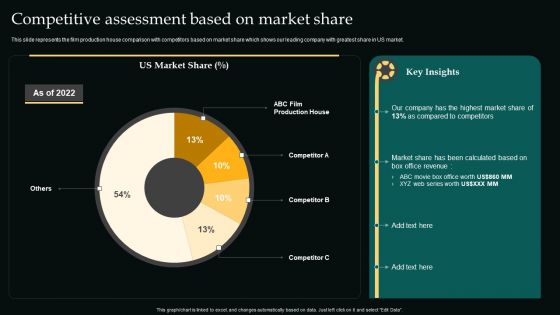
Competitive Assessment Based On Market Share Movie Editing Company Outline Formats PDF
This slide represents the film production house comparison with competitors based on market share which shows our leading company with greatest share in US market.This modern and well-arranged Competitive Assessment Based On Market Share Movie Editing Company Outline Formats PDF provides lots of creative possibilities. It is very simple to customize and edit with the Powerpoint Software. Just drag and drop your pictures into the shapes. All facets of this template can be edited with Powerpoint no extra software is necessary. Add your own material, put your images in the places assigned for them, adjust the colors, and then you can show your slides to the world, with an animated slide included.
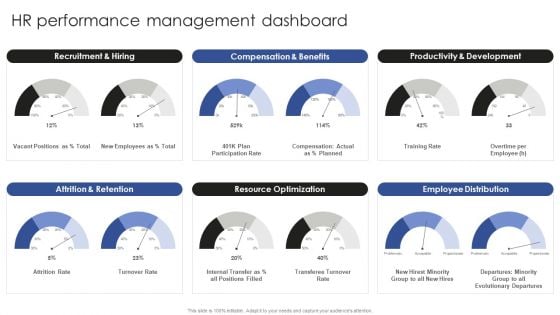
Talent Administration And Succession HR Performance Management Dashboard Background PDF
Whether you have daily or monthly meetings, a brilliant presentation is necessary. Talent Administration And Succession HR Performance Management Dashboard Background PDF can be your best option for delivering a presentation. Represent everything in detail using Talent Administration And Succession HR Performance Management Dashboard Background PDF and make yourself stand out in meetings. The template is versatile and follows a structure that will cater to your requirements. All the templates prepared by Slidegeeks are easy to download and edit. Our research experts have taken care of the corporate themes as well. So, give it a try and see the results.
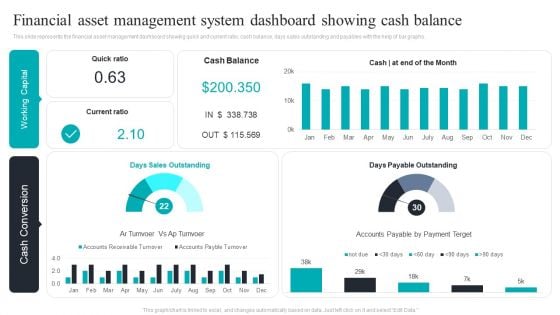
Financial Asset Management System Dashboard Showing Cash Balance Download PDF
This slide represents the financial asset management dashboard showing quick and current ratio, cash balance, days sales outstanding and payables with the help of bar graphs. Pitch your topic with ease and precision using this Financial Asset Management System Dashboard Showing Cash Balance Download PDF. This layout presents information on Financial Asset, Management System, Dashboard Showing, Cash Balance. It is also available for immediate download and adjustment. So, changes can be made in the color, design, graphics or any other component to create a unique layout.
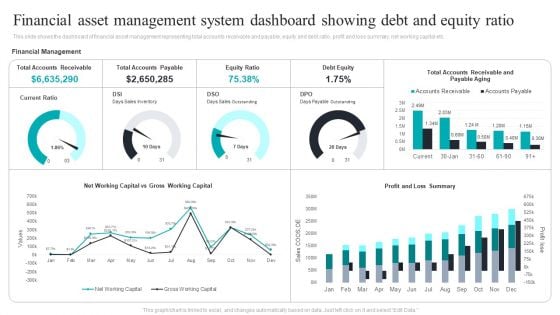
Financial Asset Management System Dashboard Showing Debt And Equity Ratio Graphics PDF
This slide shows the dashboard of financial asset management representing total accounts receivable and payable, equity and debt ratio, profit and loss summary, net working capital etc. Showcasing this set of slides titled Financial Asset Management System Dashboard Showing Debt And Equity Ratio Graphics PDF. The topics addressed in these templates are Financial Asset, Management System, Debt And Equity Ratio. All the content presented in this PPT design is completely editable. Download it and make adjustments in color, background, font etc. as per your unique business setting.
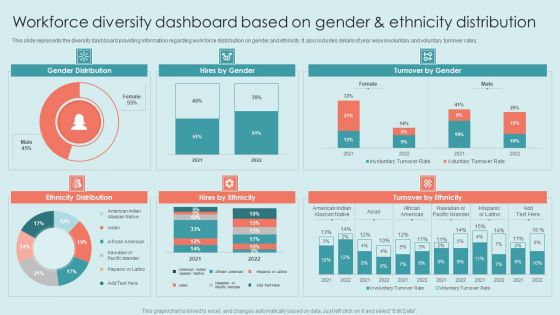
Executing Diversity Workforce Diversity Dashboard Based On Gender And Ethnicity Distribution Rules PDF
This slide represents the diversity dashboard providing information regarding work force distribution on gender and ethnicity. It also includes details of year wise involuntary and voluntary turnover rates. The Executing Diversity Workforce Diversity Dashboard Based On Gender And Ethnicity Distribution Rules PDF is a compilation of the most recent design trends as a series of slides. It is suitable for any subject or industry presentation, containing attractive visuals and photo spots for businesses to clearly express their messages. This template contains a variety of slides for the user to input data, such as structures to contrast two elements, bullet points, and slides for written information. Slidegeeks is prepared to create an impression.
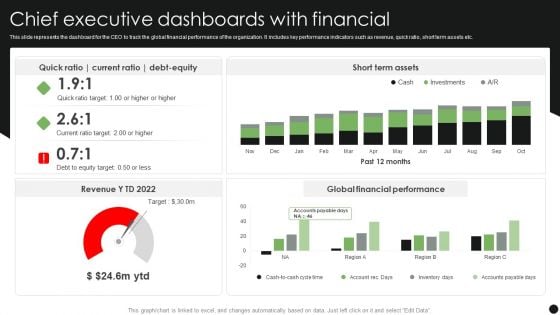
Chief Executive Dashboards With Financial Topics PDF
This slide represents the dashboard for the CEO to track the global financial performance of the organization. It includes key performance indicators such as revenue, quick ratio, short term assets etc. Showcasing this set of slides titled Chief Executive Dashboards With Financial Topics PDF. The topics addressed in these templates are Short Term Assets, Global Financial Performance, Debt Equity. All the content presented in this PPT design is completely editable. Download it and make adjustments in color, background, font etc. as per your unique business setting.
Executive Dashboards For Tracking Financial Health Of Enterprise Diagrams PDF
This slide represents the CEO dashboard to track the financial health of an organization. It includes key performance indicators such as revenue, expenses, activity ratio, gross profit margin, EBIT etc. Pitch your topic with ease and precision using this Executive Dashboards For Tracking Financial Health Of Enterprise Diagrams PDF. This layout presents information on Revenue, Expense, Activity Ratio. It is also available for immediate download and adjustment. So, changes can be made in the color, design, graphics or any other component to create a unique layout.
Executive Dashboards For Tracking Key Performance Icons PDF
This slide represents the dashboard for the CEO to track the companys performance. It includes key performance indicators such as no. of deals, open deals, revenue, expected revenue and win percentage. Showcasing this set of slides titled Executive Dashboards For Tracking Key Performance Icons PDF. The topics addressed in these templates are Pen Deals, Revenue, Expected Revenue. All the content presented in this PPT design is completely editable. Download it and make adjustments in color, background, font etc. as per your unique business setting.
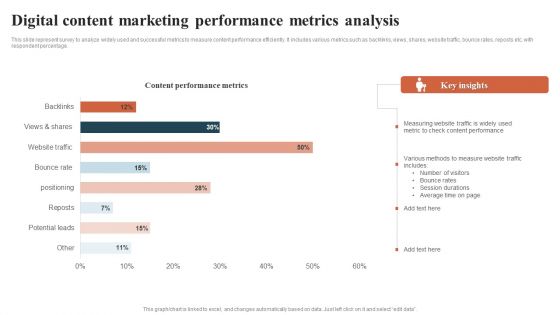
Digital Content Marketing Performance Metrics Analysis Introduction PDF
This slide represent survey to analyze widely used and successful metrics to measure content performance efficiently. It includes various metrics such as backlinks, views, shares, website traffic, bounce rates, reposts etc. with respondent percentage. Showcasing this set of slides titled Digital Content Marketing Performance Metrics Analysis Introduction PDF. The topics addressed in these templates are Digital Content Marketing, Performance Metrics Analysis. All the content presented in this PPT design is completely editable. Download it and make adjustments in color, background, font etc. as per your unique business setting.

B2b Ecommerce Dashboard To Track Website Performance Comprehensive Guide For Developing Sample PDF
This slide represents metric dashboard to track and analyze b2b ecommerce website performance. It covers total user visits, sales, average return per user etc.Find a pre-designed and impeccable B2b Ecommerce Dashboard To Track Website Performance Comprehensive Guide For Developing Sample PDF. The templates can ace your presentation without additional effort. You can download these easy-to-edit presentation templates to make your presentation stand out from others. So, what are you waiting for Download the template from Slidegeeks today and give a unique touch to your presentation.


 Continue with Email

 Home
Home


