Operating Budget
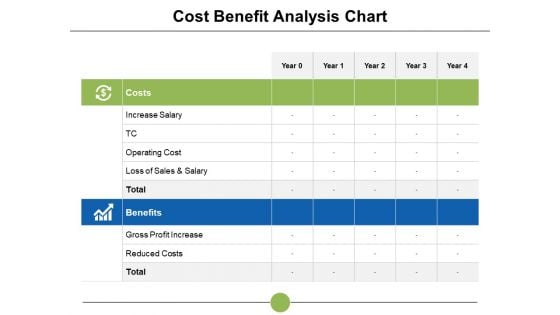
Cost Benefit Analysis Chart Ppt PowerPoint Presentation Slides Example File
This is a cost benefit analysis chart ppt powerpoint presentation slides example file. This is a two stage process. The stages in this process are increase salary, cost benefit, reduced costs, analysis, operating cost.
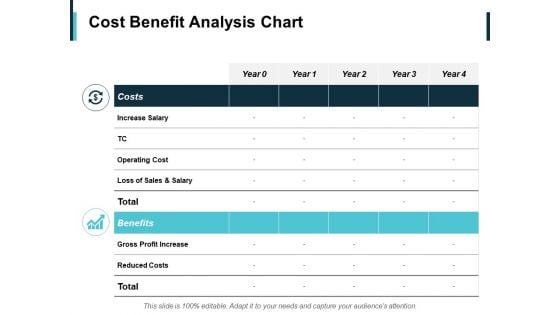
Cost Benefit Analysis Chart Ppt PowerPoint Presentation Ideas Shapes
This is a cost benefit analysis chart ppt powerpoint presentation ideas shapes. This is a two stage process. The stages in this process are reduced costs, operating cost, benefits, costs, increase salary.
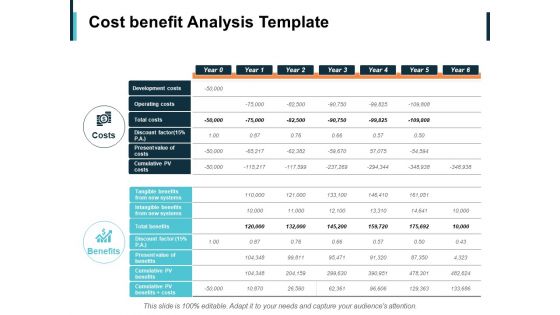
Cost Benefit Analysis Ppt PowerPoint Presentation File Ideas
This is a cost benefit analysis ppt powerpoint presentation file ideas. This is a two stage process. The stages in this process are management, operating cost, benefits, costs, marketing.
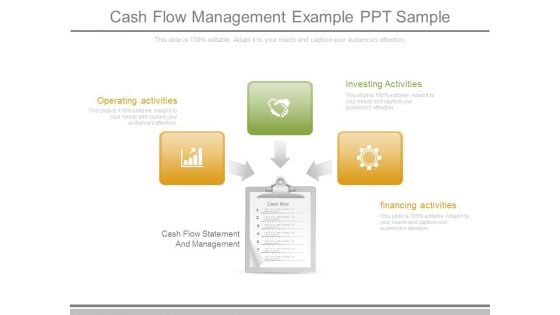
Cash Flow Management Example Ppt Sample
This is a cash flow management example ppt sample. This is a three stage process. The stages in this process are operating activities, investing activities, financing activities, cash flow statement and management.
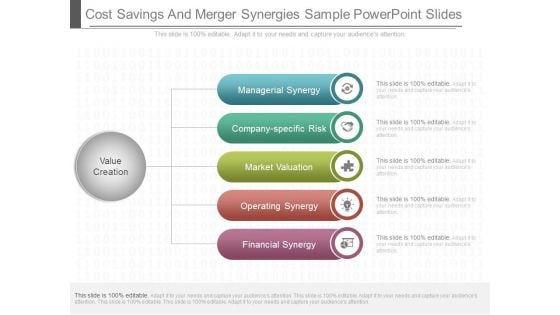
Cost Savings And Merger Synergies Sample Powerpoint Slides
This is a cost savings and merger synergies sample powerpoint slides. This is a five stage process. The stages in this process are managerial synergy, company specific risk, market valuation, operating synergy, financial synergy, value creation.
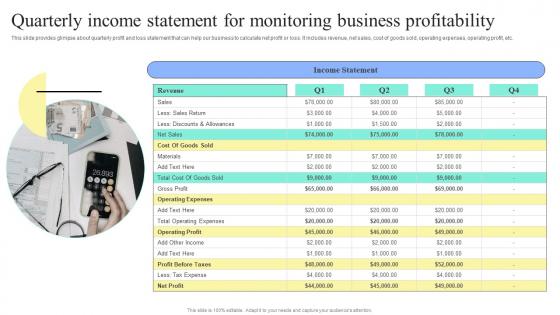
Strategic Financial Planning And Administration Quarterly Income Statement Monitoring Business Summary PDF
This slide provides glimpse about quarterly profit and loss statement that can help our business to calculate net profit or loss. It includes revenue, net sales, cost of goods sold, operating expenses, operating profit, etc. Take your projects to the next level with our ultimate collection of Strategic Financial Planning And Administration Quarterly Income Statement Monitoring Business Summary PDF. Slidegeeks has designed a range of layouts that are perfect for representing task or activity duration, keeping track of all your deadlines at a glance. Tailor these designs to your exact needs and give them a truly corporate look with your own brand colors they will make your projects stand out from the rest This slide provides glimpse about quarterly profit and loss statement that can help our business to calculate net profit or loss. It includes revenue, net sales, cost of goods sold, operating expenses, operating profit, etc.
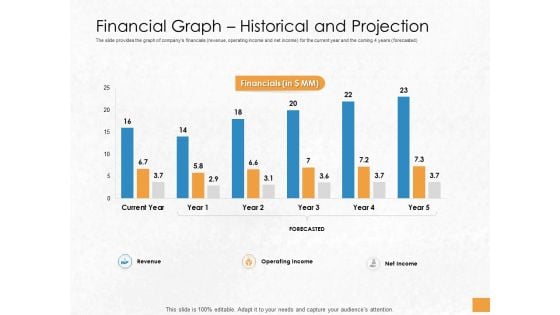
Convertible Debenture Funding Financial Graph Historical And Projection Ppt Professional Themes PDF
The slide provides the graph of companys financials revenue, operating income and net income for the current year and the coming 4 years forecasted. Deliver an awe-inspiring pitch with this creative convertible debenture funding financial graph historical and projection ppt professional themes pdf bundle. Topics like revenue, operating income, net income, forecasted, financials, current year can be discussed with this completely editable template. It is available for immediate download depending on the needs and requirements of the user.
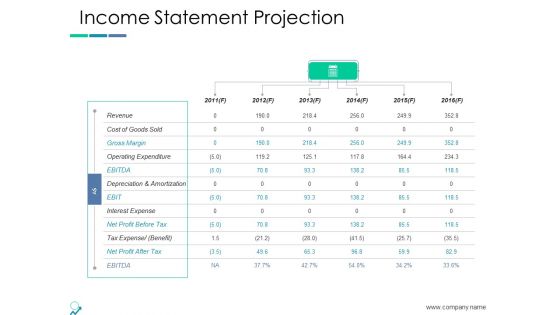
Income Statement Projection Ppt PowerPoint Presentation Visual Aids Ideas
This is a income statement projection ppt powerpoint presentation visual aids ideas. This is a six stage process. The stages in this process are income statement projection, cost of goods sold, operating expenditure, interest expense, tax expense.
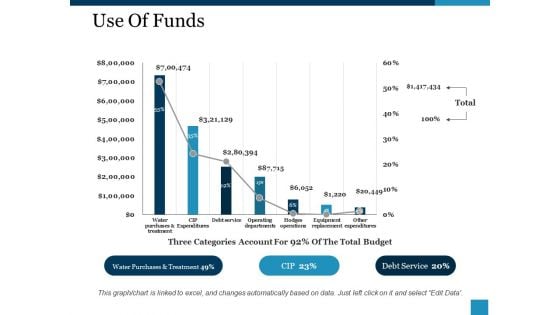
Use Of Funds Ppt PowerPoint Presentation Layouts Information
This is a use of funds ppt powerpoint presentation layouts information. This is a seven stage process. The stages in this process are debt service, operating departments, other expenditures, water purchases and treatment, total.
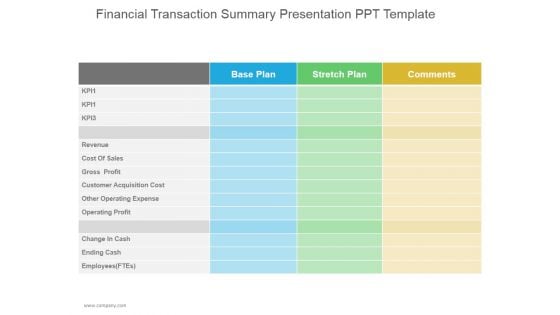
Financial Transaction Summary Ppt PowerPoint Presentation Show
This is a financial transaction summary ppt powerpoint presentation show. This is a three stage process. The stages in this process are cost of sales, gross profit, customer acquisition cost, operating profit, change in cash.
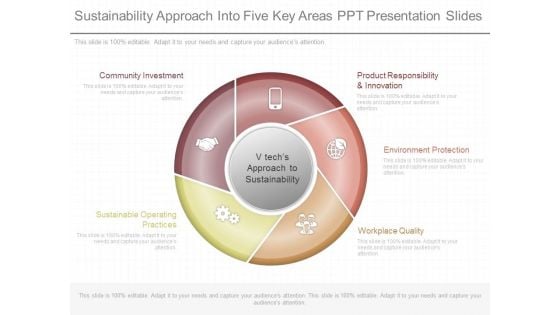
Sustainability Approach Into Five Key Areas Ppt Presentation Slides
This is a sustainability approach into five key areas ppt presentation slides. This is a five stage process. The stages in this process are product responsibility and innovation, environment protection, workplace quality, sustainable operating practices, community investment.
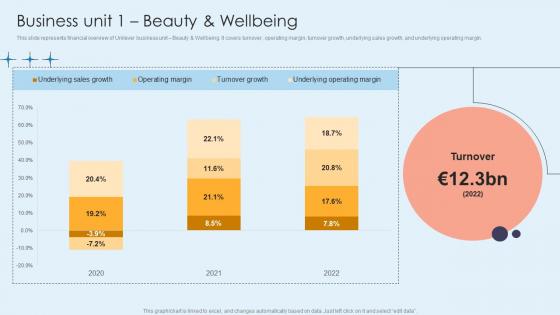
Business Unit 1 Beauty And Wellbeing Home Care Solutions Company Profile CP SS V
This slide represents financial overview of Unilever business unit Beauty and Wellbeing. It covers turnover, operating margin, turnover growth, underlying sales growth, and underlying operating margin.Slidegeeks is one of the best resources for PowerPoint templates. You can download easily and regulate Business Unit 1 Beauty And Wellbeing Home Care Solutions Company Profile CP SS V for your personal presentations from our wonderful collection. A few clicks is all it takes to discover and get the most relevant and appropriate templates. Use our Templates to add a unique zing and appeal to your presentation and meetings. All the slides are easy to edit and you can use them even for advertisement purposes. This slide represents financial overview of Unilever business unit Beauty and Wellbeing. It covers turnover, operating margin, turnover growth, underlying sales growth, and underlying operating margin.
Decision Making Project Management Ppt Sample Ppt Files
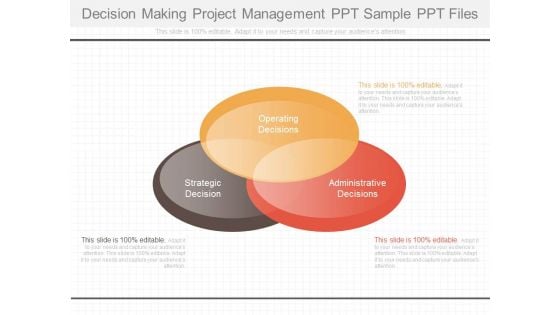
This is a decision making project management ppt sample ppt files. This is a three stage process. The stages in this process are operating decisions, administrative decisions, strategic decision.
Analyzing Income Statement Annually To Monitor Outline Of Nestle Management Formats Pdf
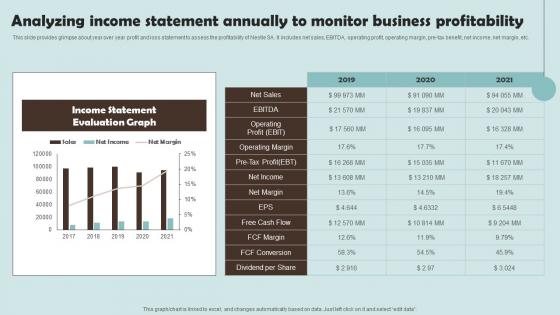
This slide provides glimpse about year over year profit and loss statement to assess the profitability of Nestle SA. It includes net sales, EBITDA, operating profit, operating margin, pre-tax benefit, net income, net margin, etc.Slidegeeks is one of the best resources for PowerPoint templates. You can download easily and regulate Analyzing Income Statement Annually To Monitor Outline Of Nestle Management Formats Pdf for your personal presentations from our wonderful collection. A few clicks is all it takes to discover and get the most relevant and appropriate templates. Use our Templates to add a unique zing and appeal to your presentation and meetings. All the slides are easy to edit and you can use them even for advertisement purposes. This slide provides glimpse about year over year profit and loss statement to assess the profitability of Nestle SA. It includes net sales, EBITDA, operating profit, operating margin, pre tax benefit, net income, net margin, etc.
Subordinated Loan Funding Financial Graph Historical And Projection Ppt Model File Formats PDF
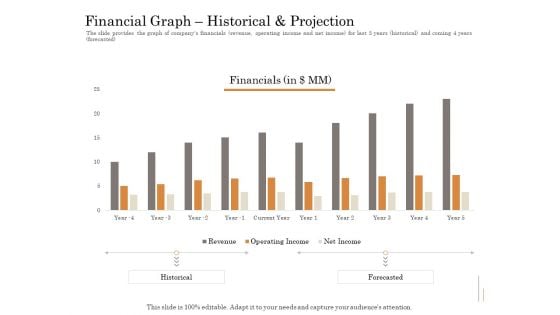
The slide provides the graph of companys financials revenue, operating income and net income for last 5 years historical and coming 4 years forecasted. Deliver and pitch your topic in the best possible manner with this subordinated loan funding financial graph historical and projection ppt model file formats pdf. Use them to share invaluable insights on revenue, operating income, net income, current year. and impress your audience. This template can be altered and modified as per your expectations. So, grab it now.
Convertible Preferred Stock Funding Pitch Deck Financial Graph Historical And Projection Themes PDF
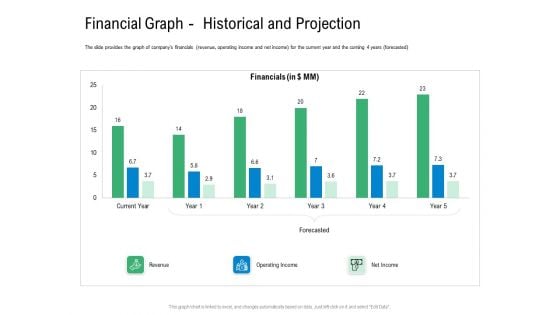
The slide provides the graph of companys financials revenue, operating income and net income for the current year and the coming 4 years forecasted. Deliver an awe inspiring pitch with this creative convertible preferred stock funding pitch deck financial graph historical and projection themes pdf bundle. Topics like revenue, operating income, net income can be discussed with this completely editable template. It is available for immediate download depending on the needs and requirements of the user.

Analyzing Income Statement Annually To Monitor Business Customer Segmentation Clipart Pdf
This slide provides glimpse about year over year profit and loss statement to assess the profitability of Nestle SA. It includes net sales, EBITDA, operating profit, operating margin, pre-tax benefit, net income, net margin, etc. If your project calls for a presentation, then Slidegeeks is your go-to partner because we have professionally designed, easy-to-edit templates that are perfect for any presentation. After downloading, you can easily edit Analyzing Income Statement Annually To Monitor Business Customer Segmentation Clipart Pdf and make the changes accordingly. You can rearrange slides or fill them with different images. Check out all the handy templates This slide provides glimpse about year over year profit and loss statement to assess the profitability of Nestle SA. It includes net sales, EBITDA, operating profit, operating margin, pre-tax benefit, net income, net margin, etc.
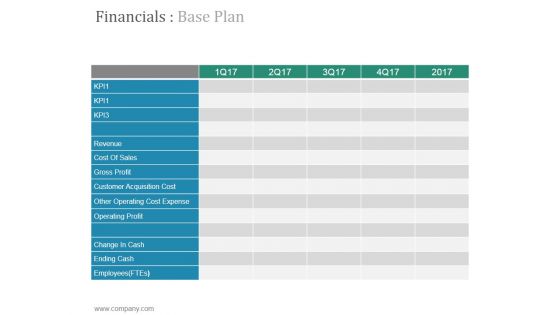
Financials Base Plan Ppt PowerPoint Presentation Portfolio
This is a financials base plan ppt powerpoint presentation portfolio. This is a five stage process. The stages in this process are revenue, cost of sales, gross profit, customer acquisition cost, other operating cost expense.
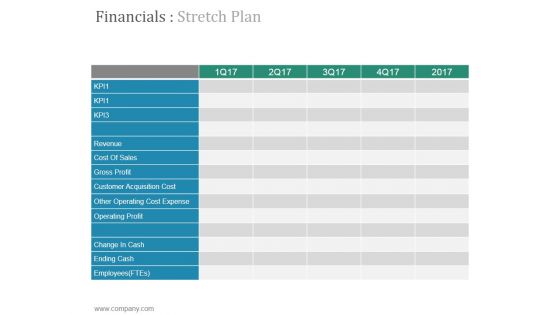
Financials Stretch Plan Ppt PowerPoint Presentation Designs
This is a financials stretch plan ppt powerpoint presentation designs. This is a five stage process. The stages in this process are revenue, cost of sales, gross profit, customer acquisition cost, other operating cost expense.
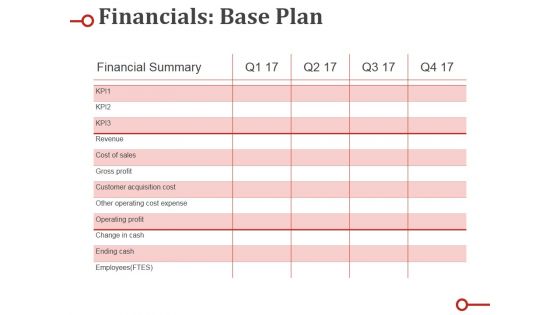
Financials Base Plan Ppt PowerPoint Presentation Portfolio Background Designs
This is a financials base plan ppt powerpoint presentation portfolio background designs. This is a four stage process. The stages in this process are revenue, cost of sales, gross profit, customer acquisition cost, other operating cost expense.
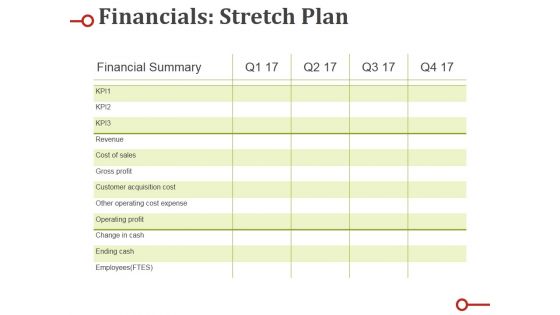
Financials Stretch Plan Ppt PowerPoint Presentation Show Designs Download
This is a financials stretch plan ppt powerpoint presentation show designs download. This is a four stage process. The stages in this process are revenue, cost of sales, gross profit, customer acquisition cost, other operating cost expense.
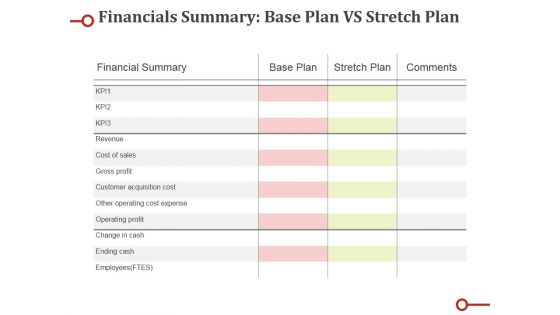
Financials Summary Base Plan Vs Stretch Plan Ppt PowerPoint Presentation Microsoft
This is a financials summary base plan vs stretch plan ppt powerpoint presentation microsoft. This is a three stage process. The stages in this process are revenue, cost of sales, gross profit, customer acquisition cost, other operating cost expense.

Business Unit 4 Nutrition Home Care Solutions Company Profile CP SS V
This slide represents financial overview of Unilever business unit Nutrition. It covers turnover, operating margin, turnover growth, underlying sales growth, and underlying operating margin.Do you have to make sure that everyone on your team knows about any specific topic I yes, then you should give Business Unit 4 Nutrition Home Care Solutions Company Profile CP SS V a try. Our experts have put a lot of knowledge and effort into creating this impeccable Business Unit 4 Nutrition Home Care Solutions Company Profile CP SS V. You can use this template for your upcoming presentations, as the slides are perfect to represent even the tiniest detail. You can download these templates from the Slidegeeks website and these are easy to edit. So grab these today This slide represents financial overview of Unilever business unit Nutrition. It covers turnover, operating margin, turnover growth, underlying sales growth, and underlying operating margin.
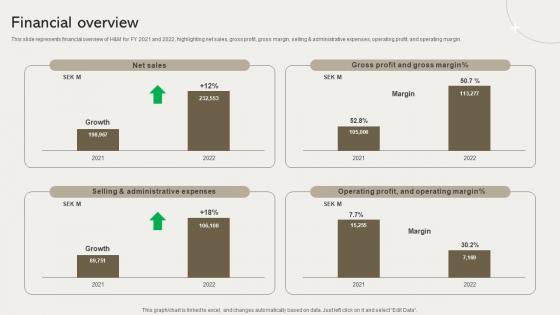
Financial Overview Clothing Retailer Company Profile CP SS V
This slide represents financial overview of HandM for FY 2021 and 2022, highlighting net sales, gross profit, gross margin, selling and administrative expenses, operating profit, and operating margin. Do you have an important presentation coming up Are you looking for something that will make your presentation stand out from the rest Look no further than Financial Overview Clothing Retailer Company Profile CP SS V. With our professional designs, you can trust that your presentation will pop and make delivering it a smooth process. And with Slidegeeks, you can trust that your presentation will be unique and memorable. So why wait Grab Financial Overview Clothing Retailer Company Profile CP SS V today and make your presentation stand out from the rest This slide represents financial overview of HandM for FY 2021 and 2022, highlighting net sales, gross profit, gross margin, selling and administrative expenses, operating profit, and operating margin.

Profit And Loss Statement Professional Services And Tax Advisory Company Profile CP SS V
This slide represents the profit and loss statement highlights for Ernst and Young. It includes last 5 years revenue, operating profit, research and operating loss.Coming up with a presentation necessitates that the majority of the effort goes into the content and the message you intend to convey. The visuals of a PowerPoint presentation can only be effective if it supplements and supports the story that is being told. Keeping this in mind our experts created Profit And Loss Statement Professional Services And Tax Advisory Company Profile CP SS V to reduce the time that goes into designing the presentation. This way, you can concentrate on the message while our designers take care of providing you with the right template for the situation. This slide represents the profit and loss statement highlights for Ernst and Young. It includes last 5 years revenue, operating profit, research and operating loss.

Business Unit 2 Personal Care Home Care Solutions Company Profile CP SS V
This slide represents financial overview of Unilever business unit personal care. It covers turnover, operating margin, turnover growth, underlying sales growth, and underlying operating margin.Want to ace your presentation in front of a live audience Our Business Unit 2 Personal Care Home Care Solutions Company Profile CP SS V can help you do that by engaging all the users towards you. Slidegeeks experts have put their efforts and expertise into creating these impeccable powerpoint presentations so that you can communicate your ideas clearly. Moreover, all the templates are customizable, and easy-to-edit and downloadable. Use these for both personal and commercial use. This slide represents financial overview of Unilever business unit personal care. It covers turnover, operating margin, turnover growth, underlying sales growth, and underlying operating margin.

Business Unit 5 Ice Cream Home Care Solutions Company Profile CP SS V
This slide represents financial overview of Unilever business unit Ice cream. It covers turnover, operating margin, turnover growth, underlying sales growth, and underlying operating margin.Get a simple yet stunning designed Business Unit 5 Ice Cream Home Care Solutions Company Profile CP SS V. It is the best one to establish the tone in your meetings. It is an excellent way to make your presentations highly effective. So, download this PPT today from Slidegeeks and see the positive impacts. Our easy-to-edit Business Unit 5 Ice Cream Home Care Solutions Company Profile CP SS V can be your go-to option for all upcoming conferences and meetings. So, what are you waiting for Grab this template today. This slide represents financial overview of Unilever business unit Ice cream. It covers turnover, operating margin, turnover growth, underlying sales growth, and underlying operating margin.
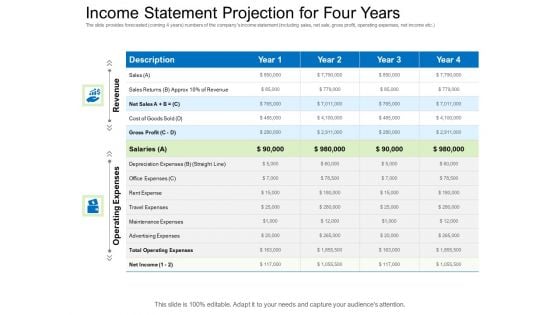
Collective Equity Funding Pitch Deck Income Statement Projection For Four Years Guidelines PDF
The slide provides forecasted coming 4 years numbers of the companys income statement including sales, net sale, gross profit, operating expenses, net income etc. Deliver and pitch your topic in the best possible manner with this collective equity funding pitch deck income statement projection for four years guidelines pdf. Use them to share invaluable insights on sales returns, cost goods sold, depreciation expenses, operating and impress your audience. This template can be altered and modified as per your expectations. So, grab it now.
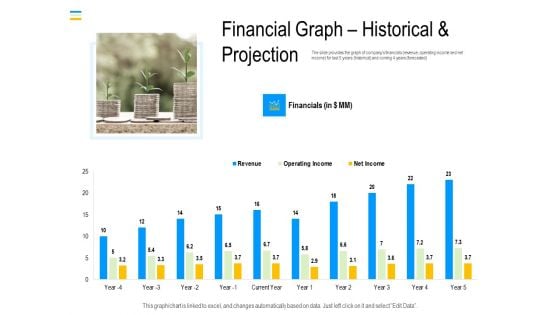
Mezzanine Debt Financing Pitch Deck Financial Graph Historical And Projection Demonstration PDF
The slide provides the graph of companys financials revenue, operating income and net income for last five years historical and coming four years forecasted. Deliver and pitch your topic in the best possible manner with this mezzanine debt financing pitch deck financial graph historical and projection demonstration pdf. Use them to share invaluable insights on financials, revenue, operating income and impress your audience. This template can be altered and modified as per your expectations. So, grab it now.
Convertible Bond Financing Pitch Deck Financial Graph Historical And Projection Slides PDF
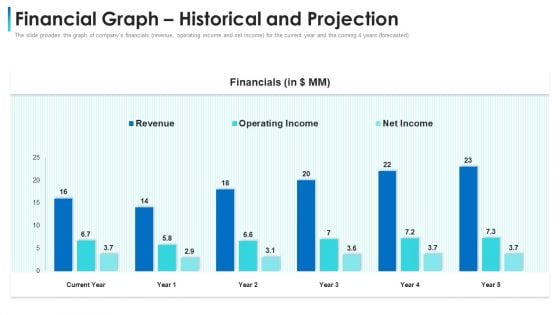
The slide provides the graph of companys financials revenue, operating income and net income for the current year and the coming 4 years forecasted. Deliver an awe-inspiring pitch with this creative convertible bond financing pitch deck financial graph historical and projection slides pdf bundle. Topics like revenue, operating income, net income, financial can be discussed with this completely editable template. It is available for immediate download depending on the needs and requirements of the user.
Financial Snapshot Ppt Powerpoint Presentation Layouts Slides
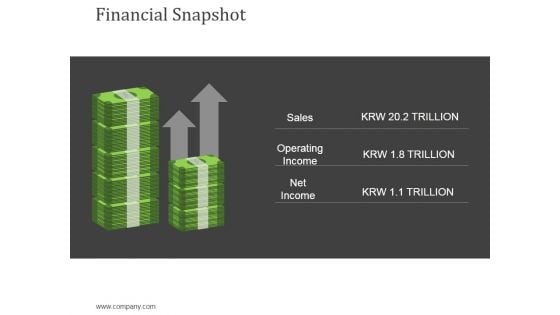
This is a financial snapshot ppt powerpoint presentation layouts slides. This is a two stage process. The stages in this process are sales, operating income, net income, currency, finance.
Pricing Strategy Coffee Bar Go To Market Strategy GTM SS V
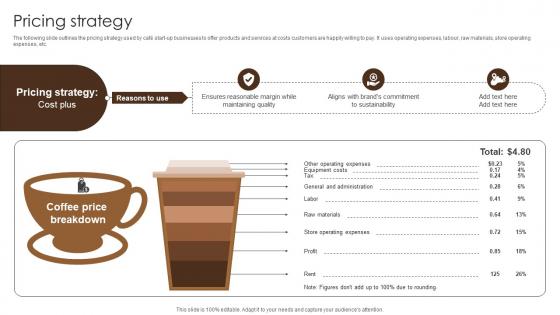
The following slide outlines the pricing strategy used by cafe start-up businesses to offer products and services at costs customers are happily willing to pay. It uses operating expenses, labour, raw materials, store operating expenses, etc.The best PPT templates are a great way to save time, energy, and resources. Slidegeeks have 100 percent editable powerpoint slides making them incredibly versatile. With these quality presentation templates, you can create a captivating and memorable presentation by combining visually appealing slides and effectively communicating your message. Download Pricing Strategy Coffee Bar Go To Market Strategy GTM SS V from Slidegeeks and deliver a wonderful presentation. The following slide outlines the pricing strategy used by cafe start-up businesses to offer products and services at costs customers are happily willing to pay. It uses operating expenses, labour, raw materials, store operating expenses, etc.

Income Statement Graphical Representation Ppt PowerPoint Presentation Summary Inspiration
This is a income statement graphical representation ppt powerpoint presentation summary inspiration. This is a four stage process. The stages in this process are revenue, cogs, operating profit, net profit.
Financials Base Plan Ppt PowerPoint Presentation Styles Graphic Tips
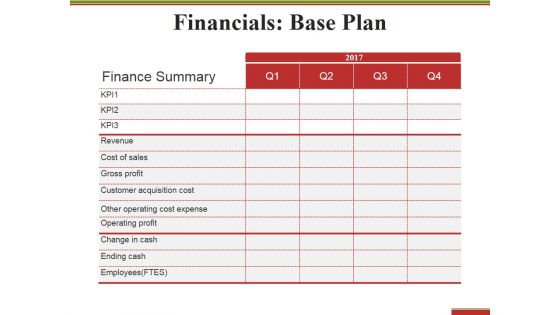
This is a financials base plan ppt powerpoint presentation styles graphic tips. This is a four stage process. The stages in this process are finance summary, revenue, gross profit, operating profit, ending cash.
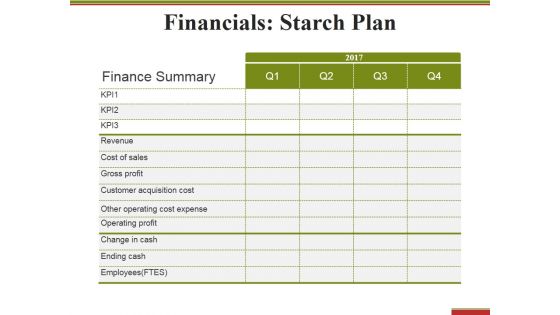
Financials Starch Plan Ppt PowerPoint Presentation Summary Professional
This is a financials starch plan ppt powerpoint presentation summary professional. This is a four stage process. The stages in this process are finance summary, revenue, gross profit, operating profit, ending cash.
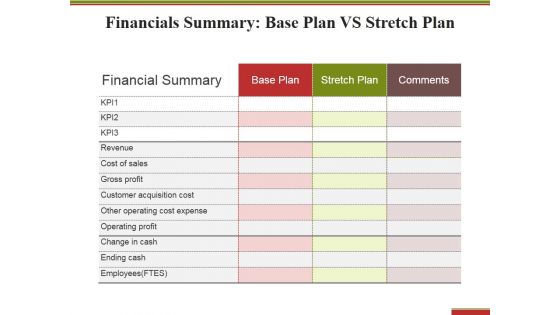
Financials Summary Base Plan Vs Stretch Plan Ppt PowerPoint Presentation File Shapes
This is a financials summary base plan vs stretch plan ppt powerpoint presentation file shapes. This is a three stage process. The stages in this process are finance summary, revenue, gross profit, operating profit, ending cash.
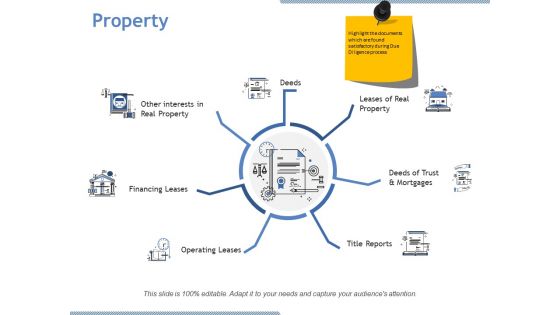
Property Ppt PowerPoint Presentation Professional Background Designs
This is a property ppt powerpoint presentation professional background designs. This is a seven stage process. The stages in this process are deeds, financing leases, operating leases, title reports, leases of real property.
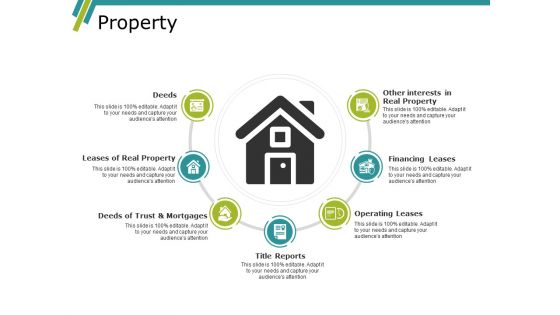
Property Ppt PowerPoint Presentation Summary Slide Portrait
This is a property ppt powerpoint presentation summary slide portrait. This is a seven stage process. The stages in this process are deeds, leases of real property, other interests in real property, financing leases, operating leases.
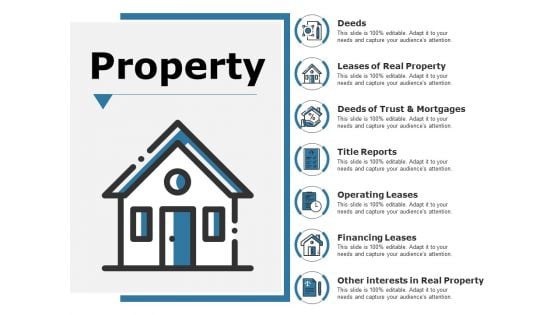
Property Ppt PowerPoint Presentation Visual Aids Backgrounds
This is a property ppt powerpoint presentation visual aids backgrounds. This is a seven stage process. The stages in this process are deeds, leases of real property, title reports, operating leases, financing leases.
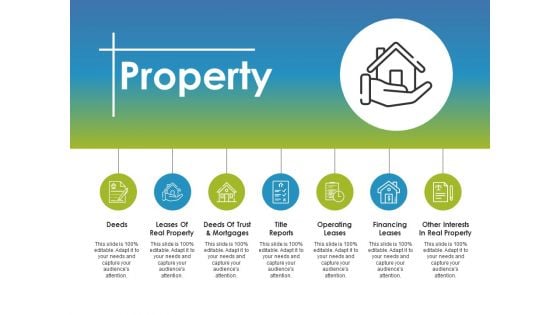
Property Ppt PowerPoint Presentation Model Layout Ideas
This is a property ppt powerpoint presentation model layout ideas. This is a seven stage process. The stages in this process are deeds, leases of real property, title reports, operating leases, financing leases.
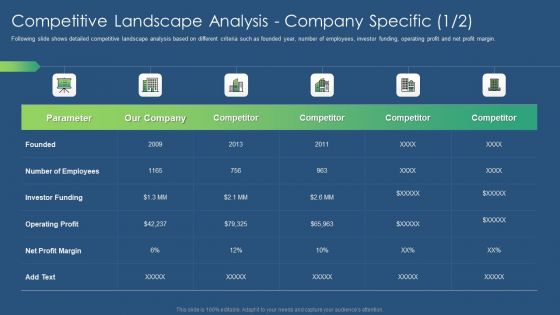
Sustainability Calculation With KPI Competitive Landscape Analysis Ppt PowerPoint Presentation Gallery Example Introduction PDF
Following slide shows detailed competitive landscape analysis based on different criteria such as founded year, number of employees, investor funding, operating profit and net profit margin. Deliver an awe inspiring pitch with this creative sustainability calculation with kpi competitive landscape analysis ppt powerpoint presentation gallery example introduction pdf bundle. Topics like operating profit, net profit margin, investor funding can be discussed with this completely editable template. It is available for immediate download depending on the needs and requirements of the user.
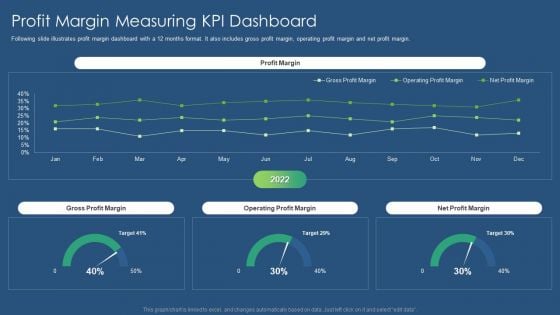
Sustainability Calculation With KPI Profit Margin Measuring Kpi Dashboard Inspiration PDF Topics PDF
Following slide illustrates profit margin dashboard with a 12 months format. It also includes gross profit margin, operating profit margin and net profit margin. Deliver and pitch your topic in the best possible manner with this sustainability calculation with kpi profit margin measuring kpi dashboard inspiration pdf. Use them to share invaluable insights on net profit margin, operating profit margin, gross profit margin and impress your audience. This template can be altered and modified as per your expectations. So, grab it now.
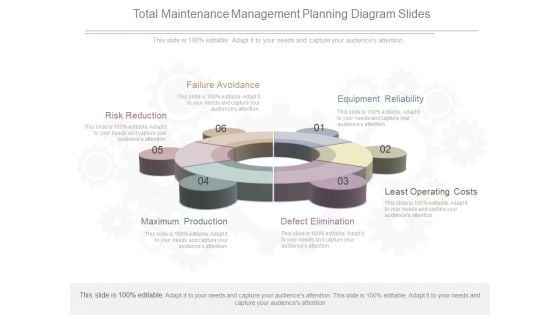
Total Maintenance Management Planning Diagram Slides
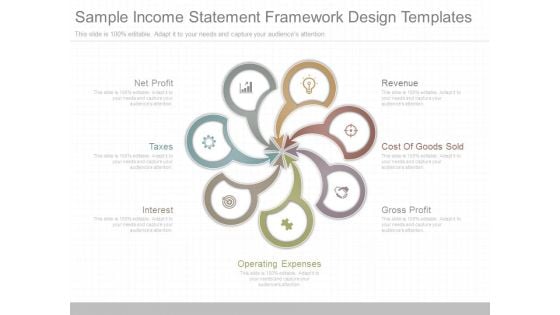
Sample Income Statement Framework Design Templates
This is a sample income statement framework design templates. This is a seven stage process. The stages in this process are net profit, taxes, interest, revenue, cost of goods sold, gross profit, operating expenses.
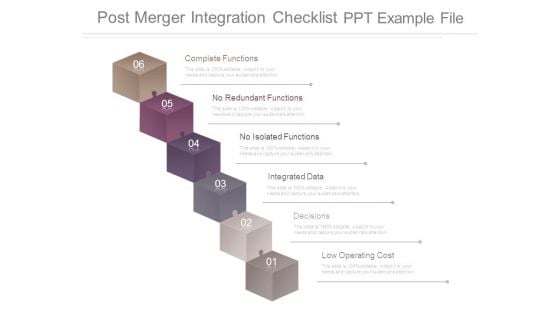
Post Merger Integration Checklist Ppt Example File
This is a post merger integration checklist ppt example file. This is a six stage process. The stages in this process are complete functions, no redundant functions, no isolated functions, integrated data, decisions, low operating cost.
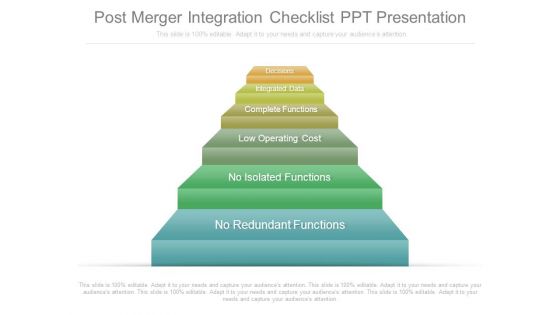
Post Merger Integration Checklist Ppt Presentation
This is a post merger integration checklist ppt presentation. This is a six stage process. The stages in this process are decisions, integrated data, complete functions, low operating cost, no isolated functions, no redundant functions.
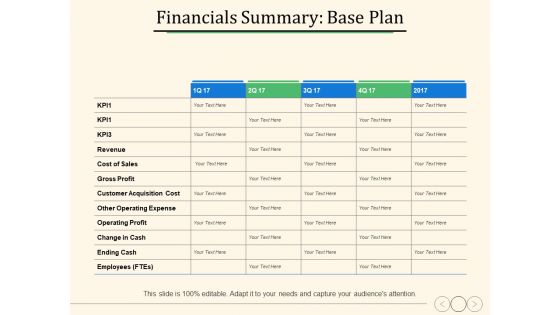
Financials Summary Base Plan Ppt PowerPoint Presentation Ideas Professional
This is a financials summary base plan ppt powerpoint presentation ideas professional. This is a five stage process. The stages in this process are operating profit, customer acquisition cost, business, marketing.
Financials Summary Stretch Plan Ppt PowerPoint Presentation Icon Shapes
This is a financials summary stretch plan ppt powerpoint presentation icon shapes. This is a five stage process. The stages in this process are operating profit, customer acquisition cost, change in cash.
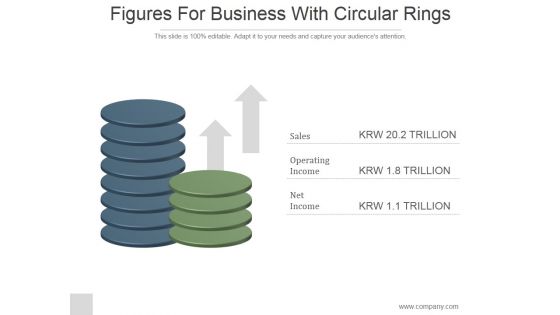
Figures For Business With Circular Rings Ppt PowerPoint Presentation Inspiration
This is a figures for business with circular rings ppt powerpoint presentation inspiration. This is a two stage process. The stages in this process are sales, operating income, net income.
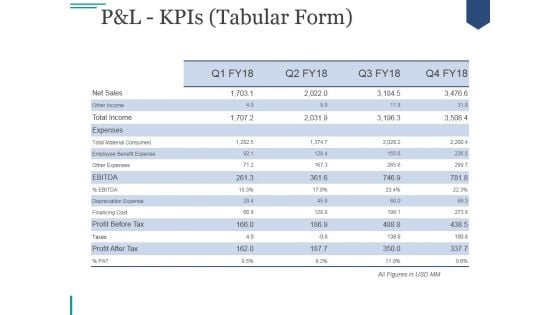
Pandl Kpis Tabular Form Ppt PowerPoint Presentation Visual Aids
This is a pandl kpis tabular form ppt powerpoint presentation visual aids. This is a four stage process. The stages in this process are revenue, cogs, operating profit, net profit.
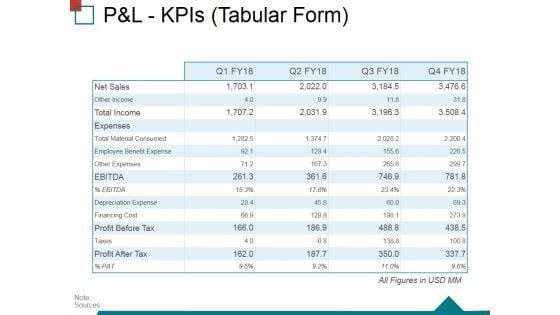
Pandl Kpis Tabular Form Ppt PowerPoint Presentation Ideas Structure
This is a pandl kpis tabular form ppt powerpoint presentation ideas structure. This is a four stage process. The stages in this process are operating profit, revenue, cogs, net profit.
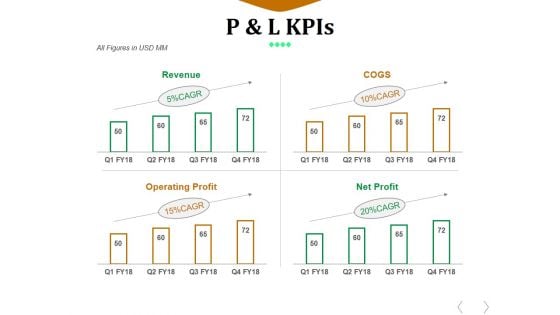
P And L Kpis Template 1 Ppt PowerPoint Presentation Design Ideas
This is a p and l kpis template 1 ppt powerpoint presentation design ideas. This is a four stage process. The stages in this process are revenue, cogs, operating profit, net profit.
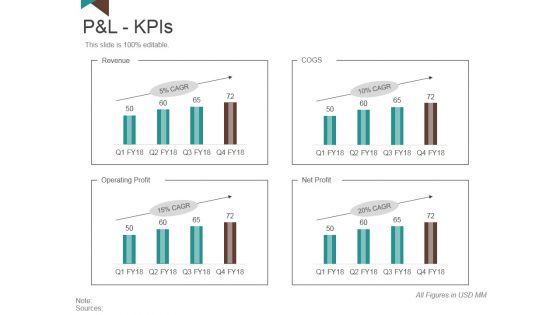
P And L Kpis Template 1 Ppt PowerPoint Presentation Slides Model
This is a p and l kpis template 1 ppt powerpoint presentation slides model. This is a four stage process. The stages in this process are revenue, operating profit, net profit, cogs.
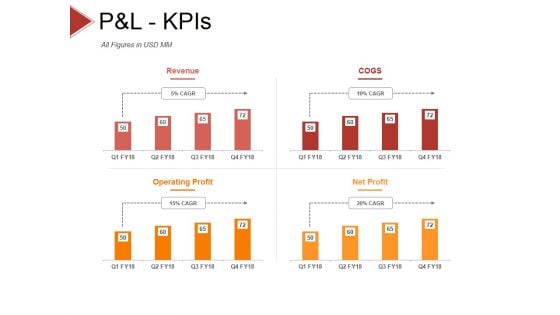
P And L Kpis Template 2 Ppt PowerPoint Presentation Styles Objects
This is a p and l kpis template 2 ppt powerpoint presentation styles objects. This is a four stage process. The stages in this process are revenue, cogs, operating profit, net profit.

P And L Kpis Template 1 Ppt PowerPoint Presentation Model Inspiration
This is a p and l kpis template 1 ppt powerpoint presentation model inspiration. This is a four stage process. The stages in this process are revenue, cogs, operating profit, net profit.
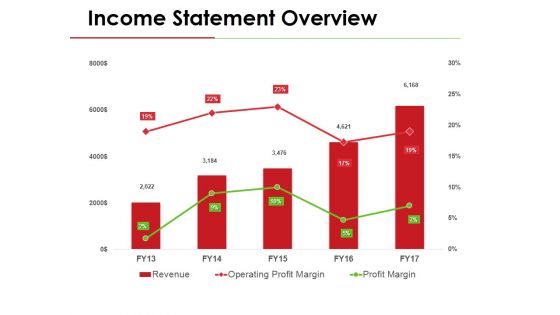
Income Statement Overview Ppt PowerPoint Presentation Gallery Template
This is a income statement overview ppt powerpoint presentation gallery template. This is a three stage process. The stages in this process are revenue, operating profit margin, profit margin.
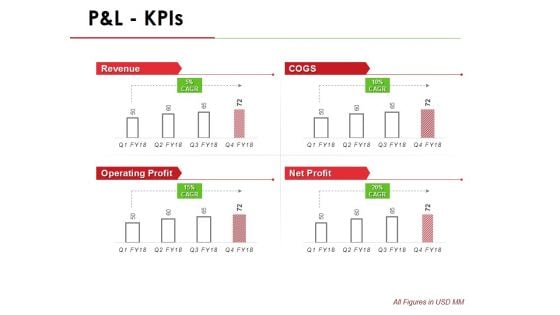
P And L Kpis Template 1 Ppt PowerPoint Presentation Infographic Template Outline
This is a p and l kpis template 1 ppt powerpoint presentation infographic template outline. This is a four stage process. The stages in this process are revenue, operating profit, cogs, net profit.
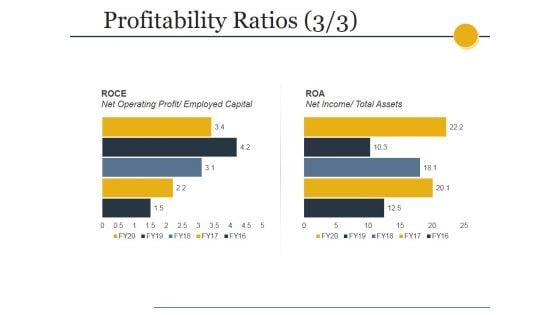
Profitability Ratios Template 3 Ppt PowerPoint Presentation Show Graphics Download
This is a profitability ratios template 3 ppt powerpoint presentation show graphics download. This is a two stage process. The stages in this process are roce, net operating profit, employed capital, roa, net income, total assets.
Pandl Kpis Tabular Form Ppt PowerPoint Presentation Gallery Icon
This is a pandl kpis tabular form ppt powerpoint presentation gallery icon. This is a four stage process. The stages in this process are revenue, cogs, operating profit, net profit.
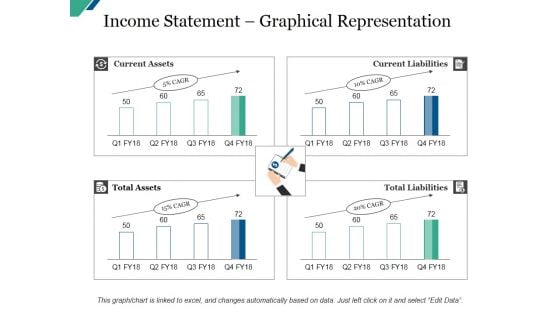
Income Statement Graphical Representation Template Ppt PowerPoint Presentation Model Infographic Template
This is a income statement graphical representation template ppt powerpoint presentation model infographic template. This is a four stage process. The stages in this process are revenue, cogs, operating profit, net profit.


 Continue with Email

 Home
Home


