Operating Cost Icon
Enhance Customer Retention Tracking The Actual Sales Figures After Deal Finalizing Graphics Pdf
This slide provides glimpse about dashboard analysis that can help the business to track the performance of the sales team. It includes KPIs such as revenues, profit, orders placed, conversion placed, conversion rate, customers, etc. Take your projects to the next level with our ultimate collection of Enhance Customer Retention Tracking The Actual Sales Figures After Deal Finalizing Graphics Pdf. Slidegeeks has designed a range of layouts that are perfect for representing task or activity duration, keeping track of all your deadlines at a glance. Tailor these designs to your exact needs and give them a truly corporate look with your own brand colors they well make your projects stand out from the rest. This slide provides glimpse about dashboard analysis that can help the business to track the performance of the sales team. It includes KPIs such as revenues, profit, orders placed, conversion placed, conversion rate, customers, etc.
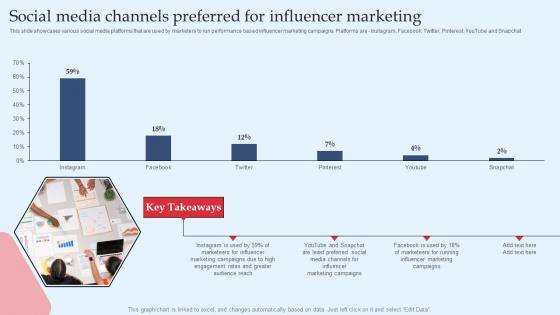
Strategic Performance Marketing Campaign Social Media Channels Preferred Rules Pdf
This slide showcases various social media platforms that are used by marketers to run performance based influencer marketing campaigns. Platforms are Instagram, Facebook, Twitter, Pinterest, YouTube and Snapchat. Do you have to make sure that everyone on your team knows about any specific topic I yes, then you should give Strategic Performance Marketing Campaign Social Media Channels Preferred Rules Pdf a try. Our experts have put a lot of knowledge and effort into creating this impeccable Strategic Performance Marketing Campaign Social Media Channels Preferred Rules Pdf. You can use this template for your upcoming presentations, as the slides are perfect to represent even the tiniest detail. You can download these templates from the Slidegeeks website and these are easy to edit. So grab these today. This slide showcases various social media platforms that are used by marketers to run performance based influencer marketing campaigns. Platforms are Instagram, Facebook, Twitter, Pinterest, YouTube and Snapchat.
Dashboard For Tracking Email Mass Marketing Definitive Guide On Mass Advertising Infographics Pdf
This slide showcases the dashboard for monitoring the email marketing campaign performance. It includes the open rate, click-through rate CTR, bounce rate, conversion ratio, new subscribers, and unsubscribe rate. Do you have to make sure that everyone on your team knows about any specific topic I yes, then you should give Dashboard For Tracking Email Mass Marketing Definitive Guide On Mass Advertising Infographics Pdf a try. Our experts have put a lot of knowledge and effort into creating this impeccable Dashboard For Tracking Email Mass Marketing Definitive Guide On Mass Advertising Infographics Pdf. You can use this template for your upcoming presentations, as the slides are perfect to represent even the tiniest detail. You can download these templates from the Slidegeeks website and these are easy to edit. So grab these today. This slide showcases the dashboard for monitoring the email marketing campaign performance. It includes the open rate, click-through rate CTR, bounce rate, conversion ratio, new subscribers, and unsubscribe rate.
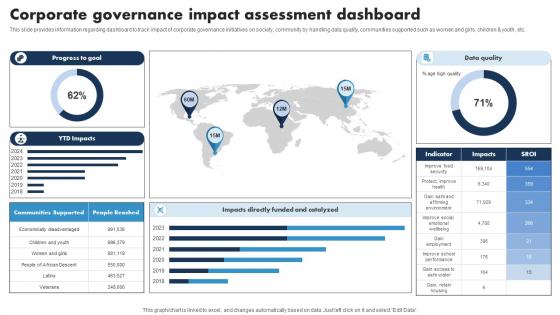
Corporate Governance Impact Assessment Dashboard Responsible Tech Guide To Manage Graphics Pdf
This slide provides information regarding dashboard to track impact of corporate governance initiatives on society, community by handling data quality, communities supported such as women and girls, children and youth, etc. Do you have to make sure that everyone on your team knows about any specific topic I yes, then you should give Corporate Governance Impact Assessment Dashboard Responsible Tech Guide To Manage Graphics Pdf a try. Our experts have put a lot of knowledge and effort into creating this impeccable Corporate Governance Impact Assessment Dashboard Responsible Tech Guide To Manage Graphics Pdf. You can use this template for your upcoming presentations, as the slides are perfect to represent even the tiniest detail. You can download these templates from the Slidegeeks website and these are easy to edit. So grab these today. This slide provides information regarding dashboard to track impact of corporate governance initiatives on society, community by handling data quality, communities supported such as women and girls, children and youth, etc.
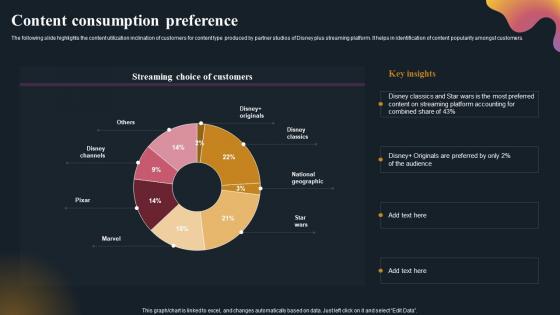
Content Consumption Preference OTT Platform Company Outline Demonstration Pdf
The following slide highlights the content utilization inclination of customers for content type produced by partner studios of Disney plus streaming platform. It helps in identification of content popularity amongst customers. Do you have to make sure that everyone on your team knows about any specific topic I yes, then you should give Content Consumption Preference OTT Platform Company Outline Demonstration Pdf a try. Our experts have put a lot of knowledge and effort into creating this impeccable Content Consumption Preference OTT Platform Company Outline Demonstration Pdf You can use this template for your upcoming presentations, as the slides are perfect to represent even the tiniest detail. You can download these templates from the Slidegeeks website and these are easy to edit. So grab these today The following slide highlights the content utilization inclination of customers for content type produced by partner studios of Disney plus streaming platform. It helps in identification of content popularity amongst customers.
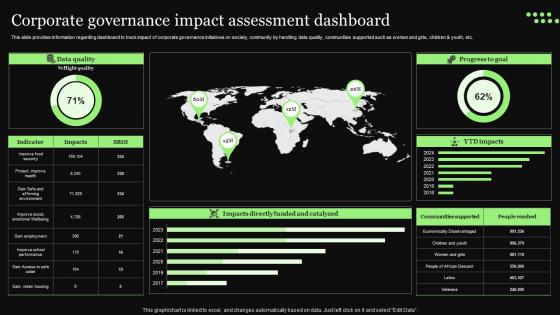
Ethical Technology Utilization Corporate Governance Impact Assessment Dashboard Formats Pdf
This slide provides information regarding dashboard to track impact of corporate governance initiatives on society, community by handling data quality, communities supported such as women and girls, children and youth, etc. Do you have to make sure that everyone on your team knows about any specific topic I yes, then you should give Ethical Technology Utilization Corporate Governance Impact Assessment Dashboard Formats Pdf a try. Our experts have put a lot of knowledge and effort into creating this impeccable Ethical Technology Utilization Corporate Governance Impact Assessment Dashboard Formats Pdf. You can use this template for your upcoming presentations, as the slides are perfect to represent even the tiniest detail. You can download these templates from the Slidegeeks website and these are easy to edit. So grab these today This slide provides information regarding dashboard to track impact of corporate governance initiatives on society, community by handling data quality, communities supported such as women and girls, children and youth, etc.
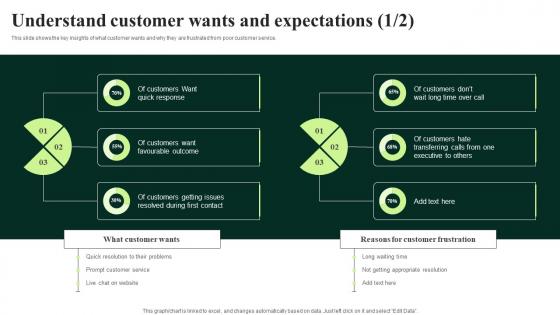
Client Feedback Strategies Understand Customer Wants And Expectations Graphics Pdf
This slide shows the key insights of what customer wants and why they are frustrated from poor customer service. Do you have to make sure that everyone on your team knows about any specific topic I yes, then you should give Client Feedback Strategies Understand Customer Wants And Expectations Graphics Pdf a try. Our experts have put a lot of knowledge and effort into creating this impeccable Client Feedback Strategies Understand Customer Wants And Expectations Graphics Pdf. You can use this template for your upcoming presentations, as the slides are perfect to represent even the tiniest detail. You can download these templates from the Slidegeeks website and these are easy to edit. So grab these today This slide shows the key insights of what customer wants and why they are frustrated from poor customer service.
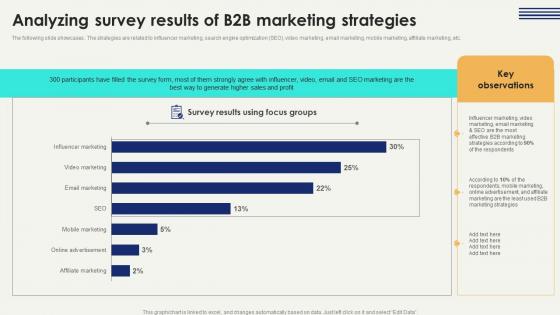
Analyzing Survey Results Digital Marketing Strategies To Improve Enterprise Sales Designs Pdf
The following slide showcases . The strategies are related to influencer marketing, search engine optimization SEO, video marketing, email marketing, mobile marketing, affiliate marketing, etc. Do you have to make sure that everyone on your team knows about any specific topic I yes, then you should give Analyzing Survey Results Digital Marketing Strategies To Improve Enterprise Sales Designs Pdf a try. Our experts have put a lot of knowledge and effort into creating this impeccable Analyzing Survey Results Digital Marketing Strategies To Improve Enterprise Sales Designs Pdf. You can use this template for your upcoming presentations, as the slides are perfect to represent even the tiniest detail. You can download these templates from the Slidegeeks website and these are easy to edit. So grab these today The following slide showcases . The strategies are related to influencer marketing, search engine optimization SEO, video marketing, email marketing, mobile marketing, affiliate marketing, etc.
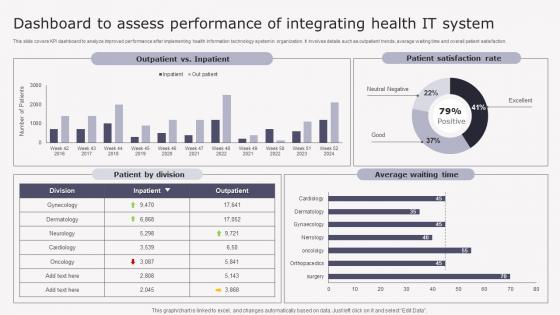
Transforming Medicare Services Using Health Dashboard To Assess Performance Introduction Pdf
This slide covers KPI dashboard to analyze improved performance after implementing health information technology system in organization. It involves details such as outpatient trends, average waiting time and overall patient satisfaction. Do you have to make sure that everyone on your team knows about any specific topic I yes, then you should give Transforming Medicare Services Using Health Dashboard To Assess Performance Introduction Pdf a try. Our experts have put a lot of knowledge and effort into creating this impeccable Transforming Medicare Services Using Health Dashboard To Assess Performance Introduction Pdf. You can use this template for your upcoming presentations, as the slides are perfect to represent even the tiniest detail. You can download these templates from the Slidegeeks website and these are easy to edit. So grab these today This slide covers KPI dashboard to analyze improved performance after implementing health information technology system in organization. It involves details such as outpatient trends, average waiting time and overall patient satisfaction.
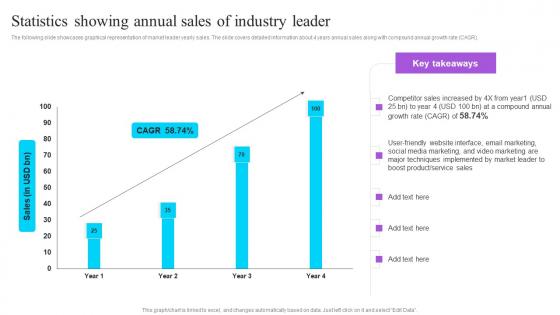
Statistics Showing Annual Sales Of Industry Leader Effective GTM Techniques Formats PDF
The following slide showcases graphical representation of market leader yearly sales. The slide covers detailed information about 4 years annual sales along with compound annual growth rate CAGR. Do you have to make sure that everyone on your team knows about any specific topic I yes, then you should give Statistics Showing Annual Sales Of Industry Leader Effective GTM Techniques Formats PDF a try. Our experts have put a lot of knowledge and effort into creating this impeccable Statistics Showing Annual Sales Of Industry Leader Effective GTM Techniques Formats PDF. You can use this template for your upcoming presentations, as the slides are perfect to represent even the tiniest detail. You can download these templates from the Slidegeeks website and these are easy to edit. So grab these today The following slide showcases graphical representation of market leader yearly sales. The slide covers detailed information about 4 years annual sales along with compound annual growth rate CAGR.
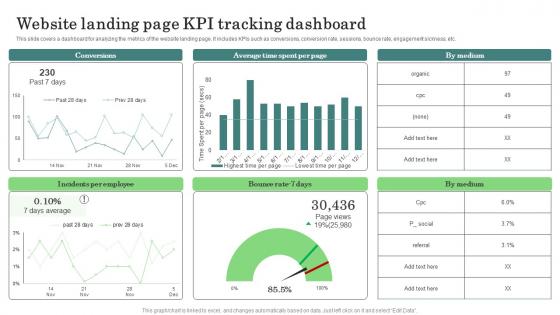
Website Landing Page KPI Major Promotional Analytics Future Trends Microsoft Pdf
This slide covers a dashboard for analyzing the metrics of the website landing page. It includes KPIs such as conversions, conversion rate, sessions, bounce rate, engagement sickness, etc. Do you have to make sure that everyone on your team knows about any specific topic I yes, then you should give Website Landing Page KPI Major Promotional Analytics Future Trends Microsoft Pdf a try. Our experts have put a lot of knowledge and effort into creating this impeccable Website Landing Page KPI Major Promotional Analytics Future Trends Microsoft Pdf. You can use this template for your upcoming presentations, as the slides are perfect to represent even the tiniest detail. You can download these templates from the Slidegeeks website and these are easy to edit. So grab these today This slide covers a dashboard for analyzing the metrics of the website landing page. It includes KPIs such as conversions, conversion rate, sessions, bounce rate, engagement sickness, etc.
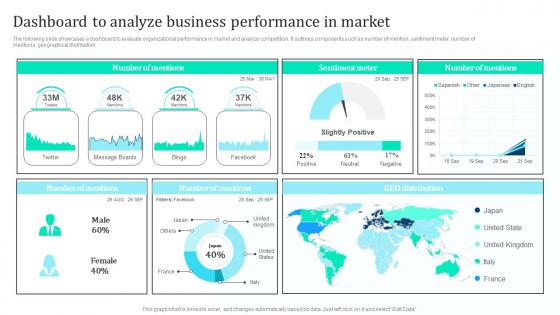
Dashboard Analyze Business Performance Marketing Intelligence Guide Data Gathering Microsoft Pdf
The following slide showcases a dashboard to evaluate organizational performance in market and analyze competition. It outlines components such as number of mention, sentiment meter, number of mentions, geographical distribution. Do you have to make sure that everyone on your team knows about any specific topic I yes, then you should give Dashboard Analyze Business Performance Marketing Intelligence Guide Data Gathering Microsoft Pdf a try. Our experts have put a lot of knowledge and effort into creating this impeccable Dashboard Analyze Business Performance Marketing Intelligence Guide Data Gathering Microsoft Pdf. You can use this template for your upcoming presentations, as the slides are perfect to represent even the tiniest detail. You can download these templates from the Slidegeeks website and these are easy to edit. So grab these today The following slide showcases a dashboard to evaluate organizational performance in market and analyze competition. It outlines components such as number of mention, sentiment meter, number of mentions, geographical distribution.
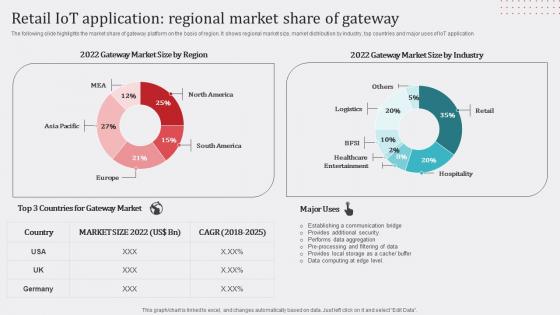
Retail IoT Application Regional Market Share Of Gateway Demonstration Pdf
The following slide highlights the market share of gateway platform on the basis of region. It shows regional market size, market distribution by industry, top countries and major uses of IoT application Take your projects to the next level with our ultimate collection of Retail IoT Application Regional Market Share Of Gateway Demonstration Pdf. Slidegeeks has designed a range of layouts that are perfect for representing task or activity duration, keeping track of all your deadlines at a glance. Tailor these designs to your exact needs and give them a truly corporate look with your own brand colors they will make your projects stand out from the rest The following slide highlights the market share of gateway platform on the basis of region. It shows regional market size, market distribution by industry, top countries and major uses of IoT application
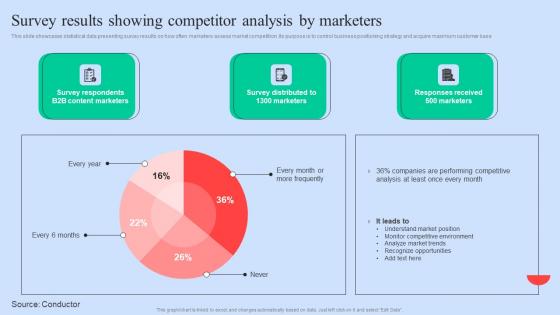
Survey Results Showing Executing Competitors Strategies To Assess Organizational Performance Download Pdf
This slide showcases statistical data presenting survey results on how often marketers assess market competition. Its purpose is to control business positioning strategy and acquire maximum customer base Take your projects to the next level with our ultimate collection of Survey Results Showing Executing Competitors Strategies To Assess Organizational Performance Download Pdf. Slidegeeks has designed a range of layouts that are perfect for representing task or activity duration, keeping track of all your deadlines at a glance. Tailor these designs to your exact needs and give them a truly corporate look with your own brand colors they will make your projects stand out from the rest This slide showcases statistical data presenting survey results on how often marketers assess market competition. Its purpose is to control business positioning strategy and acquire maximum customer base
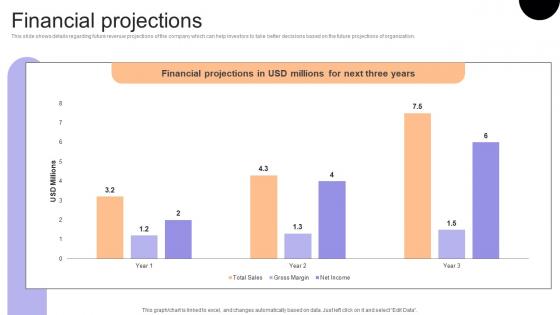
Financial Projections Financial Consulting Platform Fundraising Pitch Deck Formats Pdf
This slide shows details regarding future revenue projections of the company which can help investors to take better decisions based on the future projections of organization. Do you have to make sure that everyone on your team knows about any specific topic I yes, then you should give Financial Projections Financial Consulting Platform Fundraising Pitch Deck Formats Pdf a try. Our experts have put a lot of knowledge and effort into creating this impeccable Financial Projections Financial Consulting Platform Fundraising Pitch Deck Formats Pdf. You can use this template for your upcoming presentations, as the slides are perfect to represent even the tiniest detail. You can download these templates from the Slidegeeks website and these are easy to edit. So grab these today This slide shows details regarding future revenue projections of the company which can help investors to take better decisions based on the future projections of organization.
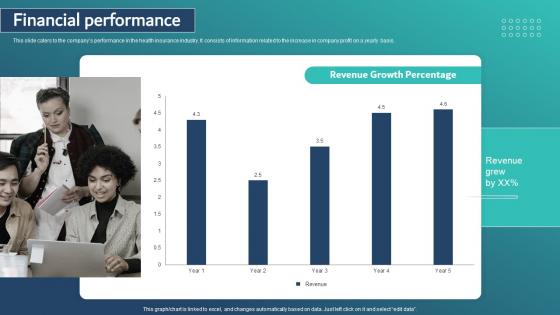
Financial Performance Healthcare Insurance App Capital Raising Pitch Deck Portrait Pdf
This slide caters to the companys performance in the health insurance industry. It consists of information related to the increase in company profit on a yearly basis. Take your projects to the next level with our ultimate collection of Financial Performance Healthcare Insurance App Capital Raising Pitch Deck Portrait Pdf. Slidegeeks has designed a range of layouts that are perfect for representing task or activity duration, keeping track of all your deadlines at a glance. Tailor these designs to your exact needs and give them a truly corporate look with your own brand colors they will make your projects stand out from the rest This slide caters to the companys performance in the health insurance industry. It consists of information related to the increase in company profit on a yearly basis.
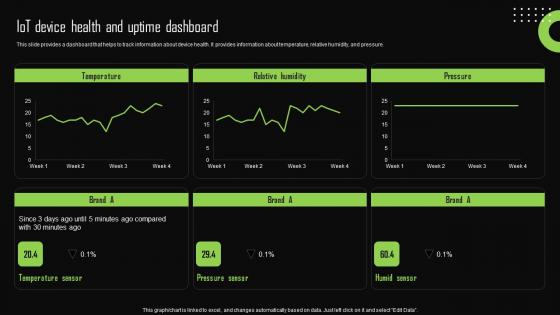
Iot Device Health And Uptime Dashboard Iot Device Management Graphics Pdf
This slide provides a dashboard that helps to track information about device health. It provides information about temperature, relative humidity, and pressure. Take your projects to the next level with our ultimate collection of Iot Device Health And Uptime Dashboard Iot Device Management Graphics Pdf. Slidegeeks has designed a range of layouts that are perfect for representing task or activity duration, keeping track of all your deadlines at a glance. Tailor these designs to your exact needs and give them a truly corporate look with your own brand colors they will make your projects stand out from the rest This slide provides a dashboard that helps to track information about device health. It provides information about temperature, relative humidity, and pressure.
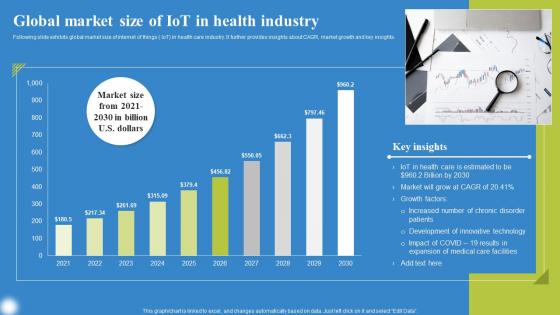
Global Market Size Of IoT In Health Deploying IoT Solutions For Enhanced Healthcare Formats Pdf
Following slide exhibits global market size of internet of things IoT in health care industry. It further provides insights about CAGR, market growth and key insights. Take your projects to the next level with our ultimate collection of Global Market Size Of IoT In Health Deploying IoT Solutions For Enhanced Healthcare Formats Pdf. Slidegeeks has designed a range of layouts that are perfect for representing task or activity duration, keeping track of all your deadlines at a glance. Tailor these designs to your exact needs and give them a truly corporate look with your own brand colors they will make your projects stand out from the rest Following slide exhibits global market size of internet of things IoT in health care industry. It further provides insights about CAGR, market growth and key insights.
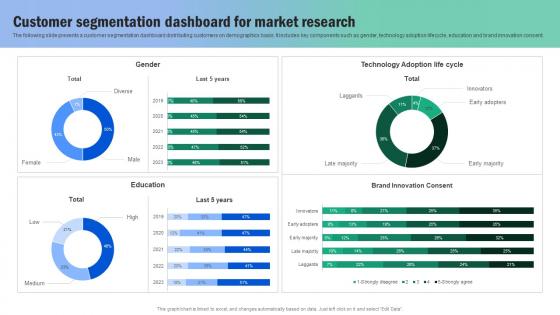
Customer Segmentation Dashboard For Market Research Guide For Segmenting And Formulating Designs Pdf
The following slide presents a customer segmentation dashboard distributing customers on demographics basis. It includes key components such as gender, technology adoption lifecycle, education and brand innovation consent. Do you have to make sure that everyone on your team knows about any specific topic I yes, then you should give Customer Segmentation Dashboard For Market Research Guide For Segmenting And Formulating Designs Pdf a try. Our experts have put a lot of knowledge and effort into creating this impeccable Customer Segmentation Dashboard For Market Research Guide For Segmenting And Formulating Designs Pdf. You can use this template for your upcoming presentations, as the slides are perfect to represent even the tiniest detail. You can download these templates from the Slidegeeks website and these are easy to edit. So grab these today. The following slide presents a customer segmentation dashboard distributing customers on demographics basis. It includes key components such as gender, technology adoption lifecycle, education and brand innovation consent.
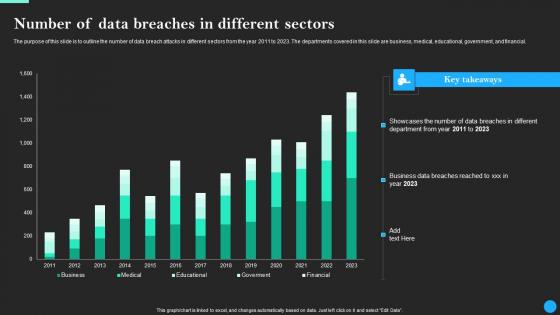
Number Of Data Breaches In Different Sectors Data Breach Prevention Microsoft Pdf
The purpose of this slide is to outline the number of data breach attacks in different sectors from the year 2011 to 2023. The departments covered in this slide are business, medical, educational, government, and financial. Take your projects to the next level with our ultimate collection of Number Of Data Breaches In Different Sectors Data Breach Prevention Microsoft Pdf. Slidegeeks has designed a range of layouts that are perfect for representing task or activity duration, keeping track of all your deadlines at a glance. Tailor these designs to your exact needs and give them a truly corporate look with your own brand colors they will make your projects stand out from the rest The purpose of this slide is to outline the number of data breach attacks in different sectors from the year 2011 to 2023. The departments covered in this slide are business, medical, educational, government, and financial.
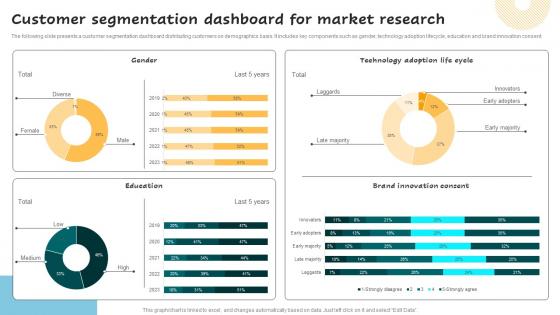
Customer Segmentation Dashboard Successful Guide For Market Segmentation Background Pdf
The following slide presents a customer segmentation dashboard distributing customers on demographics basis. It includes key components such as gender, technology adoption lifecycle, education and brand innovation consent. Do you have to make sure that everyone on your team knows about any specific topic I yes, then you should give Customer Segmentation Dashboard Successful Guide For Market Segmentation Background Pdf a try. Our experts have put a lot of knowledge and effort into creating this impeccable Customer Segmentation Dashboard Successful Guide For Market Segmentation Background Pdf. You can use this template for your upcoming presentations, as the slides are perfect to represent even the tiniest detail. You can download these templates from the Slidegeeks website and these are easy to edit. So grab these today. The following slide presents a customer segmentation dashboard distributing customers on demographics basis. It includes key components such as gender, technology adoption lifecycle, education and brand innovation consent.
Dashboard For Tracking Email Mass Marketing Campaign In Depth Overview Of Mass Slides Pdf
This slide showcases the dashboard for monitoring the email marketing campaign performance. It includes the open rate, click-through rate CTR, bounce rate, conversion ratio, new subscribers, and unsubscribe rate. Do you have to make sure that everyone on your team knows about any specific topic I yes, then you should give Dashboard For Tracking Email Mass Marketing Campaign In Depth Overview Of Mass Slides Pdf a try. Our experts have put a lot of knowledge and effort into creating this impeccable Dashboard For Tracking Email Mass Marketing Campaign In Depth Overview Of Mass Slides Pdf You can use this template for your upcoming presentations, as the slides are perfect to represent even the tiniest detail. You can download these templates from the Slidegeeks website and these are easy to edit. So grab these today. This slide showcases the dashboard for monitoring the email marketing campaign performance. It includes the open rate, click-through rate CTR, bounce rate, conversion ratio, new subscribers, and unsubscribe rate.
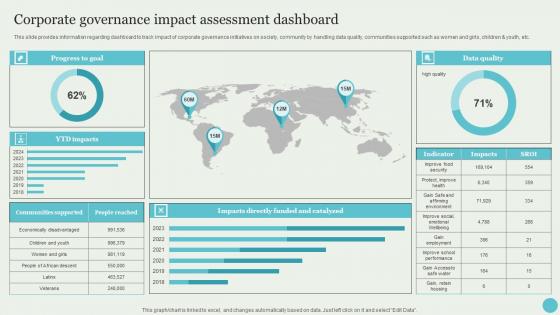
Corporate Governance Impact Assessment Dashboard Crafting A Sustainable Company Designs Pdf
This slide provides information regarding dashboard to track impact of corporate governance initiatives on society, community by handling data quality, communities supported such as women and girls, children and youth, etc. Do you have to make sure that everyone on your team knows about any specific topic I yes, then you should give Corporate Governance Impact Assessment Dashboard Crafting A Sustainable Company Designs Pdf a try. Our experts have put a lot of knowledge and effort into creating this impeccable Corporate Governance Impact Assessment Dashboard Crafting A Sustainable Company Designs Pdf. You can use this template for your upcoming presentations, as the slides are perfect to represent even the tiniest detail. You can download these templates from the Slidegeeks website and these are easy to edit. So grab these today This slide provides information regarding dashboard to track impact of corporate governance initiatives on society, community by handling data quality, communities supported such as women and girls, children and youth, etc.
Online And Offline Marketing Techniques Timeline Agricultural Product Promotion Structure Pdf
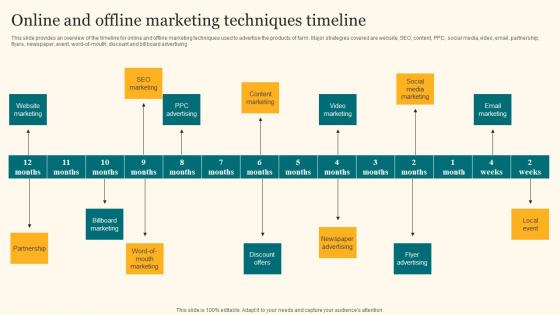
This slide provides an overview of the timeline for online and offline marketing techniques used to advertise the products of farm. Major strategies covered are website, SEO, content, PPC, social media, video, email, partnership, flyers, newspaper, event, word-of-mouth, discount and billboard advertising. Take your projects to the next level with our ultimate collection of Online And Offline Marketing Techniques Timeline Agricultural Product Promotion Structure Pdf. Slidegeeks has designed a range of layouts that are perfect for representing task or activity duration, keeping track of all your deadlines at a glance. Tailor these designs to your exact needs and give them a truly corporate look with your own brand colors they will make your projects stand out from the rest This slide provides an overview of the timeline for online and offline marketing techniques used to advertise the products of farm. Major strategies covered are website, SEO, content, PPC, social media, video, email, partnership, flyers, newspaper, event, word-of-mouth, discount and billboard advertising.
New Call Centres Opened Or Expanded By Region IT And Tech Support Business Portrait Pdf
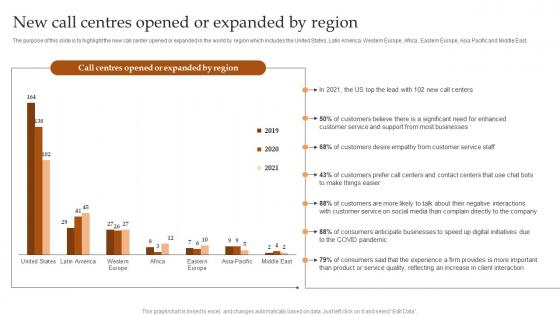
The purpose of this slide is to highlight the new call center opened or expanded in the world by region which includes the United States, Latin America, Western Europe, Africa, Eastern Europe, Asia Pacific and Middle East. Take your projects to the next level with our ultimate collection of New Call Centres Opened Or Expanded By Region IT And Tech Support Business Portrait Pdf Slidegeeks has designed a range of layouts that are perfect for representing task or activity duration, keeping track of all your deadlines at a glance. Tailor these designs to your exact needs and give them a truly corporate look with your own brand colors they well make your projects stand out from the rest. The purpose of this slide is to highlight the new call center opened or expanded in the world by region which includes the United States, Latin America, Western Europe, Africa, Eastern Europe, Asia Pacific and Middle East.
Financial Projection Platform As A Service Paas Business Model BMC SS V
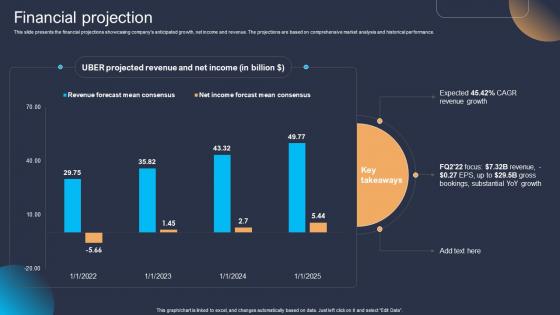
This slide presents the financial projections showcasing companys anticipated growth, net income and revenue. The projections are based on comprehensive market analysis and historical performance. Do you have to make sure that everyone on your team knows about any specific topic I yes, then you should give Financial Projection Platform As A Service Paas Business Model BMC SS V a try. Our experts have put a lot of knowledge and effort into creating this impeccable Financial Projection Platform As A Service Paas Business Model BMC SS V. You can use this template for your upcoming presentations, as the slides are perfect to represent even the tiniest detail. You can download these templates from the Slidegeeks website and these are easy to edit. So grab these today This slide presents the financial projections showcasing companys anticipated growth, net income and revenue. The projections are based on comprehensive market analysis and historical performance.
Total Assets Food Delivery Company Profile CP SS V
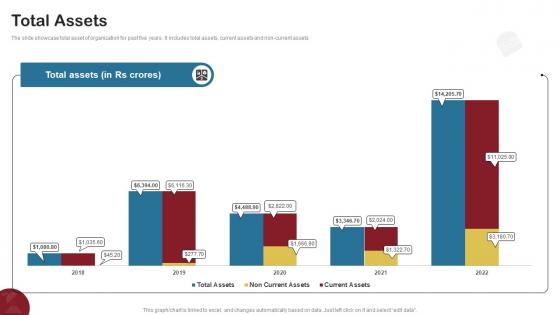
The slide showcase total asset of organization for past five years. It includes total assets, current assets and non-current assets.Do you have to make sure that everyone on your team knows about any specific topic I yes, then you should give Total Assets Food Delivery Company Profile CP SS V a try. Our experts have put a lot of knowledge and effort into creating this impeccable Total Assets Food Delivery Company Profile CP SS V. You can use this template for your upcoming presentations, as the slides are perfect to represent even the tiniest detail. You can download these templates from the Slidegeeks website and these are easy to edit. So grab these today The slide showcase total asset of organization for past five years. It includes total assets, current assets and non-current assets.
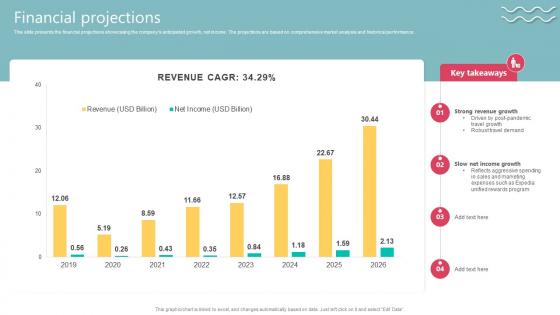
Financial Projections Travel Technology Company Business Model BMC SS V
This slide presents the financial projections showcasing the companys anticipated growth, net income. The projections are based on comprehensive market analysis and historical performance. Do you have to make sure that everyone on your team knows about any specific topic I yes, then you should give Financial Projections Travel Technology Company Business Model BMC SS V a try. Our experts have put a lot of knowledge and effort into creating this impeccable Financial Projections Travel Technology Company Business Model BMC SS V. You can use this template for your upcoming presentations, as the slides are perfect to represent even the tiniest detail. You can download these templates from the Slidegeeks website and these are easy to edit. So grab these today This slide presents the financial projections showcasing the companys anticipated growth, net income. The projections are based on comprehensive market analysis and historical performance.
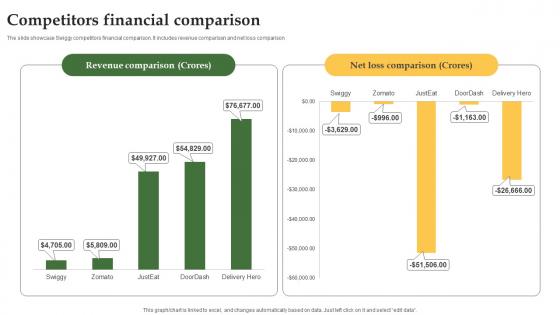
Competitors Financial Comparison Grocery Delivery Company Profile CP SS V
The slide showcase Swiggy competitors financial comparison. It includes revenue comparison and net loss comparison. Do you have to make sure that everyone on your team knows about any specific topic I yes, then you should give Competitors Financial Comparison Grocery Delivery Company Profile CP SS V a try. Our experts have put a lot of knowledge and effort into creating this impeccable Competitors Financial Comparison Grocery Delivery Company Profile CP SS V. You can use this template for your upcoming presentations, as the slides are perfect to represent even the tiniest detail. You can download these templates from the Slidegeeks website and these are easy to edit. So grab these today The slide showcase Swiggy competitors financial comparison. It includes revenue comparison and net loss comparison.
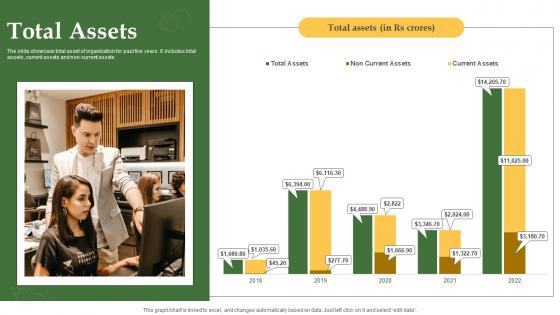
Total Assets Grocery Delivery Company Profile CP SS V
The slide showcase total asset of organization for past five years. It includes total assets, current assets and non-current assets. Do you have to make sure that everyone on your team knows about any specific topic I yes, then you should give Total Assets Grocery Delivery Company Profile CP SS V a try. Our experts have put a lot of knowledge and effort into creating this impeccable Total Assets Grocery Delivery Company Profile CP SS V. You can use this template for your upcoming presentations, as the slides are perfect to represent even the tiniest detail. You can download these templates from the Slidegeeks website and these are easy to edit. So grab these today The slide showcase total asset of organization for past five years. It includes total assets, current assets and non-current assets.
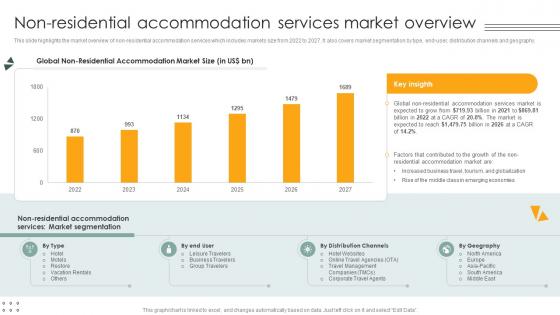
Non Residential Accommodation Services Market Overview Lodging And Accommodation Industry IR SS V
This slide highlights the market overview of non-residential accommodation services which includes markets size from 2022 to 2027. It also covers market segmentation by type, end-user, distribution channels and geography. Take your projects to the next level with our ultimate collection of Non Residential Accommodation Services Market Overview Lodging And Accommodation Industry IR SS V. Slidegeeks has designed a range of layouts that are perfect for representing task or activity duration, keeping track of all your deadlines at a glance. Tailor these designs to your exact needs and give them a truly corporate look with your own brand colors they will make your projects stand out from the rest This slide highlights the market overview of non-residential accommodation services which includes markets size from 2022 to 2027. It also covers market segmentation by type, end-user, distribution channels and geography.
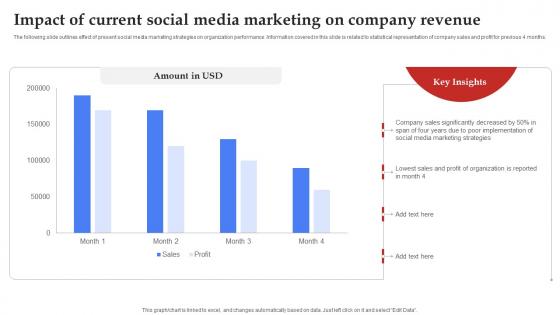
Facebook Marketing Plan Impact Of Current Social Media Marketing Strategy SS V
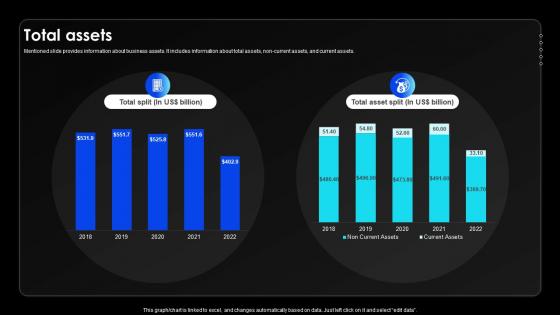
Total Assets Wireless Communication Services Provider Company Profile CP SS V
Mentioned slide provides information about business assets. It includes information about total assets, non-current assets, and current assets.Do you have to make sure that everyone on your team knows about any specific topic I yes, then you should give Total Assets Wireless Communication Services Provider Company Profile CP SS V a try. Our experts have put a lot of knowledge and effort into creating this impeccable Total Assets Wireless Communication Services Provider Company Profile CP SS V. You can use this template for your upcoming presentations, as the slides are perfect to represent even the tiniest detail. You can download these templates from the Slidegeeks website and these are easy to edit. So grab these today Mentioned slide provides information about business assets. It includes information about total assets, non-current assets, and current assets.
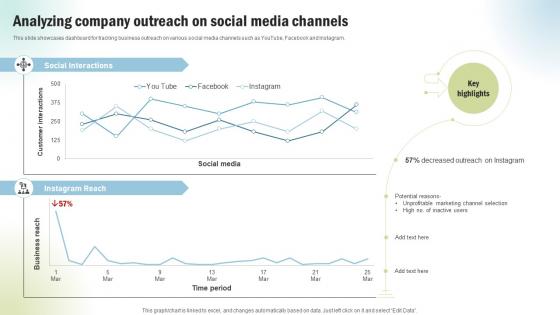
Marketing Project Performance Benchmarking To Enhance Analyzing Company Outreach CRP SS V
This slide showcases dashboard for tracking business outreach on various social media channels such as YouTube, Facebook and Instagram. Do you have to make sure that everyone on your team knows about any specific topic I yes, then you should give Marketing Project Performance Benchmarking To Enhance Analyzing Company Outreach CRP SS V a try. Our experts have put a lot of knowledge and effort into creating this impeccable Marketing Project Performance Benchmarking To Enhance Analyzing Company Outreach CRP SS V. You can use this template for your upcoming presentations, as the slides are perfect to represent even the tiniest detail. You can download these templates from the Slidegeeks website and these are easy to edit. So grab these today This slide showcases dashboard for tracking business outreach on various social media channels such as YouTube, Facebook and Instagram.

Increasing Business Awareness Introducing Social Media Marketing For Creating Strategy SS V
This slide presents an overview of social media marketing. It also include a graph showcasing the associated benefits of social media for insurers such as marketing, customer service, new sales leads, fraud detection and risk selection. Take your projects to the next level with our ultimate collection of Increasing Business Awareness Introducing Social Media Marketing For Creating Strategy SS V. Slidegeeks has designed a range of layouts that are perfect for representing task or activity duration, keeping track of all your deadlines at a glance. Tailor these designs to your exact needs and give them a truly corporate look with your own brand colors they will make your projects stand out from the rest This slide presents an overview of social media marketing. It also include a graph showcasing the associated benefits of social media for insurers such as marketing, customer service, new sales leads, fraud detection and risk selection
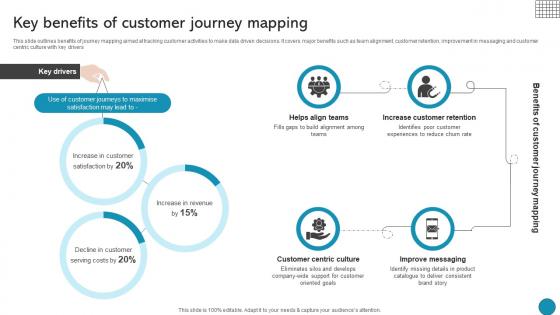
Key Benefits Of Customer Journey Mapping Driving Business Success Integrating Product
This slide outlines benefits of journey mapping aimed at tracking customer activities to make data driven decisions. It covers major benefits such as team alignment, customer retention, improvement in messaging and customer centric culture with key drivers Take your projects to the next level with our ultimate collection of Key Benefits Of Customer Journey Mapping Driving Business Success Integrating Product. Slidegeeks has designed a range of layouts that are perfect for representing task or activity duration, keeping track of all your deadlines at a glance. Tailor these designs to your exact needs and give them a truly corporate look with your own brand colors they will make your projects stand out from the rest This slide outlines benefits of journey mapping aimed at tracking customer activities to make data driven decisions. It covers major benefits such as team alignment, customer retention, improvement in messaging and customer centric culture with key drivers
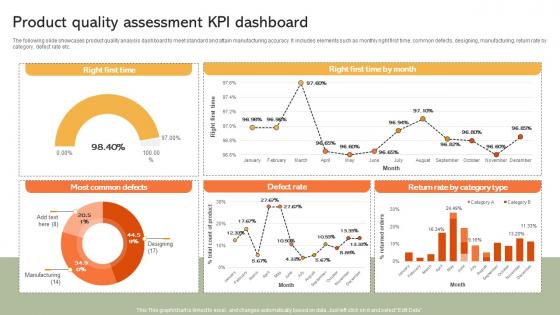
Product Quality Assessment KPI Dashboard Implementing Manufacturing Strategy SS V
The following slide showcases product quality analysis dashboard to meet standard and attain manufacturing accuracy. It includes elements such as monthly right first time, common defects, designing, manufacturing, return rate by category, defect rate etc. Take your projects to the next level with our ultimate collection of Product Quality Assessment KPI Dashboard Implementing Manufacturing Strategy SS V. Slidegeeks has designed a range of layouts that are perfect for representing task or activity duration, keeping track of all your deadlines at a glance. Tailor these designs to your exact needs and give them a truly corporate look with your own brand colors they will make your projects stand out from the rest The following slide showcases product quality analysis dashboard to meet standard and attain manufacturing accuracy. It includes elements such as monthly right first time, common defects, designing, manufacturing, return rate by category, defect rate etc.
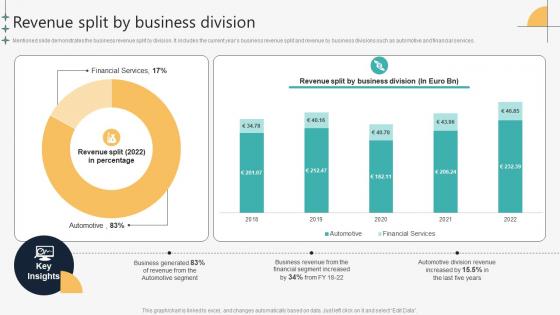
Revenue Split By Business Division Automotive Manufacturing Company Profile CP SS V
Mentioned slide demonstrates the business revenue split by division. It includes the current years business revenue split and revenue by business divisions such as automotive and financial services.Take your projects to the next level with our ultimate collection of Revenue Split By Business Division Automotive Manufacturing Company Profile CP SS V. Slidegeeks has designed a range of layouts that are perfect for representing task or activity duration, keeping track of all your deadlines at a glance. Tailor these designs to your exact needs and give them a truly corporate look with your own brand colors they will make your projects stand out from the rest Mentioned slide demonstrates the business revenue split by division. It includes the current years business revenue split and revenue by business divisions such as automotive and financial services.
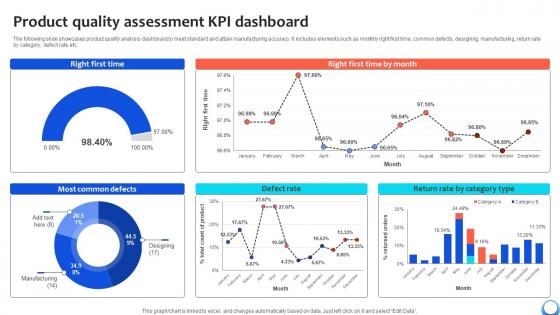
Product Quality Assessment KPI Dashboard Automating Production Process Strategy SS V
The following slide showcases product quality analysis dashboard to meet standard and attain manufacturing accuracy. It includes elements such as monthly right first time, common defects, designing, manufacturing, return rate by category, defect rate etc. Take your projects to the next level with our ultimate collection of Product Quality Assessment KPI Dashboard Automating Production Process Strategy SS V. Slidegeeks has designed a range of layouts that are perfect for representing task or activity duration, keeping track of all your deadlines at a glance. Tailor these designs to your exact needs and give them a truly corporate look with your own brand colors they will make your projects stand out from the rest The following slide showcases product quality analysis dashboard to meet standard and attain manufacturing accuracy. It includes elements such as monthly right first time, common defects, designing, manufacturing, return rate by category, defect rate etc.
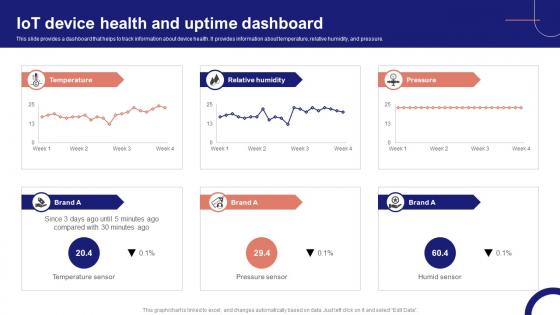
IoT Device Management Fundamentals IoT Device Health And Uptime Dashboard IoT Ss V
This slide provides a dashboard that helps to track information about device health. It provides information about temperature, relative humidity, and pressure. Take your projects to the next level with our ultimate collection of IoT Device Management Fundamentals IoT Device Health And Uptime Dashboard IoT SS V. Slidegeeks has designed a range of layouts that are perfect for representing task or activity duration, keeping track of all your deadlines at a glance. Tailor these designs to your exact needs and give them a truly corporate look with your own brand colors they will make your projects stand out from the rest This slide provides a dashboard that helps to track information about device health. It provides information about temperature, relative humidity, and pressure.
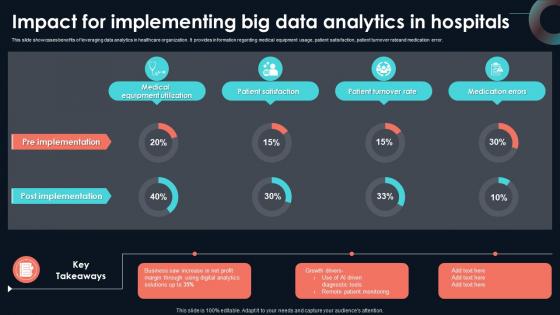
Impact For Implementing Big Data Analytics Developing Strategic Insights Using Big Data Analytics SS V
This slide showcases benefits of leveraging data analytics in healthcare organization. It provides information regarding medical equipment usage, patient satisfaction, patient turnover rateand medication error. Take your projects to the next level with our ultimate collection of Impact For Implementing Big Data Analytics Developing Strategic Insights Using Big Data Analytics SS V. Slidegeeks has designed a range of layouts that are perfect for representing task or activity duration, keeping track of all your deadlines at a glance. Tailor these designs to your exact needs and give them a truly corporate look with your own brand colors they will make your projects stand out from the rest This slide showcases benefits of leveraging data analytics in healthcare organization. It provides information regarding medical equipment usage, patient satisfaction, patient turnover rateand medication error.
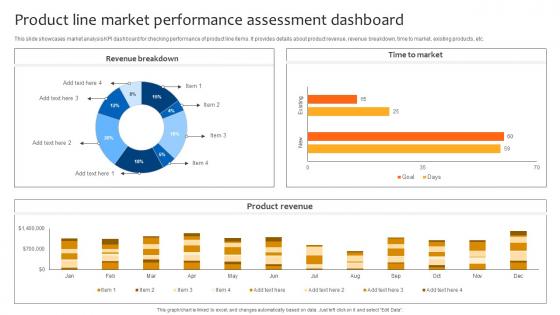
Deploying Strategies For Business Product Line Market Performance Assessment Dashboard Strategy SS V
This slide showcases market analysis KPI dashboard for checking performance of product line items. It provides details about product revenue, revenue breakdown, time to market, existing products, etc. Take your projects to the next level with our ultimate collection of Deploying Strategies For Business Product Line Market Performance Assessment Dashboard Strategy SS V. Slidegeeks has designed a range of layouts that are perfect for representing task or activity duration, keeping track of all your deadlines at a glance. Tailor these designs to your exact needs and give them a truly corporate look with your own brand colors they will make your projects stand out from the rest This slide showcases market analysis KPI dashboard for checking performance of product line items. It provides details about product revenue, revenue breakdown, time to market, existing products, etc.
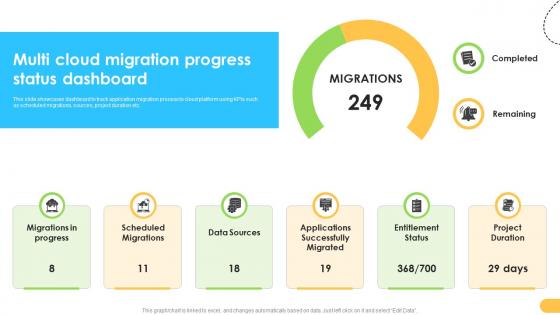
Multi Cloud Migration Progress Status Dashboard Data Migration From On Premises
This slide showcases dashboard to track application migration process to cloud platform using KPIs such as scheduled migrations, sources, project duration etc. Take your projects to the next level with our ultimate collection of Multi Cloud Migration Progress Status Dashboard Data Migration From On Premises. Slidegeeks has designed a range of layouts that are perfect for representing task or activity duration, keeping track of all your deadlines at a glance. Tailor these designs to your exact needs and give them a truly corporate look with your own brand colors they will make your projects stand out from the rest This slide showcases dashboard to track application migration process to cloud platform using KPIs such as scheduled migrations, sources, project duration etc.
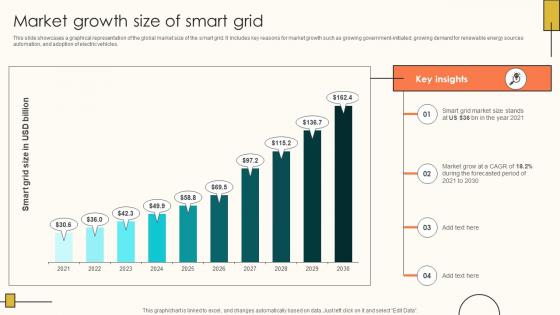
Market Growth Size Of Smart Grid Internet Of Things Solutions To Enhance Energy IoT SS V
This slide showcases a graphical representation of the global market size of the smart grid. It Includes key reasons for market growth such as growing government-initiated, growing demand for renewable energy sources automation, and adoption of electric vehicles. Take your projects to the next level with our ultimate collection of Market Growth Size Of Smart Grid Internet Of Things Solutions To Enhance Energy IoT SS V. Slidegeeks has designed a range of layouts that are perfect for representing task or activity duration, keeping track of all your deadlines at a glance. Tailor these designs to your exact needs and give them a truly corporate look with your own brand colors they will make your projects stand out from the rest This slide showcases a graphical representation of the global market size of the smart grid. It Includes key reasons for market growth such as growing government-initiated, growing demand for renewable energy sources automation, and adoption of electric vehicles.

IoT Solutions For Oil Oil And Gas Production Monitoring KPI Dashboard IoT SS V
This slide exhibits monthly performance of oil and gas production to track wellhead uptime and overall efficiency. It includes various elements such as production efficiency, well uptime, gas production rate, oil production rate, top performing gas producing wells, etc. Take your projects to the next level with our ultimate collection of IoT Solutions For Oil Oil And Gas Production Monitoring KPI Dashboard IoT SS V. Slidegeeks has designed a range of layouts that are perfect for representing task or activity duration, keeping track of all your deadlines at a glance. Tailor these designs to your exact needs and give them a truly corporate look with your own brand colors they will make your projects stand out from the rest This slide exhibits monthly performance of oil and gas production to track wellhead uptime and overall efficiency. It includes various elements such as production efficiency, well uptime, gas production rate, oil production rate, top performing gas producing wells, etc.
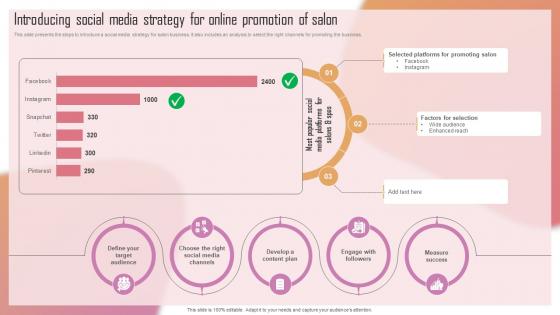
Customizing The Salon Experience Introducing Social Media Strategy For Online Promotion Strategy SS V
This slide presents the steps to introduce a social media strategy for salon business. It also includes an analysis to select the right channels for promoting the business. Take your projects to the next level with our ultimate collection of Customizing The Salon Experience Introducing Social Media Strategy For Online Promotion Strategy SS V. Slidegeeks has designed a range of layouts that are perfect for representing task or activity duration, keeping track of all your deadlines at a glance. Tailor these designs to your exact needs and give them a truly corporate look with your own brand colors they will make your projects stand out from the rest This slide presents the steps to introduce a social media strategy for salon business. It also includes an analysis to select the right channels for promoting the business.
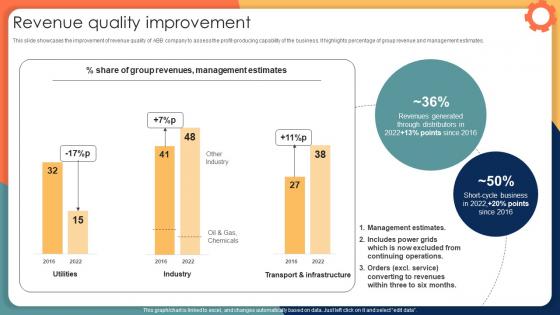
Revenue Quality Improvement Engineering Solution Provider Company Profile CP SS V
This slide showcases the improvement of revenue quality of ABB company to assess the profit-producing capability of the business. It highlights percentage of group revenue and management estimates. Take your projects to the next level with our ultimate collection of Revenue Quality Improvement Engineering Solution Provider Company Profile CP SS V. Slidegeeks has designed a range of layouts that are perfect for representing task or activity duration, keeping track of all your deadlines at a glance. Tailor these designs to your exact needs and give them a truly corporate look with your own brand colors they will make your projects stand out from the rest This slide showcases the improvement of revenue quality of ABB company to assess the profit-producing capability of the business. It highlights percentage of group revenue and management estimates.
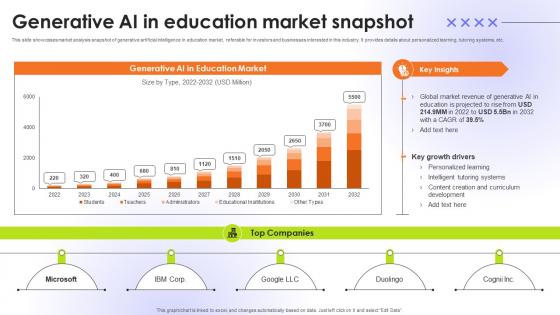
Generative AI In Education Market Snapshot Educational Transformation Through AI SS V
This slide showcases market analysis snapshot of generative artificial intelligence in education market, referable for investors and businesses interested in this industry. It provides details about personalized learning, tutoring systems, etc. Take your projects to the next level with our ultimate collection of Generative AI In Education Market Snapshot Educational Transformation Through AI SS V. Slidegeeks has designed a range of layouts that are perfect for representing task or activity duration, keeping track of all your deadlines at a glance. Tailor these designs to your exact needs and give them a truly corporate look with your own brand colors they will make your projects stand out from the rest This slide showcases market analysis snapshot of generative artificial intelligence in education market, referable for investors and businesses interested in this industry. It provides details about personalized learning, tutoring systems, etc.
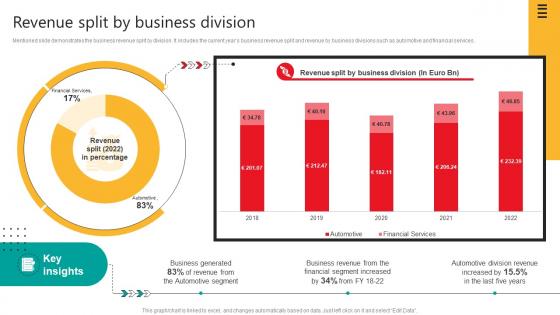
Revenue Split By Business Division Automobile Development Company Profile CP SS V
Mentioned slide demonstrates the business revenue split by division. It includes the current years business revenue split and revenue by business divisions such as automotive and financial services.Take your projects to the next level with our ultimate collection of Revenue Split By Business Division Automobile Development Company Profile CP SS V. Slidegeeks has designed a range of layouts that are perfect for representing task or activity duration, keeping track of all your deadlines at a glance. Tailor these designs to your exact needs and give them a truly corporate look with your own brand colors they will make your projects stand out from the rest Mentioned slide demonstrates the business revenue split by division. It includes the current years business revenue split and revenue by business divisions such as automotive and financial services.

Project Benchmarking Process Analyzing Customer Bounce Rate For Company CRP DK SS V
This slide showcases website bounce rate monitoring which helps in identifying reasons for poor customer engagement such as usability issues etc. Do you have to make sure that everyone on your team knows about any specific topic I yes, then you should give Project Benchmarking Process Analyzing Customer Bounce Rate For Company CRP DK SS V a try. Our experts have put a lot of knowledge and effort into creating this impeccable Project Benchmarking Process Analyzing Customer Bounce Rate For Company CRP DK SS V. You can use this template for your upcoming presentations, as the slides are perfect to represent even the tiniest detail. You can download these templates from the Slidegeeks website and these are easy to edit. So grab these today This slide showcases website bounce rate monitoring which helps in identifying reasons for poor customer engagement such as usability issues etc.
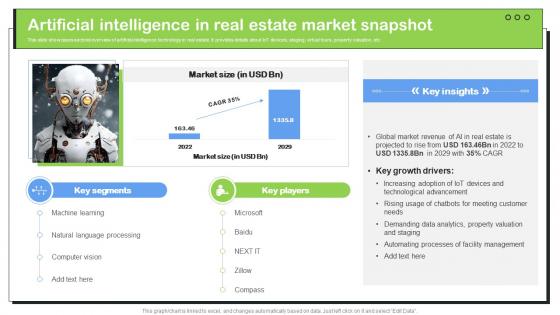
Transforming Real Estate Artificial Intelligence In Real Estate Market Snapshot ChatGPT SS V
This slide showcases sectoral overview of artificial intelligence technology in real estate. It provides details about IoT devices, staging, virtual tours, property valuation, etc. Do you have to make sure that everyone on your team knows about any specific topic I yes, then you should give Transforming Real Estate Artificial Intelligence In Real Estate Market Snapshot ChatGPT SS V a try. Our experts have put a lot of knowledge and effort into creating this impeccable Transforming Real Estate Artificial Intelligence In Real Estate Market Snapshot ChatGPT SS V. You can use this template for your upcoming presentations, as the slides are perfect to represent even the tiniest detail. You can download these templates from the Slidegeeks website and these are easy to edit. So grab these today This slide showcases sectoral overview of artificial intelligence technology in real estate. It provides details about IoT devices, staging, virtual tours, property valuation, etc.
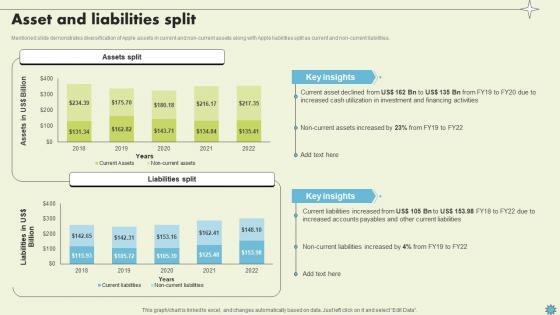
Asset And Liabilities Split Consumer Electronics Company Profile CP SS V
Mentioned slide demonstrates diversification of Apple assets in current and non-current assets along with Apple liabilities split as current and non-current liabilities.Do you have to make sure that everyone on your team knows about any specific topic I yes, then you should give Asset And Liabilities Split Consumer Electronics Company Profile CP SS V a try. Our experts have put a lot of knowledge and effort into creating this impeccable Asset And Liabilities Split Consumer Electronics Company Profile CP SS V. You can use this template for your upcoming presentations, as the slides are perfect to represent even the tiniest detail. You can download these templates from the Slidegeeks website and these are easy to edit. So grab these today Mentioned slide demonstrates diversification of Apple assets in current and non-current assets along with Apple liabilities split as current and non-current liabilities.
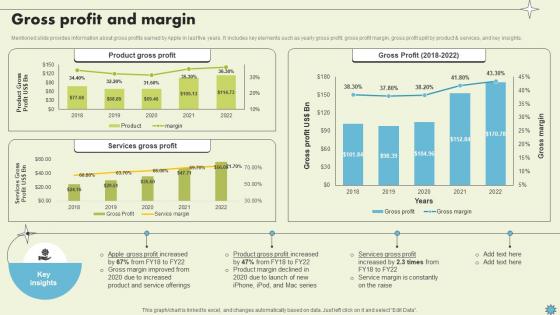
Gross Profit And Margin Consumer Electronics Company Profile CP SS V
Mentioned slide provides information about gross profits earned by Apple in last five years. It includes key elements such as yearly gross profit, gross profit margin, gross profit split by product and services, and key insights.Take your projects to the next level with our ultimate collection of Gross Profit And Margin Consumer Electronics Company Profile CP SS V. Slidegeeks has designed a range of layouts that are perfect for representing task or activity duration, keeping track of all your deadlines at a glance. Tailor these designs to your exact needs and give them a truly corporate look with your own brand colors they will make your projects stand out from the rest Mentioned slide provides information about gross profits earned by Apple in last five years. It includes key elements such as yearly gross profit, gross profit margin, gross profit split by product and services, and key insights.

Integrating AI With IoT Analyzing Survey Results Of AIoT Technology Adoption IoT SS V
Do you have to make sure that everyone on your team knows about any specific topic I yes, then you should give Integrating AI With IoT Analyzing Survey Results Of AIoT Technology Adoption IoT SS V a try. Our experts have put a lot of knowledge and effort into creating this impeccable Integrating AI With IoT Analyzing Survey Results Of AIoT Technology Adoption IoT SS V. You can use this template for your upcoming presentations, as the slides are perfect to represent even the tiniest detail. You can download these templates from the Slidegeeks website and these are easy to edit. So grab these today Our Integrating AI With IoT Analyzing Survey Results Of AIoT Technology Adoption IoT SS V are topically designed to provide an attractive backdrop to any subject. Use them to look like a presentation pro.
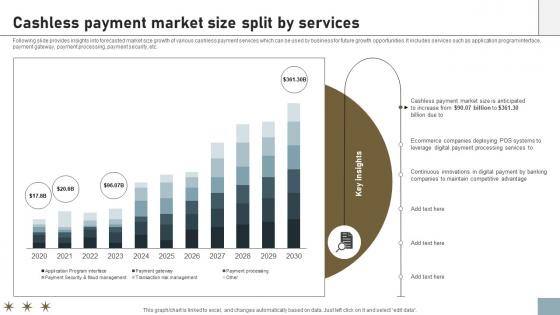
Online Payment Techniques For Providing Cashless Payment Market Size Split
Following slide provides insights into forecasted market size growth of various cashless payment services which can be used by business for future growth opportunities. It includes services such as application program interface, payment gateway, payment processing, payment security, etc. Take your projects to the next level with our ultimate collection of Online Payment Techniques For Providing Cashless Payment Market Size Split. Slidegeeks has designed a range of layouts that are perfect for representing task or activity duration, keeping track of all your deadlines at a glance. Tailor these designs to your exact needs and give them a truly corporate look with your own brand colors they will make your projects stand out from the rest Following slide provides insights into forecasted market size growth of various cashless payment services which can be used by business for future growth opportunities. It includes services such as application program interface, payment gateway, payment processing, payment security, etc.

K166 Statistics Highlighting Positive Impact Of Glass Packaging Material Comprehensive Guide On Current
The slide showcases properties of glass packaging material that assist in preserving food quality and temperature in containers. The points are mechanical, thermal, optical properties. Do you have to make sure that everyone on your team knows about any specific topic I yes, then you should give K166 Statistics Highlighting Positive Impact Of Glass Packaging Material Comprehensive Guide On Current a try. Our experts have put a lot of knowledge and effort into creating this impeccable Statistics Highlighting Positive Impact Of Glass Packaging Material Comprehensive Guide On Current. You can use this template for your upcoming presentations, as the slides are perfect to represent even the tiniest detail. You can download these templates from the Slidegeeks website and these are easy to edit. So grab these today The slide showcases properties of glass packaging material that assist in preserving food quality and temperature in containers. The points are mechanical, thermal, optical properties.
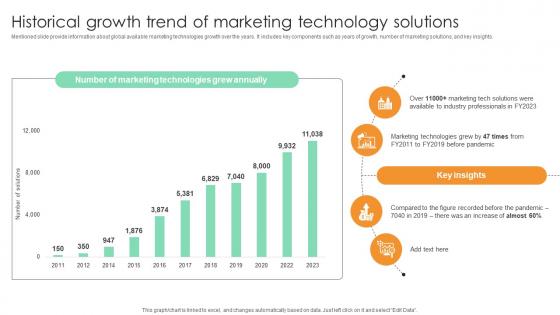
Historical Growth Trend Of Marketing Technology Comprehensive Guide For Marketing Technology
Mentioned slide provide information about global available marketing technologies growth over the years. It includes key components such as years of growth, number of marketing solutions, and key insights. Take your projects to the next level with our ultimate collection of Historical Growth Trend Of Marketing Technology Comprehensive Guide For Marketing Technology. Slidegeeks has designed a range of layouts that are perfect for representing task or activity duration, keeping track of all your deadlines at a glance. Tailor these designs to your exact needs and give them a truly corporate look with your own brand colors they will make your projects stand out from the rest Mentioned slide provide information about global available marketing technologies growth over the years. It includes key components such as years of growth, number of marketing solutions, and key insights.
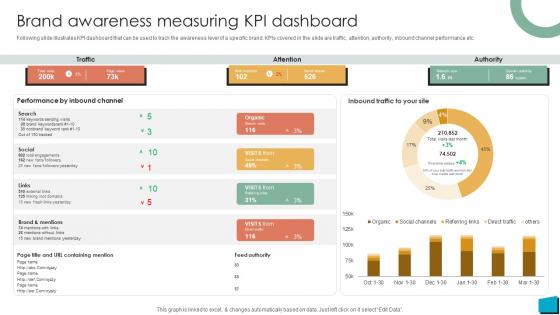
Brand Authority Brand Awareness Measuring KPI Dashboard Strategy SS V
Following slide illustrates KPI dashboard that can be used to track the awareness level of a specific brand. KPIs covered in the slide are traffic, attention, authority, inbound channel performance etc. Do you have to make sure that everyone on your team knows about any specific topic I yes, then you should give Brand Authority Brand Awareness Measuring KPI Dashboard Strategy SS V a try. Our experts have put a lot of knowledge and effort into creating this impeccable Brand Authority Brand Awareness Measuring KPI Dashboard Strategy SS V. You can use this template for your upcoming presentations, as the slides are perfect to represent even the tiniest detail. You can download these templates from the Slidegeeks website and these are easy to edit. So grab these today Following slide illustrates KPI dashboard that can be used to track the awareness level of a specific brand. KPIs covered in the slide are traffic, attention, authority, inbound channel performance etc.
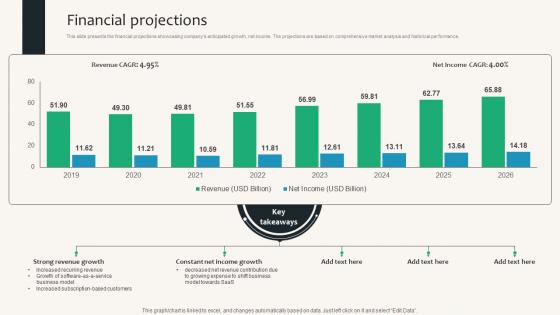
Financial Projections Security Service Provider Business Model BMC SS V
This slide presents the financial projections showcasing companys anticipated growth, net income. The projections are based on comprehensive market analysis and historical performance. Do you have to make sure that everyone on your team knows about any specific topic I yes, then you should give Financial Projections Security Service Provider Business Model BMC SS V a try. Our experts have put a lot of knowledge and effort into creating this impeccable Financial Projections Security Service Provider Business Model BMC SS V. You can use this template for your upcoming presentations, as the slides are perfect to represent even the tiniest detail. You can download these templates from the Slidegeeks website and these are easy to edit. So grab these today This slide presents the financial projections showcasing companys anticipated growth, net income. The projections are based on comprehensive market analysis and historical performance.
Dashboard Analysis For Tracking Agricultural Tasks Adopting Sustainable Farming Techniques
This slide showcases the KPIs that would help to track the improvements with adoption of new sustainable agriculture practices. It includes current tasks, crops, harvest, todays weather, summary, etc. Take your projects to the next level with our ultimate collection of Dashboard Analysis For Tracking Agricultural Tasks Adopting Sustainable Farming Techniques. Slidegeeks has designed a range of layouts that are perfect for representing task or activity duration, keeping track of all your deadlines at a glance. Tailor these designs to your exact needs and give them a truly corporate look with your own brand colors they will make your projects stand out from the rest This slide showcases the KPIs that would help to track the improvements with adoption of new sustainable agriculture practices. It includes current tasks, crops, harvest, todays weather, summary, etc.


 Continue with Email

 Home
Home


