Operational Excellence Kpi
Finance Metrics Dashboard Illustrating Gross And Operating Profit Margin Icons PDF
This graph or chart is linked to excel, and changes automatically based on data. Just left click on it and select edit data. Showcasing this set of slides titled Finance Metrics Dashboard Illustrating Gross And Operating Profit Margin Icons PDF. The topics addressed in these templates are Gross Profit Margin, Operating Profit Margin, Net Profit Margin. All the content presented in this PPT design is completely editable. Download it and make adjustments in color, background, font etc. as per your unique business setting.

Healthcare Hospital Performance Data Scorecard With Operating Margin Ppt Styles Slideshow PDF
This graphor chart is linked to excel, and changes automatically based on data. Just left click on it and select Edit Data. Deliver an awe inspiring pitch with this creative Healthcare Hospital Performance Data Scorecard With Operating Margin Ppt Styles Slideshow PDF bundle. Topics like Operating Margin Cost, Revenue Per Employee, Physician Performance Average, Patient Costs Per can be discussed with this completely editable template. It is available for immediate download depending on the needs and requirements of the user.
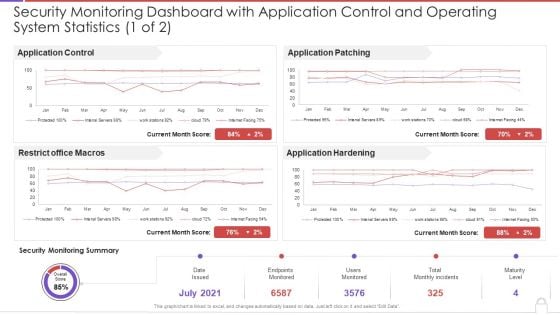
Security Monitoring Dashboard With Application Control And Operating System Statistics Template PDF
This graph or chart is linked to excel, and changes automatically based on data. Just left click on it and select Edit Data. Deliver and pitch your topic in the best possible manner with this security monitoring dashboard with application control and operating system statistics template pdf. Use them to share invaluable insights on application control, restrict office macros, application patching, application hardening and impress your audience. This template can be altered and modified as per your expectations. So, grab it now.
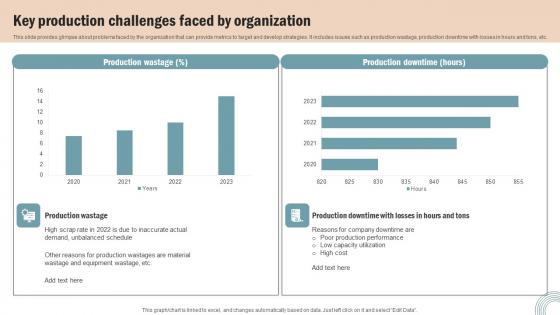
Key Production Challenges Faced Operations Strategy Improve Business Productivity Information Pdf
This slide provides glimpse about problems faced by the organization that can provide metrics to target and develop strategies. It includes issues such as production wastage, production downtime with losses in hours and tons, etc. Make sure to capture your audiences attention in your business displays with our gratis customizable Key Production Challenges Faced Operations Strategy Improve Business Productivity Information Pdf. These are great for business strategies, office conferences, capital raising or task suggestions. If you desire to acquire more customers for your tech business and ensure they stay satisfied, create your own sales presentation with these plain slides. This slide provides glimpse about problems faced by the organization that can provide metrics to target and develop strategies. It includes issues such as production wastage, production downtime with losses in hours and tons, etc.
Manufacturing Operation Quality Improvement Practices Tools Templates Production Rate Key Performance Portrait PDF
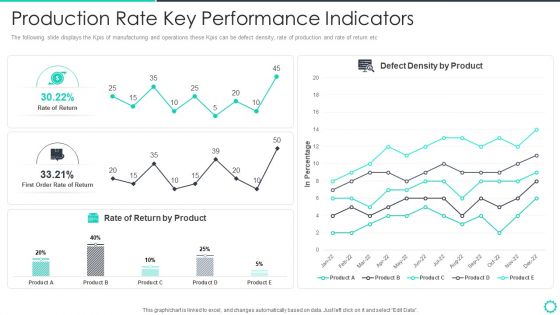
The following slide displays the Kpis of manufacturing and operations these Kpis can be defect density, rate of production and rate of return etc. Deliver and pitch your topic in the best possible manner with this manufacturing operation quality improvement practices tools templates production rate key performance portrait pdf. Use them to share invaluable insights on production rate key performance indicators and impress your audience. This template can be altered and modified as per your expectations. So, grab it now.
IT Security Automation Systems Guide Measure Security Automation Metrics For Operations Efficiency Mockup PDF
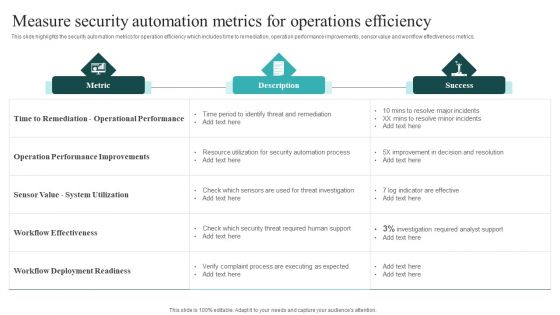
This slide highlights the security automation metrics for operation efficiency which includes time to remediation, operation performance improvements, sensor value and workflow effectiveness metrics. Crafting an eye catching presentation has never been more straightforward. Let your presentation shine with this tasteful yet straightforward IT Security Automation Systems Guide Measure Security Automation Metrics For Operations Efficiency Mockup PDF template. It offers a minimalistic and classy look that is great for making a statement. The colors have been employed intelligently to add a bit of playfulness while still remaining professional. Construct the ideal IT Security Automation Systems Guide Measure Security Automation Metrics For Operations Efficiency Mockup PDF that effortlessly grabs the attention of your audience Begin now and be certain to wow your customers.
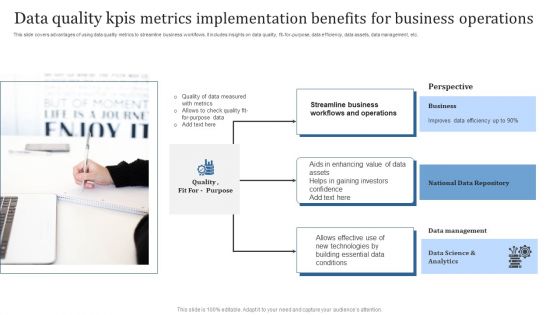
Data Quality Kpis Metrics Implementation Benefits For Business Operations Formats PDF
This slide covers advantages of using data quality metrics to streamline business workflows. It includes insights on data quality, fit-for-purpose, data efficiency, data assets, data management, etc. Presenting Data Quality Kpis Metrics Implementation Benefits For Business Operations Formats PDF to dispense important information. This template comprises Three stages. It also presents valuable insights into the topics including Business, National Data Repository, Data Management. This is a completely customizable PowerPoint theme that can be put to use immediately. So, download it and address the topic impactfully.
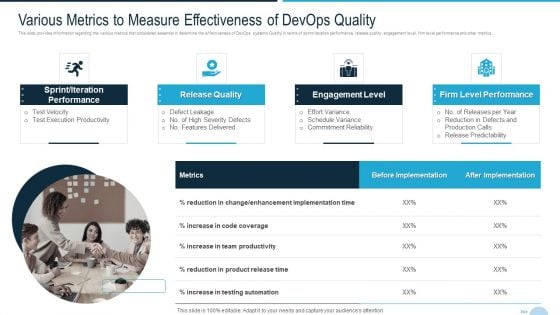
Development And Operations Quality Assurance And Validation IT Various Metrics To Measure Diagrams PDF
This slide provides information regarding the various metrics that considered essential in determine the effectiveness of DevOps systems Quality in terms of sprint or iteration performance, release quality, engagement level, firm level performance and other metrics. Presenting development and operations quality assurance and validation it various metrics to measure diagrams pdf to provide visual cues and insights. Share and navigate important information on four stages that need your due attention. This template can be used to pitch topics like engagement level, firm level performance, release quality In addtion, this PPT design contains high resolution images, graphics, etc, that are easily editable and available for immediate download.

E2E Quality Assurance And Testing In Developer Operations IT Various Metrics Themes PDF Background PDF
This slide provides information regarding the various metrics that considered essential in determine the effectiveness of DevOps systems Quality in terms of sprint iteration performance, release quality, engagement level, firm level performance and other metrics. This is a e2e quality assurance and testing in developer operations it various metrics themes pdf background pdf template with various stages. Focus and dispense information on four stages using this creative set, that comes with editable features. It contains large content boxes to add your information on topics like before implementation, product failure rate, mean time to resolution You can also showcase facts, figures, and other relevant content using this PPT layout. Grab it now.

E2E Quality Assurance And Testing In Developer Operations IT Impleme Environment Contd Microsoft PDF Graphics PDF
This slide provides information regarding implementing of quality assurance in DevOps environment in terms of quality assurance and operations collaboration, parallel testing. Presenting e2e quality assurance and testing in developer operations it impleme environment contd microsoft pdf graphics pdf to provide visual cues and insights. Share and navigate important information on two stages that need your due attention. This template can be used to pitch topics like merging of teams, performance and quality metrics, development collaboration In addtion, this PPT design contains high resolution images, graphics, etc, that are easily editable and available for immediate download.
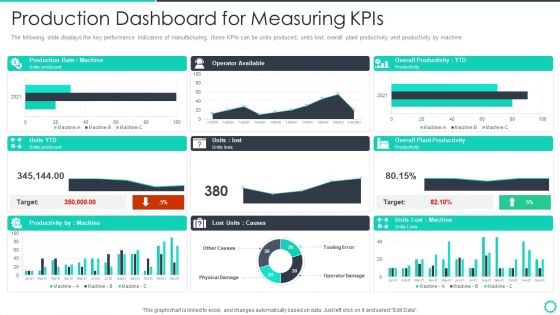
Manufacturing Operation Quality Improvement Practices Tools Templates Production Dashboard For Mockup PDF
The following slide displays the key performance Indicators of manufacturing, these KPIs can be units produced, units lost, overall plant productivity and productivity by machine. Deliver an awe inspiring pitch with this creative manufacturing operation quality improvement practices tools templates production dashboard for mockup pdf bundle. Topics like production dashboard for measuring kpis can be discussed with this completely editable template. It is available for immediate download depending on the needs and requirements of the user.
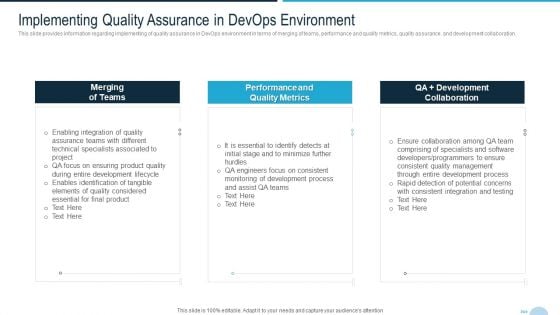
Development And Operations Quality Assurance And Validation IT Implementing Quality Assurance Professional PDF
This slide provides information regarding implementing of quality assurance in DevOps environment in terms of merging of teams, performance and quality metrics, quality assurance. and development collaboration. This is a development and operations quality assurance and validation it implementing quality assurance professional pdf template with various stages. Focus and dispense information on three stages using this creative set, that comes with editable features. It contains large content boxes to add your information on topics like merging of teams, performance and quality metrics, development collaboration You can also showcase facts, figures, and other relevant content using this PPT layout. Grab it now.
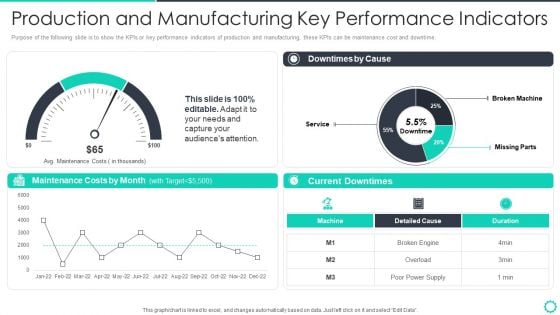
Manufacturing Operation Quality Improvement Practices Tools Templates Production And Manufacturing Pictures PDF
Purpose of the following slide is to show the KPIs or key performance indicators of production and manufacturing, these KPIs can be maintenance cost and downtime. Deliver and pitch your topic in the best possible manner with this manufacturing operation quality improvement practices tools templates production and manufacturing pictures pdf. Use them to share invaluable insights on downtimes by cause, maintenance costs by month, current downtimes and impress your audience. This template can be altered and modified as per your expectations. So, grab it now.
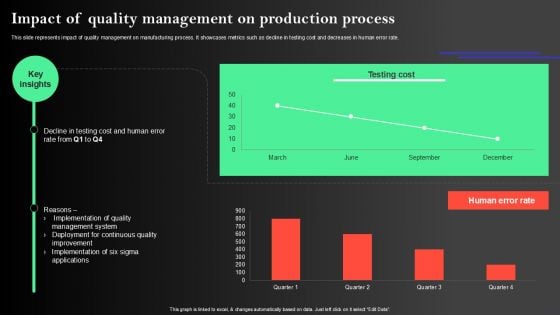
Manufacturing Operations Management Process Impact Of Quality Management On Production Process Topics PDF
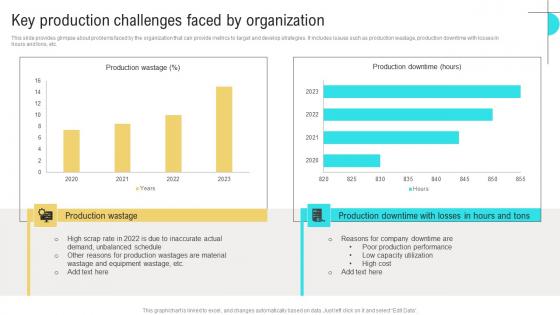
Key Production Challenges Faced Business Performance Optimization New Operations Strategy Pictures Pdf
This slide provides glimpse about problems faced by the organization that can provide metrics to target and develop strategies. It includes issues such as production wastage, production downtime with losses in hours and tons, etc. This Key Production Challenges Faced Business Performance Optimization New Operations Strategy Pictures Pdf is perfect for any presentation, be it in front of clients or colleagues. It is a versatile and stylish solution for organizing your meetings. The Key Production Challenges Faced Business Performance Optimization New Operations Strategy Pictures Pdf features a modern design for your presentation meetings. The adjustable and customizable slides provide unlimited possibilities for acing up your presentation. Slidegeeks has done all the homework before launching the product for you. So, do not wait, grab the presentation templates today This slide provides glimpse about problems faced by the organization that can provide metrics to target and develop strategies. It includes issues such as production wastage, production downtime with losses in hours and tons, etc.
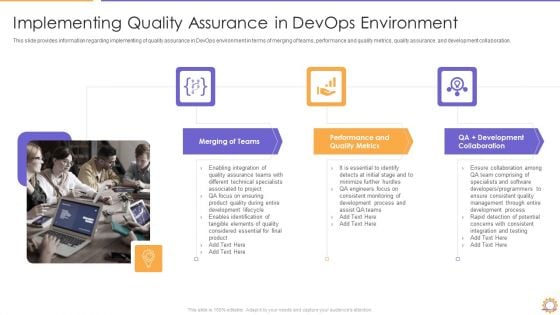
E2E Quality Assurance And Testing In Developer Operations IT Implementing Rules PDF Elements PDF
This slide provides information regarding implementing of quality assurance in DevOps environment in terms of merging of teams, performance and quality metrics, quality assurance. and development collaboration. This is a e2e quality assurance and testing in developer operations it implementing rules pdf elements pdf template with various stages. Focus and dispense information on three stages using this creative set, that comes with editable features. It contains large content boxes to add your information on topics like infrastructure code, test scripts and data, configuration server You can also showcase facts, figures, and other relevant content using this PPT layout. Grab it now.
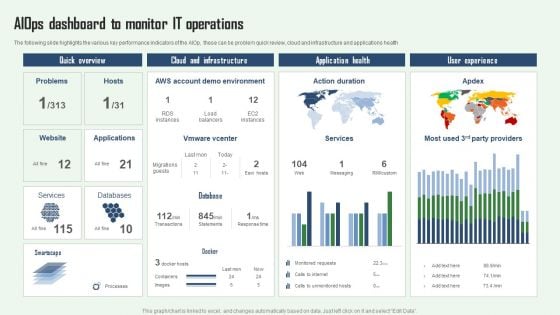
Aiops Dashboard To Monitor IT Operations Aiops Integration Summary Report Clipart PDF
The following slide highlights the various key performance indicators of the AIOp, these can be problem quick review, cloud and infrastructure and applications health. If you are looking for a format to display your unique thoughts, then the professionally designed Aiops Dashboard To Monitor IT Operations Aiops Integration Summary Report Clipart PDF is the one for you. You can use it as a Google Slides template or a PowerPoint template. Incorporate impressive visuals, symbols, images, and other charts. Modify or reorganize the text boxes as you desire. Experiment with shade schemes and font pairings. Alter, share or cooperate with other people on your work. Download Aiops Dashboard To Monitor IT Operations Aiops Integration Summary Report Clipart PDF and find out how to give a successful presentation. Present a perfect display to your team and make your presentation unforgettable.
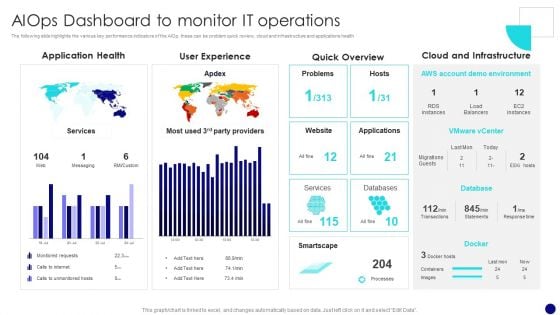
Information Technology Operations Administration With ML Aiops Dashboard To Monitor Diagrams PDF
The following slide highlights the various key performance indicators of the AIOp, these can be problem quick review, cloud and infrastructure and applications health. If you are looking for a format to display your unique thoughts, then the professionally designed Information Technology Operations Administration With ML Aiops Dashboard To Monitor Diagrams PDF is the one for you. You can use it as a Google Slides template or a PowerPoint template. Incorporate impressive visuals, symbols, images, and other charts. Modify or reorganize the text boxes as you desire. Experiment with shade schemes and font pairings. Alter, share or cooperate with other people on your work. Download Information Technology Operations Administration With ML Aiops Dashboard To Monitor Diagrams PDF and find out how to give a successful presentation. Present a perfect display to your team and make your presentation unforgettable.
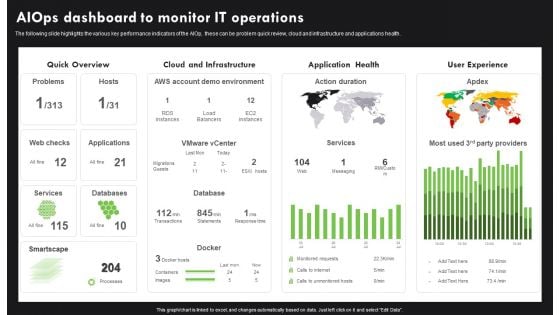
AI Deployment In IT Process Aiops Dashboard To Monitor IT Operations Infographics PDF
The following slide highlights the various key performance indicators of the AIOp, these can be problem quick review, cloud and infrastructure and applications health. If you are looking for a format to display your unique thoughts, then the professionally designed AI Deployment In IT Process Aiops Dashboard To Monitor IT Operations Infographics PDF is the one for you. You can use it as a Google Slides template or a PowerPoint template. Incorporate impressive visuals, symbols, images, and other charts. Modify or reorganize the text boxes as you desire. Experiment with shade schemes and font pairings. Alter, share or cooperate with other people on your work. Download AI Deployment In IT Process Aiops Dashboard To Monitor IT Operations Infographics PDF and find out how to give a successful presentation. Present a perfect display to your team and make your presentation unforgettable.
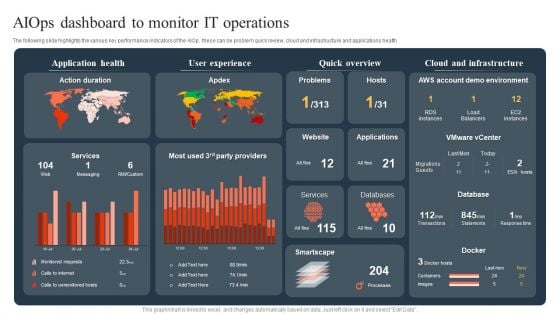
Ml And Big Data In Information Technology Processes Aiops Dashboard To Monitor IT Operations Sample PDF
The following slide highlights the various key performance indicators of the AIOp, these can be problem quick review, cloud and infrastructure and applications health If you are looking for a format to display your unique thoughts, then the professionally designed Ml And Big Data In Information Technology Processes Aiops Dashboard To Monitor IT Operations Sample PDF is the one for you. You can use it as a Google Slides template or a PowerPoint template. Incorporate impressive visuals, symbols, images, and other charts. Modify or reorganize the text boxes as you desire. Experiment with shade schemes and font pairings. Alter, share or cooperate with other people on your work. Download Ml And Big Data In Information Technology Processes Aiops Dashboard To Monitor IT Operations Sample PDF and find out how to give a successful presentation. Present a perfect display to your team and make your presentation unforgettable.
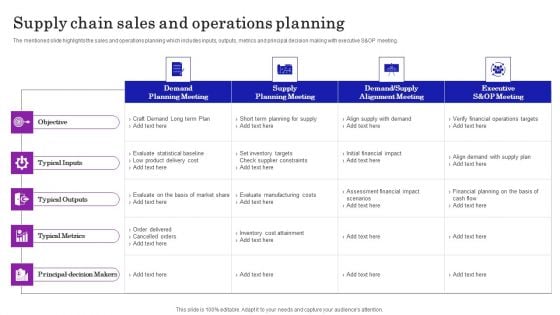
Supply Chain Planning To Enhance Logistics Process Supply Chain Sales And Operations Planning Graphics PDF
The mentioned slide highlights the sales and operations planning which includes inputs, outputs, metrics and principal decision making with executive S and OP meeting. Retrieve professionally designed Supply Chain Planning To Enhance Logistics Process Supply Chain Sales And Operations Planning Graphics PDF to effectively convey your message and captivate your listeners. Save time by selecting pre made slideshows that are appropriate for various topics, from business to educational purposes. These themes come in many different styles, from creative to corporate, and all of them are easily adjustable and can be edited quickly. Access them as PowerPoint templates or as Google Slides themes. You do not have to go on a hunt for the perfect presentation because Slidegeeks got you covered from everywhere.
Strategy To Enhance Supply Chain Operations Logistics Management Strategy Effectiveness Tracking Sheet Rules PDF
This slide covers the key performance indicator for tracking impact of new logistics management strategy. It includes metrics such as shipping time, order accuracy, lead time, capacity utilization, customer backorder rate, inventory turnover, etc. Take your projects to the next level with our ultimate collection of Strategy To Enhance Supply Chain Operations Logistics Management Strategy Effectiveness Tracking Sheet Rules PDF. Slidegeeks has designed a range of layouts that are perfect for representing task or activity duration, keeping track of all your deadlines at a glance. Tailor these designs to your exact needs and give them a truly corporate look with your own brand colors they will make your projects stand out from the rest.

Post Digitalization Analysing The Impact On Retail Optimizing Retail Operations With Digital DT SS V
This slide help analyses the improving performance of key performance indicators of retail companies after successful digitalization. It includes online sales growth, cart abandonment rate, customer complaints, inventory inaccuracy, time-to-market, supply chain efficiency, foot traffic, and marketing ROI.This Post Digitalization Analysing The Impact On Retail Optimizing Retail Operations With Digital DT SS V is perfect for any presentation, be it in front of clients or colleagues. It is a versatile and stylish solution for organizing your meetings. The Post Digitalization Analysing The Impact On Retail Optimizing Retail Operations With Digital DT SS V features a modern design for your presentation meetings. The adjustable and customizable slides provide unlimited possibilities for acing up your presentation. Slidegeeks has done all the homework before launching the product for you. So, do not wait, grab the presentation templates today This slide help analyses the improving performance of key performance indicators of retail companies after successful digitalization. It includes online sales growth, cart abandonment rate, customer complaints, inventory inaccuracy, time-to-market, supply chain efficiency, foot traffic, and marketing ROI.
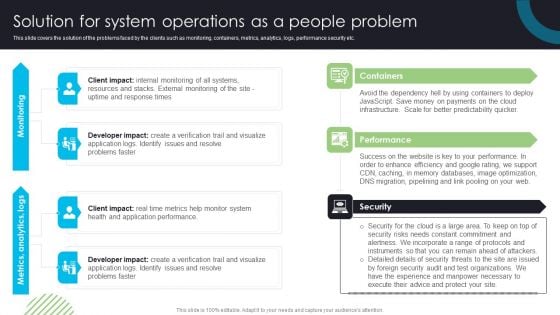
Devops Deployment And Transformation Services Advisory Solution For System Operations As A People Problem Professional PDF
This slide covers the solution of the problems faced by the clients such as monitoring, containers, metrics, analytics, logs, performance security etc. Elevate your presentations with our intuitive Devops Deployment And Transformation Services Advisory Solution For System Operations As A People Problem Professional PDF template. Whether youre delivering a pitch, sharing data, or presenting ideas, our visually-stunning single-slide PPT template is the perfect tool to captivate your audience. With 100 percenteditable features and a user-friendly interface, creating professional presentations has never been easier. Download now and leave a lasting impression.
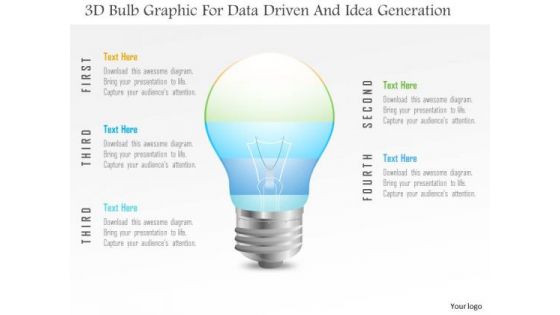
Business Diagram 3d Bulb Graphic For Data Driven And Idea Generation PowerPoint Slide
This Power Point template has been designed with 3d bulb graphic. Use this slide to represent technology idea and strategy concepts. Download this diagram for your business presentations and get exclusive comments on your efforts.
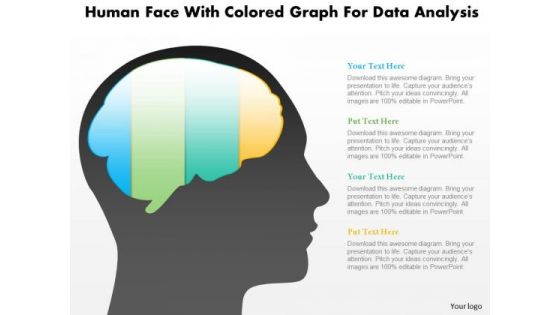
Business Diagram Human Face With Colored Graph For Data Analysis PowerPoint Slide
This diagram displays human face graphic with colored graph. This diagram can be used to represent strategy, planning, thinking of business plan. Display business options in your presentations by using this creative diagram.

Business Diagram Three Staged Pencil Diagram For Graph Formation PowerPoint Slide
This business diagram displays set of pencils. This Power Point template has been designed to compare and present business data. Download this diagram to represent stages of business growth.
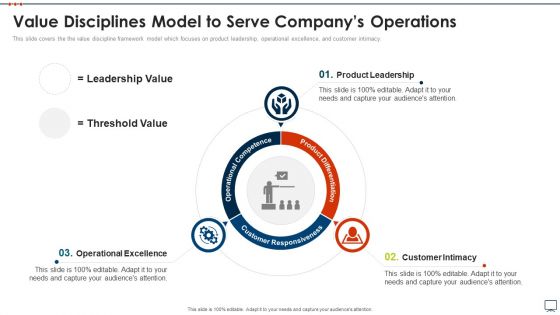
Business Plan Methods Tools And Templates Set 2 Value Disciplines Model To Serve Companys Operations Formats PDF
This slide covers the the value discipline framework model which focuses on product leadership, operational excellence, and customer intimacy. Presenting business plan methods tools and templates set 2 value disciplines model to serve companys operations formats pdf to provide visual cues and insights. Share and navigate important information on three stages that need your due attention. This template can be used to pitch topics like operational excellence, product leadership, customer intimacy. In addtion, this PPT design contains high resolution images, graphics, etc, that are easily editable and available for immediate download.
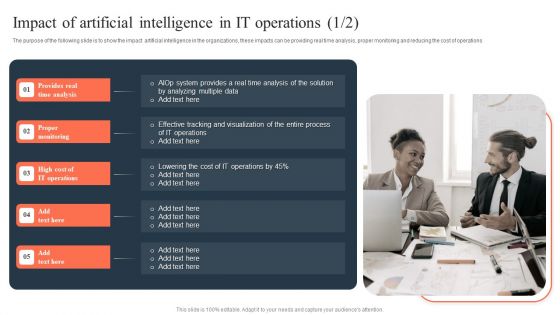
Ml And Big Data In Information Technology Processes Impact Of Artificial Intelligence In IT Operations Professional PDF
The purpose of the following slide is to show the impact artificial intelligence in the organizations, these impacts can be providing real time analysis, proper monitoring and reducing the cost of operations Get a simple yet stunning designed Ml And Big Data In Information Technology Processes Impact Of Artificial Intelligence In IT Operations Professional PDF. It is the best one to establish the tone in your meetings. It is an excellent way to make your presentations highly effective. So, download this PPT today from Slidegeeks and see the positive impacts. Our easy to edit Ml And Big Data In Information Technology Processes Impact Of Artificial Intelligence In IT Operations Professional PDF can be your go to option for all upcoming conferences and meetings. So, what are you waiting for Grab this template today.
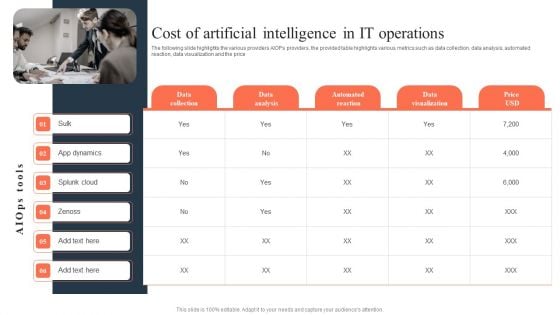
Ml And Big Data In Information Technology Processes Cost Of Artificial Intelligence In IT Operations Infographics PDF
The following slide highlights the various providers AIOPs providers, the provided table highlights various metrics such as data collection, data analysis, automated reaction, data visualization and the price Do you have to make sure that everyone on your team knows about any specific topic I yes, then you should give Ml And Big Data In Information Technology Processes Cost Of Artificial Intelligence In IT Operations Infographics PDF a try. Our experts have put a lot of knowledge and effort into creating this impeccable Ml And Big Data In Information Technology Processes Cost Of Artificial Intelligence In IT Operations Infographics PDF. You can use this template for your upcoming presentations, as the slides are perfect to represent even the tiniest detail. You can download these templates from the Slidegeeks website and these are easy to edit. So grab these today.

Business Diagram 3d Pie Chart With Arrows For Data Representation PowerPoint Slide
This business slide displays pie chart with timeline graphics. This diagram has been designed with graphic of with four arrows representing yearly data. Use this diagram, in your presentations to display process steps, stages, for business management.
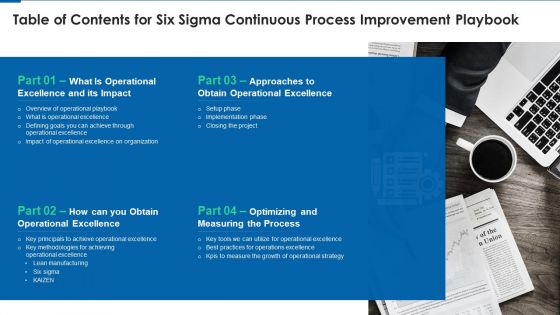
Table Of Contents For Six Sigma Continuous Process Improvement Playbook Rules PDF
Presenting Table Of Contents For Six Sigma Continuous Process Improvement Playbook Rules PDF to provide visual cues and insights. Share and navigate important information on four stages that need your due attention. This template can be used to pitch topics like Operational Excellence And Its Impact, Approaches To Obtain Operational Excellence, Obtain Operational Excellence, Optimizing And Measuring Process. In addtion, this PPT design contains high resolution images, graphics, etc, that are easily editable and available for immediate download.
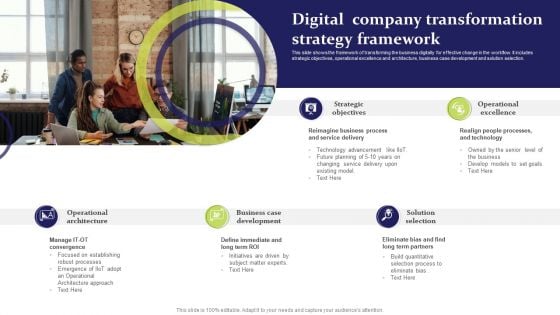
Digital Company Transformation Strategy Framework Ppt Pictures Designs Download PDF
This slide shows the framework of transforming the business digitally for effective change in the workflow. It includes strategic objectives, operational excellence and architecture, business case development and solution selection. Presenting Digital Company Transformation Strategy Framework Ppt Pictures Designs Download PDF to dispense important information. This template comprises five stages. It also presents valuable insights into the topics including Strategic Objectives, Operational Excellence, Solution Selection. This is a completely customizable PowerPoint theme that can be put to use immediately. So, download it and address the topic impactfully.
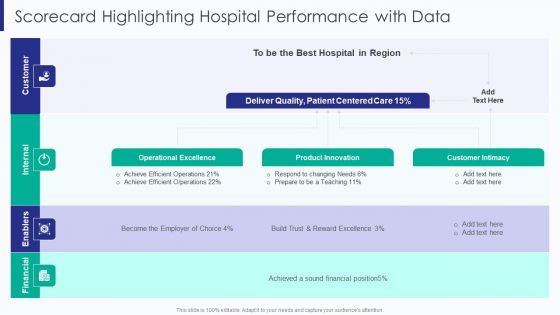
Healthcare Scorecard Highlighting Hospital Performance With Data Ppt Summary Example PDF
Deliver and pitch your topic in the best possible manner with this Healthcare Scorecard Highlighting Hospital Performance With Data Ppt Summary Example PDF. Use them to share invaluable insights on Deliver Quality Customer, Patient Centered Care, Operational Excellence Product and impress your audience. This template can be altered and modified as per your expectations. So, grab it now.
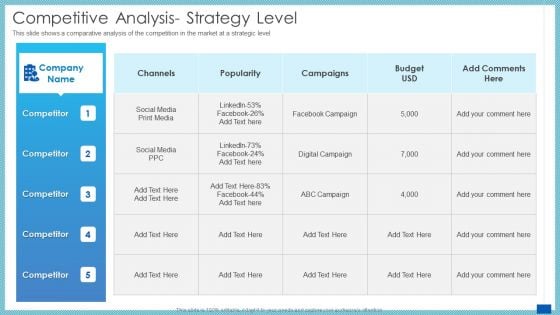
Evaluation Evolving Advanced Enterprise Development Marketing Tactics Competitive Analysis Strategy Level Brochure PDF
Deliver an awe inspiring pitch with this creative evaluation evolving advanced enterprise development marketing tactics achieving operational excellence demonstration pdf bundle. Topics like manufacturing market, objective, project objective can be discussed with this completely editable template. It is available for immediate download depending on the needs and requirements of the user.
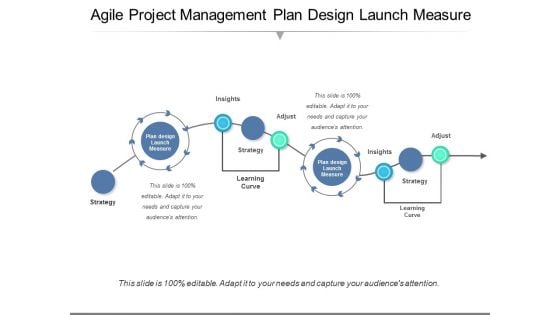
Agile Project Management Plan Design Launch Measure Ppt PowerPoint Presentation Outline Sample
This is a agile project management plan design launch measure ppt powerpoint presentation outline sample. This is a five stage process. The stages in this process are operational excellence, operational plan, operational process.
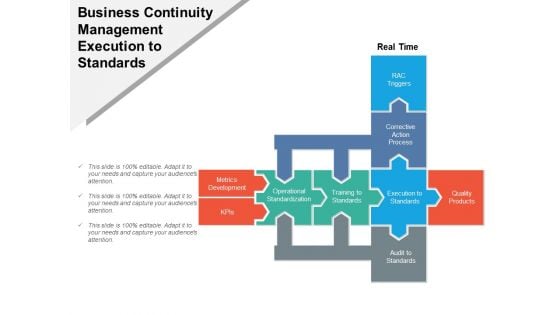
Business Continuity Management Execution To Standards Ppt PowerPoint Presentation Gallery Objects
This is a business continuity management execution to standards ppt powerpoint presentation gallery objects. This is a three stage process. The stages in this process are operational excellence, operational plan, operational process.
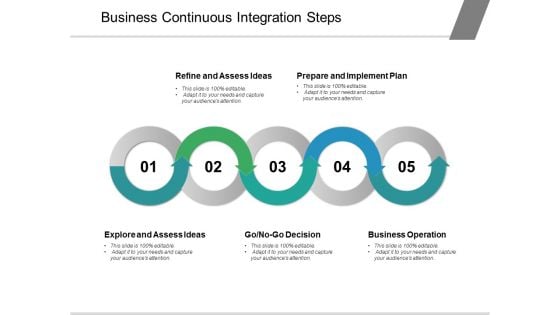
Business Continuous Integration Steps Ppt PowerPoint Presentation Show Visuals
This is a business continuous integration steps ppt powerpoint presentation show visuals. This is a five stage process. The stages in this process are operational excellence, operational plan, operational process.
Business Development Process Flow Chart Ppt PowerPoint Presentation Icon Show
This is a business development process flow chart ppt powerpoint presentation icon show. This is a three stage process. The stages in this process are operational excellence, operational plan, operational process.
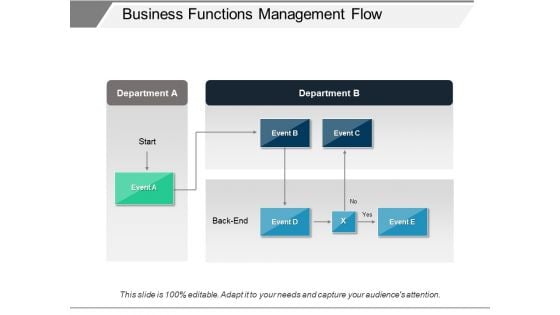
Business Functions Management Flow Ppt PowerPoint Presentation Infographics Graphic Tips
This is a business functions management flow ppt powerpoint presentation infographics graphic tips. This is a three stage process. The stages in this process are operational excellence, operational plan, operational process.

Business Improvement Initiatives Circular Steps Ppt PowerPoint Presentation File Infographic Template
This is a business improvement initiatives circular steps ppt powerpoint presentation file infographic template. This is a five stage process. The stages in this process are operational excellence, operational plan, operational process.
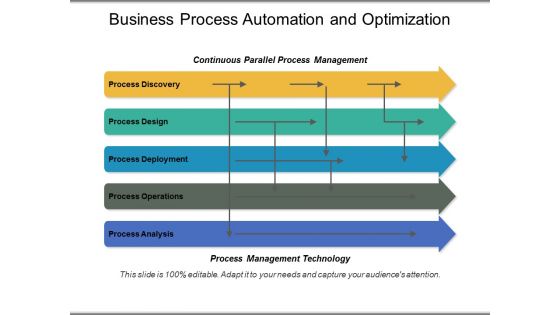
Business Process Automation And Optimization Ppt PowerPoint Presentation Portfolio
This is a business process automation and optimization ppt powerpoint presentation portfolio. This is a five stage process. The stages in this process are operational excellence, operational plan, operational process.

Business Process Management Identify Plan Execute Review Ppt PowerPoint Presentation Professional Outline
This is a business process management identify plan execute review ppt powerpoint presentation professional outline. This is a four stage process. The stages in this process are operational excellence, operational plan, operational process.
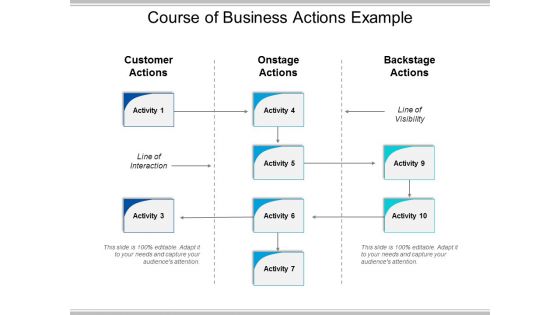
Course Of Business Actions Example Ppt PowerPoint Presentation Guidelines
This is a course of business actions example ppt powerpoint presentation guidelines. This is a three stage process. The stages in this process are operational excellence, operational plan, operational process.
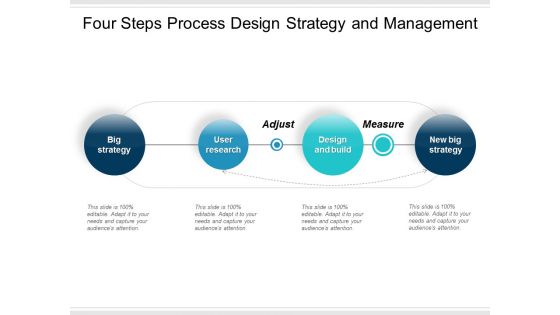
Four Steps Process Design Strategy And Management Ppt PowerPoint Presentation Visual Aids Inspiration
This is a four steps process design strategy and management ppt powerpoint presentation visual aids inspiration. This is a four stage process. The stages in this process are operational excellence, operational plan, operational process.
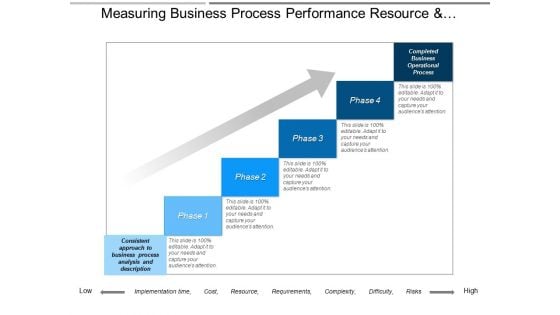
Measuring Business Process Performance Resource And Requirements Ppt PowerPoint Presentation Styles Skills
This is a measuring business process performance resource and requirements ppt powerpoint presentation styles skills. This is a six stage process. The stages in this process are operational excellence, operational plan, operational process.
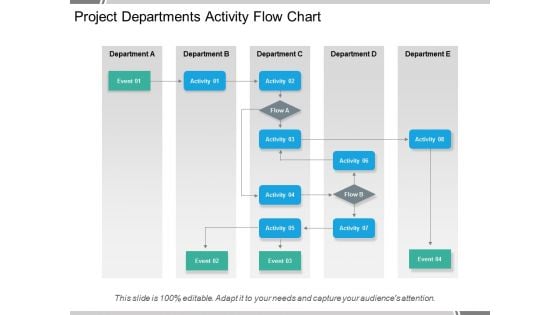
Project Departments Activity Flow Chart Ppt PowerPoint Presentation Pictures Show
This is a project departments activity flow chart ppt powerpoint presentation pictures show. This is a five stage process. The stages in this process are operational excellence, operational plan, operational process.
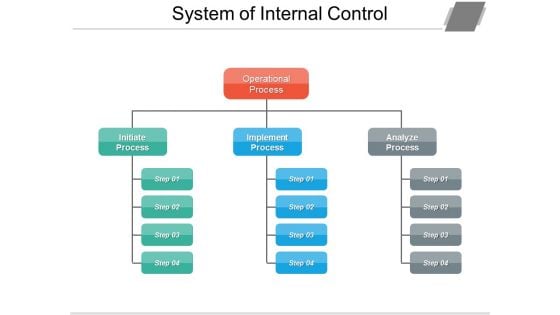
System Of Internal Control Ppt PowerPoint Presentation Layouts Deck
This is a system of internal control ppt powerpoint presentation layouts deck. This is a three stage process. The stages in this process are operational excellence, operational plan, operational process.
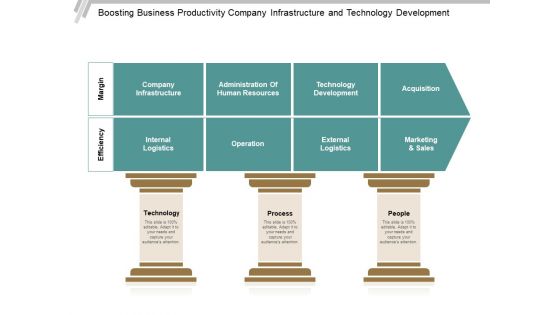
Boosting Business Productivity Company Infrastructure And Technology Development Ppt PowerPoint Presentation Show Infographic Template
This is a boosting business productivity company infrastructure and technology development ppt powerpoint presentation show infographic template. This is a three stage process. The stages in this process are operational excellence, operational management, operational efficiency ratios.
Business Productivity Icons Ppt PowerPoint Presentation Samples
This is a business productivity icons ppt powerpoint presentation samples. This is a three stage process. The stages in this process are operational excellence, operational management, operational efficiency ratios.
Business Productivity Management Gears With Icons Ppt PowerPoint Presentation Portfolio Format Ideas
This is a business productivity management gears with icons ppt powerpoint presentation portfolio format ideas. This is a six stage process. The stages in this process are operational excellence, operational management, operational efficiency ratios.
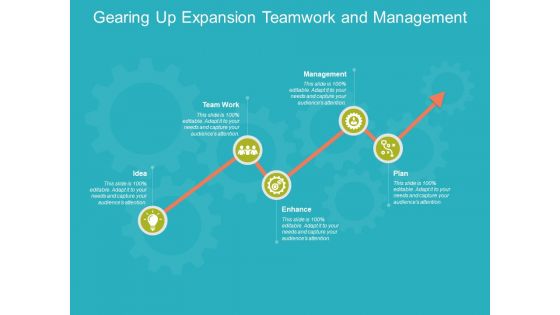
Gearing Up Expansion Teamwork And Management Ppt PowerPoint Presentation Inspiration Gallery
This is a gearing up expansion teamwork and management ppt powerpoint presentation inspiration gallery. This is a six stage process. The stages in this process are operational excellence, operational management, operational efficiency ratios.
Improve Team Productivity And Efficiency Initiate Execution Ppt PowerPoint Presentation Icon Structure
This is a improve team productivity and efficiency initiate execution ppt powerpoint presentation icon structure. This is a eight stage process. The stages in this process are operational excellence, operational management, operational efficiency ratios.
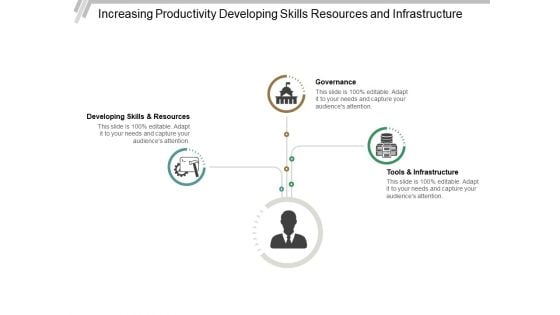
Increasing Productivity Developing Skills Resources And Infrastructure Ppt PowerPoint Presentation Gallery Visuals
This is a increasing productivity developing skills resources and infrastructure ppt powerpoint presentation gallery visuals. This is a three stage process. The stages in this process are operational excellence, operational management, operational efficiency ratios.
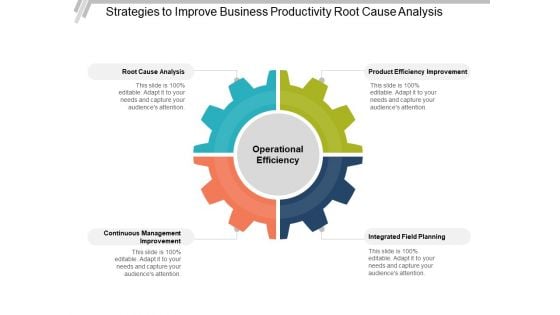
Strategies To Improve Business Productivity Root Cause Analysis Ppt PowerPoint Presentation Portfolio Show
This is a strategies to improve business productivity root cause analysis ppt powerpoint presentation portfolio show. This is a one stage process. The stages in this process are operational excellence, operational management, operational efficiency ratios.
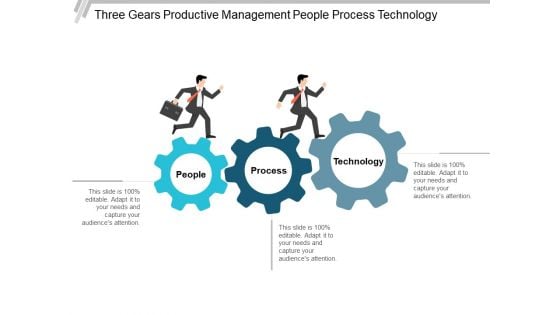
Three Gears Productive Management People Process Technology Ppt PowerPoint Presentation Inspiration Example Introduction
This is a three gears productive management people process technology ppt powerpoint presentation inspiration example introduction. This is a three stage process. The stages in this process are operational excellence, operational management, operational efficiency ratios.
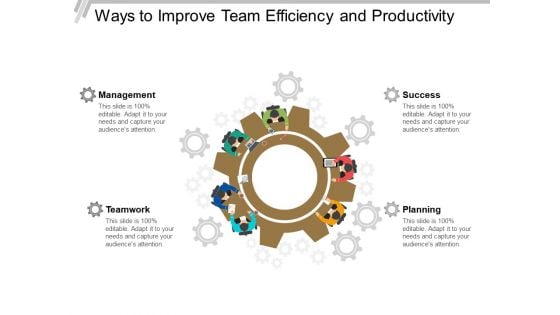
Ways To Improve Team Efficiency And Productivity Ppt PowerPoint Presentation Visual Aids Example 2015
This is a ways to improve team efficiency and productivity ppt powerpoint presentation visual aids example 2015. This is a four stage process. The stages in this process are operational excellence, operational management, operational efficiency ratios.
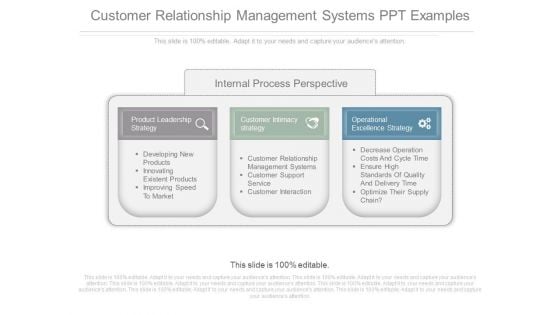
Customer Relationship Management Systems Ppt Examples
This is a customer relationship management systems ppt examples. This is a three stage process. The stages in this process are internal process perspective, product leadership strategy, developing new products, innovating existent products, improving speed to market, customer intimacy strategy, customer relationship management systems, customer support service, customer interaction, operational excellence strategy, decrease operation costs and cycle time, ensure high standards of quality and delivery time, optimize their supply chain.
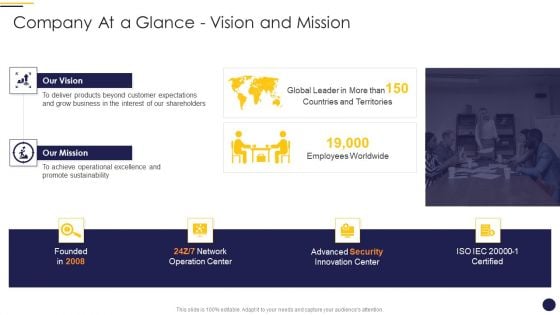
Internet Marketing Playbook Company At A Glance Vision And Mission Clipart PDF
This is a Internet Marketing Playbook Company At A Glance Vision And Mission Clipart PDF template with various stages. Focus and dispense information on two stages using this creative set, that comes with editable features. It contains large content boxes to add your information on topics like Our Vision Global, Our Mission Leader, Employees Worldwide Achieve, Operational Excellence Promote. You can also showcase facts, figures, and other relevant content using this PPT layout. Grab it now.
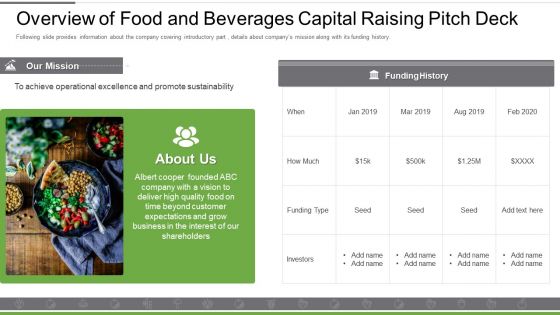
Overview Of Food And Beverages Capital Raising Pitch Deck Demonstration PDF
Following slide provides information about the company covering introductory part , details about companys mission along with its funding history.Deliver and pitch your topic in the best possible manner with this overview of food and beverages capital raising pitch deck demonstration pdf Use them to share invaluable insights on business in the interest, expectations and grow, operational excellence and impress your audience. This template can be altered and modified as per your expectations. So, grab it now.


 Continue with Email

 Home
Home


