Operations Icon
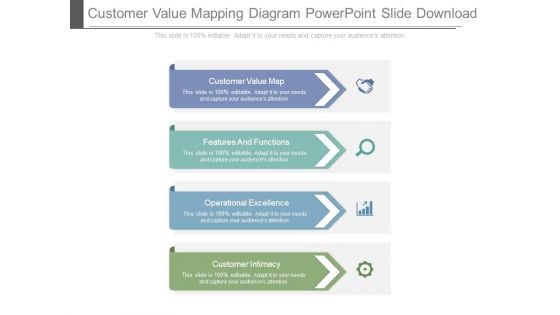
Customer Value Mapping Diagram Powerpoint Slide Download
This is a customer value mapping diagram powerpoint slide download. This is a four stage process. The stages in this process are customer value map, features and functions, operational excellence, customer intimacy.
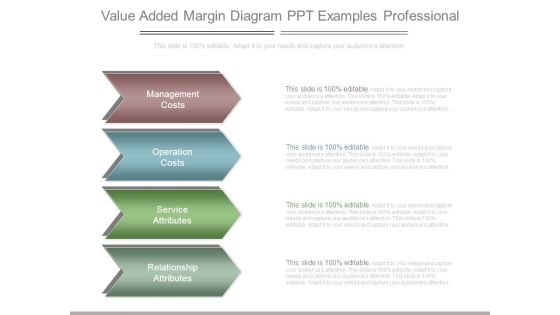
Value Added Margin Diagram Ppt Examples Professional
This is a value added margin diagram ppt examples professional. This is a four stage process. The stages in this process are management costs, operation costs, service attributes, relationship attributes.
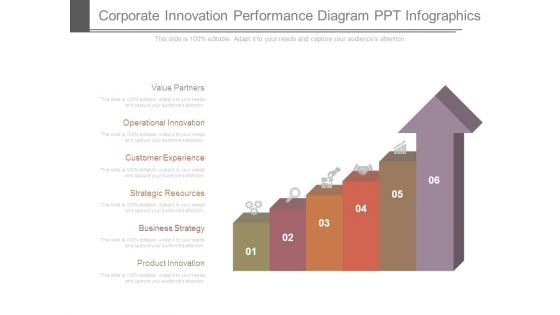
Corporate Innovation Performance Diagram Ppt Infographics
This is a corporate innovation performance diagram ppt infographics. This is a six stage process. The stages in this process are value partners, operational innovation, customer experience, strategic resources, business strategy, product innovation.
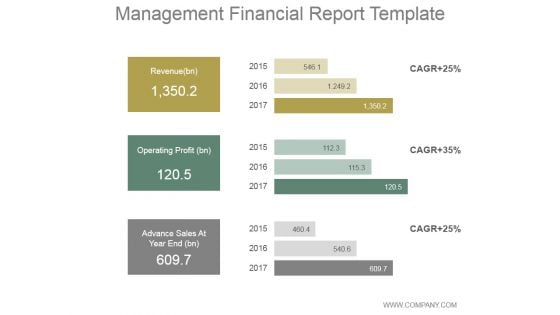
Management Financial Report Ppt PowerPoint Presentation Diagrams
This is a management financial report ppt powerpoint presentation diagrams. This is a three stage process. The stages in this process are revenue, operating profit, advance sales at year end.

Executive Summary Ppt PowerPoint Presentation Outline Diagrams
This is a executive summary ppt powerpoint presentation outline diagrams. This is a two stage process. The stages in this process are revenue, profits, operational cost, total customers, marketing channels.
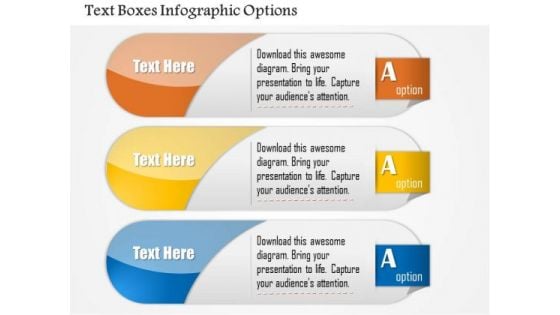
Business Diagram Text Boxes Infographic Options Presentation Template
Graphic of text boxes is used decorate this innovative diagram template. These text boxes are used to show information in any presentation. This PPT diagram can be used for business operation related topics.
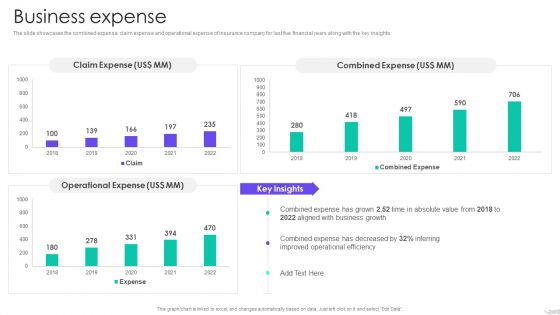
Insurance Services Firm Profile Business Expense Diagrams PDF
The slide showcases the combined expense, claim expense and operational expense of insurance company for last five financial years along with the key insights. Deliver an awe inspiring pitch with this creative Insurance Services Firm Profile Business Expense Diagrams PDF bundle. Topics like Claim Expense, Combined Expense, Operational Expense can be discussed with this completely editable template. It is available for immediate download depending on the needs and requirements of the user.
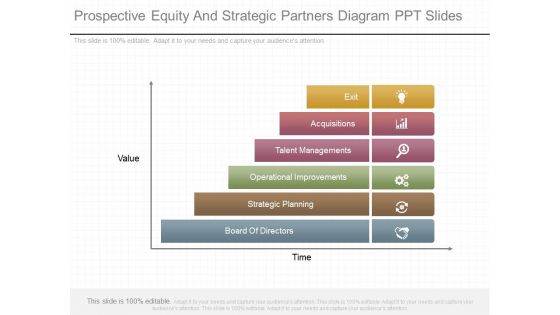
Prospective Equity And Strategic Partners Diagram Ppt Slides
This is a prospective equity and strategic partners diagram ppt slides. This is a six stage process. The stages in this process are value, time, exit, acquisitions, talent managements, operational improvements, strategic planning, board of directors.
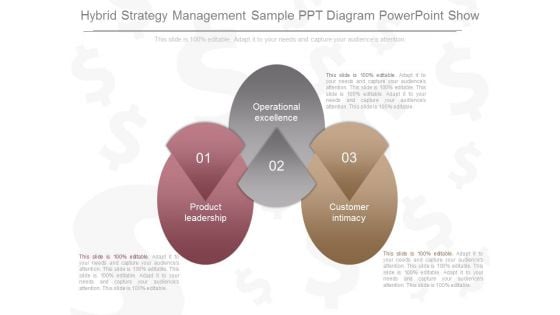
Hybrid Strategy Management Sample Ppt Diagram Powerpoint Show
This is a hybrid strategy management sample ppt diagram powerpoint show. This is a three stage process. The stages in this process are operational excellence, product leadership, customer intimacy.
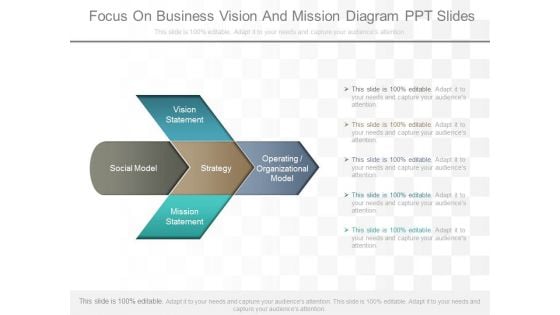
Focus On Business Vision And Mission Diagram Ppt Slides
This is a focus on business vision and mission diagram ppt slides. This is a five stage process. The stages in this process are vision statement, social model, strategy, operating organizational model, mission statement.
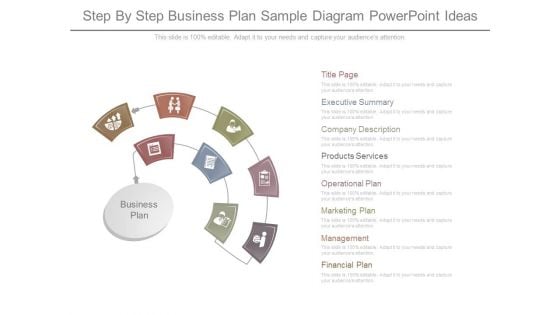
Step By Step Business Plan Sample Diagram Powerpoint Ideas
This is a step by step business plan sample diagram powerpoint ideas. This is a eight stage process. The stages in this process are business plan, title page, executive summary, products services, operational plan, marketing plan, management, financial plan.
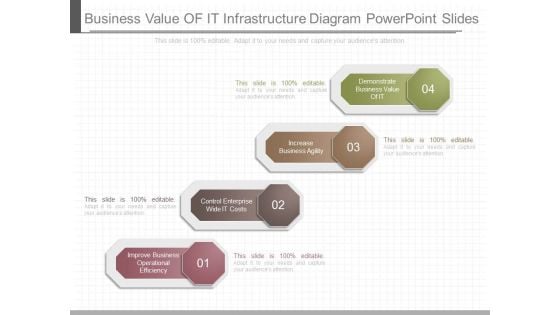
Business Value Of It Infrastructure Diagram Powerpoint Slides
This is a business value of it infrastructure diagram powerpoint slides. This is a four stage process. The stages in this process are demonstrate business value of it, increase business agility, control enterprise wide it costs, improve business operational efficiency.
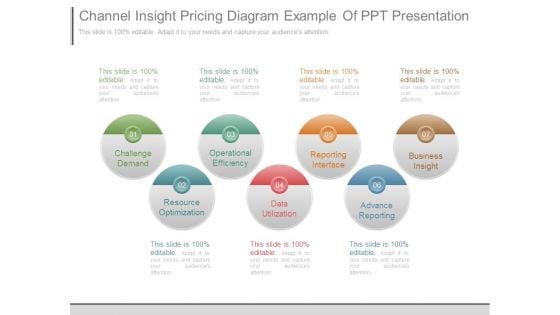
Channel Insight Pricing Diagram Example Of Ppt Presentation
This is a channel insight pricing diagram example of ppt presentation. This is a seven stage process. The stages in this process are challenge demand, operational efficiency, reporting interface, business insight, resource optimization, data utilization, advance reporting.
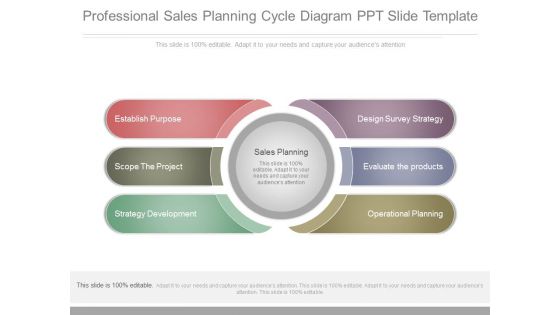
Professional Sales Planning Cycle Diagram Ppt Slide Template
This is a professional sales planning cycle diagram ppt slide template. This is a six stage process. The stages in this process are establish purpose, scope the project, strategy development, sales planning, design survey strategy, evaluate the products, operational planning.
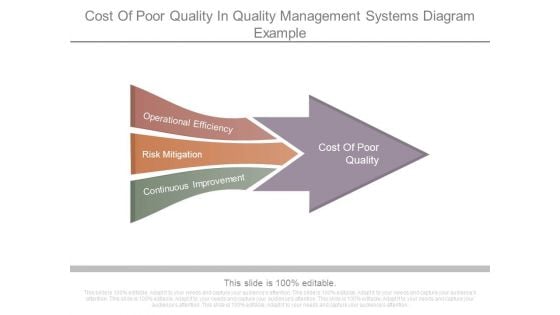
Cost Of Poor Quality In Quality Management Systems Diagram Example
This is a cost of poor quality in quality management systems diagram example. This is a three stage process. The stages in this process are operational efficiency, risk mitigation, continuous improvement, cost of poor quality.
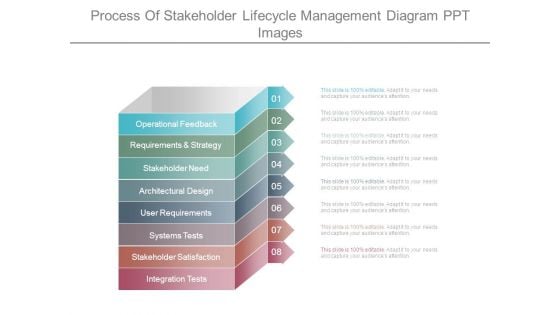
Process Of Stakeholder Lifecycle Management Diagram Ppt Images
This is a process of stakeholder lifecycle management diagram ppt images. This is a eight stage process. The stages in this process are operational feedback, requirements and strategy, stakeholder need, architectural design, user requirements, systems tests, stakeholder satisfaction, integration tests.
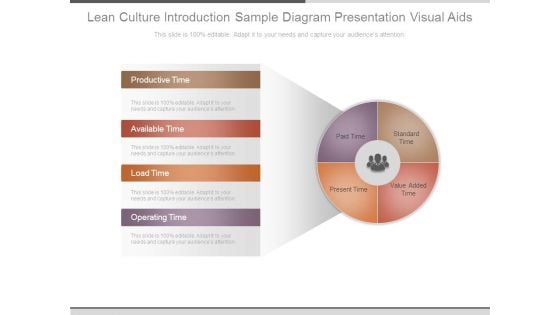
Lean Culture Introduction Sample Diagram Presentation Visual Aids
This is a lean culture introduction sample diagram presentation visual aids. This is a four stage process. The stages in this process are productive time, available time, load time, operating time.

Joint Application Exercise Diagram Powerpoint Slide Presentation Examples
This is a joint application exercise diagram powerpoint slide presentation examples. This is a eight stage process. The stages in this process are user, operating system, hardware, platform, client, application, server, infrastructure.
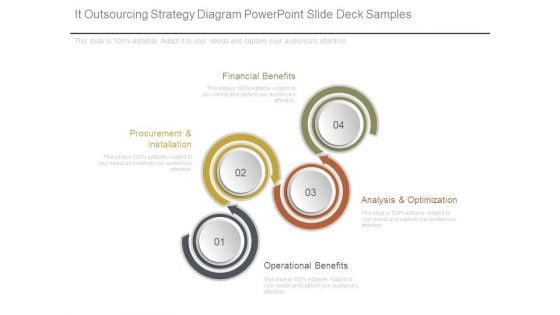
It Outsourcing Strategy Diagram Powerpoint Slide Deck Samples
This is a it outsourcing strategy diagram powerpoint slide deck samples. This is a four stage process. The stages in this process are procurement and installation, financial benefits, operational benefits, analysis and optimization.
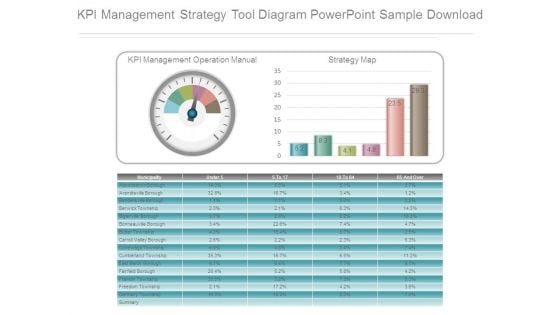
Kpi Management Strategy Tool Diagram Powerpoint Sample Download
This is a kpi management strategy tool diagram powerpoint sample download. This is a one stage process. The stages in this process are kpi management operation manual, strategy map.
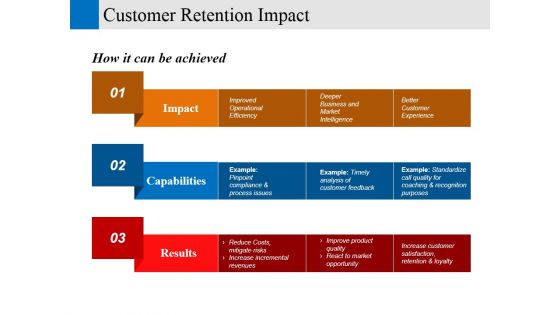
Customer Retention Impact Ppt PowerPoint Presentation Pictures Diagrams
This is a customer retention impact ppt powerpoint presentation pictures diagrams. This is a three stage process. The stages in this process are impact, capabilities, results, better customer experience, improved operational efficiency.
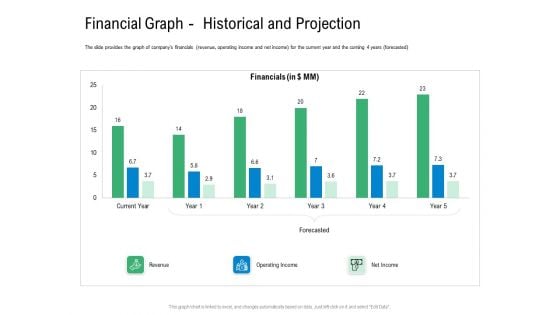
Convertible Preferred Stock Funding Pitch Deck Financial Graph Historical And Projection Themes PDF
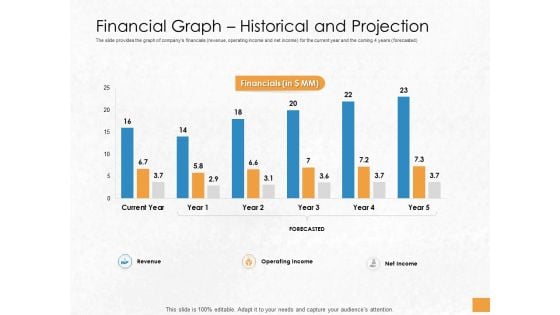
The slide provides the graph of companys financials revenue, operating income and net income for the current year and the coming 4 years forecasted. Deliver an awe inspiring pitch with this creative convertible preferred stock funding pitch deck financial graph historical and projection themes pdf bundle. Topics like revenue, operating income, net income can be discussed with this completely editable template. It is available for immediate download depending on the needs and requirements of the user.
Convertible Debenture Funding Financial Graph Historical And Projection Ppt Professional Themes PDF
The slide provides the graph of companys financials revenue, operating income and net income for the current year and the coming 4 years forecasted. Deliver an awe-inspiring pitch with this creative convertible debenture funding financial graph historical and projection ppt professional themes pdf bundle. Topics like revenue, operating income, net income, forecasted, financials, current year can be discussed with this completely editable template. It is available for immediate download depending on the needs and requirements of the user.
Cost Structure Car Manufacturing Company Business Model BMC SS V
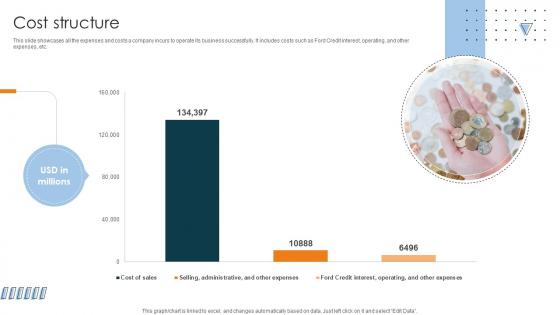
This slide showcases all the expenses and costs a company incurs to operate its business successfully. It includes costs such as Ford Credit interest, operating, and other expenses, etc. Create an editable Cost Structure Car Manufacturing Company Business Model BMC SS V that communicates your idea and engages your audience. Whether you are presenting a business or an educational presentation, pre-designed presentation templates help save time. Cost Structure Car Manufacturing Company Business Model BMC SS V is highly customizable and very easy to edit, covering many different styles from creative to business presentations. Slidegeeks has creative team members who have crafted amazing templates. So, go and get them without any delay. This slide showcases all the expenses and costs a company incurs to operate its business successfully. It includes costs such as Ford Credit interest, operating, and other expenses, etc.
Cost Structure Automotive Assembly Business Model BMC SS V
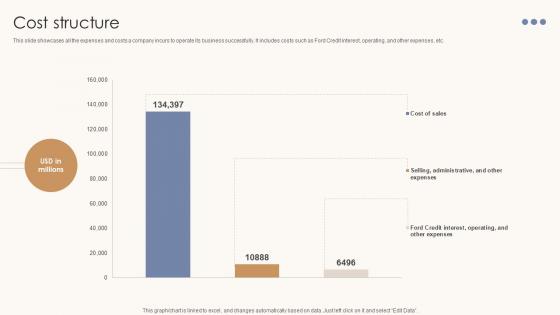
This slide showcases all the expenses and costs a company incurs to operate its business successfully. It includes costs such as Ford Credit interest, operating, and other expenses, etc. Create an editable Cost Structure Automotive Assembly Business Model BMC SS V that communicates your idea and engages your audience. Whether you are presenting a business or an educational presentation, pre-designed presentation templates help save time. Cost Structure Automotive Assembly Business Model BMC SS V is highly customizable and very easy to edit, covering many different styles from creative to business presentations. Slidegeeks has creative team members who have crafted amazing templates. So, go and get them without any delay. This slide showcases all the expenses and costs a company incurs to operate its business successfully. It includes costs such as Ford Credit interest, operating, and other expenses, etc.
Cost Structure Electronic Company Business Model BMC SS V
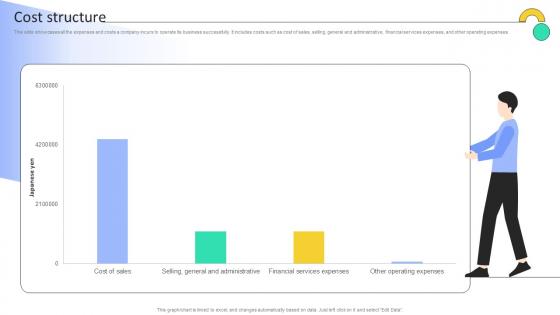
This slide showcases all the expenses and costs a company incurs to operate its business successfully. It includes costs such as cost of sales, selling, general and administrative, financial services expenses, and other operating expenses. Create an editable Cost Structure Electronic Company Business Model BMC SS V that communicates your idea and engages your audience. Whether you are presenting a business or an educational presentation, pre-designed presentation templates help save time. Cost Structure Electronic Company Business Model BMC SS V is highly customizable and very easy to edit, covering many different styles from creative to business presentations. Slidegeeks has creative team members who have crafted amazing templates. So, go and get them without any delay. This slide showcases all the expenses and costs a company incurs to operate its business successfully. It includes costs such as cost of sales, selling, general and administrative, financial services expenses, and other operating expenses.

Business Unit 4 Nutrition Home Care Solutions Company Profile CP SS V
This slide represents financial overview of Unilever business unit Nutrition. It covers turnover, operating margin, turnover growth, underlying sales growth, and underlying operating margin.Do you have to make sure that everyone on your team knows about any specific topic I yes, then you should give Business Unit 4 Nutrition Home Care Solutions Company Profile CP SS V a try. Our experts have put a lot of knowledge and effort into creating this impeccable Business Unit 4 Nutrition Home Care Solutions Company Profile CP SS V. You can use this template for your upcoming presentations, as the slides are perfect to represent even the tiniest detail. You can download these templates from the Slidegeeks website and these are easy to edit. So grab these today This slide represents financial overview of Unilever business unit Nutrition. It covers turnover, operating margin, turnover growth, underlying sales growth, and underlying operating margin.
Financial Performance Gaming Company Fund Raising Pitch Deck Topics Pdf
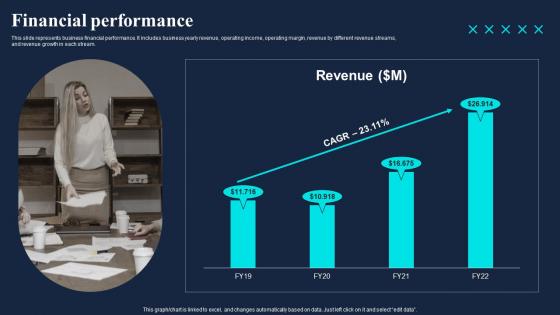
This slide represents business financial performance. It includes business yearly revenue, operating income, operating margin, revenue by different revenue streams, and revenue growth in each stream. Present like a pro with Financial Performance Gaming Company Fund Raising Pitch Deck Topics Pdf Create beautiful presentations together with your team, using our easy to use presentation slides. Share your ideas in real time and make changes on the fly by downloading our templates. So whether you are in the office, on the go, or in a remote location, you can stay in sync with your team and present your ideas with confidence. With Slidegeeks presentation got a whole lot easier. Grab these presentations today. This slide represents business financial performance. It includes business yearly revenue, operating income, operating margin, revenue by different revenue streams, and revenue growth in each stream.
Financial Overview Clothing Retailer Company Profile CP SS V
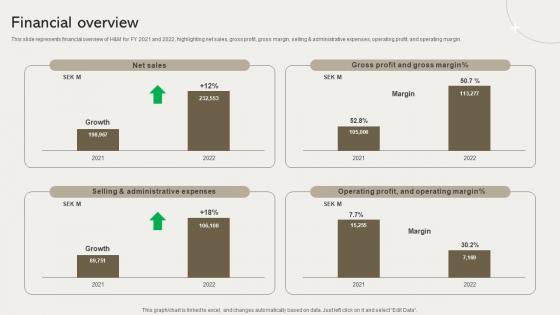
This slide represents financial overview of HandM for FY 2021 and 2022, highlighting net sales, gross profit, gross margin, selling and administrative expenses, operating profit, and operating margin. Do you have an important presentation coming up Are you looking for something that will make your presentation stand out from the rest Look no further than Financial Overview Clothing Retailer Company Profile CP SS V. With our professional designs, you can trust that your presentation will pop and make delivering it a smooth process. And with Slidegeeks, you can trust that your presentation will be unique and memorable. So why wait Grab Financial Overview Clothing Retailer Company Profile CP SS V today and make your presentation stand out from the rest This slide represents financial overview of HandM for FY 2021 and 2022, highlighting net sales, gross profit, gross margin, selling and administrative expenses, operating profit, and operating margin.

Profit And Loss Statement Professional Services And Tax Advisory Company Profile CP SS V
This slide represents the profit and loss statement highlights for Ernst and Young. It includes last 5 years revenue, operating profit, research and operating loss.Coming up with a presentation necessitates that the majority of the effort goes into the content and the message you intend to convey. The visuals of a PowerPoint presentation can only be effective if it supplements and supports the story that is being told. Keeping this in mind our experts created Profit And Loss Statement Professional Services And Tax Advisory Company Profile CP SS V to reduce the time that goes into designing the presentation. This way, you can concentrate on the message while our designers take care of providing you with the right template for the situation. This slide represents the profit and loss statement highlights for Ernst and Young. It includes last 5 years revenue, operating profit, research and operating loss.
Business Unit 1 Beauty And Wellbeing Home Care Solutions Company Profile CP SS V
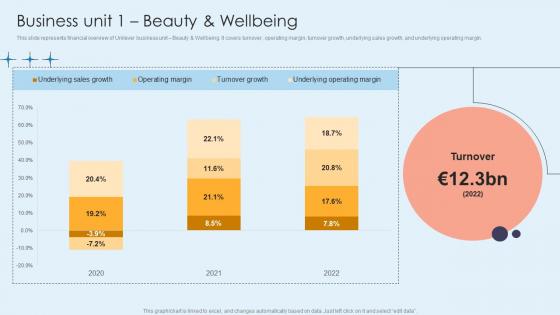
This slide represents financial overview of Unilever business unit Beauty and Wellbeing. It covers turnover, operating margin, turnover growth, underlying sales growth, and underlying operating margin.Slidegeeks is one of the best resources for PowerPoint templates. You can download easily and regulate Business Unit 1 Beauty And Wellbeing Home Care Solutions Company Profile CP SS V for your personal presentations from our wonderful collection. A few clicks is all it takes to discover and get the most relevant and appropriate templates. Use our Templates to add a unique zing and appeal to your presentation and meetings. All the slides are easy to edit and you can use them even for advertisement purposes. This slide represents financial overview of Unilever business unit Beauty and Wellbeing. It covers turnover, operating margin, turnover growth, underlying sales growth, and underlying operating margin.

Business Unit 2 Personal Care Home Care Solutions Company Profile CP SS V
This slide represents financial overview of Unilever business unit personal care. It covers turnover, operating margin, turnover growth, underlying sales growth, and underlying operating margin.Want to ace your presentation in front of a live audience Our Business Unit 2 Personal Care Home Care Solutions Company Profile CP SS V can help you do that by engaging all the users towards you. Slidegeeks experts have put their efforts and expertise into creating these impeccable powerpoint presentations so that you can communicate your ideas clearly. Moreover, all the templates are customizable, and easy-to-edit and downloadable. Use these for both personal and commercial use. This slide represents financial overview of Unilever business unit personal care. It covers turnover, operating margin, turnover growth, underlying sales growth, and underlying operating margin.

Business Unit 5 Ice Cream Home Care Solutions Company Profile CP SS V
This slide represents financial overview of Unilever business unit Ice cream. It covers turnover, operating margin, turnover growth, underlying sales growth, and underlying operating margin.Get a simple yet stunning designed Business Unit 5 Ice Cream Home Care Solutions Company Profile CP SS V. It is the best one to establish the tone in your meetings. It is an excellent way to make your presentations highly effective. So, download this PPT today from Slidegeeks and see the positive impacts. Our easy-to-edit Business Unit 5 Ice Cream Home Care Solutions Company Profile CP SS V can be your go-to option for all upcoming conferences and meetings. So, what are you waiting for Grab this template today. This slide represents financial overview of Unilever business unit Ice cream. It covers turnover, operating margin, turnover growth, underlying sales growth, and underlying operating margin.
IKEA Business Model Cost Structure IKEAs Successful Market Expansion PPT Template Strategy SS V
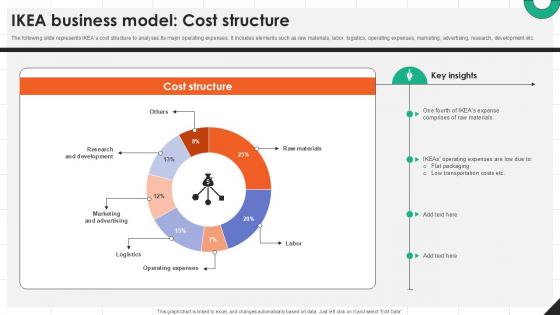
The following slide represents IKEAs cost structure to analyses its major operating expenses. It includes elements such as raw materials, labor, logistics, operating expenses, marketing, advertising, research, development etc. Are you in need of a template that can accommodate all of your creative concepts This one is crafted professionally and can be altered to fit any style. Use it with Google Slides or PowerPoint. Include striking photographs, symbols, depictions, and other visuals. Fill, move around, or remove text boxes as desired. Test out color palettes and font mixtures. Edit and save your work, or work with colleagues. Download IKEA Business Model Cost Structure IKEAs Successful Market Expansion PPT Template Strategy SS V and observe how to make your presentation outstanding. Give an impeccable presentation to your group and make your presentation unforgettable. The following slide represents IKEAs cost structure to analyses its major operating expenses. It includes elements such as raw materials, labor, logistics, operating expenses, marketing, advertising, research, development etc.

Analyzing Income Statement Annually To Monitor Business Customer Segmentation Clipart Pdf
This slide provides glimpse about year over year profit and loss statement to assess the profitability of Nestle SA. It includes net sales, EBITDA, operating profit, operating margin, pre-tax benefit, net income, net margin, etc. If your project calls for a presentation, then Slidegeeks is your go-to partner because we have professionally designed, easy-to-edit templates that are perfect for any presentation. After downloading, you can easily edit Analyzing Income Statement Annually To Monitor Business Customer Segmentation Clipart Pdf and make the changes accordingly. You can rearrange slides or fill them with different images. Check out all the handy templates This slide provides glimpse about year over year profit and loss statement to assess the profitability of Nestle SA. It includes net sales, EBITDA, operating profit, operating margin, pre-tax benefit, net income, net margin, etc.
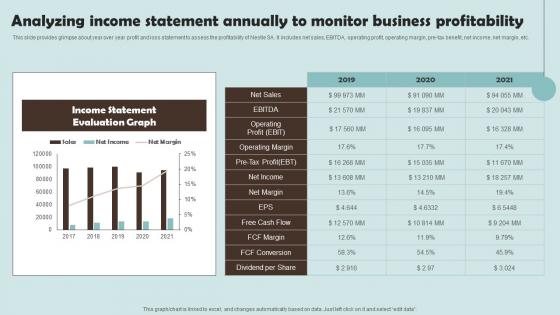
Analyzing Income Statement Annually To Monitor Outline Of Nestle Management Formats Pdf
This slide provides glimpse about year over year profit and loss statement to assess the profitability of Nestle SA. It includes net sales, EBITDA, operating profit, operating margin, pre-tax benefit, net income, net margin, etc.Slidegeeks is one of the best resources for PowerPoint templates. You can download easily and regulate Analyzing Income Statement Annually To Monitor Outline Of Nestle Management Formats Pdf for your personal presentations from our wonderful collection. A few clicks is all it takes to discover and get the most relevant and appropriate templates. Use our Templates to add a unique zing and appeal to your presentation and meetings. All the slides are easy to edit and you can use them even for advertisement purposes. This slide provides glimpse about year over year profit and loss statement to assess the profitability of Nestle SA. It includes net sales, EBITDA, operating profit, operating margin, pre tax benefit, net income, net margin, etc.

Business Diagram Cloud Computing Stack Showing Layers From Storage To Application Presentation Templ
This diagram contains cloud computing stack showing layers from storage to application. This text boxes diagram is designed to depict application, middleware, database, Operating System, virtual machine, servers and storage. Make a wonderful presentation with this innovative diagram
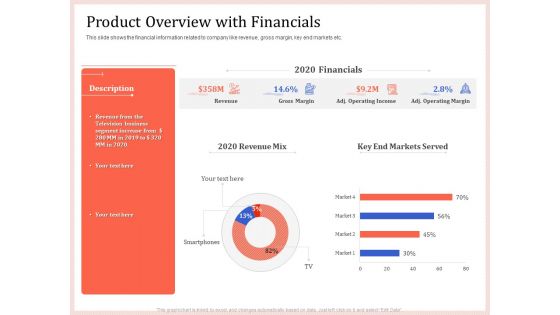
Pitch Deck To Raise Capital From Product Pooled Funding Product Overview With Financials Diagrams PDF
This slide shows the financial information related to company like revenue, gross margin, key end markets etc. Deliver and pitch your topic in the best possible manner with this pitch deck to raise capital from product pooled funding product overview with financials diagrams pdf. Use them to share invaluable insights on revenue, gross margin, operating income, operating margin and impress your audience. This template can be altered and modified as per your expectations. So, grab it now.
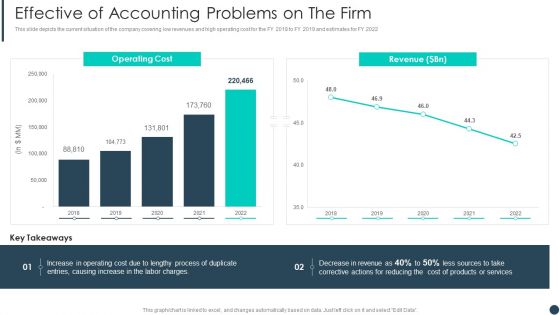
Cost Allotment Technique Effective Of Accounting Problems On The Firm Diagrams PDF
This slide depicts the current situation of the company covering low revenues and high operating cost for the FY 2018 to FY 2019 and estimates for FY 2022.Deliver and pitch your topic in the best possible manner with this Cost Allotment Technique Effective Of Accounting Problems On The Firm Diagrams PDF. Use them to share invaluable insights on Operating Cost, Revenue, Labor Charges and impress your audience. This template can be altered and modified as per your expectations. So, grab it now.
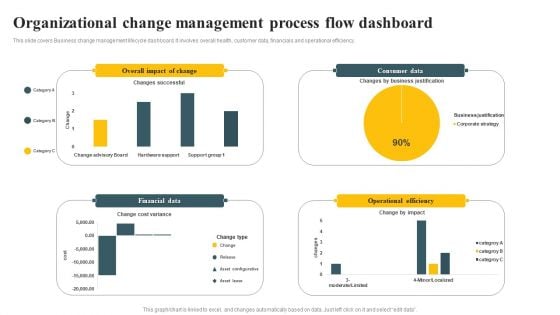
Organizational Change Management Process Flow Dashboard Ppt PowerPoint Presentation Diagram PDF
This slide covers Business change management lifecycle dashboard. It involves overall health, customer data, financials and operational efficiency. Pitch your topic with ease and precision using this Organizational Change Management Process Flow Dashboard Ppt PowerPoint Presentation Diagram PDF. This layout presents information on Financial Data, Operational Efficiency, Consumer Data. It is also available for immediate download and adjustment. So, changes can be made in the color, design, graphics or any other component to create a unique layout.
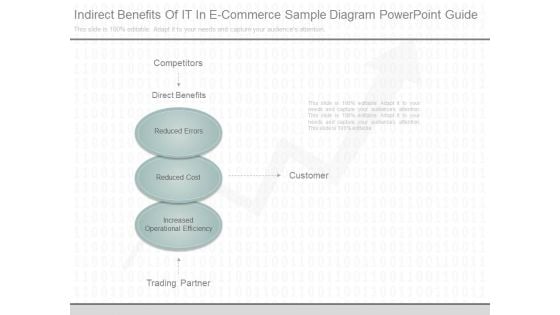
Indirect Benefits Of It In E Commerce Sample Diagram Powerpoint Guide
This is a indirect benefits of it in e commerce sample diagram powerpoint guide. This is a three stage process. The stages in this process are competitors, direct benefits, reduced errors, reduced cost, customer, increased operational efficiency, trading partner.
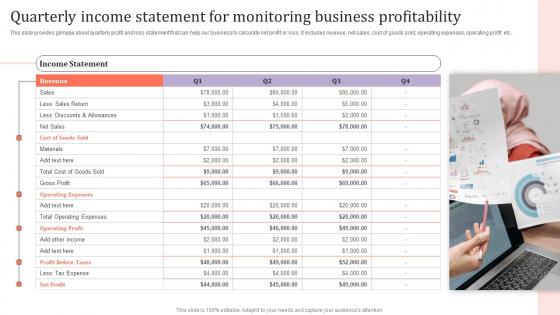
Quarterly Income Statement For Monitoring Assessing Corporate Financial Techniques Diagrams Pdf
This slide provides glimpse about quarterly profit and loss statement that can help our business to calculate net profit or loss. It includes revenue, net sales, cost of goods sold, operating expenses, operating profit, etc. Take your projects to the next level with our ultimate collection of Quarterly Income Statement For Monitoring Assessing Corporate Financial Techniques Diagrams Pdf. Slidegeeks has designed a range of layouts that are perfect for representing task or activity duration, keeping track of all your deadlines at a glance. Tailor these designs to your exact needs and give them a truly corporate look with your own brand colors they will make your projects stand out from the rest This slide provides glimpse about quarterly profit and loss statement that can help our business to calculate net profit or loss. It includes revenue, net sales, cost of goods sold, operating expenses, operating profit, etc.
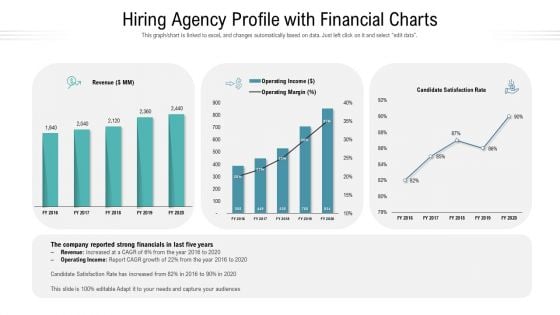
Hiring Agency Profile With Financial Charts Ppt Model Example PDF
This graph or chart is linked to excel, and changes automatically based on data. Just left click on it and select edit data. Pitch your topic with ease and precision using this hiring agency profile with financial charts ppt model example pdf. This layout presents information on revenue, operating income, operating margin, satisfaction rate. It is also available for immediate download and adjustment. So, changes can be made in the color, design, graphics or any other component to create a unique layout.
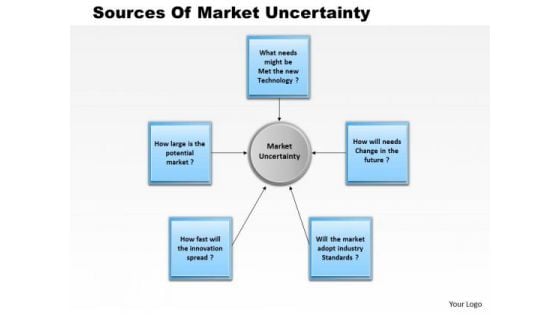
Business Framework Sources Of Market Uncertainty PowerPoint Presentation
Explain the sources of market uncertainty with this exclusive business framework power point template. This PPT contains the graphic of text boxes in circular design with interconnection. Explain process flow and operation techniques with this unique PPT.

Gather Facts Competitor Analysis Example Of Ppt Presentation
This is a gather facts competitor analysis example of ppt presentation. This is a six stage process. The stages in this process are review plans, gather facts, competitor analysis, key strategies, operational plans, threats and strengths.
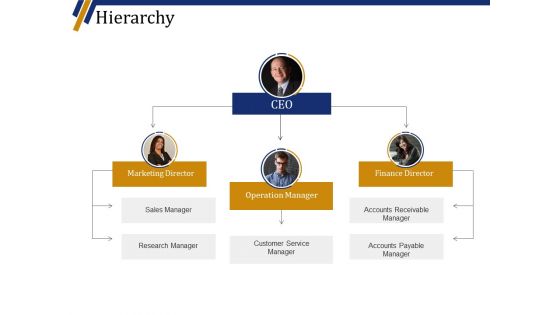
Hierarchy Ppt PowerPoint Presentation Layouts Visuals
This is a hierarchy ppt powerpoint presentation layouts visuals. This is a three stage process. The stages in this process are marketing director, operation manager, finance director, sales manager, research manager.
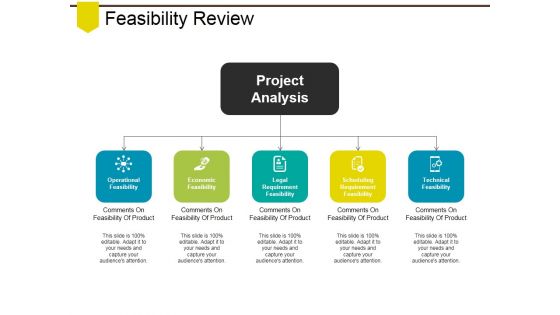
Feasibility Review Ppt PowerPoint Presentation Infographic Template Demonstration
This is a feasibility review ppt powerpoint presentation infographic template demonstration. This is a three stage process. The stages in this process are operational feasibility, economic feasibility, legal requirement feasibility, scheduling requirement feasibility, technical feasibility.
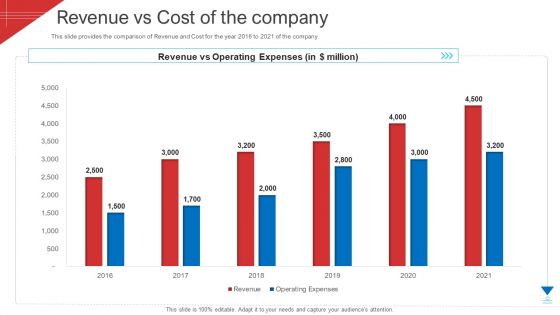
Investor Deck To Arrange Funds From Short Term Loan Revenue Vs Cost Of The Company Diagrams PDF
This slide provides the comparison of Revenue and Cost for the year 2016 to 2021 of the company. Deliver an awe inspiring pitch with this creative investor deck to arrange funds from short term loan revenue vs cost of the company diagrams pdf bundle. Topics like revenue vs operating expenses, revenue, operating expenses can be discussed with this completely editable template. It is available for immediate download depending on the needs and requirements of the user.
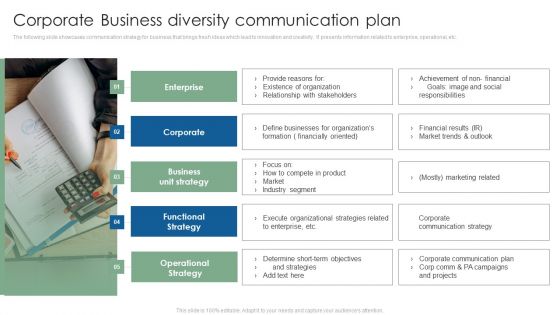
Corporate Business Diversity Communication Plan Themes PDF
The following slide showcases communication strategy for business that brings fresh ideas which lead to innovation and creativity. It presents information related to enterprise, operational, etc. Presenting Corporate Business Diversity Communication Plan Themes PDF to dispense important information. This template comprises five stages. It also presents valuable insights into the topics including Enterprise, Business Unit Strategy, Operational Strategy. This is a completely customizable PowerPoint theme that can be put to use immediately. So, download it and address the topic impactfully.
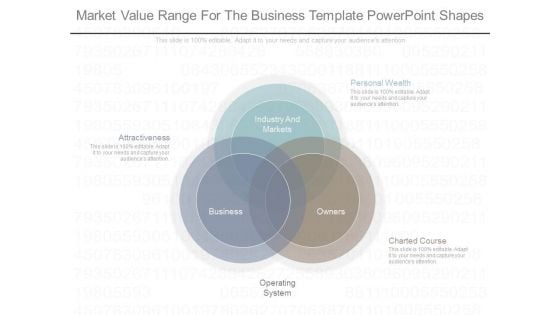
Market Value Range For The Business Template Powerpoint Shapes
This is a market value range for the business template powerpoint shapes. This is a three stage process. The stages in this process are attractiveness, personal wealth, operating system, charted course, industry and markets, business, owners.
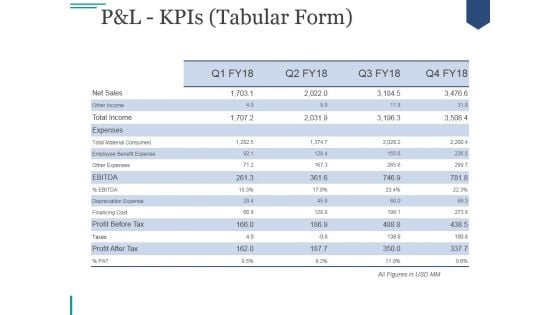
Pandl Kpis Tabular Form Ppt PowerPoint Presentation Visual Aids
This is a pandl kpis tabular form ppt powerpoint presentation visual aids. This is a four stage process. The stages in this process are revenue, cogs, operating profit, net profit.
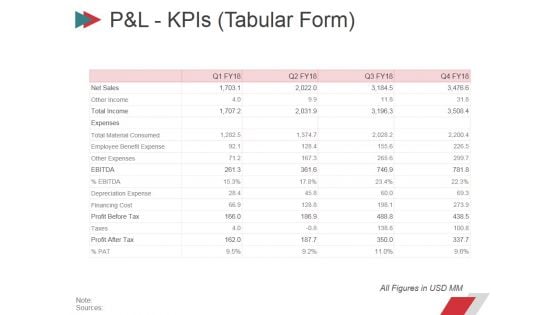
Pandl Kpis Tabular Form Ppt PowerPoint Presentation Summary Layout
This is a pandl kpis tabular form ppt powerpoint presentation summary layout. This is a four stage process. The stages in this process are revenue, cogs, operating profit, net profit.
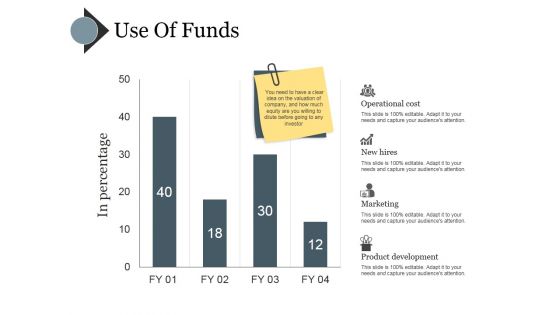
Use Of Funds Ppt PowerPoint Presentation Portfolio Clipart
This is a use of funds ppt powerpoint presentation portfolio clipart. This is a four stage process. The stages in this process are operational cost, new hires, marketing, product development.
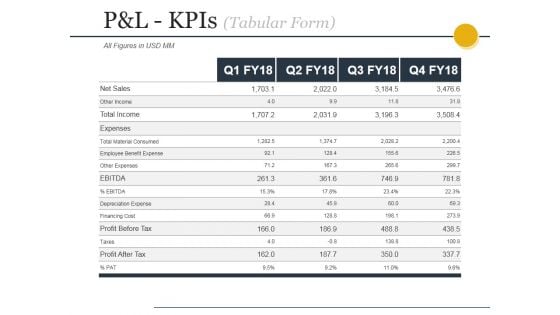
Pandl Kpis Tabular Form Ppt PowerPoint Presentation File Design Templates
This is a pandl kpis tabular form ppt powerpoint presentation file design templates. This is a four stage process. The stages in this process are revenue, cogs, operating profit, net profit.
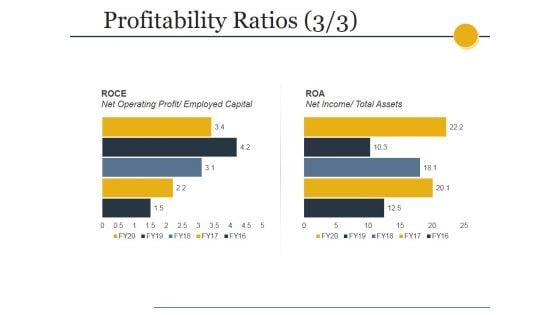
Profitability Ratios Template 3 Ppt PowerPoint Presentation Show Graphics Download
This is a profitability ratios template 3 ppt powerpoint presentation show graphics download. This is a two stage process. The stages in this process are roce, net operating profit, employed capital, roa, net income, total assets.
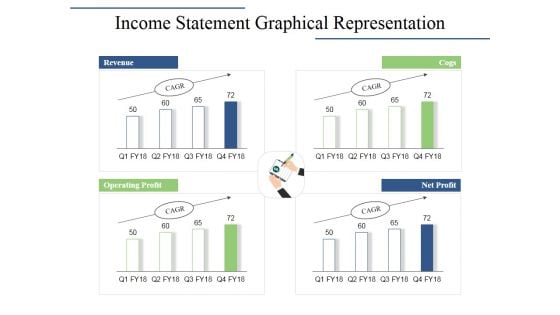
Income Statement Graphical Representation Ppt PowerPoint Presentation Infographics Layouts
This is a income statement graphical representation ppt powerpoint presentation infographics layouts. This is a four stage process. The stages in this process are revenue, cogs, operating profit, net profit.
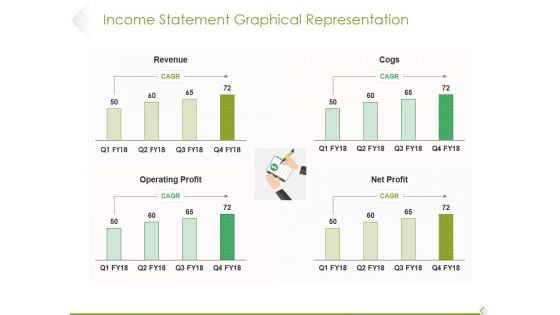
Income Statement Graphical Representation Ppt PowerPoint Presentation Infographic Template Influencers
This is a income statement graphical representation ppt powerpoint presentation infographic template influencers. This is a four stage process. The stages in this process are revenue, cogs, operating profit, profit.
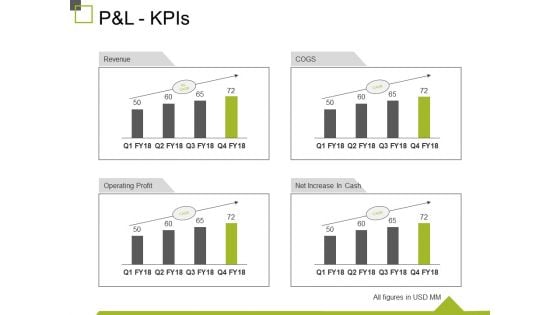
P And L Kpis Ppt PowerPoint Presentation Show Design Inspiration
This is a p and l kpis ppt powerpoint presentation show design inspiration. This is a four stage process. The stages in this process are revenue, operating profit, cogs, net increase in cash, business.
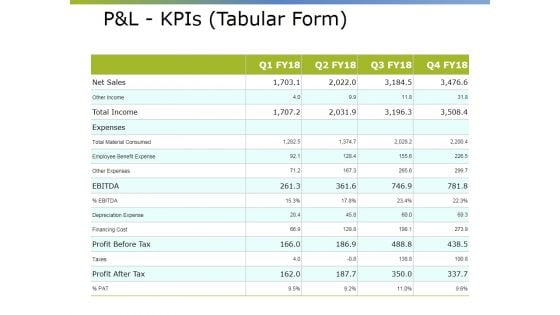
Pandl Kpis Tabular Form Ppt PowerPoint Presentation Pictures Visual Aids
This is a pandl kpis tabular form ppt powerpoint presentation pictures visual aids. This is a four stage process. The stages in this process are revenue, operating profit, cogs, net profit.
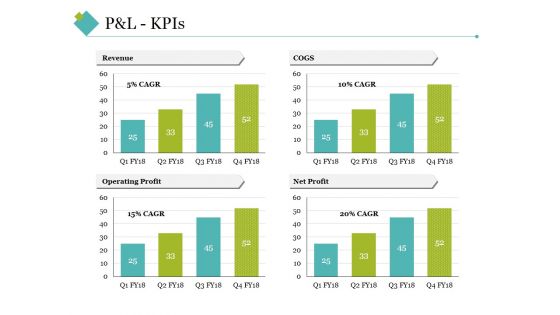
P And L Kpis Template 2 Ppt PowerPoint Presentation Inspiration Grid
This is a p and l kpis template 2 ppt powerpoint presentation inspiration grid. This is a four stage process. The stages in this process are revenue, cogs, operating profit, net profit.

 Home
Home