Operations Icon
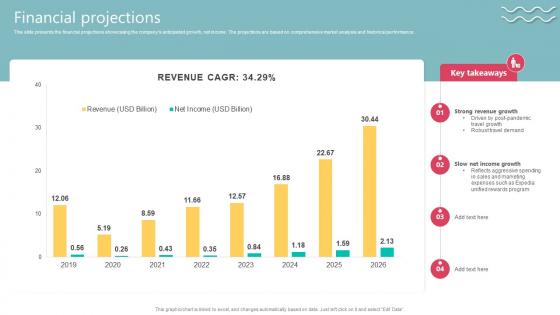
Financial Projections Travel Technology Company Business Model BMC SS V
This slide presents the financial projections showcasing the companys anticipated growth, net income. The projections are based on comprehensive market analysis and historical performance. Do you have to make sure that everyone on your team knows about any specific topic I yes, then you should give Financial Projections Travel Technology Company Business Model BMC SS V a try. Our experts have put a lot of knowledge and effort into creating this impeccable Financial Projections Travel Technology Company Business Model BMC SS V. You can use this template for your upcoming presentations, as the slides are perfect to represent even the tiniest detail. You can download these templates from the Slidegeeks website and these are easy to edit. So grab these today This slide presents the financial projections showcasing the companys anticipated growth, net income. The projections are based on comprehensive market analysis and historical performance.
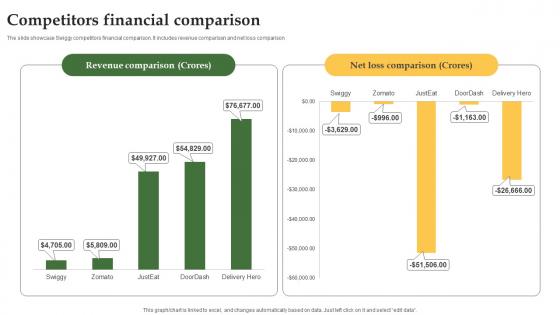
Competitors Financial Comparison Grocery Delivery Company Profile CP SS V
The slide showcase Swiggy competitors financial comparison. It includes revenue comparison and net loss comparison. Do you have to make sure that everyone on your team knows about any specific topic I yes, then you should give Competitors Financial Comparison Grocery Delivery Company Profile CP SS V a try. Our experts have put a lot of knowledge and effort into creating this impeccable Competitors Financial Comparison Grocery Delivery Company Profile CP SS V. You can use this template for your upcoming presentations, as the slides are perfect to represent even the tiniest detail. You can download these templates from the Slidegeeks website and these are easy to edit. So grab these today The slide showcase Swiggy competitors financial comparison. It includes revenue comparison and net loss comparison.
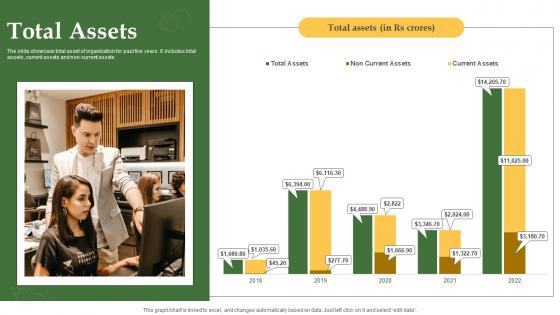
Total Assets Grocery Delivery Company Profile CP SS V
The slide showcase total asset of organization for past five years. It includes total assets, current assets and non-current assets. Do you have to make sure that everyone on your team knows about any specific topic I yes, then you should give Total Assets Grocery Delivery Company Profile CP SS V a try. Our experts have put a lot of knowledge and effort into creating this impeccable Total Assets Grocery Delivery Company Profile CP SS V. You can use this template for your upcoming presentations, as the slides are perfect to represent even the tiniest detail. You can download these templates from the Slidegeeks website and these are easy to edit. So grab these today The slide showcase total asset of organization for past five years. It includes total assets, current assets and non-current assets.
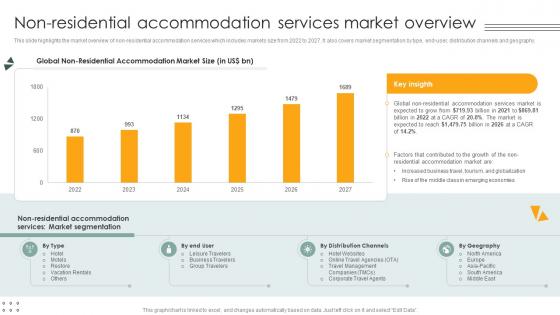
Non Residential Accommodation Services Market Overview Lodging And Accommodation Industry IR SS V
This slide highlights the market overview of non-residential accommodation services which includes markets size from 2022 to 2027. It also covers market segmentation by type, end-user, distribution channels and geography. Take your projects to the next level with our ultimate collection of Non Residential Accommodation Services Market Overview Lodging And Accommodation Industry IR SS V. Slidegeeks has designed a range of layouts that are perfect for representing task or activity duration, keeping track of all your deadlines at a glance. Tailor these designs to your exact needs and give them a truly corporate look with your own brand colors they will make your projects stand out from the rest This slide highlights the market overview of non-residential accommodation services which includes markets size from 2022 to 2027. It also covers market segmentation by type, end-user, distribution channels and geography.
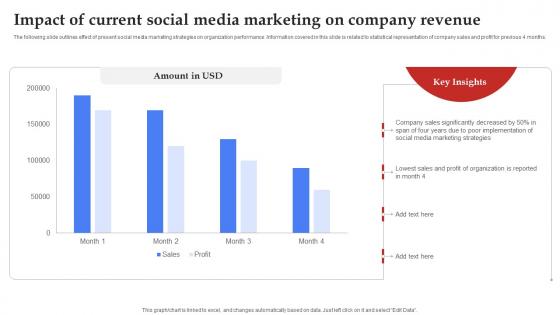
Facebook Marketing Plan Impact Of Current Social Media Marketing Strategy SS V
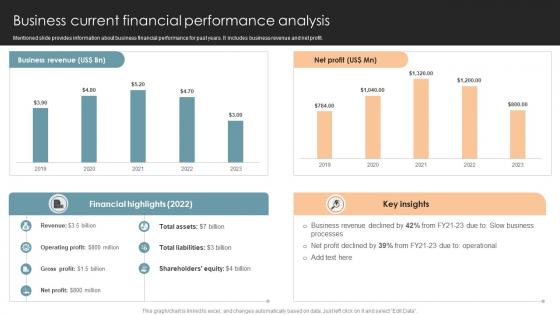
Business Current Financial Performance Analysis Office Process Optimization To Increase Cost Efficiency
Mentioned slide provides information about business financial performance for past years. It includes business revenue and net profit.Do you have to make sure that everyone on your team knows about any specific topic I yes, then you should give Business Current Financial Performance Analysis Office Process Optimization To Increase Cost Efficiency a try. Our experts have put a lot of knowledge and effort into creating this impeccable Business Current Financial Performance Analysis Office Process Optimization To Increase Cost Efficiency. You can use this template for your upcoming presentations, as the slides are perfect to represent even the tiniest detail. You can download these templates from the Slidegeeks website and these are easy to edit. So grab these today Mentioned slide provides information about business financial performance for past years. It includes business revenue and net profit.
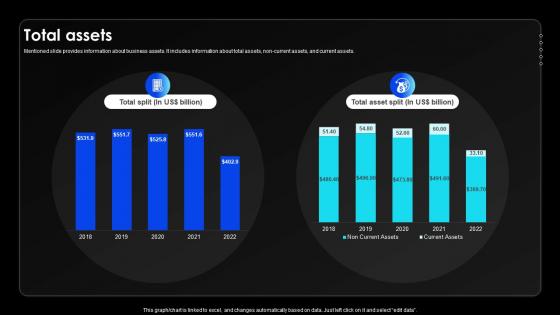
Total Assets Wireless Communication Services Provider Company Profile CP SS V
Mentioned slide provides information about business assets. It includes information about total assets, non-current assets, and current assets.Do you have to make sure that everyone on your team knows about any specific topic I yes, then you should give Total Assets Wireless Communication Services Provider Company Profile CP SS V a try. Our experts have put a lot of knowledge and effort into creating this impeccable Total Assets Wireless Communication Services Provider Company Profile CP SS V. You can use this template for your upcoming presentations, as the slides are perfect to represent even the tiniest detail. You can download these templates from the Slidegeeks website and these are easy to edit. So grab these today Mentioned slide provides information about business assets. It includes information about total assets, non-current assets, and current assets.
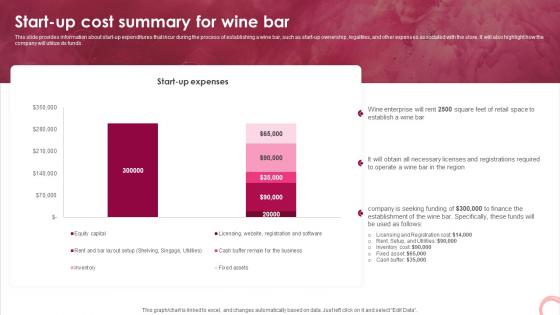
Wine Lounge Business Plan Start Up Cost Summary For Wine Bar BP SS V
This slide provides information about start-up expenditures that incur during the process of establishing a wine bar, such as start-up ownership, legalities, and other expenses associated with the store. It will also highlight how the company will utilize its funds. Take your projects to the next level with our ultimate collection of Wine Lounge Business Plan Start Up Cost Summary For Wine Bar BP SS V. Slidegeeks has designed a range of layouts that are perfect for representing task or activity duration, keeping track of all your deadlines at a glance. Tailor these designs to your exact needs and give them a truly corporate look with your own brand colors they will make your projects stand out from the rest This slide provides information about start-up expenditures that incur during the process of establishing a wine bar, such as start-up ownership, legalities, and other expenses associated with the store. It will also highlight how the company will utilize its funds.
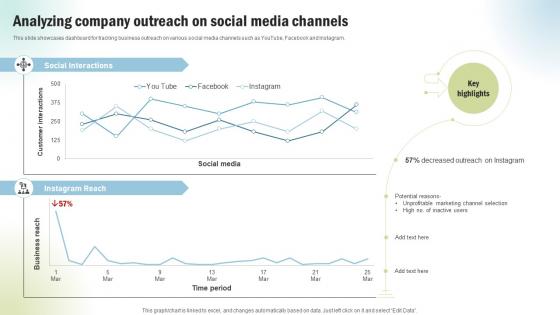
Marketing Project Performance Benchmarking To Enhance Analyzing Company Outreach CRP SS V
This slide showcases dashboard for tracking business outreach on various social media channels such as YouTube, Facebook and Instagram. Do you have to make sure that everyone on your team knows about any specific topic I yes, then you should give Marketing Project Performance Benchmarking To Enhance Analyzing Company Outreach CRP SS V a try. Our experts have put a lot of knowledge and effort into creating this impeccable Marketing Project Performance Benchmarking To Enhance Analyzing Company Outreach CRP SS V. You can use this template for your upcoming presentations, as the slides are perfect to represent even the tiniest detail. You can download these templates from the Slidegeeks website and these are easy to edit. So grab these today This slide showcases dashboard for tracking business outreach on various social media channels such as YouTube, Facebook and Instagram.

Increasing Business Awareness Introducing Social Media Marketing For Creating Strategy SS V
This slide presents an overview of social media marketing. It also include a graph showcasing the associated benefits of social media for insurers such as marketing, customer service, new sales leads, fraud detection and risk selection. Take your projects to the next level with our ultimate collection of Increasing Business Awareness Introducing Social Media Marketing For Creating Strategy SS V. Slidegeeks has designed a range of layouts that are perfect for representing task or activity duration, keeping track of all your deadlines at a glance. Tailor these designs to your exact needs and give them a truly corporate look with your own brand colors they will make your projects stand out from the rest This slide presents an overview of social media marketing. It also include a graph showcasing the associated benefits of social media for insurers such as marketing, customer service, new sales leads, fraud detection and risk selection
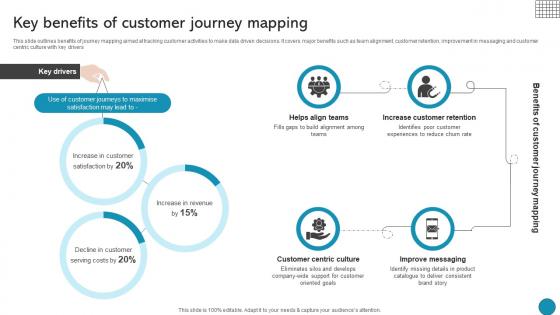
Key Benefits Of Customer Journey Mapping Driving Business Success Integrating Product
This slide outlines benefits of journey mapping aimed at tracking customer activities to make data driven decisions. It covers major benefits such as team alignment, customer retention, improvement in messaging and customer centric culture with key drivers Take your projects to the next level with our ultimate collection of Key Benefits Of Customer Journey Mapping Driving Business Success Integrating Product. Slidegeeks has designed a range of layouts that are perfect for representing task or activity duration, keeping track of all your deadlines at a glance. Tailor these designs to your exact needs and give them a truly corporate look with your own brand colors they will make your projects stand out from the rest This slide outlines benefits of journey mapping aimed at tracking customer activities to make data driven decisions. It covers major benefits such as team alignment, customer retention, improvement in messaging and customer centric culture with key drivers
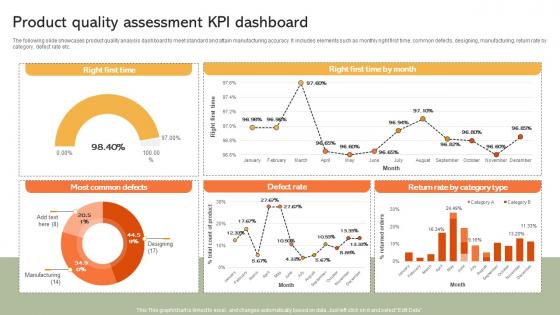
Product Quality Assessment KPI Dashboard Implementing Manufacturing Strategy SS V
The following slide showcases product quality analysis dashboard to meet standard and attain manufacturing accuracy. It includes elements such as monthly right first time, common defects, designing, manufacturing, return rate by category, defect rate etc. Take your projects to the next level with our ultimate collection of Product Quality Assessment KPI Dashboard Implementing Manufacturing Strategy SS V. Slidegeeks has designed a range of layouts that are perfect for representing task or activity duration, keeping track of all your deadlines at a glance. Tailor these designs to your exact needs and give them a truly corporate look with your own brand colors they will make your projects stand out from the rest The following slide showcases product quality analysis dashboard to meet standard and attain manufacturing accuracy. It includes elements such as monthly right first time, common defects, designing, manufacturing, return rate by category, defect rate etc.
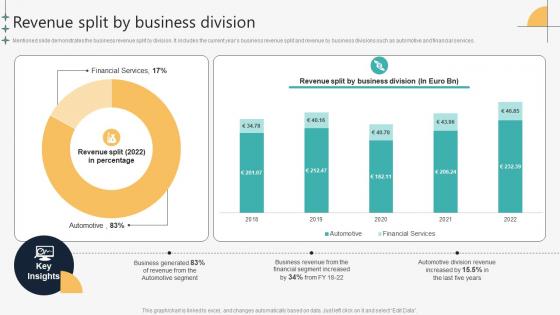
Revenue Split By Business Division Automotive Manufacturing Company Profile CP SS V
Mentioned slide demonstrates the business revenue split by division. It includes the current years business revenue split and revenue by business divisions such as automotive and financial services.Take your projects to the next level with our ultimate collection of Revenue Split By Business Division Automotive Manufacturing Company Profile CP SS V. Slidegeeks has designed a range of layouts that are perfect for representing task or activity duration, keeping track of all your deadlines at a glance. Tailor these designs to your exact needs and give them a truly corporate look with your own brand colors they will make your projects stand out from the rest Mentioned slide demonstrates the business revenue split by division. It includes the current years business revenue split and revenue by business divisions such as automotive and financial services.
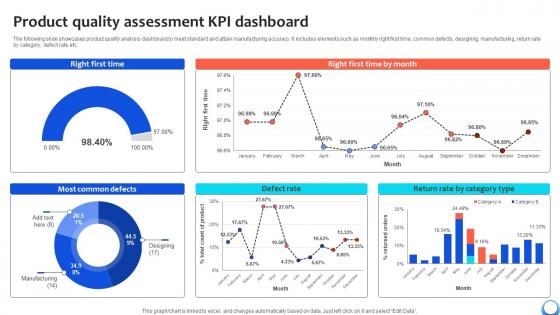
Product Quality Assessment KPI Dashboard Automating Production Process Strategy SS V
The following slide showcases product quality analysis dashboard to meet standard and attain manufacturing accuracy. It includes elements such as monthly right first time, common defects, designing, manufacturing, return rate by category, defect rate etc. Take your projects to the next level with our ultimate collection of Product Quality Assessment KPI Dashboard Automating Production Process Strategy SS V. Slidegeeks has designed a range of layouts that are perfect for representing task or activity duration, keeping track of all your deadlines at a glance. Tailor these designs to your exact needs and give them a truly corporate look with your own brand colors they will make your projects stand out from the rest The following slide showcases product quality analysis dashboard to meet standard and attain manufacturing accuracy. It includes elements such as monthly right first time, common defects, designing, manufacturing, return rate by category, defect rate etc.
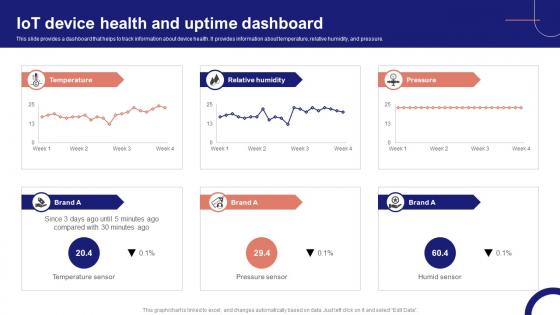
IoT Device Management Fundamentals IoT Device Health And Uptime Dashboard IoT Ss V
This slide provides a dashboard that helps to track information about device health. It provides information about temperature, relative humidity, and pressure. Take your projects to the next level with our ultimate collection of IoT Device Management Fundamentals IoT Device Health And Uptime Dashboard IoT SS V. Slidegeeks has designed a range of layouts that are perfect for representing task or activity duration, keeping track of all your deadlines at a glance. Tailor these designs to your exact needs and give them a truly corporate look with your own brand colors they will make your projects stand out from the rest This slide provides a dashboard that helps to track information about device health. It provides information about temperature, relative humidity, and pressure.
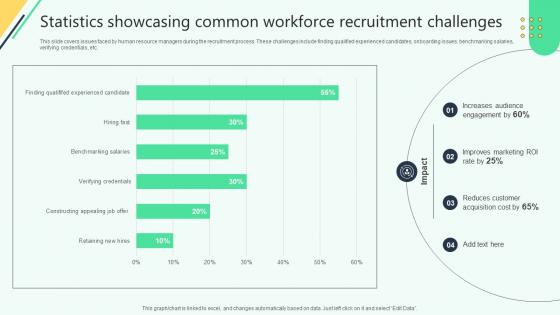
Statistics Showcasing Common Workforce Recruitment Analysing Hr Data For Effective Decision Making
This slide covers issues faced by human resource managers during the recruitment process. These challenges include finding qualified experienced candidates, onboarding issues, benchmarking salaries,verifying credentials, etc. Do you have to make sure that everyone on your team knows about any specific topic I yes, then you should give Statistics Showcasing Common Workforce Recruitment Analysing Hr Data For Effective Decision Making a try. Our experts have put a lot of knowledge and effort into creating this impeccable Statistics Showcasing Common Workforce Recruitment Analysing Hr Data For Effective Decision Making. You can use this template for your upcoming presentations, as the slides are perfect to represent even the tiniest detail. You can download these templates from the Slidegeeks website and these are easy to edit. So grab these today This slide covers issues faced by human resource managers during the recruitment process. These challenges include finding qualified experienced candidates, onboarding issues, benchmarking salaries,verifying credentials, etc.
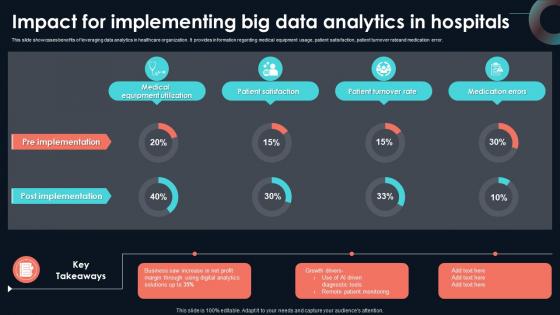
Impact For Implementing Big Data Analytics Developing Strategic Insights Using Big Data Analytics SS V
This slide showcases benefits of leveraging data analytics in healthcare organization. It provides information regarding medical equipment usage, patient satisfaction, patient turnover rateand medication error. Take your projects to the next level with our ultimate collection of Impact For Implementing Big Data Analytics Developing Strategic Insights Using Big Data Analytics SS V. Slidegeeks has designed a range of layouts that are perfect for representing task or activity duration, keeping track of all your deadlines at a glance. Tailor these designs to your exact needs and give them a truly corporate look with your own brand colors they will make your projects stand out from the rest This slide showcases benefits of leveraging data analytics in healthcare organization. It provides information regarding medical equipment usage, patient satisfaction, patient turnover rateand medication error.
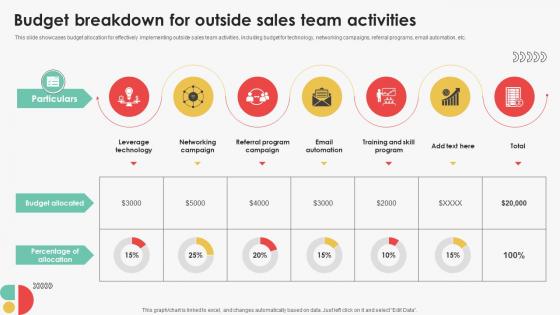
Budget Breakdown For Outside Sales Team Activities Efficient Sales Territory Management To Build SA SS V
This slide showcases budget allocation for effectively implementing outside sales team activities, including budget for technology, networking campaigns, referral programs, email automation, etc. Do you have to make sure that everyone on your team knows about any specific topic I yes, then you should give Budget Breakdown For Outside Sales Team Activities Efficient Sales Territory Management To Build SA SS V a try. Our experts have put a lot of knowledge and effort into creating this impeccable Budget Breakdown For Outside Sales Team Activities Efficient Sales Territory Management To Build SA SS V. You can use this template for your upcoming presentations, as the slides are perfect to represent even the tiniest detail. You can download these templates from the Slidegeeks website and these are easy to edit. So grab these today This slide showcases budget allocation for effectively implementing outside sales team activities, including budget for technology, networking campaigns, referral programs, email automation, etc.
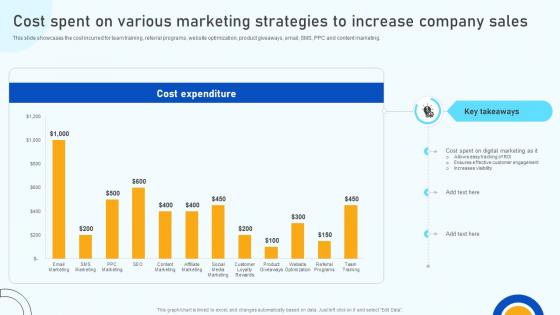
Digital Marketing Strategies Cost Spent On Various Marketing Strategies To Increase SA SS V
This slide showcases the cost incurred for team training, referral programs, website optimization, product giveaways, email, SMS, PPC and content marketing. Do you have to make sure that everyone on your team knows about any specific topic I yes, then you should give Digital Marketing Strategies Cost Spent On Various Marketing Strategies To Increase SA SS V a try. Our experts have put a lot of knowledge and effort into creating this impeccable Digital Marketing Strategies Cost Spent On Various Marketing Strategies To Increase SA SS V. You can use this template for your upcoming presentations, as the slides are perfect to represent even the tiniest detail. You can download these templates from the Slidegeeks website and these are easy to edit. So grab these today This slide showcases the cost incurred for team training, referral programs, website optimization, product giveaways, email, SMS, PPC and content marketing.
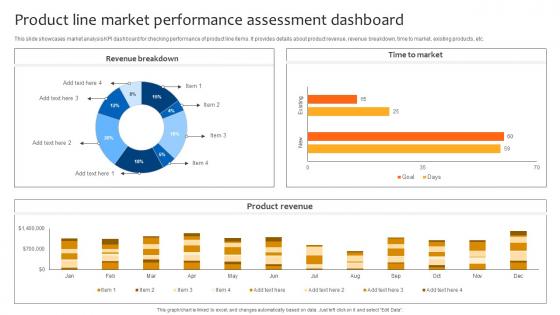
Deploying Strategies For Business Product Line Market Performance Assessment Dashboard Strategy SS V
This slide showcases market analysis KPI dashboard for checking performance of product line items. It provides details about product revenue, revenue breakdown, time to market, existing products, etc. Take your projects to the next level with our ultimate collection of Deploying Strategies For Business Product Line Market Performance Assessment Dashboard Strategy SS V. Slidegeeks has designed a range of layouts that are perfect for representing task or activity duration, keeping track of all your deadlines at a glance. Tailor these designs to your exact needs and give them a truly corporate look with your own brand colors they will make your projects stand out from the rest This slide showcases market analysis KPI dashboard for checking performance of product line items. It provides details about product revenue, revenue breakdown, time to market, existing products, etc.
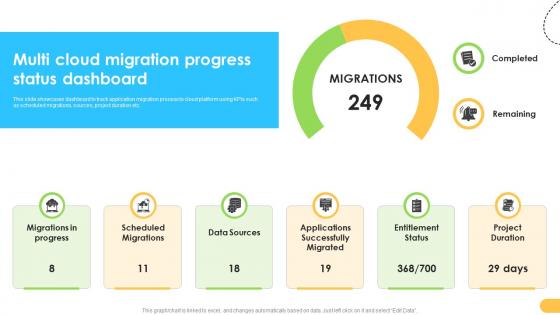
Multi Cloud Migration Progress Status Dashboard Data Migration From On Premises
This slide showcases dashboard to track application migration process to cloud platform using KPIs such as scheduled migrations, sources, project duration etc. Take your projects to the next level with our ultimate collection of Multi Cloud Migration Progress Status Dashboard Data Migration From On Premises. Slidegeeks has designed a range of layouts that are perfect for representing task or activity duration, keeping track of all your deadlines at a glance. Tailor these designs to your exact needs and give them a truly corporate look with your own brand colors they will make your projects stand out from the rest This slide showcases dashboard to track application migration process to cloud platform using KPIs such as scheduled migrations, sources, project duration etc.
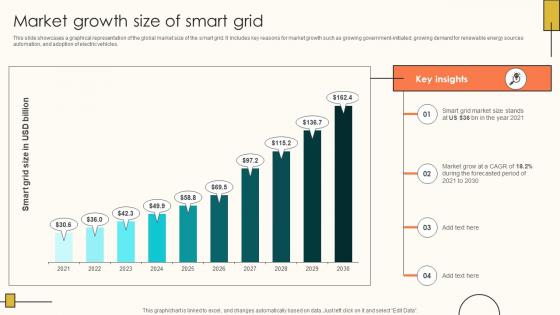
Market Growth Size Of Smart Grid Internet Of Things Solutions To Enhance Energy IoT SS V
This slide showcases a graphical representation of the global market size of the smart grid. It Includes key reasons for market growth such as growing government-initiated, growing demand for renewable energy sources automation, and adoption of electric vehicles. Take your projects to the next level with our ultimate collection of Market Growth Size Of Smart Grid Internet Of Things Solutions To Enhance Energy IoT SS V. Slidegeeks has designed a range of layouts that are perfect for representing task or activity duration, keeping track of all your deadlines at a glance. Tailor these designs to your exact needs and give them a truly corporate look with your own brand colors they will make your projects stand out from the rest This slide showcases a graphical representation of the global market size of the smart grid. It Includes key reasons for market growth such as growing government-initiated, growing demand for renewable energy sources automation, and adoption of electric vehicles.
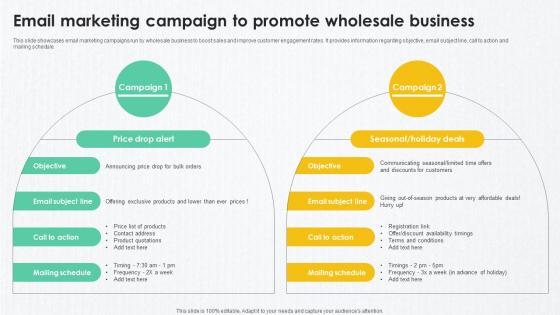
B2B Marketing Techniques To Email Marketing Campaign To Promote Wholesale
This slide showcases email marketing campaigns run by wholesale business to boost sales and improve customer engagement rates. It provides information regarding objective, email subject line, call to action and mailing schedule. Take your projects to the next level with our ultimate collection of B2B Marketing Techniques To Email Marketing Campaign To Promote Wholesale. Slidegeeks has designed a range of layouts that are perfect for representing task or activity duration, keeping track of all your deadlines at a glance. Tailor these designs to your exact needs and give them a truly corporate look with your own brand colors they will make your projects stand out from the rest This slide showcases email marketing campaigns run by wholesale business to boost sales and improve customer engagement rates. It provides information regarding objective, email subject line, call to action and mailing schedule.

IoT Solutions For Oil Oil And Gas Production Monitoring KPI Dashboard IoT SS V
This slide exhibits monthly performance of oil and gas production to track wellhead uptime and overall efficiency. It includes various elements such as production efficiency, well uptime, gas production rate, oil production rate, top performing gas producing wells, etc. Take your projects to the next level with our ultimate collection of IoT Solutions For Oil Oil And Gas Production Monitoring KPI Dashboard IoT SS V. Slidegeeks has designed a range of layouts that are perfect for representing task or activity duration, keeping track of all your deadlines at a glance. Tailor these designs to your exact needs and give them a truly corporate look with your own brand colors they will make your projects stand out from the rest This slide exhibits monthly performance of oil and gas production to track wellhead uptime and overall efficiency. It includes various elements such as production efficiency, well uptime, gas production rate, oil production rate, top performing gas producing wells, etc.
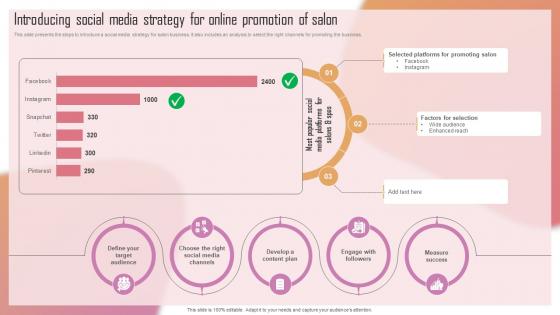
Customizing The Salon Experience Introducing Social Media Strategy For Online Promotion Strategy SS V
This slide presents the steps to introduce a social media strategy for salon business. It also includes an analysis to select the right channels for promoting the business. Take your projects to the next level with our ultimate collection of Customizing The Salon Experience Introducing Social Media Strategy For Online Promotion Strategy SS V. Slidegeeks has designed a range of layouts that are perfect for representing task or activity duration, keeping track of all your deadlines at a glance. Tailor these designs to your exact needs and give them a truly corporate look with your own brand colors they will make your projects stand out from the rest This slide presents the steps to introduce a social media strategy for salon business. It also includes an analysis to select the right channels for promoting the business.
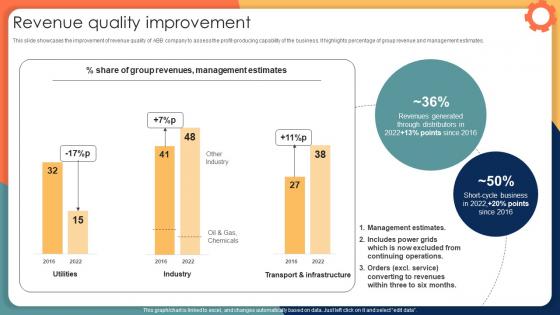
Revenue Quality Improvement Engineering Solution Provider Company Profile CP SS V
This slide showcases the improvement of revenue quality of ABB company to assess the profit-producing capability of the business. It highlights percentage of group revenue and management estimates. Take your projects to the next level with our ultimate collection of Revenue Quality Improvement Engineering Solution Provider Company Profile CP SS V. Slidegeeks has designed a range of layouts that are perfect for representing task or activity duration, keeping track of all your deadlines at a glance. Tailor these designs to your exact needs and give them a truly corporate look with your own brand colors they will make your projects stand out from the rest This slide showcases the improvement of revenue quality of ABB company to assess the profit-producing capability of the business. It highlights percentage of group revenue and management estimates.
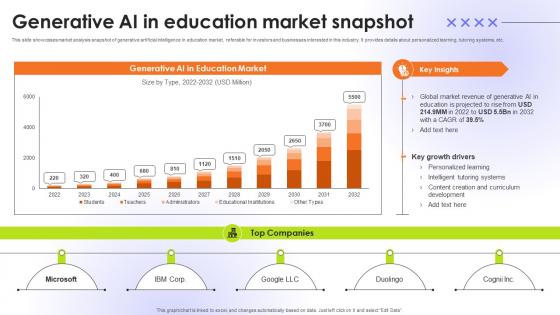
Generative AI In Education Market Snapshot Educational Transformation Through AI SS V
This slide showcases market analysis snapshot of generative artificial intelligence in education market, referable for investors and businesses interested in this industry. It provides details about personalized learning, tutoring systems, etc. Take your projects to the next level with our ultimate collection of Generative AI In Education Market Snapshot Educational Transformation Through AI SS V. Slidegeeks has designed a range of layouts that are perfect for representing task or activity duration, keeping track of all your deadlines at a glance. Tailor these designs to your exact needs and give them a truly corporate look with your own brand colors they will make your projects stand out from the rest This slide showcases market analysis snapshot of generative artificial intelligence in education market, referable for investors and businesses interested in this industry. It provides details about personalized learning, tutoring systems, etc.

Marketing Growth Strategy Performance Dashboard To Measure Marketing Strategy SS V
The following slide outlines key performance indicator KPI dashboard that can assist digital marketers to evaluate marketing campaign performance. The success metrics outlined in slide are total spend on advertisement, cost per thousand CPM, cost per click CPC, click-through rate CTR, etc. Take your projects to the next level with our ultimate collection of Marketing Growth Strategy Performance Dashboard To Measure Marketing Strategy SS V. Slidegeeks has designed a range of layouts that are perfect for representing task or activity duration, keeping track of all your deadlines at a glance. Tailor these designs to your exact needs and give them a truly corporate look with your own brand colors they will make your projects stand out from the rest The following slide outlines key performance indicator KPI dashboard that can assist digital marketers to evaluate marketing campaign performance. The success metrics outlined in slide are total spend on advertisement, cost per thousand CPM, cost per click CPC, click-through rate CTR, etc.
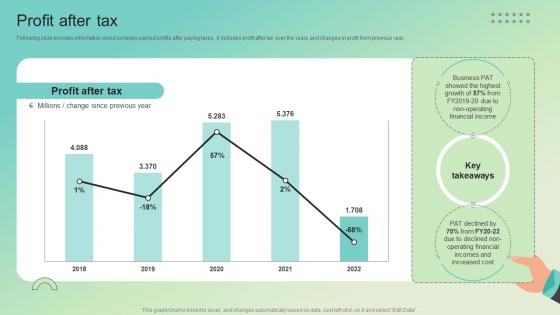
Profit After Tax Enterprise Software Solution Providing Company Profile CP SS V
Following slide provides information about company earned profits after paying taxes. It includes profit after tax over the years and changes in profit from previous year.Do you have to make sure that everyone on your team knows about any specific topic I yes, then you should give Profit After Tax Enterprise Software Solution Providing Company Profile CP SS V a try. Our experts have put a lot of knowledge and effort into creating this impeccable Profit After Tax Enterprise Software Solution Providing Company Profile CP SS V. You can use this template for your upcoming presentations, as the slides are perfect to represent even the tiniest detail. You can download these templates from the Slidegeeks website and these are easy to edit. So grab these today Following slide provides information about company earned profits after paying taxes. It includes profit after tax over the years and changes in profit from previous year.
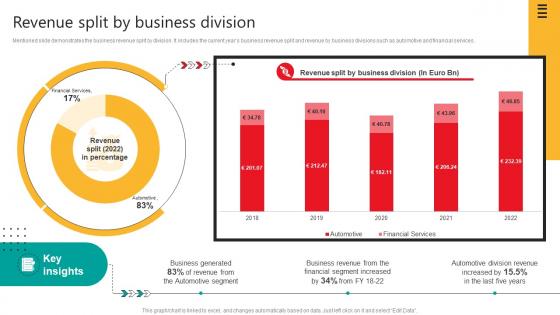
Revenue Split By Business Division Automobile Development Company Profile CP SS V
Mentioned slide demonstrates the business revenue split by division. It includes the current years business revenue split and revenue by business divisions such as automotive and financial services.Take your projects to the next level with our ultimate collection of Revenue Split By Business Division Automobile Development Company Profile CP SS V. Slidegeeks has designed a range of layouts that are perfect for representing task or activity duration, keeping track of all your deadlines at a glance. Tailor these designs to your exact needs and give them a truly corporate look with your own brand colors they will make your projects stand out from the rest Mentioned slide demonstrates the business revenue split by division. It includes the current years business revenue split and revenue by business divisions such as automotive and financial services.

Project Benchmarking Process Analyzing Customer Bounce Rate For Company CRP DK SS V
This slide showcases website bounce rate monitoring which helps in identifying reasons for poor customer engagement such as usability issues etc. Do you have to make sure that everyone on your team knows about any specific topic I yes, then you should give Project Benchmarking Process Analyzing Customer Bounce Rate For Company CRP DK SS V a try. Our experts have put a lot of knowledge and effort into creating this impeccable Project Benchmarking Process Analyzing Customer Bounce Rate For Company CRP DK SS V. You can use this template for your upcoming presentations, as the slides are perfect to represent even the tiniest detail. You can download these templates from the Slidegeeks website and these are easy to edit. So grab these today This slide showcases website bounce rate monitoring which helps in identifying reasons for poor customer engagement such as usability issues etc.
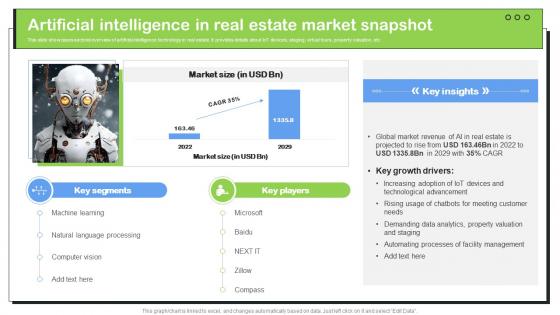
Transforming Real Estate Artificial Intelligence In Real Estate Market Snapshot ChatGPT SS V
This slide showcases sectoral overview of artificial intelligence technology in real estate. It provides details about IoT devices, staging, virtual tours, property valuation, etc. Do you have to make sure that everyone on your team knows about any specific topic I yes, then you should give Transforming Real Estate Artificial Intelligence In Real Estate Market Snapshot ChatGPT SS V a try. Our experts have put a lot of knowledge and effort into creating this impeccable Transforming Real Estate Artificial Intelligence In Real Estate Market Snapshot ChatGPT SS V. You can use this template for your upcoming presentations, as the slides are perfect to represent even the tiniest detail. You can download these templates from the Slidegeeks website and these are easy to edit. So grab these today This slide showcases sectoral overview of artificial intelligence technology in real estate. It provides details about IoT devices, staging, virtual tours, property valuation, etc.
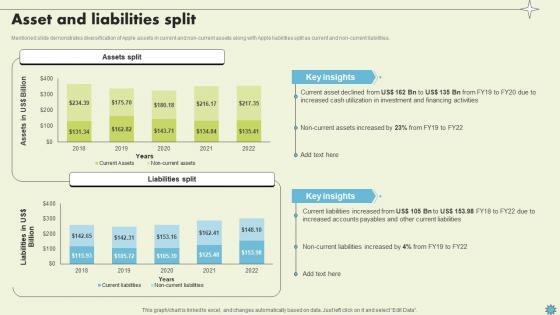
Asset And Liabilities Split Consumer Electronics Company Profile CP SS V
Mentioned slide demonstrates diversification of Apple assets in current and non-current assets along with Apple liabilities split as current and non-current liabilities.Do you have to make sure that everyone on your team knows about any specific topic I yes, then you should give Asset And Liabilities Split Consumer Electronics Company Profile CP SS V a try. Our experts have put a lot of knowledge and effort into creating this impeccable Asset And Liabilities Split Consumer Electronics Company Profile CP SS V. You can use this template for your upcoming presentations, as the slides are perfect to represent even the tiniest detail. You can download these templates from the Slidegeeks website and these are easy to edit. So grab these today Mentioned slide demonstrates diversification of Apple assets in current and non-current assets along with Apple liabilities split as current and non-current liabilities.
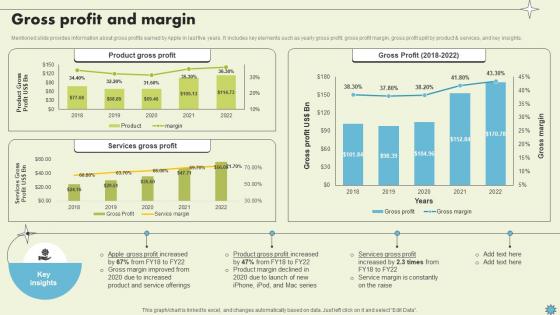
Gross Profit And Margin Consumer Electronics Company Profile CP SS V
Mentioned slide provides information about gross profits earned by Apple in last five years. It includes key elements such as yearly gross profit, gross profit margin, gross profit split by product and services, and key insights.Take your projects to the next level with our ultimate collection of Gross Profit And Margin Consumer Electronics Company Profile CP SS V. Slidegeeks has designed a range of layouts that are perfect for representing task or activity duration, keeping track of all your deadlines at a glance. Tailor these designs to your exact needs and give them a truly corporate look with your own brand colors they will make your projects stand out from the rest Mentioned slide provides information about gross profits earned by Apple in last five years. It includes key elements such as yearly gross profit, gross profit margin, gross profit split by product and services, and key insights.

Integrating AI With IoT Analyzing Survey Results Of AIoT Technology Adoption IoT SS V
Do you have to make sure that everyone on your team knows about any specific topic I yes, then you should give Integrating AI With IoT Analyzing Survey Results Of AIoT Technology Adoption IoT SS V a try. Our experts have put a lot of knowledge and effort into creating this impeccable Integrating AI With IoT Analyzing Survey Results Of AIoT Technology Adoption IoT SS V. You can use this template for your upcoming presentations, as the slides are perfect to represent even the tiniest detail. You can download these templates from the Slidegeeks website and these are easy to edit. So grab these today Our Integrating AI With IoT Analyzing Survey Results Of AIoT Technology Adoption IoT SS V are topically designed to provide an attractive backdrop to any subject. Use them to look like a presentation pro.
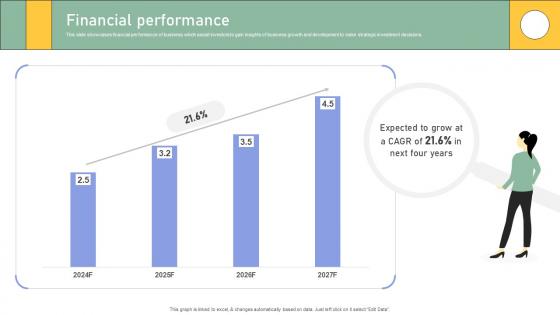
K163 Enterprise Software Application Investor Funding Elevator Pitch Deck Financial Performance
This slide showcases financial performance of business which assist investors to gain insights of business growth and development to make strategic investment decisions. Do you have to make sure that everyone on your team knows about any specific topic I yes, then you should give K163 Enterprise Software Application Investor Funding Elevator Pitch Deck Financial Performance a try. Our experts have put a lot of knowledge and effort into creating this impeccable K163 Enterprise Software Application Investor Funding Elevator Pitch Deck Financial Performance. You can use this template for your upcoming presentations, as the slides are perfect to represent even the tiniest detail. You can download these templates from the Slidegeeks website and these are easy to edit. So grab these today This slide showcases financial performance of business which assist investors to gain insights of business growth and development to make strategic investment decisions.
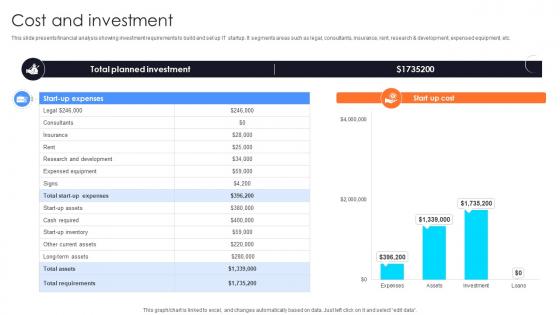
Cost And Investment Information Technology Startup Go To Market Strategy GTM SS V
This slide presents financial analysis showing investment requirements to build and set up IT startup. It segments areas such as legal, consultants, insurance, rent, research and development, expensed equipment, etc.Do you have to make sure that everyone on your team knows about any specific topic I yes, then you should give Cost And Investment Information Technology Startup Go To Market Strategy GTM SS V a try. Our experts have put a lot of knowledge and effort into creating this impeccable Cost And Investment Information Technology Startup Go To Market Strategy GTM SS V. You can use this template for your upcoming presentations, as the slides are perfect to represent even the tiniest detail. You can download these templates from the Slidegeeks website and these are easy to edit. So grab these today This slide presents financial analysis showing investment requirements to build and set up IT startup. It segments areas such as legal, consultants, insurance, rent, research and development, expensed equipment, etc.
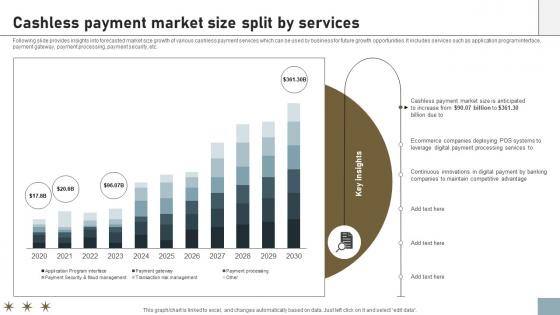
Online Payment Techniques For Providing Cashless Payment Market Size Split
Following slide provides insights into forecasted market size growth of various cashless payment services which can be used by business for future growth opportunities. It includes services such as application program interface, payment gateway, payment processing, payment security, etc. Take your projects to the next level with our ultimate collection of Online Payment Techniques For Providing Cashless Payment Market Size Split. Slidegeeks has designed a range of layouts that are perfect for representing task or activity duration, keeping track of all your deadlines at a glance. Tailor these designs to your exact needs and give them a truly corporate look with your own brand colors they will make your projects stand out from the rest Following slide provides insights into forecasted market size growth of various cashless payment services which can be used by business for future growth opportunities. It includes services such as application program interface, payment gateway, payment processing, payment security, etc.

K166 Statistics Highlighting Positive Impact Of Glass Packaging Material Comprehensive Guide On Current
The slide showcases properties of glass packaging material that assist in preserving food quality and temperature in containers. The points are mechanical, thermal, optical properties. Do you have to make sure that everyone on your team knows about any specific topic I yes, then you should give K166 Statistics Highlighting Positive Impact Of Glass Packaging Material Comprehensive Guide On Current a try. Our experts have put a lot of knowledge and effort into creating this impeccable Statistics Highlighting Positive Impact Of Glass Packaging Material Comprehensive Guide On Current. You can use this template for your upcoming presentations, as the slides are perfect to represent even the tiniest detail. You can download these templates from the Slidegeeks website and these are easy to edit. So grab these today The slide showcases properties of glass packaging material that assist in preserving food quality and temperature in containers. The points are mechanical, thermal, optical properties.
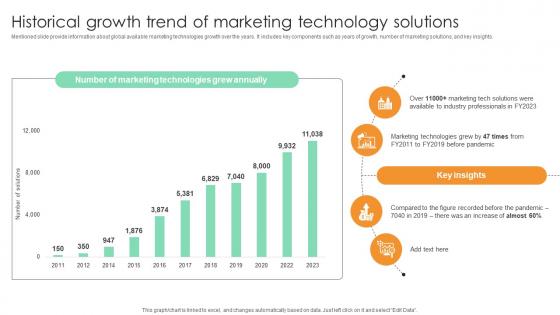
Historical Growth Trend Of Marketing Technology Comprehensive Guide For Marketing Technology
Mentioned slide provide information about global available marketing technologies growth over the years. It includes key components such as years of growth, number of marketing solutions, and key insights. Take your projects to the next level with our ultimate collection of Historical Growth Trend Of Marketing Technology Comprehensive Guide For Marketing Technology. Slidegeeks has designed a range of layouts that are perfect for representing task or activity duration, keeping track of all your deadlines at a glance. Tailor these designs to your exact needs and give them a truly corporate look with your own brand colors they will make your projects stand out from the rest Mentioned slide provide information about global available marketing technologies growth over the years. It includes key components such as years of growth, number of marketing solutions, and key insights.
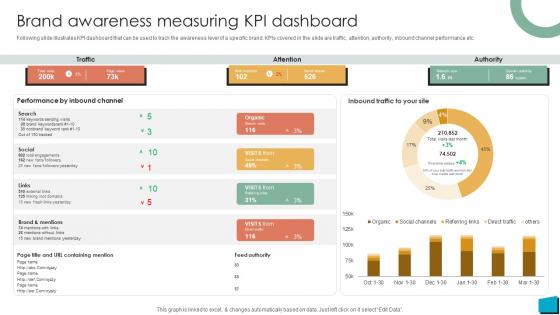
Brand Authority Brand Awareness Measuring KPI Dashboard Strategy SS V
Following slide illustrates KPI dashboard that can be used to track the awareness level of a specific brand. KPIs covered in the slide are traffic, attention, authority, inbound channel performance etc. Do you have to make sure that everyone on your team knows about any specific topic I yes, then you should give Brand Authority Brand Awareness Measuring KPI Dashboard Strategy SS V a try. Our experts have put a lot of knowledge and effort into creating this impeccable Brand Authority Brand Awareness Measuring KPI Dashboard Strategy SS V. You can use this template for your upcoming presentations, as the slides are perfect to represent even the tiniest detail. You can download these templates from the Slidegeeks website and these are easy to edit. So grab these today Following slide illustrates KPI dashboard that can be used to track the awareness level of a specific brand. KPIs covered in the slide are traffic, attention, authority, inbound channel performance etc.
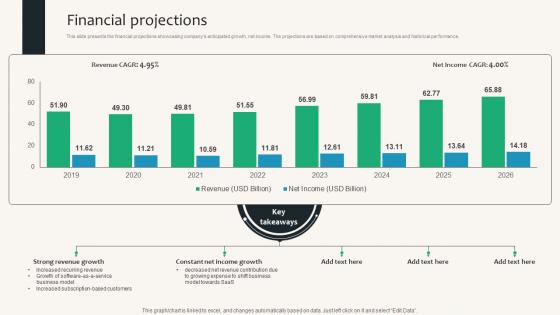
Financial Projections Security Service Provider Business Model BMC SS V
This slide presents the financial projections showcasing companys anticipated growth, net income. The projections are based on comprehensive market analysis and historical performance. Do you have to make sure that everyone on your team knows about any specific topic I yes, then you should give Financial Projections Security Service Provider Business Model BMC SS V a try. Our experts have put a lot of knowledge and effort into creating this impeccable Financial Projections Security Service Provider Business Model BMC SS V. You can use this template for your upcoming presentations, as the slides are perfect to represent even the tiniest detail. You can download these templates from the Slidegeeks website and these are easy to edit. So grab these today This slide presents the financial projections showcasing companys anticipated growth, net income. The projections are based on comprehensive market analysis and historical performance.
Dashboard Analysis For Tracking Agricultural Tasks Adopting Sustainable Farming Techniques
This slide showcases the KPIs that would help to track the improvements with adoption of new sustainable agriculture practices. It includes current tasks, crops, harvest, todays weather, summary, etc. Take your projects to the next level with our ultimate collection of Dashboard Analysis For Tracking Agricultural Tasks Adopting Sustainable Farming Techniques. Slidegeeks has designed a range of layouts that are perfect for representing task or activity duration, keeping track of all your deadlines at a glance. Tailor these designs to your exact needs and give them a truly corporate look with your own brand colors they will make your projects stand out from the rest This slide showcases the KPIs that would help to track the improvements with adoption of new sustainable agriculture practices. It includes current tasks, crops, harvest, todays weather, summary, etc.
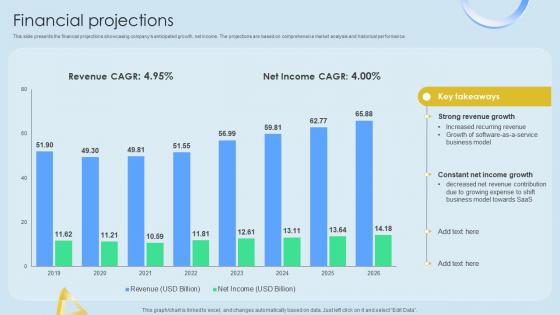
Financial Projections Cloud Networking Service Provider Business Model BMC SS V
This slide presents the financial projections showcasing companys anticipated growth, net income. The projections are based on comprehensive market analysis and historical performance. Do you have to make sure that everyone on your team knows about any specific topic I yes, then you should give Financial Projections Cloud Networking Service Provider Business Model BMC SS V a try. Our experts have put a lot of knowledge and effort into creating this impeccable Financial Projections Cloud Networking Service Provider Business Model BMC SS V. You can use this template for your upcoming presentations, as the slides are perfect to represent even the tiniest detail. You can download these templates from the Slidegeeks website and these are easy to edit. So grab these today This slide presents the financial projections showcasing companys anticipated growth, net income. The projections are based on comprehensive market analysis and historical performance.
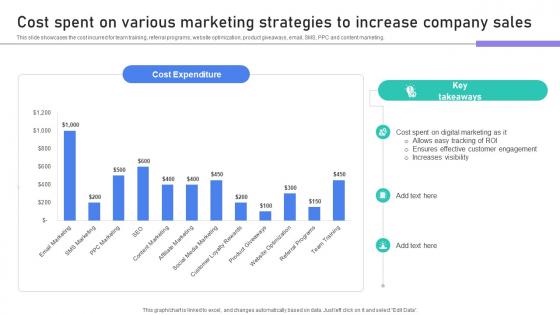
Building Stronger Customer Cost Spent On Various Marketing Strategies To Increase SA SS V
This slide showcases the cost incurred for team training, referral programs, website optimization, product giveaways, email, SMS, PPC and content marketing. Do you have to make sure that everyone on your team knows about any specific topic I yes, then you should give Building Stronger Customer Cost Spent On Various Marketing Strategies To Increase SA SS V a try. Our experts have put a lot of knowledge and effort into creating this impeccable Building Stronger Customer Cost Spent On Various Marketing Strategies To Increase SA SS V. You can use this template for your upcoming presentations, as the slides are perfect to represent even the tiniest detail. You can download these templates from the Slidegeeks website and these are easy to edit. So grab these today This slide showcases the cost incurred for team training, referral programs, website optimization, product giveaways, email, SMS, PPC and content marketing.

Graph Illustrating Impact Of Prescriptive Analytics Data Analytics SS V
This slide showcases graph highlighting impact analysis of prescriptive analytics on businesses via use of major performance indicators. It provides information total revenue, inventory levels and labour costs with key insights.Take your projects to the next level with our ultimate collection of Graph Illustrating Impact Of Prescriptive Analytics Data Analytics SS V. Slidegeeks has designed a range of layouts that are perfect for representing task or activity duration, keeping track of all your deadlines at a glance. Tailor these designs to your exact needs and give them a truly corporate look with your own brand colors they will make your projects stand out from the rest This slide showcases graph highlighting impact analysis of prescriptive analytics on businesses via use of major performance indicators. It provides information total revenue, inventory levels and labour costs with key insights.

Segmentation Of Global Prescriptive Analytics Market Data Analytics SS V
This slide provides an overview of market segmentation of prescriptive analytics at a global level. It covers segmentation analysis based on region, data type, component and deployment with key takeaways.Take your projects to the next level with our ultimate collection of Segmentation Of Global Prescriptive Analytics Market Data Analytics SS V. Slidegeeks has designed a range of layouts that are perfect for representing task or activity duration, keeping track of all your deadlines at a glance. Tailor these designs to your exact needs and give them a truly corporate look with your own brand colors they will make your projects stand out from the rest This slide provides an overview of market segmentation of prescriptive analytics at a global level. It covers segmentation analysis based on region, data type, component and deployment with key takeaways.
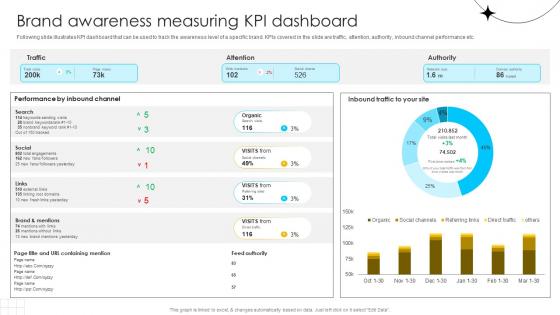
Brand Influence Brand Awareness Measuring KPI Dashboard Strategy SS V
Following slide illustrates KPI dashboard that can be used to track the awareness level of a specific brand. KPIs covered in the slide are traffic, attention, authority, inbound channel performance etc. Do you have to make sure that everyone on your team knows about any specific topic I yes, then you should give Brand Influence Brand Awareness Measuring KPI Dashboard Strategy SS V a try. Our experts have put a lot of knowledge and effort into creating this impeccable Brand Influence Brand Awareness Measuring KPI Dashboard Strategy SS V. You can use this template for your upcoming presentations, as the slides are perfect to represent even the tiniest detail. You can download these templates from the Slidegeeks website and these are easy to edit. So grab these today Following slide illustrates KPI dashboard that can be used to track the awareness level of a specific brand. KPIs covered in the slide are traffic, attention, authority, inbound channel performance etc.
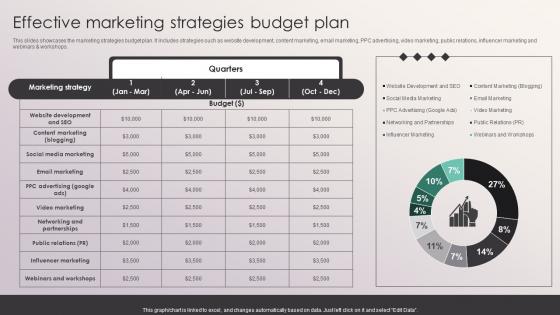
Effective Marketing Strategies Budget Plan Penetrating Markets With Financial Strategy SS V
This slides showcases the marketing strategies budget plan. It includes strategies such as website development, content marketing, email marketing, PPC advertising, video marketing, public relations, influencer marketing and webinars and workshops. Do you have to make sure that everyone on your team knows about any specific topic I yes, then you should give Effective Marketing Strategies Budget Plan Penetrating Markets With Financial Strategy SS V a try. Our experts have put a lot of knowledge and effort into creating this impeccable Effective Marketing Strategies Budget Plan Penetrating Markets With Financial Strategy SS V. You can use this template for your upcoming presentations, as the slides are perfect to represent even the tiniest detail. You can download these templates from the Slidegeeks website and these are easy to edit. So grab these today This slides showcases the marketing strategies budget plan. It includes strategies such as website development, content marketing, email marketing, PPC advertising, video marketing, public relations, influencer marketing and webinars and workshops.
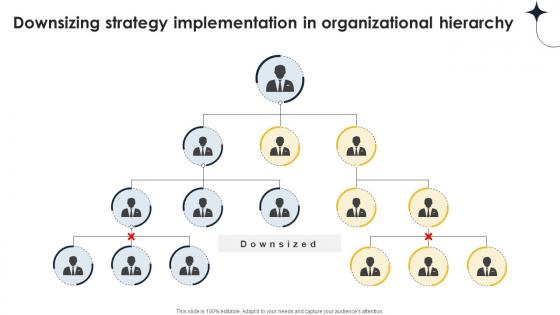
Downsizing Strategy Implementation In Implementing Personnel Downsizing Initiative
Do you have to make sure that everyone on your team knows about any specific topic I yes, then you should give Downsizing Strategy Implementation In Implementing Personnel Downsizing Initiative a try. Our experts have put a lot of knowledge and effort into creating this impeccable Downsizing Strategy Implementation In Implementing Personnel Downsizing Initiative. You can use this template for your upcoming presentations, as the slides are perfect to represent even the tiniest detail. You can download these templates from the Slidegeeks website and these are easy to edit. So grab these today Our Downsizing Strategy Implementation In Implementing Personnel Downsizing Initiative are topically designed to provide an attractive backdrop to any subject. Use them to look like a presentation pro.
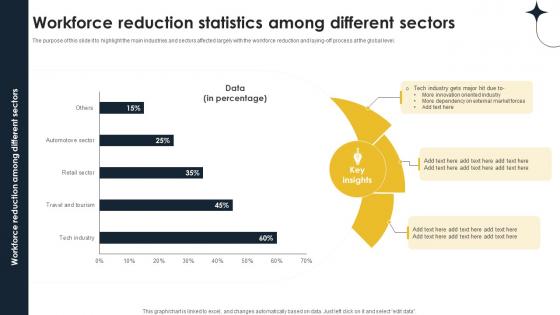
Workforce Reduction Statistics Among Different Implementing Personnel Downsizing Initiative
The purpose of this slide it to highlight the main industries and sectors affected largely with the workforce reduction and laying-off process at the global level. Take your projects to the next level with our ultimate collection of Workforce Reduction Statistics Among Different Implementing Personnel Downsizing Initiative. Slidegeeks has designed a range of layouts that are perfect for representing task or activity duration, keeping track of all your deadlines at a glance. Tailor these designs to your exact needs and give them a truly corporate look with your own brand colors they will make your projects stand out from the rest The purpose of this slide it to highlight the main industries and sectors affected largely with the workforce reduction and laying-off process at the global level.
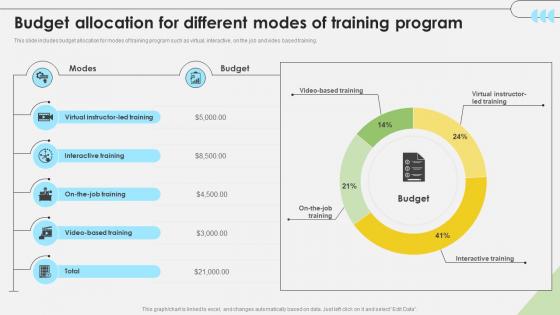
Workforce Competency Enhancement Budget Allocation For Different Modes Of Training Program DTE SS V
This slide includes budget allocation for modes of training program such as virtual, interactive, on the job and video based training. Do you have to make sure that everyone on your team knows about any specific topic I yes, then you should give Workforce Competency Enhancement Budget Allocation For Different Modes Of Training Program DTE SS V a try. Our experts have put a lot of knowledge and effort into creating this impeccable Workforce Competency Enhancement Budget Allocation For Different Modes Of Training Program DTE SS V. You can use this template for your upcoming presentations, as the slides are perfect to represent even the tiniest detail. You can download these templates from the Slidegeeks website and these are easy to edit. So grab these today This slide includes budget allocation for modes of training program such as virtual, interactive, on the job and video based training.
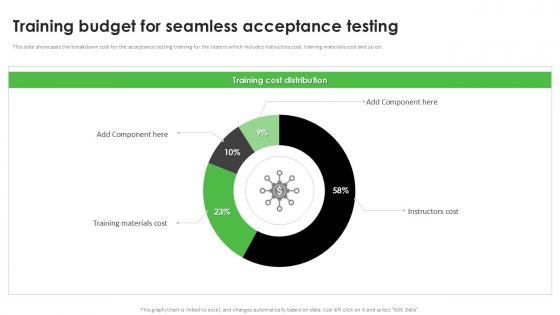
Training Budget For Seamless Acceptance Testing PPT Template
This slide showcases the breakdown cost for the acceptance testing training for the testers which includes instructors cost, training materials cost and so on. Take your projects to the next level with our ultimate collection of Training Budget For Seamless Acceptance Testing PPT Template. Slidegeeks has designed a range of layouts that are perfect for representing task or activity duration, keeping track of all your deadlines at a glance. Tailor these designs to your exact needs and give them a truly corporate look with your own brand colors they will make your projects stand out from the rest This slide showcases the breakdown cost for the acceptance testing training for the testers which includes instructors cost, training materials cost and so on.

Portfolio Allocation Evaluation Based On Annual Return Investment Fund PPT PowerPoint
Mentioned slide provides information about evaluation of returns from various portfolio investment combination options.It includes returns KPIs such as average annual return, lowest returns, highest returns, past 20 years returns best and worst. Take your projects to the next level with our ultimate collection of Portfolio Allocation Evaluation Based On Annual Return Investment Fund PPT PowerPoint. Slidegeeks has designed a range of layouts that are perfect for representing task or activity duration, keeping track of all your deadlines at a glance. Tailor these designs to your exact needs and give them a truly corporate look with your own brand colors they will make your projects stand out from the rest Mentioned slide provides information about evaluation of returns from various portfolio investment combination options.It includes returns KPIs such as average annual return, lowest returns, highest returns, past 20 years returns best and worst.
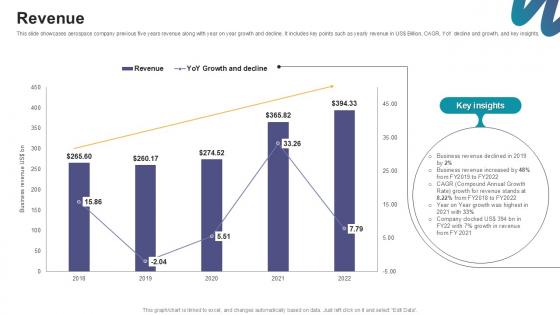
Revenue Digital Marketings Strategies PPT Sample CP SS V
This slide showcases aerospace company previous five years revenue along with year on year growth and decline. It includes key points such as yearly revenue in US Billion, CAGR, YoY decline and growth, and key insights. Take your projects to the next level with our ultimate collection of Revenue Digital Marketings Strategies PPT Sample CP SS V. Slidegeeks has designed a range of layouts that are perfect for representing task or activity duration, keeping track of all your deadlines at a glance. Tailor these designs to your exact needs and give them a truly corporate look with your own brand colors they will make your projects stand out from the rest This slide showcases aerospace company previous five years revenue along with year on year growth and decline. It includes key points such as yearly revenue in US Billion, CAGR, YoY decline and growth, and key insights.
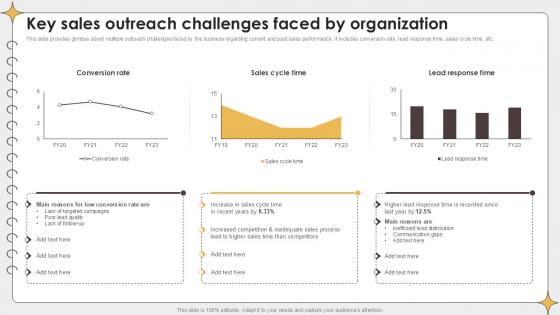
Key Sales Outreach Challenges Planning Outreach Campaigns PPT Example
This slide provides glimpse about multiple outreach challenges faced by the business regarding current and past sales performance. It includes conversion rate, lead response time, sales cycle time, etc. Take your projects to the next level with our ultimate collection of Key Sales Outreach Challenges Planning Outreach Campaigns PPT Example. Slidegeeks has designed a range of layouts that are perfect for representing task or activity duration, keeping track of all your deadlines at a glance. Tailor these designs to your exact needs and give them a truly corporate look with your own brand colors they will make your projects stand out from the rest This slide provides glimpse about multiple outreach challenges faced by the business regarding current and past sales performance. It includes conversion rate, lead response time, sales cycle time, etc.
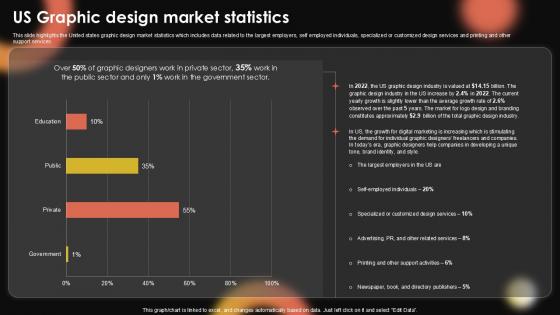
US Graphic Design Market Sample Pentagram Business Plan PPT Template BP SS V
This slide highlights the United states graphic design market statistics which includes data related to the largest employers, self employed individuals, specialized or customized design services and printing and other support services. Take your projects to the next level with our ultimate collection of US Graphic Design Market Sample Pentagram Business Plan PPT Template BP SS V. Slidegeeks has designed a range of layouts that are perfect for representing task or activity duration, keeping track of all your deadlines at a glance. Tailor these designs to your exact needs and give them a truly corporate look with your own brand colors they will make your projects stand out from the rest This slide highlights the United states graphic design market statistics which includes data related to the largest employers, self employed individuals, specialized or customized design services and printing and other support services.
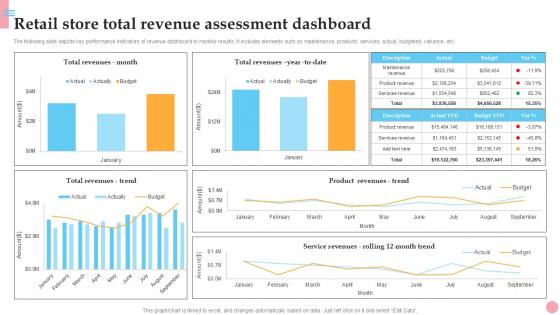
Retail Store Total Revenue Assessment How To Improve Company PPT Presentation Strategy SS V
The following slide depicts key performance indicators of revenue dashboard to monitor results. It includes elements such as maintenance, products, services, actual, budgeted, variance, etc. Take your projects to the next level with our ultimate collection of Retail Store Total Revenue Assessment How To Improve Company PPT Presentation Strategy SS V. Slidegeeks has designed a range of layouts that are perfect for representing task or activity duration, keeping track of all your deadlines at a glance. Tailor these designs to your exact needs and give them a truly corporate look with your own brand colors they will make your projects stand out from the rest The following slide depicts key performance indicators of revenue dashboard to monitor results. It includes elements such as maintenance, products, services, actual, budgeted, variance, etc.
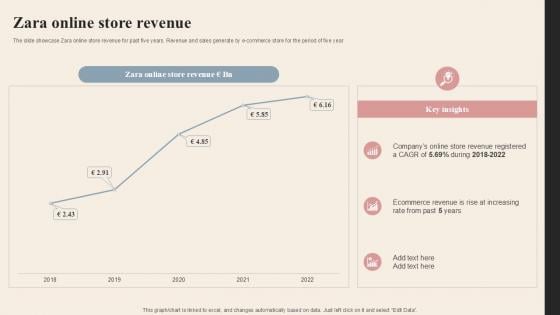
Zara Online Store Revenue Branded Clothing Company Profile PPT PowerPoint CP SS V
The slide showcase Zara online store revenue for past five years. Revenue and sales generate by e-commerce store for the period of five year. Do you have to make sure that everyone on your team knows about any specific topic I yes, then you should give Zara Online Store Revenue Branded Clothing Company Profile PPT PowerPoint CP SS V a try. Our experts have put a lot of knowledge and effort into creating this impeccable Zara Online Store Revenue Branded Clothing Company Profile PPT PowerPoint CP SS V. You can use this template for your upcoming presentations, as the slides are perfect to represent even the tiniest detail. You can download these templates from the Slidegeeks website and these are easy to edit. So grab these today The slide showcase Zara online store revenue for past five years. Revenue and sales generate by e-commerce store for the period of five year.

Market Potential Plant Based Eggs Developing Company Investor PPT Example
This slide shows information regarding the market potential or opportunity available for the company in current market. It also includes details regarding compound annual growth rate. Take your projects to the next level with our ultimate collection of Market Potential Plant Based Eggs Developing Company Investor PPT Example. Slidegeeks has designed a range of layouts that are perfect for representing task or activity duration, keeping track of all your deadlines at a glance. Tailor these designs to your exact needs and give them a truly corporate look with your own brand colors they will make your projects stand out from the rest This slide shows information regarding the market potential or opportunity available for the company in current market. It also includes details regarding compound annual growth rate.

 Home
Home