Operations Metrics

Framework Of Conformance Testing In Software Development Summary PDF
This slide represents the framework of conformance testing, including its components such as plug-ins, contract language, implementation under test, instrumented deployment under test, intermediate language, test cases execution, metric evaluation, and evaluation report. This modern and well-arranged Framework Of Conformance Testing In Software Development Summary PDF provides lots of creative possibilities. It is very simple to customize and edit with the Powerpoint Software. Just drag and drop your pictures into the shapes. All facets of this template can be edited with Powerpoint, no extra software is necessary. Add your own material, put your images in the places assigned for them, adjust the colors, and then you can show your slides to the world, with an animated slide included.
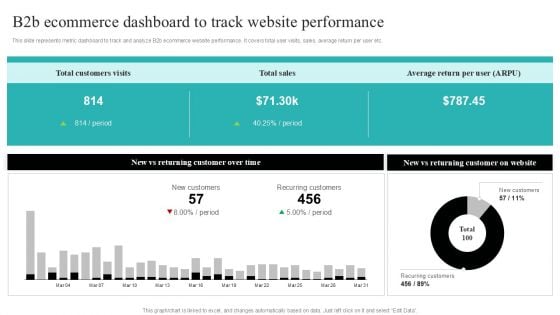
Strategic Ecommerce Plan For B2B Enterprises B2b Ecommerce Dashboard To Track Website Performance Inspiration PDF
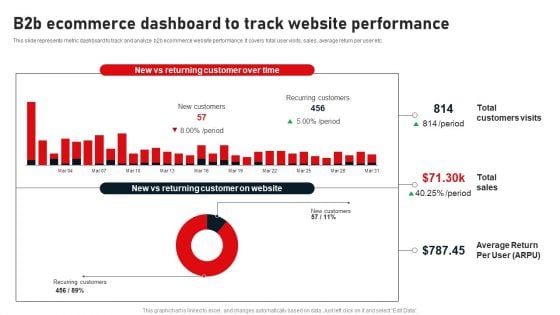
B2B Ecommerce Dashboard To Track Website Performance Designs PDF
This slide represents metric dashboard to track and analyze b2b ecommerce website performance. It covers total user visits, sales, average return per user etc. Presenting this PowerPoint presentation, titled B2B Ecommerce Dashboard To Track Website Performance Designs PDF, with topics curated by our researchers after extensive research. This editable presentation is available for immediate download and provides attractive features when used. Download now and captivate your audience. Presenting this B2B Ecommerce Dashboard To Track Website Performance Designs PDF. Our researchers have carefully researched and created these slides with all aspects taken into consideration. This is a completely customizable B2B Ecommerce Dashboard To Track Website Performance Designs PDF that is available for immediate downloading. Download now and make an impact on your audience. Highlight the attractive features available with our PPTs.
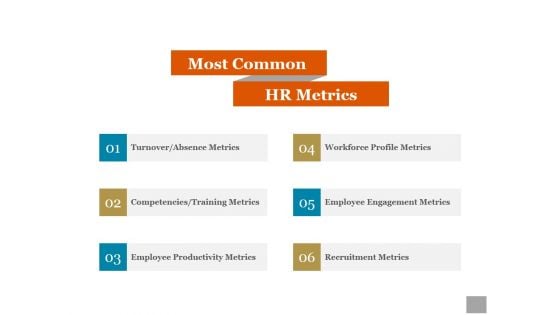
Most Common Ppt PowerPoint Presentation Diagrams
This is a most common ppt powerpoint presentation diagrams. This is a six stage process. The stages in this process are turnover absence metrics, competencies training metrics, employee productivity metrics, workforce profile metrics, employee engagement metrics, recruitment metrics.
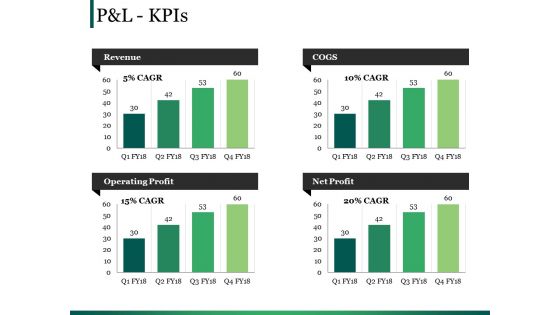
Pandl Kpis Ppt PowerPoint Presentation Outline Gallery
This is a pandl kpis ppt powerpoint presentation outline gallery. This is a four stage process. The stages in this process are revenue, cogs, operating profit, net profit.
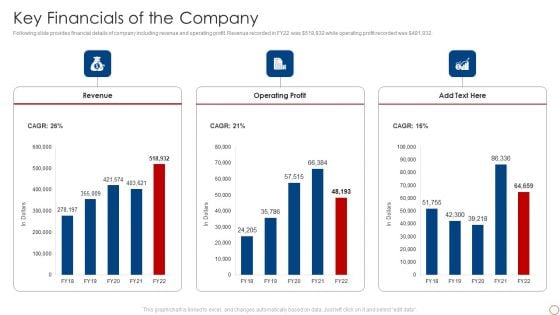
Kpis For Evaluating Business Sustainability Key Financials Of The Company Rules PDF
Following slide provides financial details of company including revenue and operating profit. Revenue recorded in FY22 was dollar 518,932 while operating profit recorded was dollar 481,932. Deliver and pitch your topic in the best possible manner with this Kpis For Evaluating Business Sustainability Financial Performance Indicator Dashboard Demonstration PDF. Use them to share invaluable insights on Revenue, Operating Profit and impress your audience. This template can be altered and modified as per your expectations. So, grab it now.
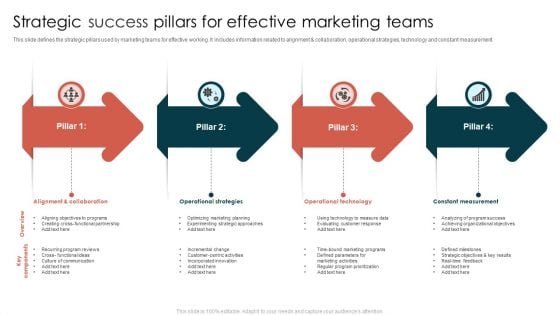
Strategic Success Pillars For Effective Marketing Teams Elements PDF
This slide defines the strategic pillars used by marketing teams for effective working. It includes information related to alignment and collaboration, operational strategies, technology and constant measurement. Presenting Strategic Success Pillars For Effective Marketing Teams Elements PDF to dispense important information. This template comprises four stages. It also presents valuable insights into the topics including Operational Strategies, Operational Technology, Constant Measurement. This is a completely customizable PowerPoint theme that can be put to use immediately. So, download it and address the topic impactfully.
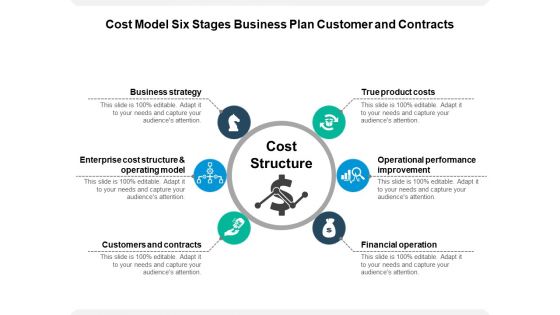
Cost Model Six Stages Business Plan Customer And Contracts Ppt PowerPoint Presentation Inspiration Backgrounds PDF
Presenting this set of slides with name cost model six stages business plan customer and contracts ppt powerpoint presentation inspiration backgrounds pdf. This is a six stage process. The stages in this process are business strategy, enterprise cost structure and operating model, customers and contracts, true product costs, operational performance improvement, financial operation. This is a completely editable PowerPoint presentation and is available for immediate download. Download now and impress your audience.
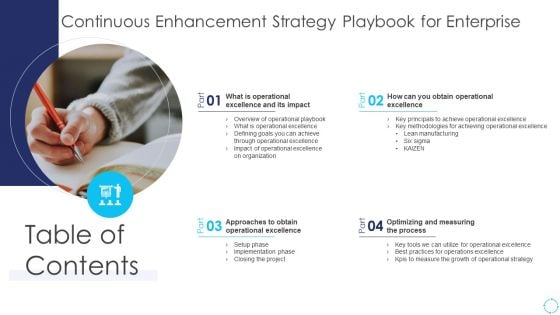
Table Of Contents Continuous Enhancement Strategy Playbook For Enterprise Structure PDF
Presenting Table Of Contents Continuous Enhancement Strategy Playbook For Enterprise Structure PDF to provide visual cues and insights. Share and navigate important information on four stages that need your due attention. This template can be used to pitch topics like Obtain Operational Excellence, Operational Excellence, Optimizing And Measuring, Process, Approaches To Obtain Operational Excellence. In addtion, this PPT design contains high resolution images, graphics, etc, that are easily editable and available for immediate download.
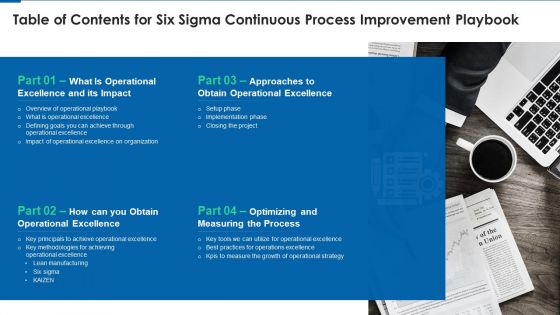
Table Of Contents For Six Sigma Continuous Process Improvement Playbook Rules PDF
Presenting Table Of Contents For Six Sigma Continuous Process Improvement Playbook Rules PDF to provide visual cues and insights. Share and navigate important information on four stages that need your due attention. This template can be used to pitch topics like Operational Excellence And Its Impact, Approaches To Obtain Operational Excellence, Obtain Operational Excellence, Optimizing And Measuring Process. In addtion, this PPT design contains high resolution images, graphics, etc, that are easily editable and available for immediate download.

Consulting Business ORMF Ppt PowerPoint Presentation Summary Example Topics PDF
This slide covers framework designed to address risk management challenges and bring business value. It includes critical elements such as risk strategy and appetite, risk governance, risk culture, operational risk assessment and measurement, operational risk management and monitoring, etc.Persuade your audience using this Consulting Business ORMF Ppt PowerPoint Presentation Summary Example Topics PDF. This PPT design covers seven stages, thus making it a great tool to use. It also caters to a variety of topics including Management Strategy, Operative Technology, Reporting Operational. Download this PPT design now to present a convincing pitch that not only emphasizes the topic but also showcases your presentation skills.

KPIs To Measure Impact Of Digital Implementation In Business Sample Pdf
This slide represents various KPIs to measure the impact of digital adoption in company to track and monitor operational effectiveness. It includes KPIs such as active user rate, session duration, onboarding completion rate, etc. Showcasing this set of slides titled KPIs To Measure Impact Of Digital Implementation In Business Sample Pdf. The topics addressed in these templates are User Engagement Metrics, User Engagement Metrics. All the content presented in this PPT design is completely editable. Download it and make adjustments in color, background, font etc. as per your unique business setting. This slide represents various KPIs to measure the impact of digital adoption in company to track and monitor operational effectiveness. It includes KPIs such as active user rate, session duration, onboarding completion rate, etc.
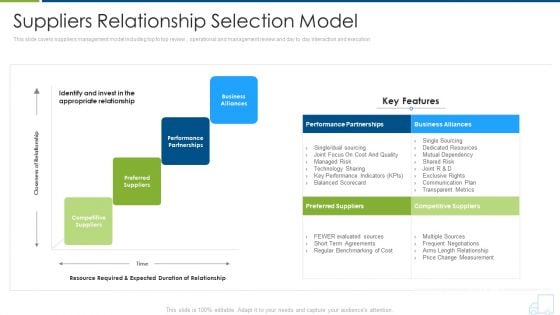
Distributor Strategy Suppliers Relationship Selection Model Diagrams PDF
This slide covers suppliers management model including top to top review , operational and management review and day to day interaction and execution. Deliver and pitch your topic in the best possible manner with this distributor strategy suppliers relationship selection model diagrams pdf. Use them to share invaluable insights on communication, plan, metrics, risk, resources and impress your audience. This template can be altered and modified as per your expectations. So, grab it now.
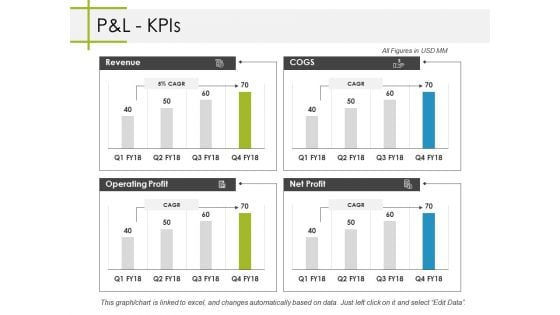
Pandl Kpis Ppt PowerPoint Presentation Professional Backgrounds
This is a pandl kpis ppt powerpoint presentation professional backgrounds. This is a four stage process. The stages in this process are business, revenue, operating profit, cogs, net profit.
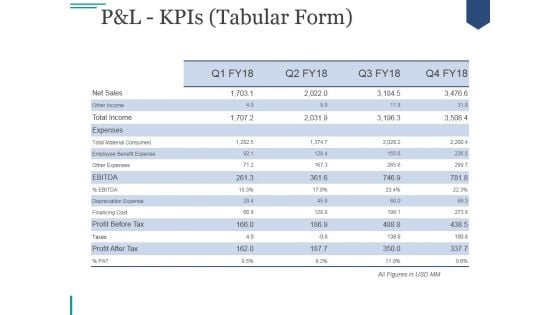
Pandl Kpis Tabular Form Ppt PowerPoint Presentation Visual Aids
This is a pandl kpis tabular form ppt powerpoint presentation visual aids. This is a four stage process. The stages in this process are revenue, cogs, operating profit, net profit.
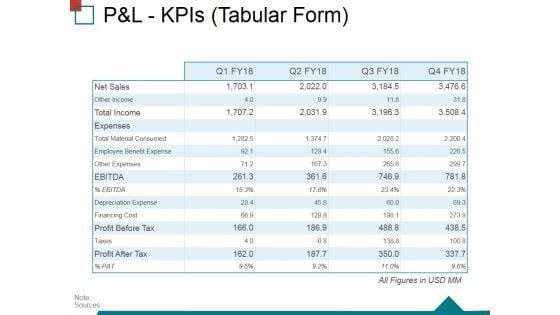
Pandl Kpis Tabular Form Ppt PowerPoint Presentation Ideas Structure
This is a pandl kpis tabular form ppt powerpoint presentation ideas structure. This is a four stage process. The stages in this process are operating profit, revenue, cogs, net profit.
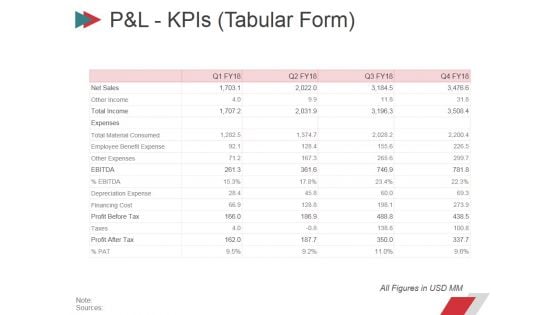
Pandl Kpis Tabular Form Ppt PowerPoint Presentation Summary Layout
This is a pandl kpis tabular form ppt powerpoint presentation summary layout. This is a four stage process. The stages in this process are revenue, cogs, operating profit, net profit.
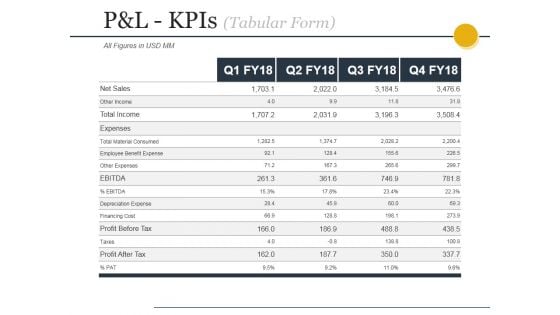
Pandl Kpis Tabular Form Ppt PowerPoint Presentation File Design Templates
This is a pandl kpis tabular form ppt powerpoint presentation file design templates. This is a four stage process. The stages in this process are revenue, cogs, operating profit, net profit.
Pandl Kpis Tabular Form Ppt PowerPoint Presentation Gallery Icon
This is a pandl kpis tabular form ppt powerpoint presentation gallery icon. This is a four stage process. The stages in this process are revenue, cogs, operating profit, net profit.
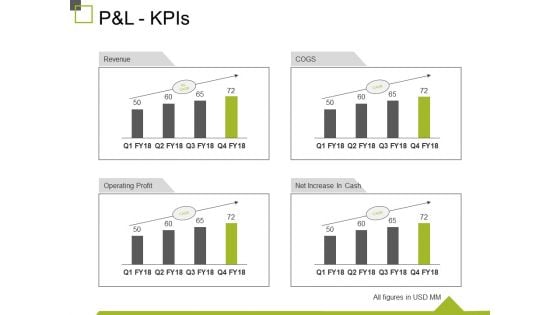
P And L Kpis Ppt PowerPoint Presentation Show Design Inspiration
This is a p and l kpis ppt powerpoint presentation show design inspiration. This is a four stage process. The stages in this process are revenue, operating profit, cogs, net increase in cash, business.
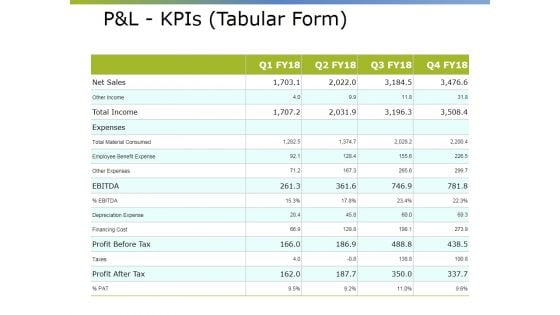
Pandl Kpis Tabular Form Ppt PowerPoint Presentation Pictures Visual Aids
This is a pandl kpis tabular form ppt powerpoint presentation pictures visual aids. This is a four stage process. The stages in this process are revenue, operating profit, cogs, net profit.
Pandl Kpis Template Ppt PowerPoint Presentation Model Icon
This is a pandl kpis template ppt powerpoint presentation model icon. This is a four stage process. The stages in this process are revenue, cogs, operating profit, net profit.
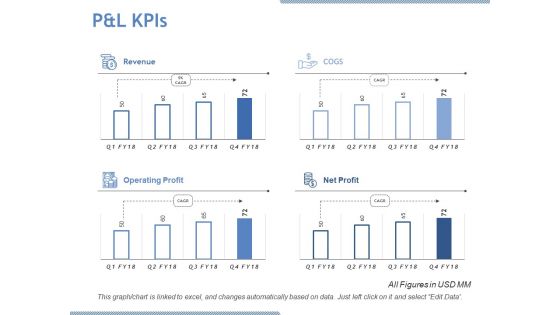
P And L Kpis Ppt PowerPoint Presentation Designs Download
This is a p and l kpis ppt powerpoint presentation designs download. This is a four stage process. The stages in this process are revenue, cogs, operating profit, net profit.
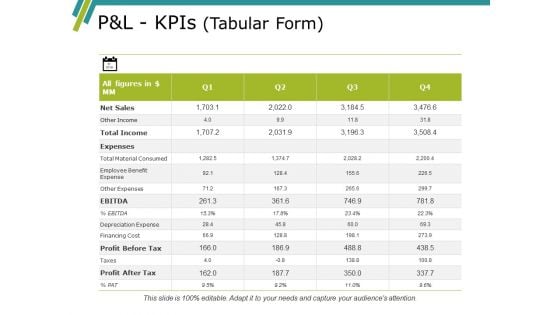
Pandl Kpis Template Ppt PowerPoint Presentation Gallery Summary
This is a pandl kpis template ppt powerpoint presentation gallery summary. This is a four stage process. The stages in this process are revenue, cogs, operating profit, net profit.
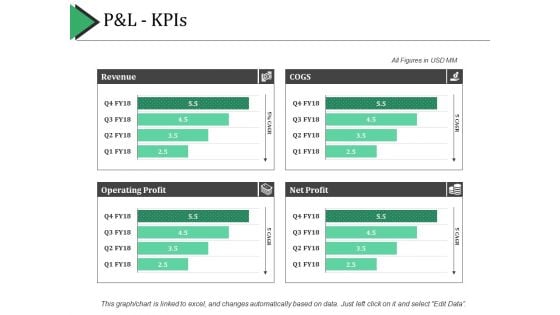
P And L Kpis Ppt PowerPoint Presentation Show Example Introduction
This is a p and l kpis ppt powerpoint presentation show example introduction. This is a four stage process. The stages in this process are revenue, cogs, net profit, operating profit.
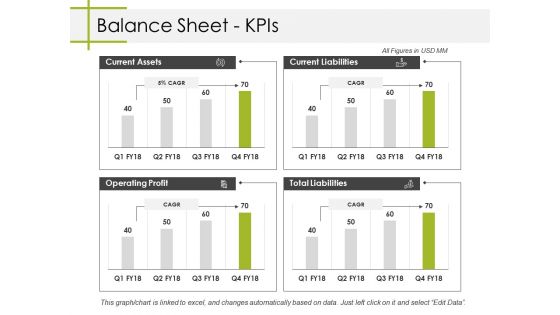
Balance Sheet Kpis Ppt PowerPoint Presentation Summary Designs Download
This is a balance sheet kpis ppt powerpoint presentation summary designs download. This is a four stage process. The stages in this process are current assets, current liabilities, total liabilities, operating profit, business.
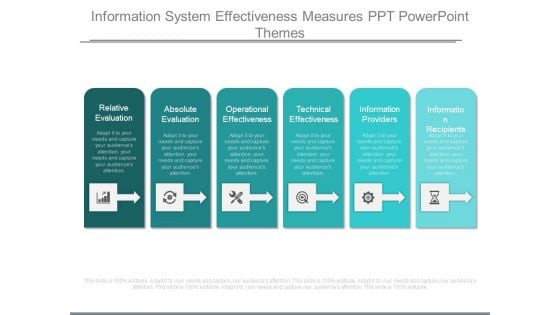
Information System Effectiveness Measures Ppt Powerpoint Themes
This is a information system effectiveness measures ppt powerpoint themes. This is a six stage process. The stages in this process are relative evaluation, absolute evaluation, operational effectiveness, technical effectiveness, information providers, information recipients.
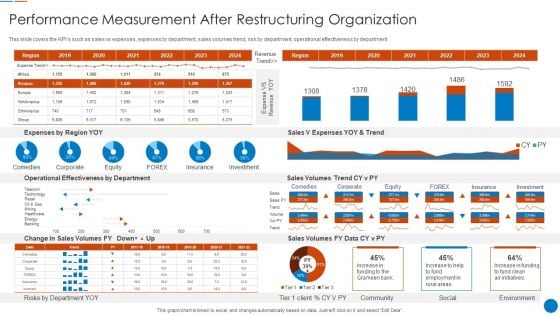
Organizational Restructuring Process Performance Measurement After Restructuring Organization Download PDF
This slide covers the KPIs such as sales vs expenses, expenses by department, sales volumes trend, risk by department, operational effectiveness by department Deliver an awe inspiring pitch with this creative Organizational Restructuring Process Performance Measurement After Restructuring Organization Download PDF bundle. Topics like Operational Effectiveness Department, Expenses By Region, Sales Volumes can be discussed with this completely editable template. It is available for immediate download depending on the needs and requirements of the user.
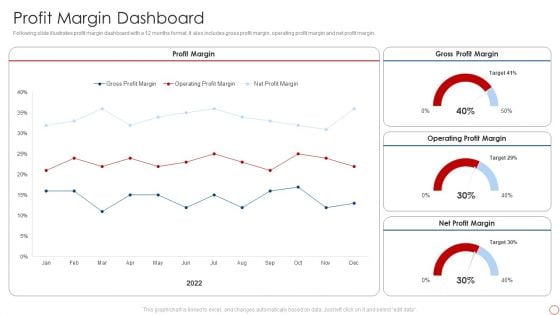
Kpis For Evaluating Business Sustainability Profit Margin Dashboard Pictures PDF
Following slide illustrates profit margin dashboard with a 12 months format. It also includes gross profit margin, operating profit margin and net profit margin. Deliver and pitch your topic in the best possible manner with this Kpis For Evaluating Business Sustainability Profit Margin Dashboard Pictures PDF. Use them to share invaluable insights on Profit Margin, Gross Profit Margin, Operating Profit Margin and impress your audience. This template can be altered and modified as per your expectations. So, grab it now.
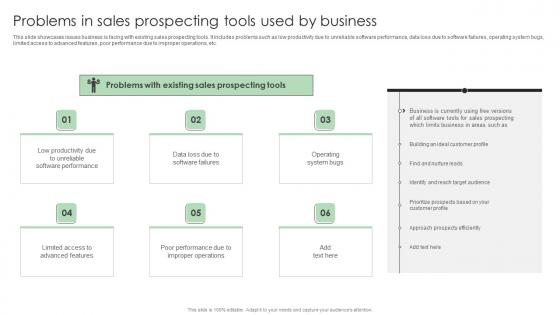
Performance Enhancement Plan Problems In Sales Prospecting Tools Used Ideas Pdf
This slide showcases issues business is facing with existing sales prospecting tools. It includes problems such as low productivity due to unreliable software performance, data loss due to software failures, operating system bugs, limited access to advanced features, poor performance due to improper operations, etc. The Performance Enhancement Plan Problems In Sales Prospecting Tools Used Ideas Pdf is a compilation of the most recent design trends as a series of slides. It is suitable for any subject or industry presentation, containing attractive visuals and photo spots for businesses to clearly express their messages. This template contains a variety of slides for the user to input data, such as structures to contrast two elements, bullet points, and slides for written information. Slidegeeks is prepared to create an impression. This slide showcases issues business is facing with existing sales prospecting tools. It includes problems such as low productivity due to unreliable software performance, data loss due to software failures, operating system bugs, limited access to advanced features, poor performance due to improper operations, etc.
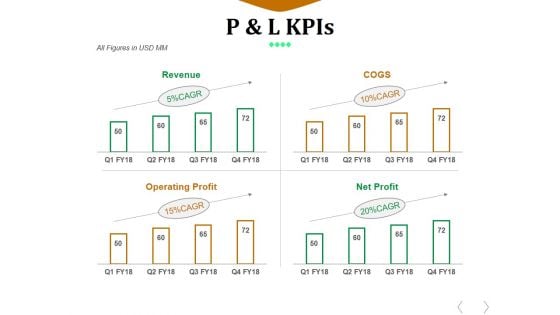
P And L Kpis Template 1 Ppt PowerPoint Presentation Design Ideas
This is a p and l kpis template 1 ppt powerpoint presentation design ideas. This is a four stage process. The stages in this process are revenue, cogs, operating profit, net profit.
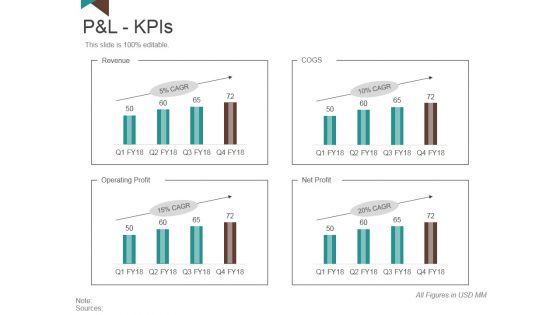
P And L Kpis Template 1 Ppt PowerPoint Presentation Slides Model
This is a p and l kpis template 1 ppt powerpoint presentation slides model. This is a four stage process. The stages in this process are revenue, operating profit, net profit, cogs.
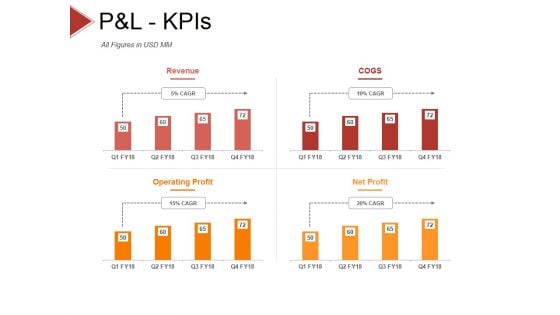
P And L Kpis Template 2 Ppt PowerPoint Presentation Styles Objects
This is a p and l kpis template 2 ppt powerpoint presentation styles objects. This is a four stage process. The stages in this process are revenue, cogs, operating profit, net profit.

P And L Kpis Template 1 Ppt PowerPoint Presentation Model Inspiration
This is a p and l kpis template 1 ppt powerpoint presentation model inspiration. This is a four stage process. The stages in this process are revenue, cogs, operating profit, net profit.
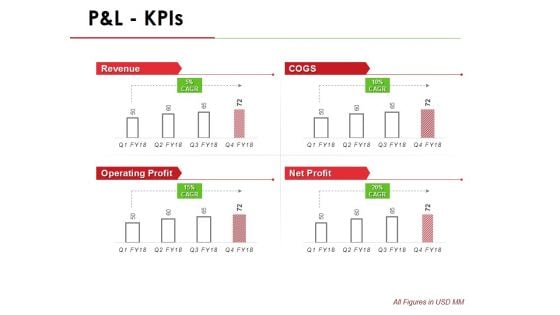
P And L Kpis Template 1 Ppt PowerPoint Presentation Infographic Template Outline
This is a p and l kpis template 1 ppt powerpoint presentation infographic template outline. This is a four stage process. The stages in this process are revenue, operating profit, cogs, net profit.
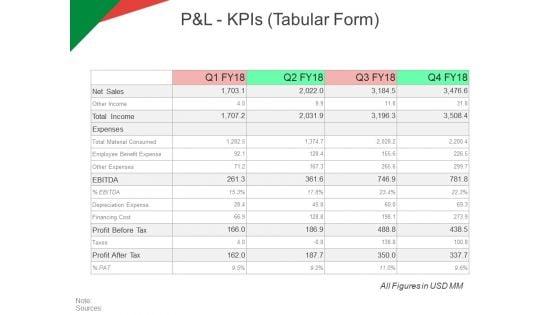
P And L Kpis Tabular Form Ppt PowerPoint Presentation Model Ideas
This is a p and l kpis tabular form ppt powerpoint presentation model ideas. This is a four stage process. The stages in this process are revenue, operating profit, cogs, net profit.
P And L Kpis Template 2 Ppt PowerPoint Presentation Summary Icon
This is a p and l kpis template 2 ppt powerpoint presentation summary icon. This is a four stage process. The stages in this process are revenue, cogs, operating profit, net profit.
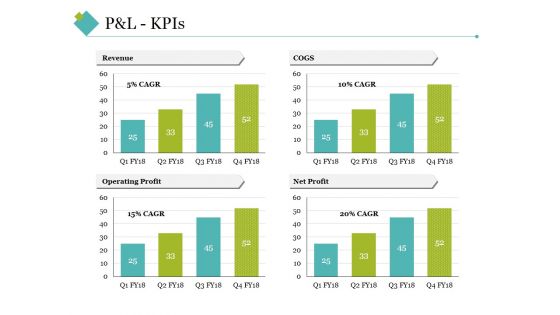
P And L Kpis Template 2 Ppt PowerPoint Presentation Inspiration Grid
This is a p and l kpis template 2 ppt powerpoint presentation inspiration grid. This is a four stage process. The stages in this process are revenue, cogs, operating profit, net profit.
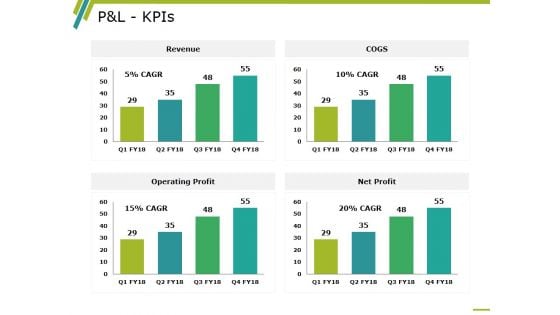
P And L Kpis Template 2 Ppt PowerPoint Presentation Professional Information
This is a p and l kpis template 2 ppt powerpoint presentation professional information. This is a four stage process. The stages in this process are revenue, operating profit, cogs, net profit, business.
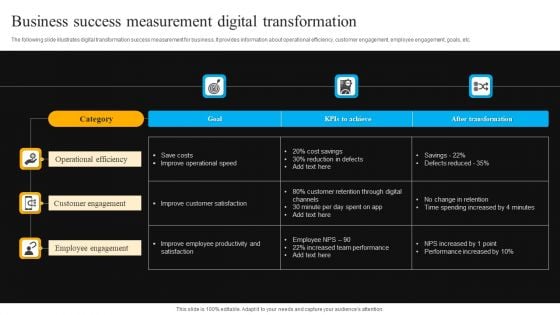
Business Success Measurement Digital Transformation Portrait PDF
The following slide illustrates digital transformation success measurement for business. It provides information about operational efficiency, customer engagement, employee engagement, goals, etc. Showcasing this set of slides titled Business Success Measurement Digital Transformation Portrait PDF. The topics addressed in these templates are Operational Efficiency, Customer Engagement, Employee Engagement. All the content presented in this PPT design is completely editable. Download it and make adjustments in color, background, font etc. as per your unique business setting.
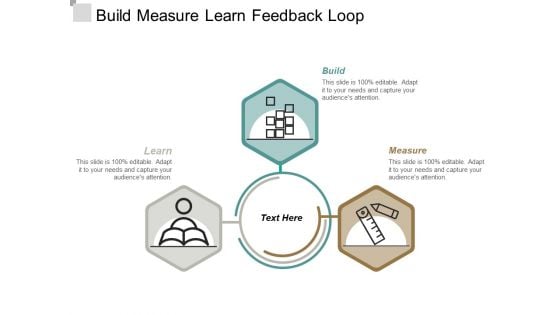
Build Measure Learn Feedback Loop Ppt Powerpoint Presentation Ideas Gridlines
This is a build measure learn feedback loop ppt powerpoint presentation ideas gridlines. This is a three stage process. The stages in this process are six sigma, operating rhythm, business rhythm.
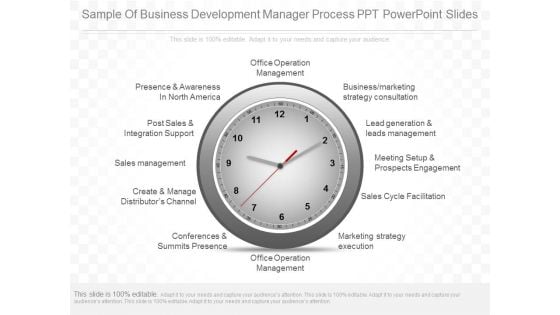
Sample Of Business Development Manager Process Ppt Powerpoint Slides
This is a sample of business development manager process ppt powerpoint slides. This is a one stage process. The stages in this process are presence and awareness in north america, post sales and integration support, sales management, create and manage distributor channel, conferences and summits presence, office operation management, marketing strategy execution, sales cycle facilitation, meeting setup and prospects engagement, lead generation and leads management, business marketing strategy consultation, office operation management.
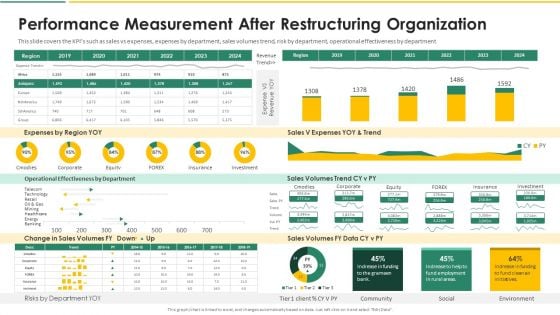
Organization Chart And Corporate Model Transformation Performance Measurement After Slides PDF
This slide covers the KPIs such as sales vs expenses, expenses by department, sales volumes trend, risk by department, operational effectiveness by department. Deliver and pitch your topic in the best possible manner with this organization chart and corporate model transformation performance measurement after slides pdf. Use them to share invaluable insights on operational effectiveness by department, expenses by region yoy, sales volumes trend and impress your audience. This template can be altered and modified as per your expectations. So, grab it now.
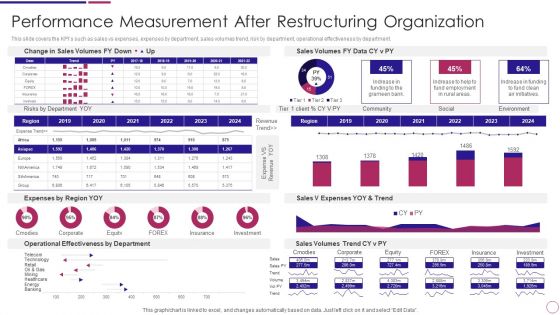
Performance Measurement After Restructuring Organization Ppt PowerPoint Presentation File Structure PDF
This slide covers the KPIs such as sales vs expenses, expenses by department, sales volumes trend, risk by department, operational effectiveness by department. Deliver an awe inspiring pitch with this creative Performance Measurement After Restructuring Organization Ppt PowerPoint Presentation File Structure PDF bundle. Topics like Sales Volumes, Operational Effectiveness, Expense Trend can be discussed with this completely editable template. It is available for immediate download depending on the needs and requirements of the user.
Problems In Sales Prospecting Tools Sales Performance Enhancement Elements Pdf
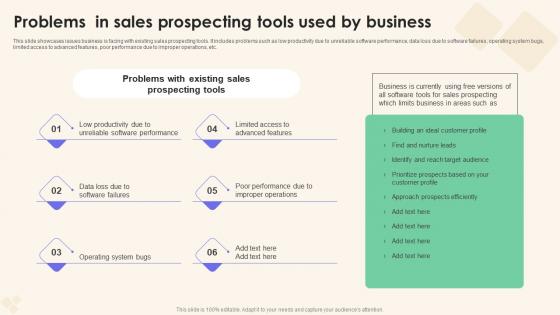
This slide showcases issues business is facing with existing sales prospecting tools. It includes problems such as low productivity due to unreliable software performance, data loss due to software failures, operating system bugs, limited access to advanced features, poor performance due to improper operations, etc. The Problems In Sales Prospecting Tools Sales Performance Enhancement Elements Pdf is a compilation of the most recent design trends as a series of slides. It is suitable for any subject or industry presentation, containing attractive visuals and photo spots for businesses to clearly express their messages. This template contains a variety of slides for the user to input data, such as structures to contrast two elements, bullet points, and slides for written information. Slidegeeks is prepared to create an impression. This slide showcases issues business is facing with existing sales prospecting tools. It includes problems such as low productivity due to unreliable software performance, data loss due to software failures, operating system bugs, limited access to advanced features, poor performance due to improper operations, etc.
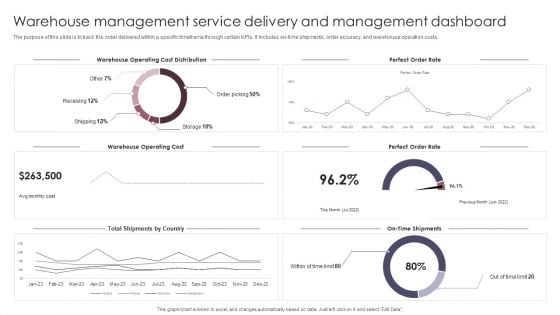
Warehouse Management Service Delivery And Management Dashboard Slides PDF
The purpose of this slide is to track the order delivered within a specific timeframe through certain KPIs. It includes on time shipments, order accuracy, and warehouse operation costs. Showcasing this set of slides titled Warehouse Management Service Delivery And Management Dashboard Slides PDF. The topics addressed in these templates are Warehouse Operating Cost, Warehouse Operating Cost Distribution. All the content presented in this PPT design is completely editable. Download it and make adjustments in color, background, font etc. as per your unique business setting.
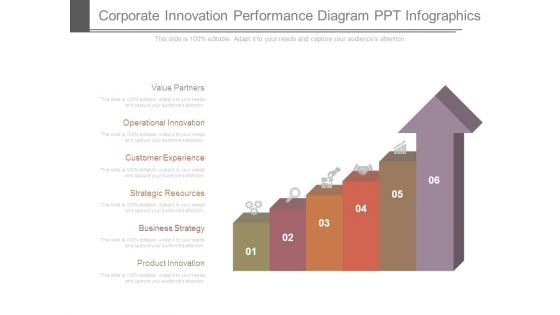
Corporate Innovation Performance Diagram Ppt Infographics
This is a corporate innovation performance diagram ppt infographics. This is a six stage process. The stages in this process are value partners, operational innovation, customer experience, strategic resources, business strategy, product innovation.
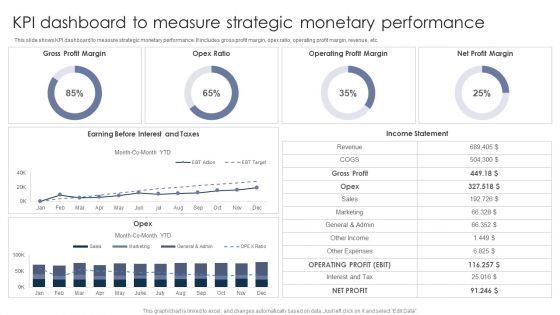
KPI Dashboard To Measure Strategic Monetary Performance Graphics PDF
This slide shows KPI dashboard to measure strategic monetary performance. It includes gross profit margin, opex ratio, operating profit margin, revenue, etc. Pitch your topic with ease and precision using this KPI Dashboard To Measure Strategic Monetary Performance Graphics PDF. This layout presents information on Gross Profit Margin, Opex Ratio, Operating Profit Margin. It is also available for immediate download and adjustment. So, changes can be made in the color, design, graphics or any other component to create a unique layout.
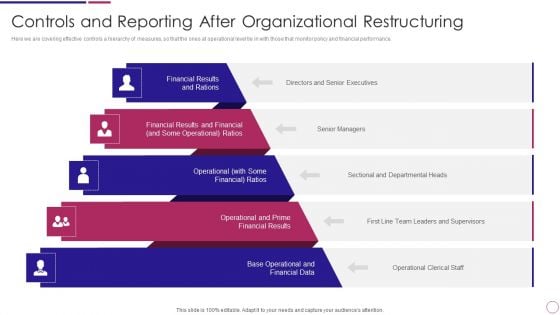
Controls And Reporting After Organizational Restructuring Ppt PowerPoint Presentation File Show PDF
Here we are covering effective controls a hierarchy of measures, so that the ones at operational level tie in with those that monitor policy and financial performance. Presenting Controls And Reporting After Organizational Restructuring Ppt PowerPoint Presentation File Show PDF to provide visual cues and insights. Share and navigate important information on five stages that need your due attention. This template can be used to pitch topics like Senior Managers, Operational Clerical, Base Operational. In addtion, this PPT design contains high resolution images, graphics, etc, that are easily editable and available for immediate download.
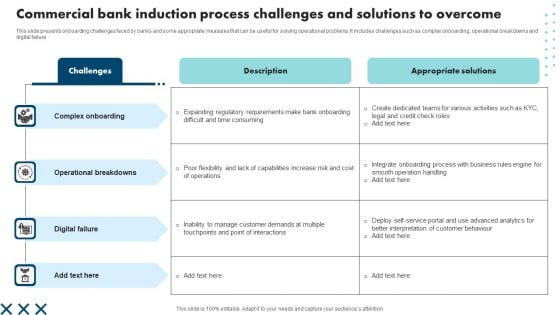
Commercial Bank Induction Process Challenges And Solutions To Overcome Clipart PDF
This slide presents onboarding challenges faced by banks and some appropriate measures that can be useful for solving operational problems. It includes challenges such as complex onboarding, operational breakdowns and digital failure. Showcasing this set of slides titled Commercial Bank Induction Process Challenges And Solutions To Overcome Clipart PDF. The topics addressed in these templates are Complex Onboarding, Operational Breakdowns, Digital Failure. All the content presented in this PPT design is completely editable. Download it and make adjustments in color, background, font etc. as per your unique business setting.
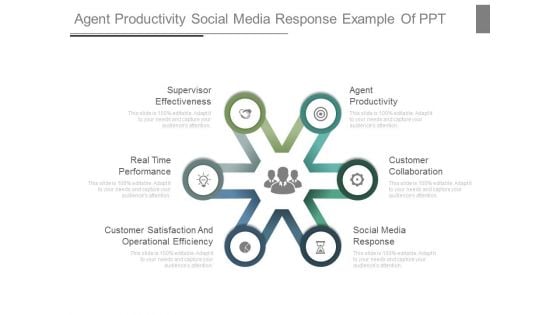
Agent Productivity Social Media Response Example Of Ppt
This is a agent productivity social media response example of ppt. This is a six stage process. The stages in this process are supervisor effectiveness, agent productivity, real time performance, customer satisfaction and operational efficiency, customer collaboration, social media response.
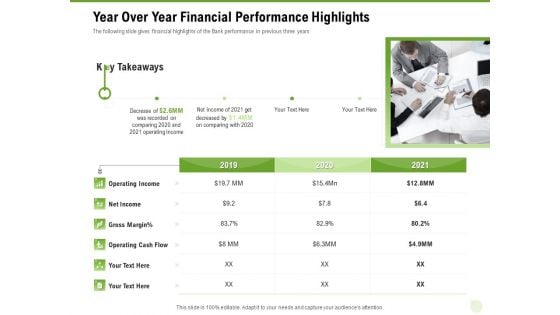
Cross Selling Of Retail Banking Products Year Over Year Financial Performance Highlights Ppt Styles Gallery PDF
This is a cross selling of retail banking products year over year financial performance highlights ppt styles gallery pdf template with various stages. Focus and dispense information on six stages using this creative set, that comes with editable features. It contains large content boxes to add your information on topics like operating income, net income, gross margin, operating cash flow. You can also showcase facts, figures, and other relevant content using this PPT layout. Grab it now.
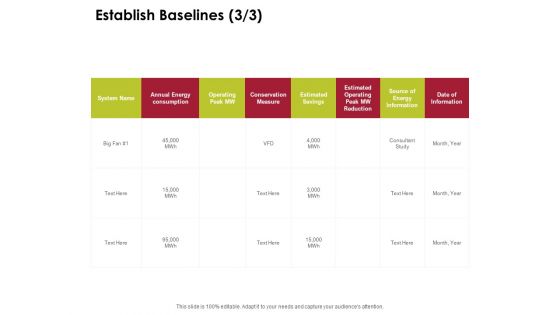
Power Management System And Technology Establish Baselines Measure Ppt PowerPoint Presentation Pictures Structure PDF
Presenting this set of slides with name power management system and technology establish baselines measure ppt powerpoint presentation pictures structure pdf. The topics discussed in these slides are system name, annual energy consumption, operating peak mw, conservation measure, estimated savings, estimated operating peak mw reduction, source of energy information, date of information. This is a completely editable PowerPoint presentation and is available for immediate download. Download now and impress your audience.
Energy Tracking Device Establish Baselines Measure Ppt PowerPoint Presentation File Visual Aids PDF
Deliver an awe-inspiring pitch with this creative energy tracking device establish baselines measure ppt powerpoint presentation file visual aids pdf bundle. Topics like annual energy consumption, operating peak mw, conservation measure, estimated savings, source information, date information, estimated operating peak mw reduction can be discussed with this completely editable template. It is available for immediate download depending on the needs and requirements of the user.
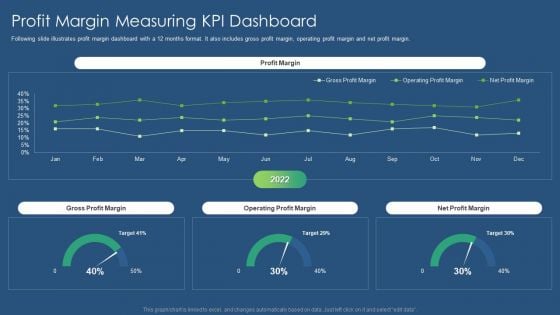
Sustainability Calculation With KPI Profit Margin Measuring Kpi Dashboard Inspiration PDF Topics PDF
Following slide illustrates profit margin dashboard with a 12 months format. It also includes gross profit margin, operating profit margin and net profit margin. Deliver and pitch your topic in the best possible manner with this sustainability calculation with kpi profit margin measuring kpi dashboard inspiration pdf. Use them to share invaluable insights on net profit margin, operating profit margin, gross profit margin and impress your audience. This template can be altered and modified as per your expectations. So, grab it now.
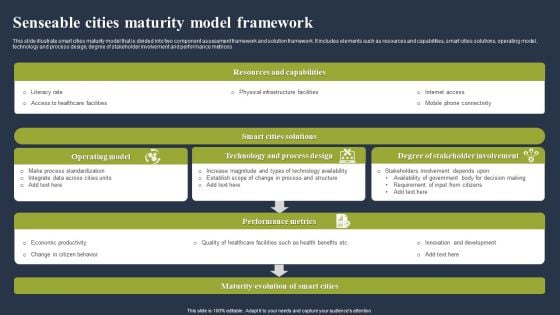
Senseable Cities Maturity Model Framework Ideas PDF
This slide illustrate smart cities maturity model that is divided into two component assessment framework and solution framework. It includes elements such as resources and capabilities, smart cities solutions, operating model, technology and process design, degree of stakeholder involvement and performance metrices. Showcasing this set of slides titled Senseable Cities Maturity Model Framework Ideas PDF. The topics addressed in these templates are Resources And Capabilities, Operating Model, Technology And Process. All the content presented in this PPT design is completely editable. Download it and make adjustments in color, background, font etc. as per your unique business setting.
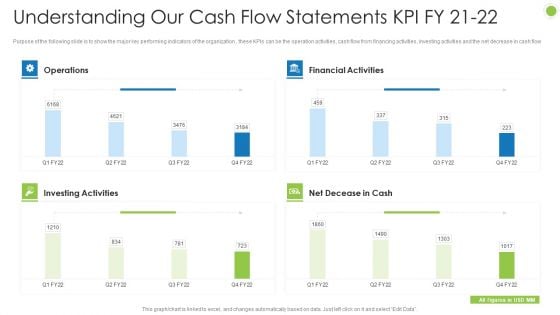
Debt Retrieval Techniques Understanding Our Cash Flow Statements Kpi Fy 21 22 Ppt Inspiration Deck PDF
Purpose of the following slide is to show the major key performing indicators of the organization , these KPIs can be the operation activities, cash flow from financing activities, investing activities and the net decrease in cash flow Deliver an awe inspiring pitch with this creative debt retrieval techniques understanding our cash flow statements kpi fy 21 22 ppt inspiration deck pdf bundle. Topics like operations, investing activities, net decease in cash, financial activities can be discussed with this completely editable template. It is available for immediate download depending on the needs and requirements of the user.
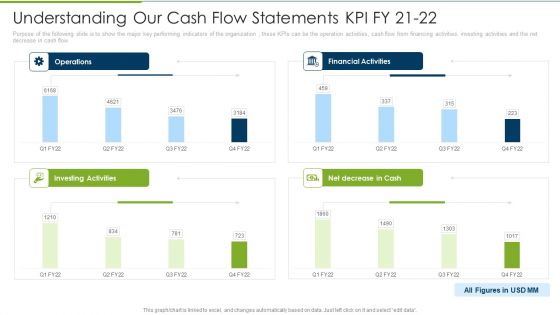
Debt Collection Improvement Plan Understanding Our Cash Flow Statements KPI Fy 21 To 22 Elements PDF
Purpose of the following slide is to show the major key performing indicators of the organization , these KPIs can be the operation activities, cash flow from financing activities, investing activities and the net decrease in cash flow. Deliver and pitch your topic in the best possible manner with this debt collection improvement plan understanding our cash flow statements kpi fy 21 to 22 elements pdf. Use them to share invaluable insights on operations, financial activities, investing activities, net decrease cash and impress your audience. This template can be altered and modified as per your expectations. So, grab it now.
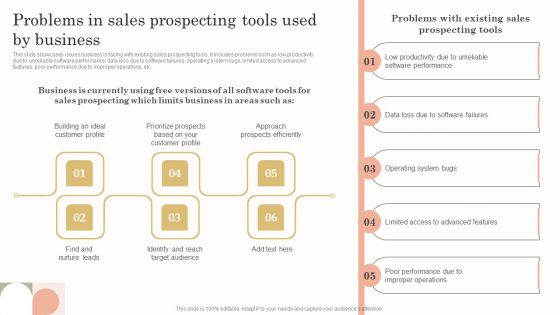
Problems In Sales Prospecting Tools Used By Business Demonstration PDF
This slide showcases issues business is facing with existing sales prospecting tools. It includes problems such as low productivity due to unreliable software performance, data loss due to software failures, operating system bugs, limited access to advanced features, poor performance due to improper operations, etc. If your project calls for a presentation, then Slidegeeks is your go to partner because we have professionally designed, easy to edit templates that are perfect for any presentation. After downloading, you can easily edit Problems In Sales Prospecting Tools Used By Business Demonstration PDF and make the changes accordingly. You can rearrange slides or fill them with different images. Check out all the handy templates.
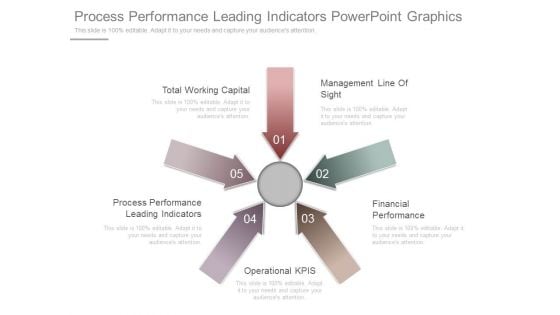
Process Performance Leading Indicators Powerpoint Graphics
This is a process performance leading indicators powerpoint graphics. This is a five stage process. The stages in this process are total working capital, management line of sight, process performance leading indicators, financial performance, operational kpis.


 Continue with Email

 Home
Home


