Org Chart
PowerPoint Designs Chart Missing Puzzle Piece Question Ppt Template
PowerPoint Designs Chart Missing Puzzle Piece Question PPT Template-This 3D PowerPoint diagram shows the Missing Puzzle Piece with Question mark. This Business PowerPoint Template has a lot of space for writing your text. You can easily edit the size, position, text, color. -PowerPoint Designs Chart Missing Puzzle Piece Question PPT Template Let your ideas spread like wildfire. Fan the flames with our PowerPoint Designs Chart Missing Puzzle Piece Question Ppt Template.
Audit Process Workflow Chart For Finance Management Summary PDF
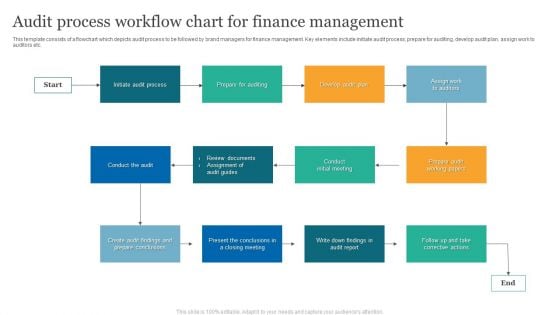
This template consists of a flowchart which depicts audit process to be followed by brand managers for finance management. Key elements include initiate audit process, prepare for auditing, develop audit plan, assign work to auditors etc.
Brand Positioning Chart Ppt PowerPoint Presentation Outline Slide Download
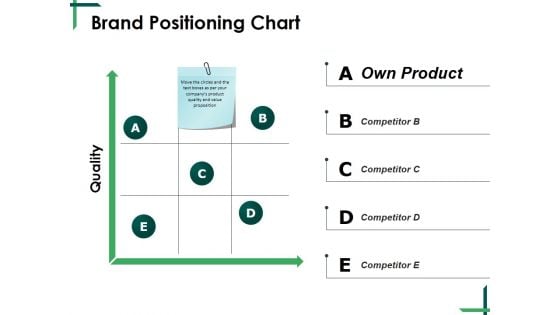
This is a brand positioning chart ppt powerpoint presentation outline slide download. This is a five stage process. The stages in this process are quality, own product, business, management, matrix.
PMP Toolkit Project Milestone Chart Ppt Layouts Templates PDF
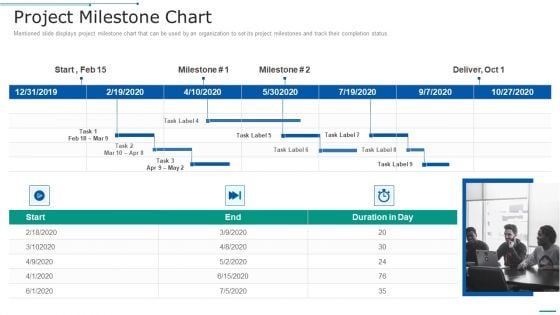
Mentioned slide displays project milestone chart that can be used by an organization to set its project milestones and track their completion status. This is a pmp toolkit project milestone chart ppt layouts templates pdf template with various stages. Focus and dispense information on one stages using this creative set, that comes with editable features. It contains large content boxes to add your information on topics like project milestone chart. You can also showcase facts, figures, and other relevant content using this PPT layout. Grab it now.
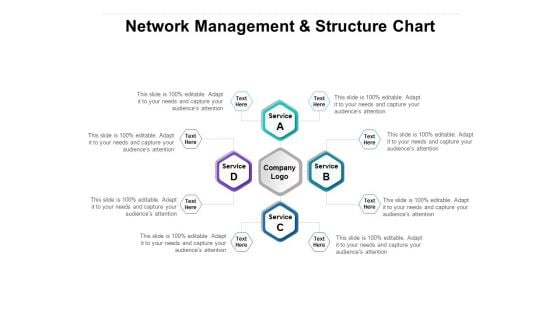
Network Management And Structure Chart Ppt PowerPoint Presentation Inspiration Templates
Presenting this set of slides with name network management and structure chart ppt powerpoint presentation inspiration templates. This is a four stage process. The stages in this process are network management, structure chart. This is a completely editable PowerPoint presentation and is available for immediate download. Download now and impress your audience.
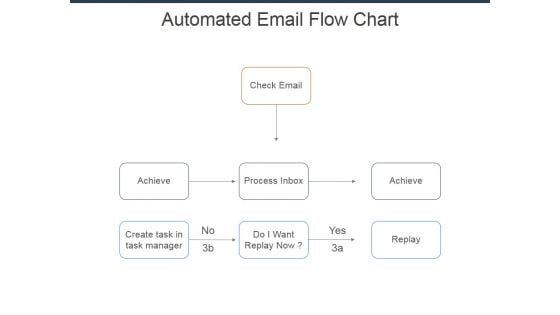
Automated Email Flow Chart Ppt Powerpoint Presentation Infographics Show
This is a automated email flow chart ppt powerpoint presentation infographics show. This is a three stage process. The stages in this process are check email, achieve, process inbox, do i want replay now, create task in task manager.
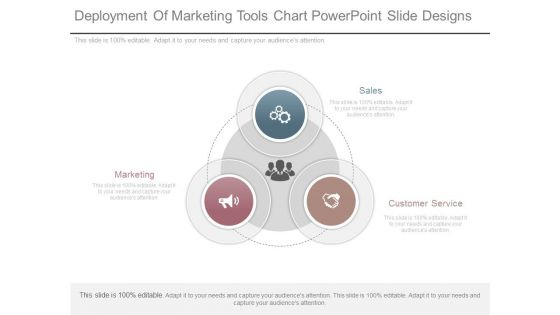
Deployment Of Marketing Tools Chart Powerpoint Slide Designs
This is a deployment of marketing tools chart powerpoint slide designs. This is a three stage process. The stages in this process are sales, customer service, marketing.
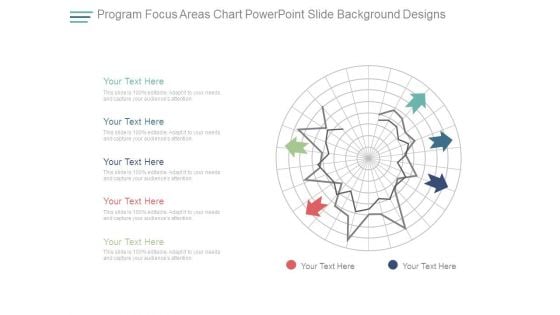
Program Focus Areas Chart Powerpoint Slide Background Designs
This is a program focus areas chart powerpoint slide background designs. This is a five stage process. The stages in this process are arrows, business, marketing, management.
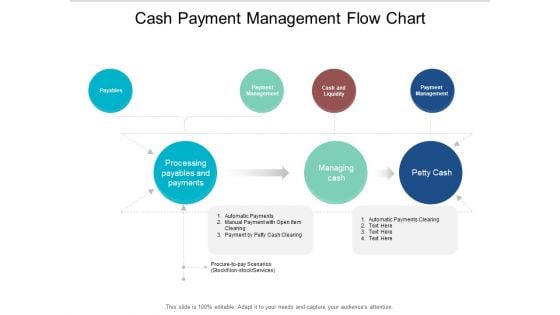
Cash Payment Management Flow Chart Ppt PowerPoint Presentation Styles Professional
This is a cash payment management flow chart ppt powerpoint presentation styles professional. This is a seven stage process. The stages in this process are liquidity, cash assets, solvency.
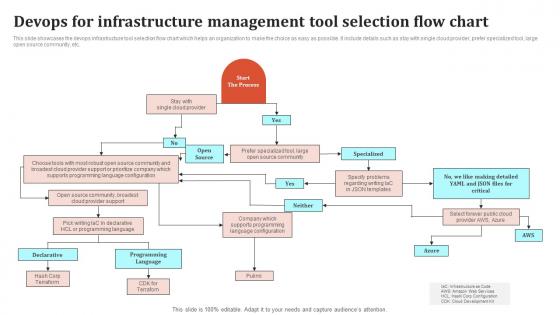
Devops For Infrastructure Management Tool Selection Flow Chart Pictures Pdf
This slide showcases the devops infrastructure tool selection flow chart which helps an organization to make the choice as easy as possible. It include details such as stay with single cloud provider, prefer specialized tool, large open source community, etc. Showcasing this set of slides titled Devops For Infrastructure Management Tool Selection Flow Chart Pictures Pdf The topics addressed in these templates are Start The Process, Declarative, Programming Language All the content presented in this PPT design is completely editable. Download it and make adjustments in color, background, font etc. as per your unique business setting. This slide showcases the devops infrastructure tool selection flow chart which helps an organization to make the choice as easy as possible. It include details such as stay with single cloud provider, prefer specialized tool, large open source community, etc.
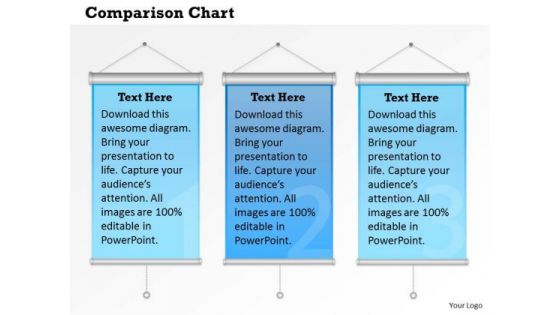
Marketing Diagram Comparison Chart Business Design Business Cycle Diagram
Get Out Of The Dock With Our Marketing Diagram Comparison Chart Business Design Business Cycle Diagram Powerpoint Templates. Your Mind Will Be Set Free.
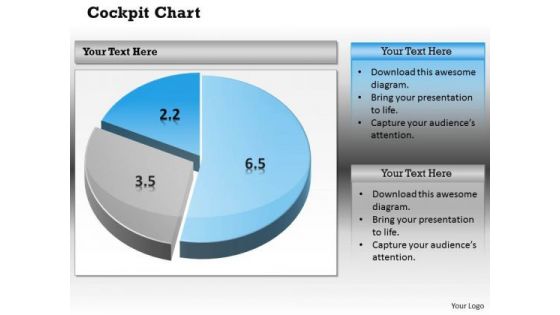
Business Cycle Diagram Pie Chart Dashborad Design Marketing Diagram
Document Your Views On Our Business Cycle Diagram Pie Chart Dashborad Design Marketing Diagram Powerpoint Templates. They Will Create A Strong Impression.
Strategic Management Comparison Chart Business Design Sales Diagram
Open Up Doors That Lead To Success. Our Strategic Management Comparison Chart Business Design Sales Diagram Powerpoint Templates Provide The Handles.

Price Catalogue Chart For Supplier Services Assessment Inspiration PDF
This slide showcases price catalogue chart that can help organization to make comparative assessment of transportation and warehousing costs of different suppliers. It also outlines cost per unit comparison of raw materials of Showcasing this set of slides titled price catalogue chart for supplier services assessment inspiration pdf. The topics addressed in these templates are price catalogue chart for supplier services assessment. All the content presented in this PPT design is completely editable. Download it and make adjustments in color, background, font etc. as per your unique business setting.
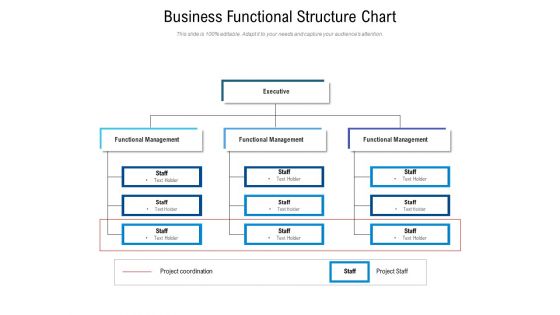
Business Functional Structure Chart Ppt PowerPoint Presentation File Rules PDF
Presenting this set of slides with name business functional structure chart ppt powerpoint presentation file rules pdf. This is a four stage process. The stages in this process are management, executive, staff. This is a completely editable PowerPoint presentation and is available for immediate download. Download now and impress your audience.
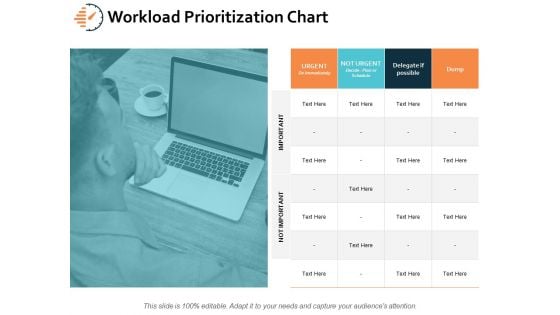
Workload Prioritization Chart Ppt PowerPoint Presentation Styles Designs
This is a workload prioritization chart ppt powerpoint presentation styles designs. This is a four stage process. The stages in this process are technology, business, planning, marketing, knowledge.
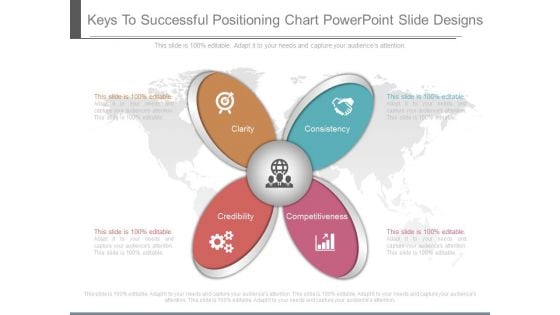
Keys To Successful Positioning Chart Powerpoint Slide Designs
This is a keys to successful positioning chart powerpoint slide designs. This is a four stage process. The stages in this process are clarity, consistency, credibility, competitiveness.
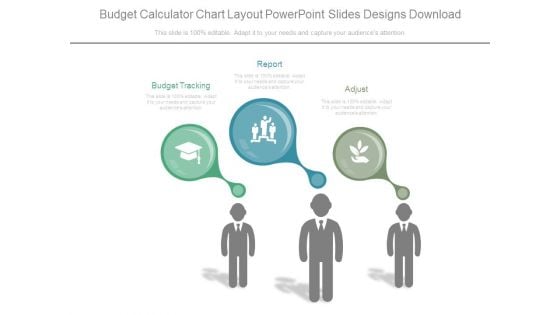
Budget Calculator Chart Layout Powerpoint Slides Designs Download
This is a budget calculator chart layout powerpoint slides designs download. This is a three stage process. The stages in this process are budget tracking, report, adjust.
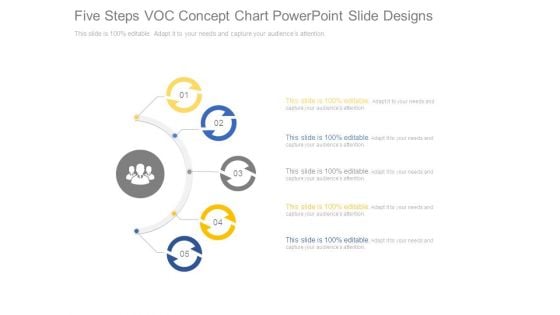
Five Steps Voc Concept Chart Powerpoint Slide Designs
This is a five steps voc concept chart powerpoint slide designs. This is a five stage process. The stages in this process are analysis, marketing, presentation, strategy.
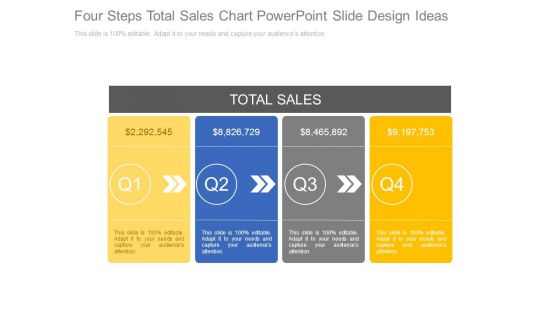
Four Steps Total Sales Chart Powerpoint Slide Design Ideas
This is a four steps total sales chart powerpoint slide design ideas. This is a four stage process. The stages in this process are total sales, marketing.
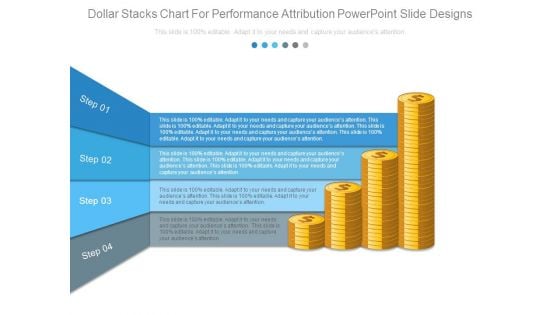
Dollar Stacks Chart For Performance Attribution Powerpoint Slide Designs
This is a dollar stacks chart for performance attribution powerpoint slide designs. This is a four stage process. The stages in this process are step.
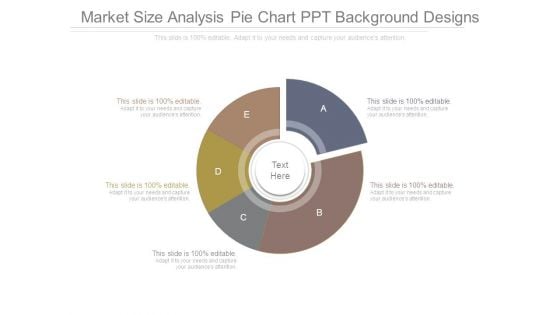
Market Size Analysis Pie Chart Ppt Background Designs
This is a market size analysis pie chart ppt background designs. This is a five stage process. The stages in this process are donut, business, marketing, process.
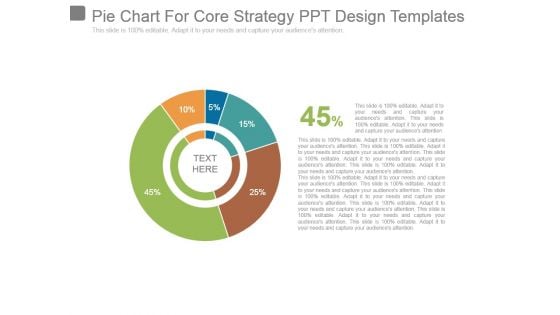
Pie Chart For Core Strategy Ppt Design Templates
This is a pie chart for core strategy ppt design templates. This is a five stage process. The stages in this process are business, marketing, strategy, finance, percentage.
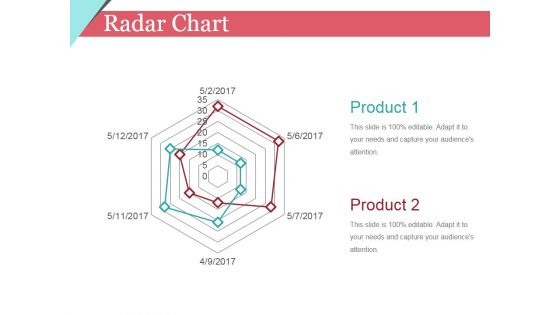
Radar Chart Ppt PowerPoint Presentation Infographic Template Design Templates
This is a radar chart ppt powerpoint presentation infographic template design templates. This is a seven stage process. The stages in this process are business, shapes, product, marketing.

Scatter Chart Ppt PowerPoint Presentation Portfolio Design Inspiration
This is a scatter chart ppt powerpoint presentation portfolio design inspiration. This is a twelve stage process. The stages in this process are graph, growth, success, business.
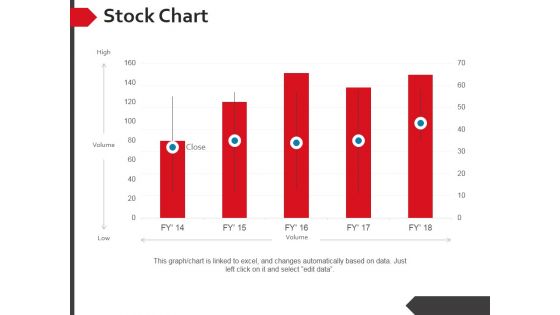
Stock Chart Ppt PowerPoint Presentation Summary Background Designs
This is a stock chart ppt powerpoint presentation summary background designs. This is a five stage process. The stages in this process are high, volume, low.
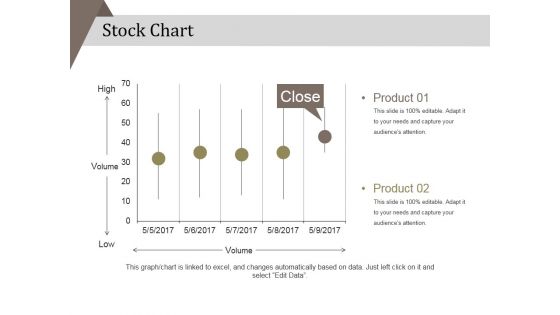
Stock Chart Ppt PowerPoint Presentation Portfolio Background Designs
This is a stock chart ppt powerpoint presentation portfolio background designs. This is a five stage process. The stages in this process are product, high, low .

Column Chart Ppt PowerPoint Presentation Inspiration Design Ideas
This is a column chart ppt powerpoint presentation inspiration design ideas. This is a nine stage process. The stages in this process are product, growth, success, graph, business.
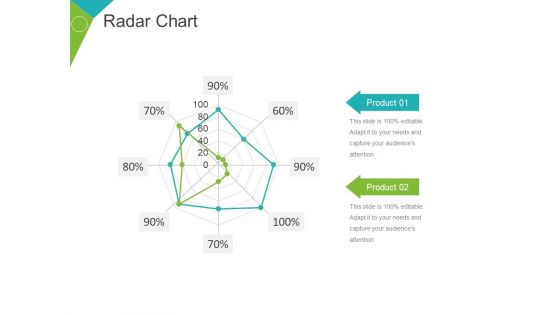
Radar Chart Ppt PowerPoint Presentation Portfolio Design Inspiration
This is a radar chart ppt powerpoint presentation portfolio design inspiration. This is a two stage process. The stages in this process are product, percentage, business, marketing, finance.
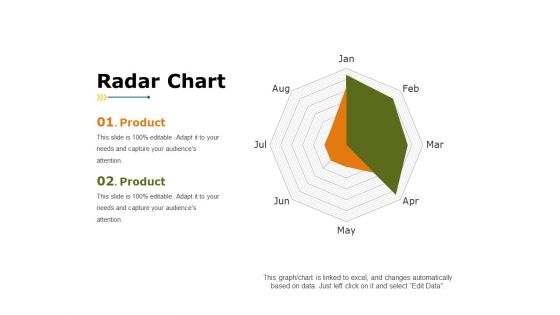
Radar Chart Ppt PowerPoint Presentation Summary Background Designs
This is a radar chart ppt powerpoint presentation summary background designs. This is a two stage process. The stages in this process are product, finance, business, marketing.
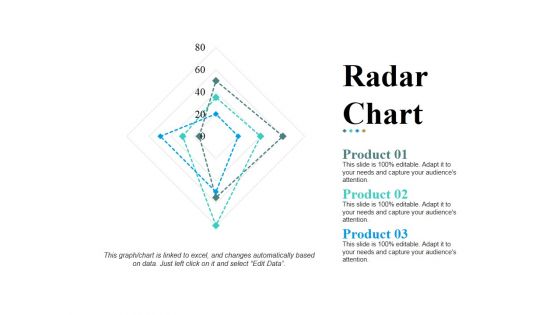
Radar Chart Ppt PowerPoint Presentation Pictures Design Templates
This is a radar chart ppt powerpoint presentation pictures design templates. This is a three stage process. The stages in this process are product, shapes, business, marketing, management.
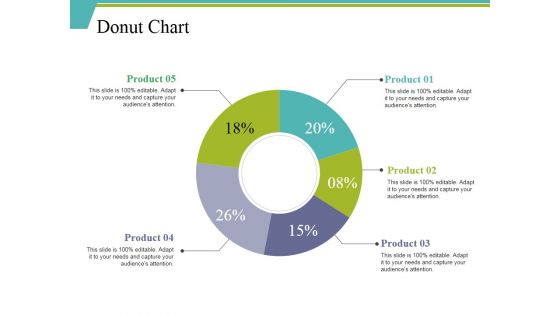
Donut Chart Ppt PowerPoint Presentation Ideas Background Designs
This is a donut chart ppt powerpoint presentation ideas background designs. This is a five stage process. The stages in this process are percentage, finance, donut, business, product.
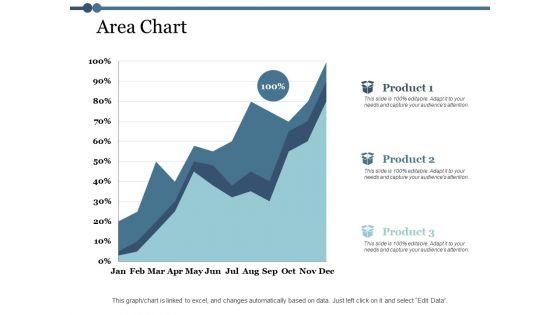
Area Chart Finance Ppt PowerPoint Presentation Outline Design Templates
This is a area chart finance ppt powerpoint presentation outline design templates. This is a three stage process. The stages in this process arefinance, marketing, management, investment, analysis.
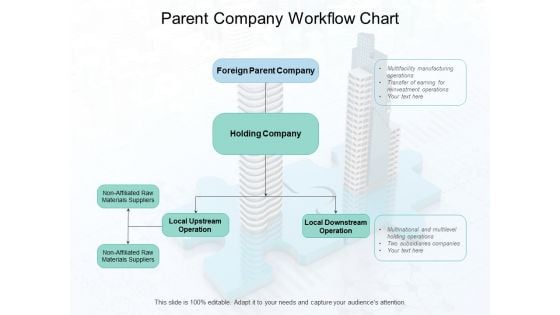
Parent Company Workflow Chart Ppt PowerPoint Presentation Summary Clipart
Presenting this set of slides with name parent company workflow chart ppt powerpoint presentation summary clipart. This is a one stage process. The stages in this process are holding company, business plan, investment company. This is a completely editable PowerPoint presentation and is available for immediate download. Download now and impress your audience.
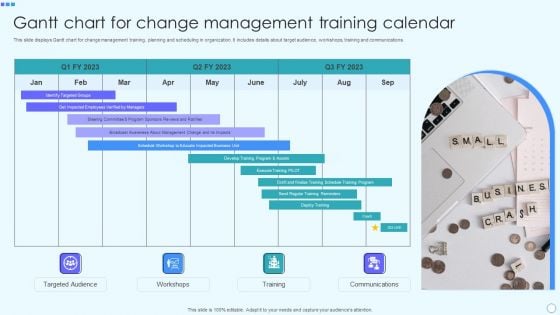
Gantt Chart For Change Management Training Calendar Diagrams PDF
This slide displays Gantt chart for change management training, planning and scheduling in organization. It includes details about target audience, workshops, training and communications. Presenting Gantt Chart For Change Management Training Calendar Diagrams PDF to dispense important information. This template comprises one stages. It also presents valuable insights into the topics including Targeted Audience, Workshops, Training, Communications. This is a completely customizable PowerPoint theme that can be put to use immediately. So, download it and address the topic impactfully.
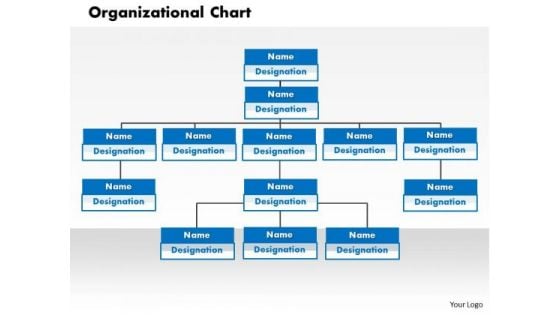
Business Framework Organization Chart In PowerPoint PowerPoint Presentation
This image slide has been designed with business man icons to display organization chart. Use this image slide, in your presentations to depict business management designations. This image slide will enhance the quality of your presentations.
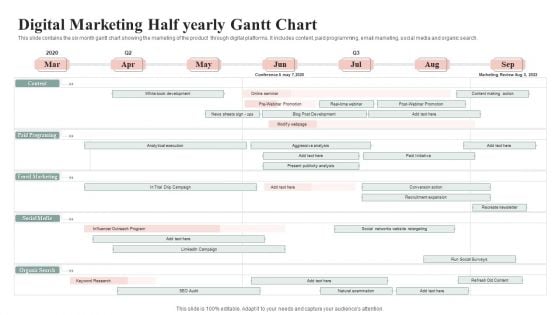
Digital Marketing Half Yearly Gantt Chart Elements PDF
This slide contains the six month gantt chart showing the marketing of the product through digital platforms. It includes content, paid programming, email marketing, social media and organic search. Showcasing this set of slides titled Digital Marketing Half Yearly Gantt Chart Elements PDF. The topics addressed in these templates are Email Marketing, Social Media, Organic Search. All the content presented in this PPT design is completely editable. Download it and make adjustments in color, background, font etc. as per your unique business setting.
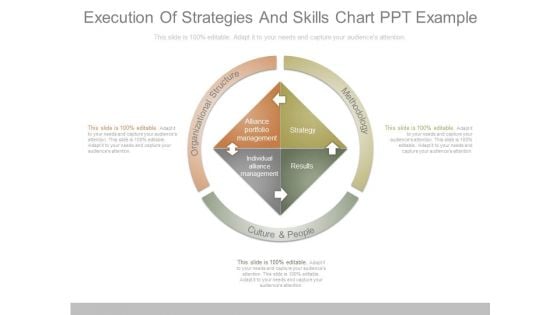
Execution Of Strategies And Skills Chart Ppt Example
This is a execution of strategies and skills chart ppt example. This is a three stage process. The stages in this process are methodology, culture and people, organizational structure, alliance portfolio management, strategy, individual alliance management, results.
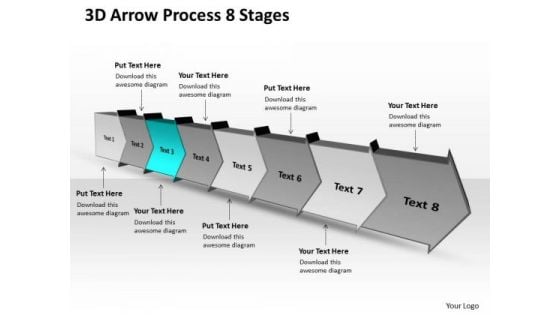
3d Arrow Process 8 Stages Production Flow Chart PowerPoint Slides
We present our 3d arrow process 8 stages production flow chart PowerPoint Slides. Use our Arrows PowerPoint Templates because, coincidentally it always points to the top. Use our Business PowerPoint Templates because, Leadership Template: - Show them the way, be Captain of the ship and lead them to new shores. Use our Design PowerPoint Templates because, Health of the determines the quality of our lives. Use our Signs PowerPoint Templates because, you have some great folks working with you, thinking with you. Use our Metaphor PowerPoint Templates because, It has inspired a whole new world of medical endeavor. Use these PowerPoint slides for presentations relating to Arrow, Arrows Block, Business, Chart, Design, Development, Diagram, Direction, Element, Flow, Flowchart, Graph, Linear, Management, Organization, Process, Program, Section, Sign, Solution, Symbol. The prominent colors used in the PowerPoint template are Blue, Gray, and Black Our 3d Arrow Process 8 Stages Production Flow Chart PowerPoint Slides deliver the bounty you deserve. Earn ample dividends from your efforts.

Enterprise Value Timing Factors Chart Ppt Examples Professional
This is a enterprise value timing factors chart ppt examples professional. This is a four stage process. The stages in this process are industry dynamics, company performance, organic growth, strategic acquisitions.
Horizontal Statistics Chart Ppt PowerPoint Presentation Complete Deck With Slides
Improve your presentation delivery using this horizontal statistics chart ppt powerpoint presentation complete deck with slides. Support your business vision and objectives using this well-structured PPT deck. This template offers a great starting point for delivering beautifully designed presentations on the topic of your choice. Comprising twelve this professionally designed template is all you need to host discussion and meetings with collaborators. Each slide is self-explanatory and equipped with high-quality graphics that can be adjusted to your needs. Therefore, you will face no difficulty in portraying your desired content using this PPT slideshow. This PowerPoint slideshow contains every important element that you need for a great pitch. It is not only editable but also available for immediate download and utilization. The color, font size, background, shapes everything can be modified to create your unique presentation layout. Therefore, download it now.
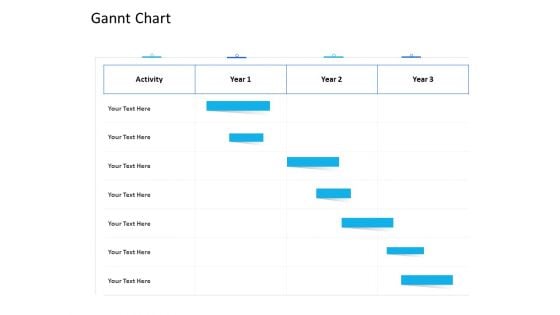
Organization Manpower Management Technology Gannt Chart Infographics PDF
Your complex projects can be managed and organized simultaneously using this detailed organization manpower management technology gannt chart infographics pdf template. Track the milestones, tasks, phases, activities, and subtasks to get an updated visual of your project. Share your planning horizon and release plan with this well crafted presentation template. This exemplary template can be used to plot various dependencies to distinguish the tasks in the pipeline and their impact on the schedules and deadlines of the project. Apart from this, you can also share this visual presentation with your team members and stakeholders. It a resourceful tool that can be incorporated into your business structure. Therefore, download and edit it conveniently to add the data and statistics as per your requirement.
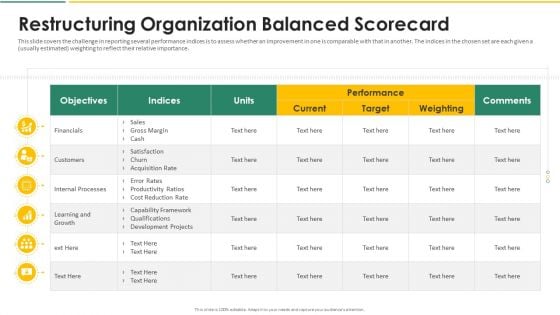
Organization Chart And Corporate Model Transformation Restructuring Organization Graphics PDF
This slide covers the timeline for restructuring the organization in four phases such as diagnose design develop and deliver. Deliver and pitch your topic in the best possible manner with this organization chart and corporate model transformation restructuring organization graphics pdf. Use them to share invaluable insights on diagnose, design, develop, deliver and impress your audience. This template can be altered and modified as per your expectations. So, grab it now.
Design Chart Paper In Powerpoint And Google Slides Cpb
Introducing our well designed Design Chart Paper In Powerpoint And Google Slides Cpb. This PowerPoint design presents information on topics like Design Chart Paper. As it is predesigned it helps boost your confidence level. It also makes you a better presenter because of its high quality content and graphics. This PPT layout can be downloaded and used in different formats like PDF, PNG, and JPG. Not only this, it is available in both Standard Screen and Widescreen aspect ratios for your convenience. Therefore, click on the download button now to persuade and impress your audience. Our Design Chart Paper In Powerpoint And Google Slides Cpb are topically designed to provide an attractive backdrop to any subject. Use them to look like a presentation pro.
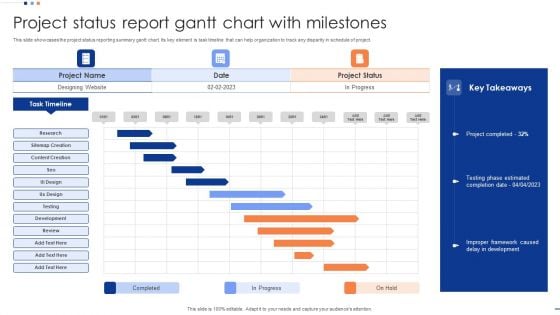
Project Status Report Gantt Chart With Milestones Information PDF
This slide showcases the project status reporting summary gantt chart. Its key element is task timeline that can help organization to track any disparity in schedule of project. Showcasing this set of slides titled Project Status Report Gantt Chart With Milestones Information PDF. The topics addressed in these templates are Research, Sitemap Creation, Content Creation. All the content presented in this PPT design is completely editable. Download it and make adjustments in color, background, font etc. as per your unique business setting.
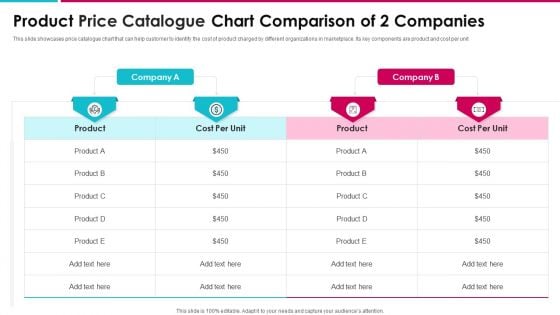
Product Price Catalogue Chart Comparison Of 2 Companies Elements PDF
This slide showcases price catalogue chart that can help customer to identify the cost of product charged by different organizations in marketplace. Its key components are product and cost per unit Showcasing this set of slides titled product price catalogue chart comparison of 2 companies elements pdf. The topics addressed in these templates are product, cost per unit, company. All the content presented in this PPT design is completely editable. Download it and make adjustments in color, background, font etc. as per your unique business setting.
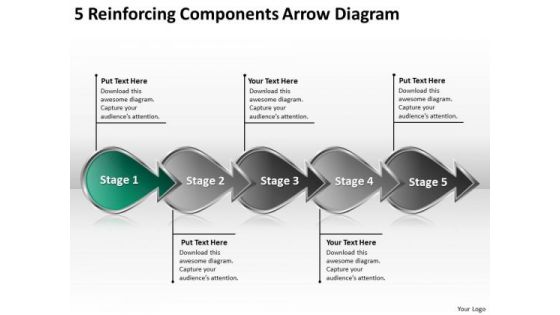
5 Reinforcing Components Arrow Diagram Typical Flow Chart PowerPoint Templates
We present our 5 reinforcing components arrow diagram typical flow chart PowerPoint templates.Download our Arrows PowerPoint Templates because they highlight the depth of your thought process. Download our Business PowerPoint Templates because you have had your share of being a goldfish in a small bowl.you are ready to launch out and spread your wings. Use our Competition PowerPoint Templates because this is an appropriate layout to convince your team that they have the ability to score a tEN every time. Download and present our Design PowerPoint Templates because it is all there in bits and pieces. Download our Shapes PowerPoint Templates because it Shines the light on your thoughts and motivates your team to improve the quality of celebration for all around you.Use these PowerPoint slides for presentations relating to arrow, arrows, block, business, chart, design, development, diagram, direction, element, flow, flowchart, graph, linear, management, organization, process, program, section, sign, solution, symbol. The prominent colors used in the PowerPoint template are Green, Gray, Black. Professionals tell us our 5 reinforcing components arrow diagram typical flow chart PowerPoint templates are Bright. The feedback we get is that our direction PowerPoint templates and PPT Slides are the best it can get when it comes to presenting. We assure you our 5 reinforcing components arrow diagram typical flow chart PowerPoint templates are Spectacular. Customers tell us our business PowerPoint templates and PPT Slides are Glamorous. Presenters tell us our 5 reinforcing components arrow diagram typical flow chart PowerPoint templates are Nostalgic. People tell us our block PowerPoint templates and PPT Slides are Second to none. Conduct meetings with our 5 Reinforcing Components Arrow Diagram Typical Flow Chart PowerPoint Templates. Download without worries with our money back guaranteee.
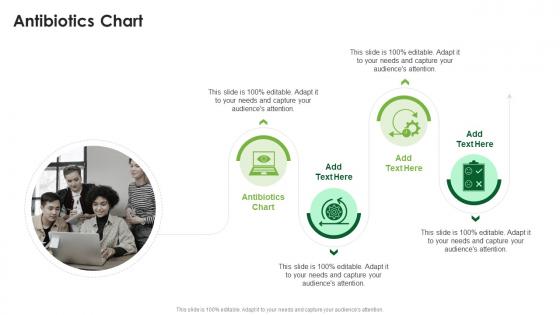
Antibiotics Chart In Powerpoint And Google Slides Cpb
Presenting our innovatively designed set of slides titled Antibiotics Chart In Powerpoint And Google Slides Cpb. This completely editable PowerPoint graphic exhibits Antibiotics Chart that will help you convey the message impactfully. It can be accessed with Google Slides and is available in both standard screen and widescreen aspect ratios. Apart from this, you can download this well structured PowerPoint template design in different formats like PDF, JPG, and PNG. So, click the download button now to gain full access to this PPT design. Our Antibiotics Chart In Powerpoint And Google Slides Cpb are topically designed to provide an attractive backdrop to any subject. Use them to look like a presentation pro.
Product Teardown Chart In Powerpoint And Google Slides Cpb
Presenting our innovatively-designed set of slides titled Product Teardown Chart In Powerpoint And Google Slides Cpb. This completely editable PowerPoint graphic exhibits Product Teardown Chart that will help you convey the message impactfully. It can be accessed with Google Slides and is available in both standard screen and widescreen aspect ratios. Apart from this, you can download this well-structured PowerPoint template design in different formats like PDF, JPG, and PNG. So, click the download button now to gain full access to this PPT design. Our Product Teardown Chart In Powerpoint And Google Slides Cpb are topically designed to provide an attractive backdrop to any subject. Use them to look like a presentation pro.
Value Canvas Icon With Competitor Analysis Chart Pictures Pdf
Showcasing this set of slides titled Value Canvas Icon With Competitor Analysis Chart Pictures Pdf. The topics addressed in these templates are Value Canvas Icon, Competitor Analysis Chart. All the content presented in this PPT design is completely editable. Download it and make adjustments in color, background, font etc. as per your unique business setting. Our Value Canvas Icon With Competitor Analysis Chart Pictures Pdf are topically designed to provide an attractive backdrop to any subject. Use them to look like a presentation pro.
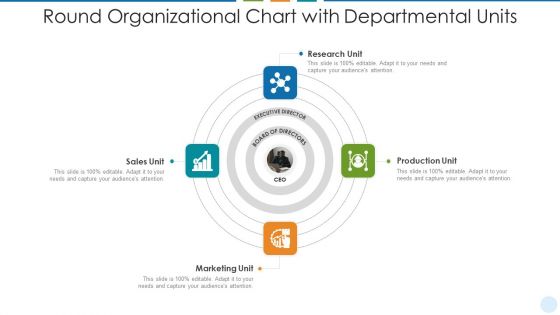
Round Organizational Chart With Departmental Units Diagrams PDF
Persuade your audience using this round organizational chart with departmental units diagrams pdf. This PPT design covers four stages, thus making it a great tool to use. It also caters to a variety of topics including research unit, production unit, marketing unit. Download this PPT design now to present a convincing pitch that not only emphasizes the topic but also showcases your presentation skills.
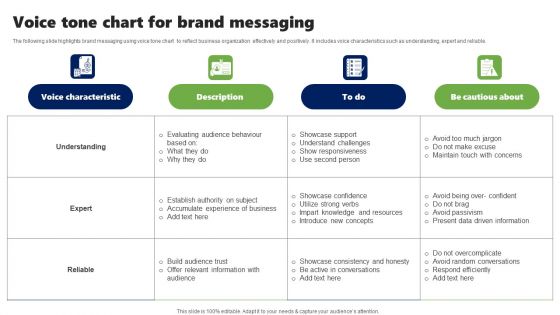
Voice Tone Chart For Brand Messaging Introduction PDF
The following slide highlights brand messaging using voice tone chart to reflect business organization effectively and positively. It includes voice characteristics such as understanding, expert and reliable. Showcasing this set of slides titled Voice Tone Chart For Brand Messaging Introduction PDF. The topics addressed in these templates are Voice Characteristic, Description, Expect. All the content presented in this PPT design is completely editable. Download it and make adjustments in color, background, font etc. as per your unique business setting.
Morse Code Chart In Powerpoint And Google Slides Cpb
Presenting our innovatively-designed set of slides titled Morse Code Chart In Powerpoint And Google Slides Cpb. This completely editable PowerPoint graphic exhibits Morse Code Chart that will help you convey the message impactfully. It can be accessed with Google Slides and is available in both standard screen and widescreen aspect ratios. Apart from this, you can download this well-structured PowerPoint template design in different formats like PDF, JPG, and PNG. So, click the download button now to gain full access to this PPT design. Our Morse Code Chart In Powerpoint And Google Slides Cpb are topically designed to provide an attractive backdrop to any subject. Use them to look like a presentation pro.
Chart Labelled In Powerpoint And Google Slides Cpb
Presenting our innovatively-designed set of slides titled Chart Labelled In Powerpoint And Google Slides Cpb. This completely editable PowerPoint graphic exhibits Chart Labelled that will help you convey the message impactfully. It can be accessed with Google Slides and is available in both standard screen and widescreen aspect ratios. Apart from this, you can download this well-structured PowerPoint template design in different formats like PDF, JPG, and PNG. So, click the download button now to gain full access to this PPT design. Our Chart Labelled In Powerpoint And Google Slides Cpb are topically designed to provide an attractive backdrop to any subject. Use them to look like a presentation pro.
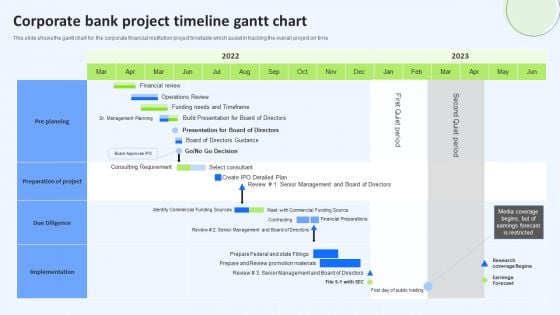
Corporate Bank Project Timeline Gantt Chart Infographics PDF
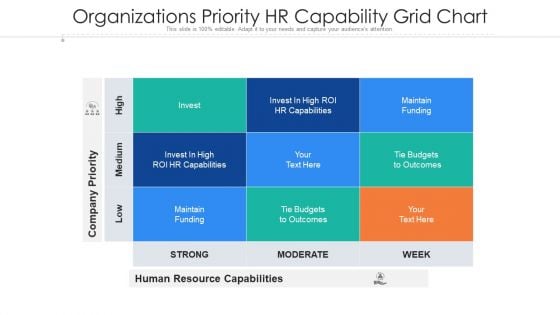
Organizations Priority HR Capability Grid Chart Ppt Ideas Brochure PDF
Showcasing this set of slides titled organizations priority hr capability grid chart ppt ideas brochure pdf. The topics addressed in these templates are organizations, capability, resource. All the content presented in this PPT design is completely editable. Download it and make adjustments in color, background, font etc. as per your unique business setting.
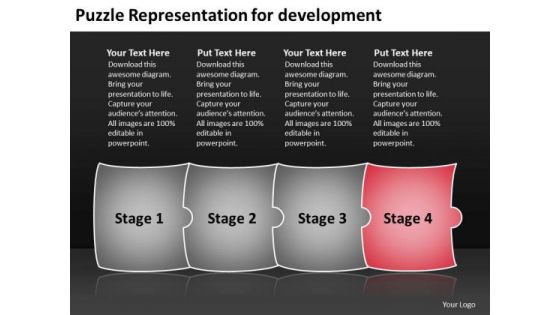
Puzzle Representation For Development Production Flow Chart PowerPoint Slides
We present our puzzle representation for development production flow chart PowerPoint Slides.Use our Business PowerPoint Templates because,This template can project the path to sucess that you have charted. Use our Puzzles or Jigsaws PowerPoint Templates because,This shows plans to increase the strength of your business relationships. Use our Leadership PowerPoint Templates because,Clear thnking is your strength, transmit your thoughts to your eager team. Use our Shapes PowerPoint Templates because,Your listeners do not have to put on their thinking caps. Use our Metaphor PowerPoint Templates because,Colours generate instant reactions in our brains.Use these PowerPoint slides for presentations relating to 3d, abstract, background, business, company, concept, connection, design, development, goal, graphic, illustration, isolated, jigsaw, leadership, management, manager, metaphor, organization, pattern, puzzle, render, shape, solution, strategy, structure, system, teamwork. The prominent colors used in the PowerPoint template are Red, White, Gray Filter out ideas with our Puzzle Representation For Development Production Flow Chart PowerPoint Slides. They get actionable ones to emerge.

3d Regular Implementation 7 Steps Flow Chart Template PowerPoint Slides
We present our 3d regular implementation 7 steps flow chart template PowerPoint Slides. Use our Business PowerPoint Templates because, The lessons have been analyzed, studied and conclusions drawn. Use our Arrows PowerPoint Templates because, Our Template designs are State of the Art. Use our Shapes PowerPoint Templates because; Highlight the key components of your entire manufacturing/ business process. Use our Abstract PowerPoint Templates because, Demonstrate to your audience how the best and most refined ideas pass through. Use our Process and Flows PowerPoint Templates because, to go for Gold and not just silver. Use these PowerPoint slides for presentations relating to analysis, art, blank, blue, business, categories, chart, chief, circle, clip, clipart, corporate, design, diagram, directors, element, executive, financial, graph, icon, illustration, implementation, isolated, managers, media, network, relations, role, sales, segments, set. The prominent colors used in the PowerPoint template are Blue, Gray, and Black Introduce changes with our 3d Regular Implementation 7 Steps Flow Chart Template PowerPoint Slides. Download without worries with our money back guaranteee.
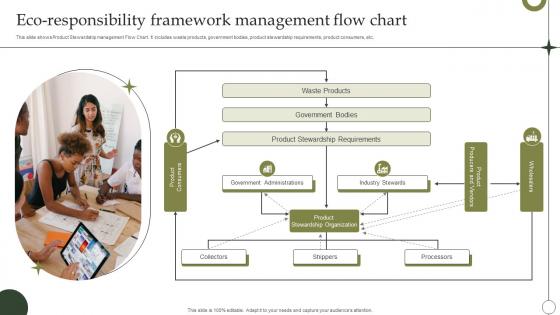
Eco Responsibility Framework Management Flow Chart Topics Pdf
This slide shows Product Stewardship management Flow Chart. It includes waste products, government bodies, product stewardship requirements, product consumers, etc. Showcasing this set of slides titled Eco Responsibility Framework Management Flow Chart Topics Pdf. The topics addressed in these templates are Waste Products, Government Bodies, Product Stewardship Requirements. All the content presented in this PPT design is completely editable. Download it and make adjustments in color, background, font etc. as per your unique business setting. This slide shows Product Stewardship management Flow Chart. It includes waste products, government bodies, product stewardship requirements, product consumers, etc.
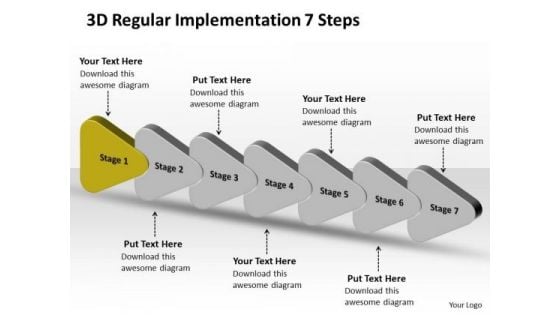
3d Regular Implementation 7 Steps Flow Chart PowerPoint Templates
We present our 3d regular implementation 7 steps flow chart PowerPoint templates. Use our Business PowerPoint Templates because, Emphasize on the relevance and importance of all milestones along the way. Use our Arrows PowerPoint Templates because, you have a great training programmer in mind to upgrade the skills of your staff. Use our Shapes PowerPoint Templates because; in any endeavor people matter most. Use our Abstract PowerPoint Templates because; Lay down the fundamentals to build upon. Use our Process and Flows PowerPoint Templates because, the vision of being the market leader is clear to you. Use these PowerPoint slides for presentations relating to analysis, art, blank, blue, business, categories, chart, chief, circle, clip, clipart, corporate, design, diagram, directors, element, executive, financial, graph, icon, illustration, implementation, isolated, managers, media, network, relations, role, sales, segments, set. The prominent colors used in the PowerPoint template are Green, Gray, and Black Reorganize your team with our 3d Regular Implementation 7 Steps Flow Chart PowerPoint Templates. Download without worries with our money back guaranteee.


 Continue with Email

 Home
Home


