Org Chart

Billing Cycle Flow Chart Print And Post Bills Ppt Powerpoint Presentation Model Portfolio
This is a billing cycle flow chart print and post bills ppt powerpoint presentation model portfolio. This is a six stage process. The stages in this process are billing process, billing procedure, billing cycle.
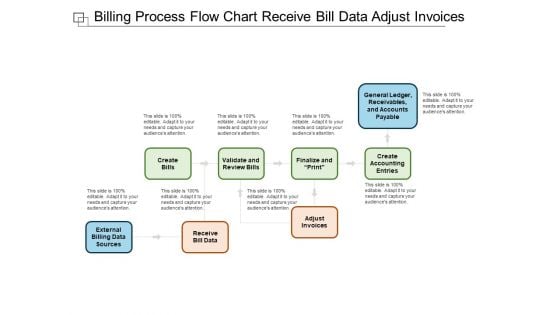
Billing Process Flow Chart Receive Bill Data Adjust Invoices Ppt Powerpoint Presentation Pictures Introduction
This is a billing process flow chart receive bill data adjust invoices ppt powerpoint presentation pictures introduction. This is a eight stage process. The stages in this process are billing process, billing procedure, billing cycle.
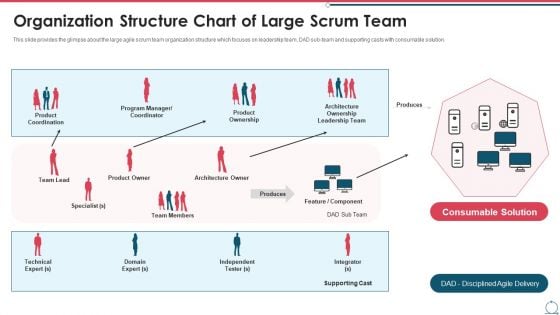
Building An Agile Development Scrum Team Organization Structure Chart Of Large Scrum Team Graphics PDF
This slide provides the glimpse about the large agile scrum team organization structure which focuses on leadership team, DAD sub-team and supporting casts with consumable solution. This is a building an agile development scrum team organization structure chart of large scrum team graphics pdf template with various stages. Focus and dispense information on one stages using this creative set, that comes with editable features. It contains large content boxes to add your information on topics like technical expert, domain expert, independent tester, integrator. You can also showcase facts, figures, and other relevant content using this PPT layout. Grab it now.
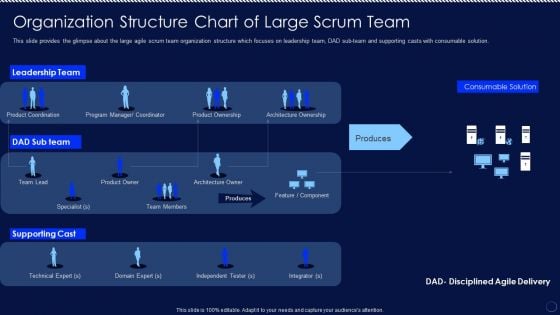
Organization Structure Chart Of Large Scrum Team Ppt PowerPoint Presentation File Example File PDF
This slide provides the glimpse about the large agile scrum team organization structure which focuses on leadership team, DAD sub team and supporting casts with consumable solution. Slidegeeks is one of the best resources for PowerPoint templates. You can download easily and regulate Organization Structure Chart Of Large Scrum Team Ppt PowerPoint Presentation File Example File PDF for your personal presentations from our wonderful collection. A few clicks is all it takes to discover and get the most relevant and appropriate templates. Use our Templates to add a unique zing and appeal to your presentation and meetings. All the slides are easy to edit and you can use them even for advertisement purposes.
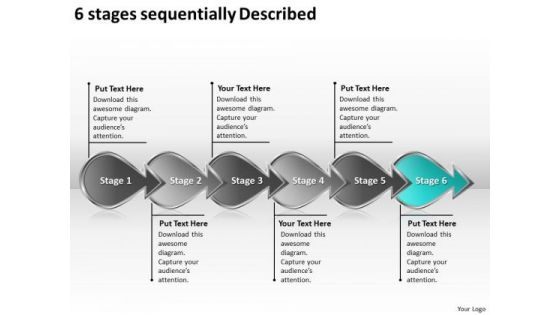
6 Stages Sequentially Described Ppt Strategic Planning Flow Chart PowerPoint Slides
We present our 6 stages sequentially described ppt strategic planning flow chart PowerPoint Slides.Download and present our Arrows PowerPoint Templates because by using this slide you can Heighten the anticipation of your audience listing . Download and present our Business PowerPoint Templates because this diagram can set an example to enthuse your team with the passion and fervour of your ideas. Download and present our Competition PowerPoint Templates because you can Educate your listeners on the means to keep it ticking over. Download our Design PowerPoint Templates because you can blaze a brilliant trail from point to point. Download and present our Shapes PowerPoint Templates because health of the determines the quality of our lives.Use these PowerPoint slides for presentations relating to arrow, arrows, block, business, chart, design, development, diagram, direction, element, flow, flowchart, graph, linear, management, organization, process, program, section, sign, solution, symbol. The prominent colors used in the PowerPoint template are Blue, Gray, Black. Professionals tell us our 6 stages sequentially described ppt strategic planning flow chart PowerPoint Slides are readymade to fit into any presentation structure. The feedback we get is that our development PowerPoint templates and PPT Slides will save the presenter time. We assure you our 6 stages sequentially described ppt strategic planning flow chart PowerPoint Slides are Colorful. Customers tell us our business PowerPoint templates and PPT Slides are Appealing. Presenters tell us our 6 stages sequentially described ppt strategic planning flow chart PowerPoint Slides will get their audience's attention. People tell us our block PowerPoint templates and PPT Slides are Pretty. Display your faith in your team with our 6 Stages Sequentially Described Ppt Strategic Planning Flow Chart PowerPoint Slides. Demonstrate your strong belief in them.
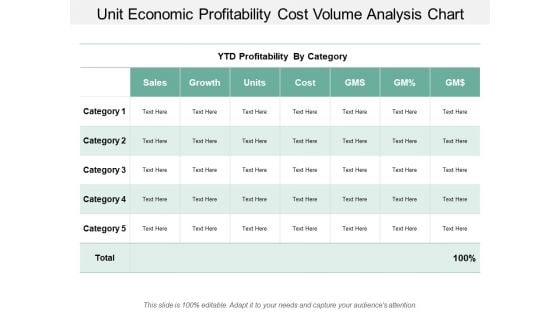
Unit Economic Profitability Cost Volume Analysis Chart Ppt PowerPoint Presentation Styles Graphics Design
This is a unit economic profitability cost volume analysis chart ppt powerpoint presentation styles graphics design. This is a five stage process. The stages in this process are business unit profitability, profitable organization, corporate unit profitability.
Icons Slide For Organization Chart And Corporate Model Transformation Brochure PDF
Presenting our innovatively structured icons slide for organization chart and corporate model transformation brochure pdf set of slides. The slides contain a hundred percent editable icons. You can replace these icons without any inconvenience. Therefore, pick this set of slides and create a striking presentation.
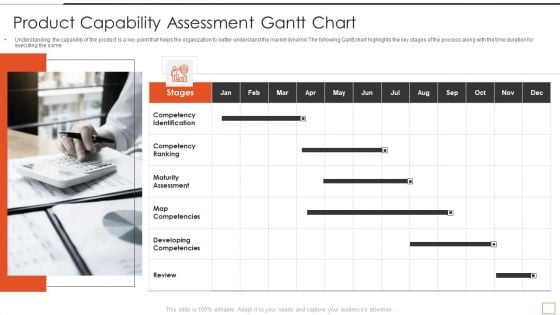
Developing New Product Messaging Canvas Determining Its USP Product Capability Assessment Gantt Chart Information PDF
Understanding the capability of the product is a key point that helps the organization to better understand the market dynamic The following Gantt chart highlights the key stages of the process along with the time duration for executing the same Presenting developing new product messaging canvas determining its usp product capability assessment gantt chart information pdf to provide visual cues and insights. Share and navigate important information on one stages that need your due attention. This template can be used to pitch topics like product capability assessment gantt chart. In addtion, this PPT design contains high resolution images, graphics, etc, that are easily editable and available for immediate download.
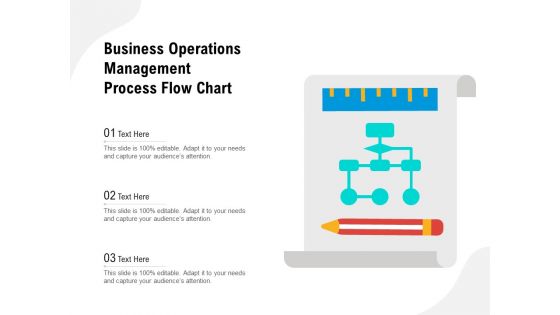
Business Operations Management Process Flow Chart Ppt PowerPoint Presentation File Pictures PDF
Persuade your audience using this business operations management process flow chart ppt powerpoint presentation file pictures pdf. This PPT design covers three stages, thus making it a great tool to use. It also caters to a variety of topics including business operations management process flow chart. Download this PPT design now to present a convincing pitch that not only emphasizes the topic but also showcases your presentation skills.
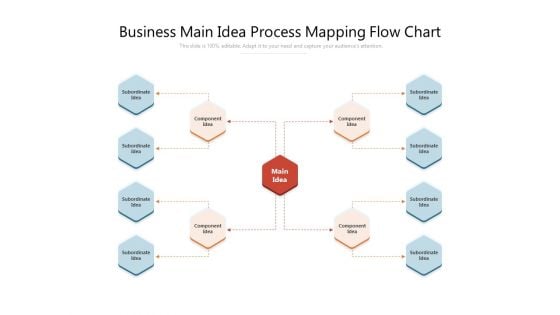
Business Main Idea Process Mapping Flow Chart Ppt PowerPoint Presentation File Gridlines PDF
Persuade your audience using this business main idea process mapping flow chart ppt powerpoint presentation file gridlines pdf. This PPT design covers one stages, thus making it a great tool to use. It also caters to a variety of topics including business main idea process mapping flow chart. Download this PPT design now to present a convincing pitch that not only emphasizes the topic but also showcases your presentation skills.
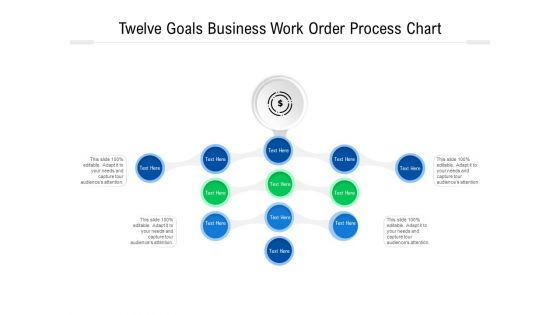
Twelve Goals Business Work Order Process Chart Ppt PowerPoint Presentation Gallery Summary PDF
Persuade your audience using this twelve goals business work order process chart ppt powerpoint presentation gallery summary pdf. This PPT design covers twelve stages, thus making it a great tool to use. It also caters to a variety of topics including twelve goals business work order process chart. Download this PPT design now to present a convincing pitch that not only emphasizes the topic but also showcases your presentation skills.
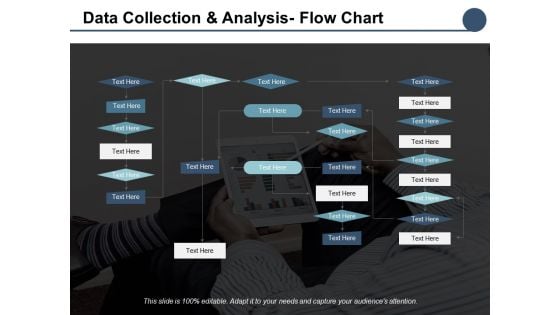
Data Collection And Analysis Flow Chart Ppt PowerPoint Presentation Outline Graphics
This is a data collection and analysis flow chart ppt powerpoint presentation outline graphics. This is a five stage process. The stages in this process are business, management, planning, strategy, marketing.
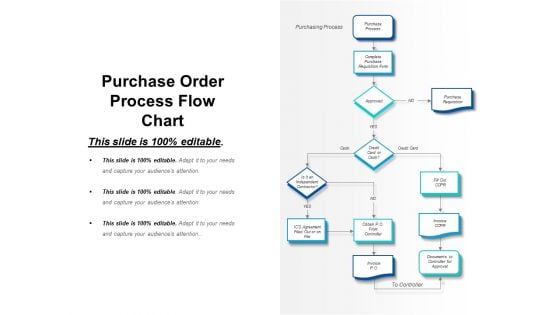
Purchase Order Process Flow Chart Ppt PowerPoint Presentation Professional Slide Download
This is a purchase order process flow chart ppt powerpoint presentation professional slide download. This is a six stage process. The stages in this process are purchasing, procurement, bidding.
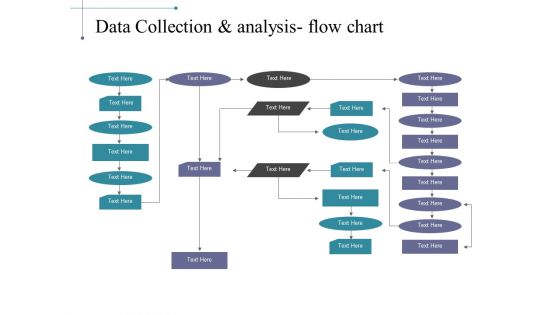
Data Collection And Analysis Flow Chart Ppt PowerPoint Presentation Ideas Images
This is a data collection and analysis flow chart ppt powerpoint presentation ideas images. This is a five stage process. The stages in this process are flow, marketing, strategy, process, arrows.
Organization Chart And Corporate Model Transformation Controls And Reporting After Icons PDF
Here we are covering effective controls a hierarchy of measures, so that the ones at operational level tie in with those that monitor policy and financial performance. This is a organization chart and corporate model transformation controls and reporting after icons pdf template with various stages. Focus and dispense information on four stages using this creative set, that comes with editable features. It contains large content boxes to add your information on topics like directors and senior executives, senior managers, sectional and departmental heads, first line team leaders and supervisors, operational clerical staff. You can also showcase facts, figures, and other relevant content using this PPT layout. Grab it now.
Pie Chart In Human Brain Vector Icon Ppt PowerPoint Presentation Gallery Sample PDF
Persuade your audience using this pie chart in human brain vector icon ppt powerpoint presentation gallery sample pdf. This PPT design covers three stages, thus making it a great tool to use. It also caters to a variety of topics including pie chart in human brain vector icon. Download this PPT design now to present a convincing pitch that not only emphasizes the topic but also showcases your presentation skills.
Entity Relationship Flow Chart Vector Icon Ppt PowerPoint Presentation Slides Portfolio PDF
Persuade your audience using this entity relationship flow chart vector icon ppt powerpoint presentation slides portfolio pdf. This PPT design covers three stages, thus making it a great tool to use. It also caters to a variety of topics including entity relationship flow chart vector icon. Download this PPT design now to present a convincing pitch that not only emphasizes the topic but also showcases your presentation skills.
Entity Relationship Workflow Chart Vector Icon Ppt PowerPoint Presentation Layouts Inspiration PDF
Persuade your audience using this entity relationship workflow chart vector icon ppt powerpoint presentation layouts inspiration pdf. This PPT design covers three stages, thus making it a great tool to use. It also caters to a variety of topics including entity relationship workflow chart vector icon. Download this PPT design now to present a convincing pitch that not only emphasizes the topic but also showcases your presentation skills.
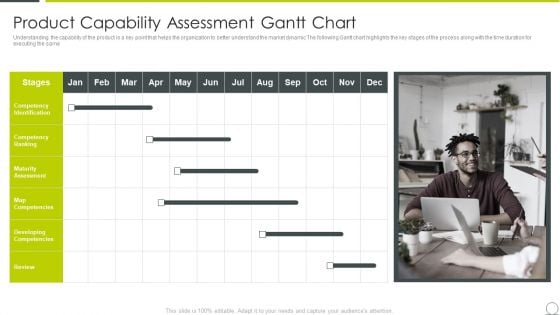
Marketing Communication Channels For Increasing Brand Awarenes Product Capability Assessment Gantt Chart Download PDF
Understanding the capability of the product is a key point that helps the organization to better understand the market dynamic The following Gantt chart highlights the key stages of the process along with the time duration for executing the same This is a marketing communication channels for increasing brand awarenes product capability assessment gantt chart download pdf template with various stages. Focus and dispense information on one stages using this creative set, that comes with editable features. It contains large content boxes to add your information on topics like product capability assessment gantt chart. You can also showcase facts, figures, and other relevant content using this PPT layout. Grab it now.
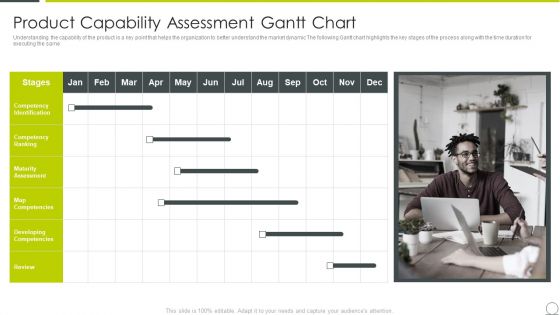
Examining Product Characteristics Brand Messaging Product Capability Assessment Gantt Chart Pictures PDF
Understanding the capability of the product is a key point that helps the organization to better understand the market dynamic The following Gantt chart highlights the key stages of the process along with the time duration for executing the same This is a examining product characteristics brand messaging product capability assessment gantt chart pictures pdf template with various stages. Focus and dispense information on one stages using this creative set, that comes with editable features. It contains large content boxes to add your information on topics like product capability assessment gantt chart. You can also showcase facts, figures, and other relevant content using this PPT layout. Grab it now.
Demand Grid Chart For Tracking User Traffic Ppt Ideas Graphics Pictures PDF
Persuade your audience using this demand grid chart for tracking user traffic ppt ideas graphics pictures pdf. This PPT design covers four stages, thus making it a great tool to use. It also caters to a variety of topics including demand grid chart for tracking user traffic. Download this PPT design now to present a convincing pitch that not only emphasizes the topic but also showcases your presentation skills.
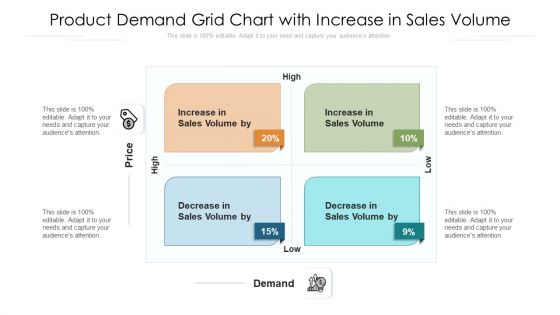
Product Demand Grid Chart With Increase In Sales Volume Ppt Slides Tips PDF
Persuade your audience using this product demand grid chart with increase in sales volume ppt slides tips pdf. This PPT design covers four stages, thus making it a great tool to use. It also caters to a variety of topics including product demand grid chart with increase in sales volume. Download this PPT design now to present a convincing pitch that not only emphasizes the topic but also showcases your presentation skills.
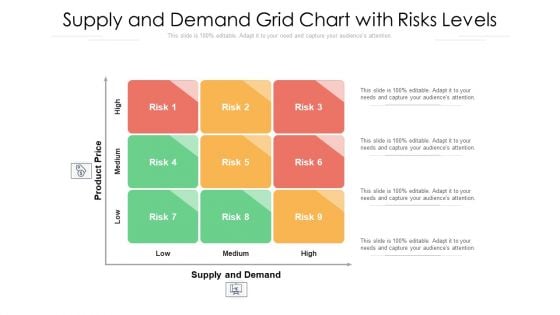
Supply And Demand Grid Chart With Risks Levels Ppt File Structure PDF
Persuade your audience using this supply and demand grid chart with risks levels ppt file structure pdf. This PPT design covers four stages, thus making it a great tool to use. It also caters to a variety of topics including supply and demand grid chart with risks levels. Download this PPT design now to present a convincing pitch that not only emphasizes the topic but also showcases your presentation skills.
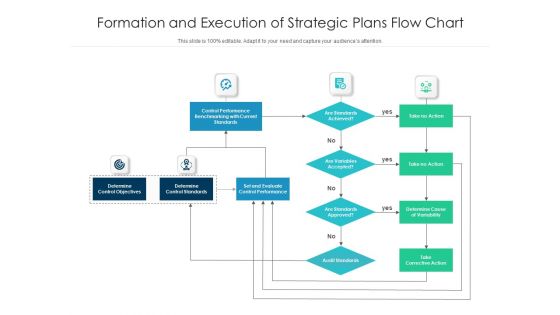
Formation And Execution Of Strategic Plans Flow Chart Ppt PowerPoint Presentation Gallery Deck PDF
Showcasing this set of slides titled formation and execution of strategic plans flow chart ppt powerpoint presentation gallery deck pdf. The topics addressed in these templates are formation and execution of strategic plans flow chart. All the content presented in this PPT design is completely editable. Download it and make adjustments in color, background, font etc. as per your unique business setting.
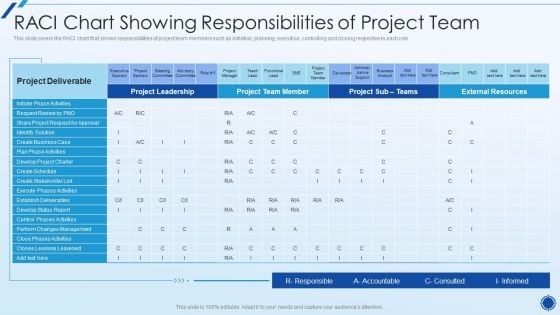
Organizing Action Plan For Successful Project Management RACI Chart Showing Responsibilities Of Project Team Portrait PDF
This slide covers the RACI chart that shows responsibilities of project team members such as initiation, planning, execution, controlling and closing respective to each role.Deliver and pitch your topic in the best possible manner with this organizing action plan for successful project management raci chart showing responsibilities of project team portrait pdf Use them to share invaluable insights on request review, create business case, establish deliverables and impress your audience. This template can be altered and modified as per your expectations. So, grab it now.
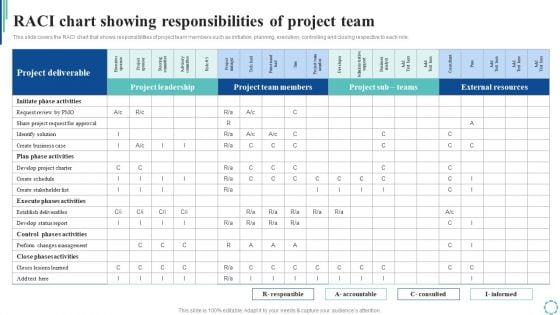
Raci Chart Showing Responsibilities Of Project Team Strategies To Enhance Project Lifecycle Designs PDF
This slide covers the RACI chart that shows responsibilities of project team members such as initiation, planning, execution, controlling and closing respective to each role.Whether you have daily or monthly meetings, a brilliant presentation is necessary. Raci Chart Showing Responsibilities Of Project Team Strategies To Enhance Project Lifecycle Designs PDF can be your best option for delivering a presentation. Represent everything in detail using Raci Chart Showing Responsibilities Of Project Team Strategies To Enhance Project Lifecycle Designs PDF and make yourself stand out in meetings. The template is versatile and follows a structure that will cater to your requirements. All the templates prepared by Slidegeeks are easy to download and edit. Our research experts have taken care of the corporate themes as well. So, give it a try and see the results.
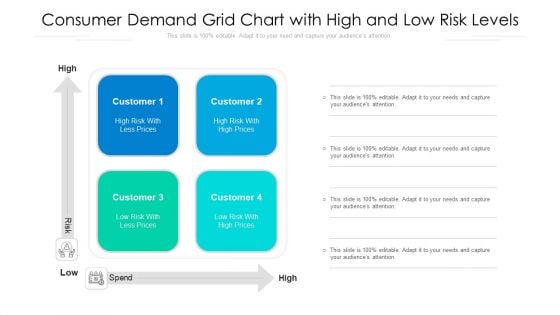
Consumer Demand Grid Chart With High And Low Risk Levels Ppt Layouts Visual Aids PDF
Presenting consumer demand grid chart with high and low risk levels ppt layouts visual aids pdf to dispense important information. This template comprises four stages. It also presents valuable insights into the topics including consumer demand grid chart with high and low risk levels. This is a completely customizable PowerPoint theme that can be put to use immediately. So, download it and address the topic impactfully.
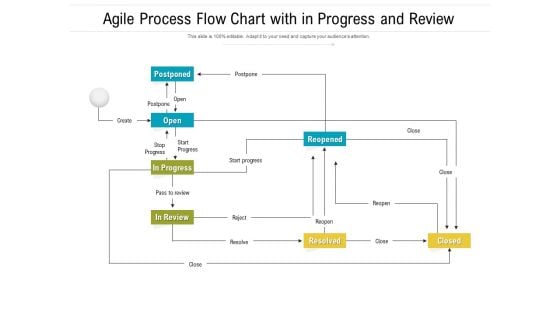
Agile Process Flow Chart With In Progress And Review Ppt PowerPoint Presentation File Demonstration PDF
Presenting agile process flow chart with in progress and review ppt powerpoint presentation file demonstration pdf to dispense important information. This template comprises one stages. It also presents valuable insights into the topics including agile process flow chart with in progress and review. This is a completely customizable PowerPoint theme that can be put to use immediately. So, download it and address the topic impactfully.
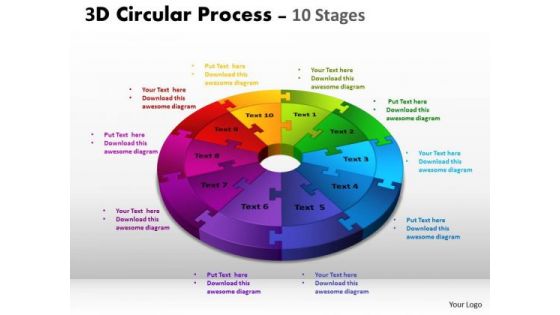
Sales Diagram 3d Circular Process Cycle Diagram Chart 10 Stages Design 3 Business Diagram
Establish The Dominance Of Your Ideas. Our Sales Diagram 3d Circular Process Cycle Diagram Chart 10 Stages Design 3 Business Diagram Powerpoint Templates Will Put Them On Top.
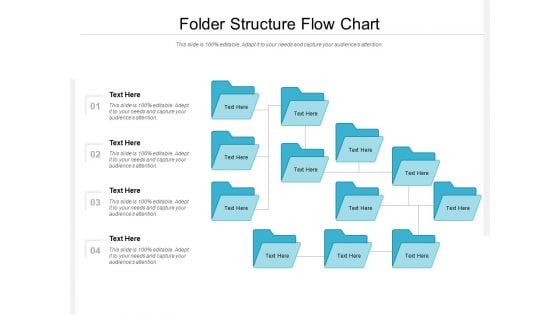
Folder Structure Flow Chart Ppt PowerPoint Presentation Gallery Graphics Tutorials PDF
Showcasing this set of slides titled folder structure flow chart ppt powerpoint presentation gallery graphics tutorials pdf. The topics addressed in these templates are folder structure flow chart. All the content presented in this PPT design is completely editable. Download it and make adjustments in color, background, font etc. as per your unique business setting.
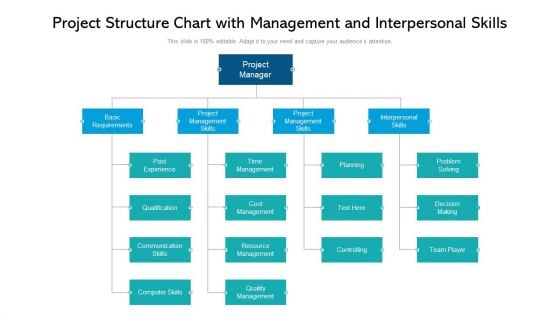
Project Structure Chart With Management And Interpersonal Skills Ppt PowerPoint Presentation Infographic Template Layouts PDF
Presenting project structure chart with management and interpersonal skills ppt powerpoint presentation infographic template layouts pdf to dispense important information. This template comprises four stages. It also presents valuable insights into the topics including basic requirements, project management skills, project management skills. This is a completely customizable PowerPoint theme that can be put to use immediately. So, download it and address the topic impactfully.
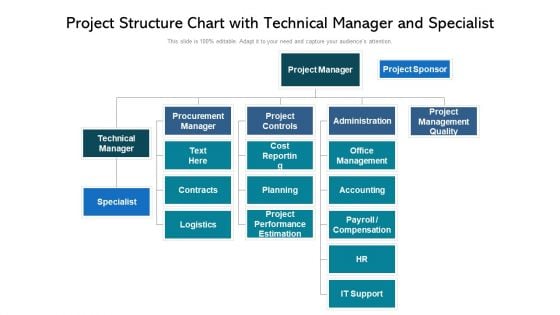
Project Structure Chart With Technical Manager And Specialist Ppt PowerPoint Presentation Gallery Guide PDF
Presenting project structure chart with technical manager and specialist ppt powerpoint presentation gallery guide pdf to dispense important information. This template comprises five stages. It also presents valuable insights into the topics including procurement manager, project controls, administration. This is a completely customizable PowerPoint theme that can be put to use immediately. So, download it and address the topic impactfully.
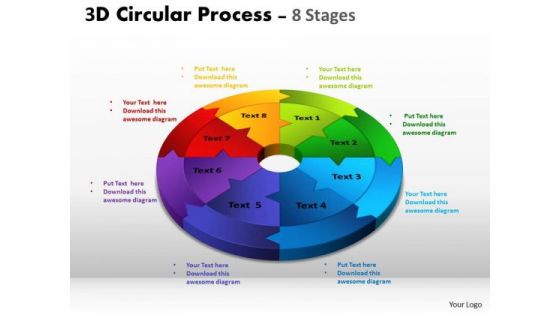
Sales Diagram 3d Circular Process Cycle Diagram Chart 8 Stages Design 2 Strategic Management
Be A Donor Of Great Ideas. Display Your Charity On Our Sales Diagram 3D Circular Process Cycle Diagram Chart 8 Stages Design 2 Strategic Management Powerpoint Templates.
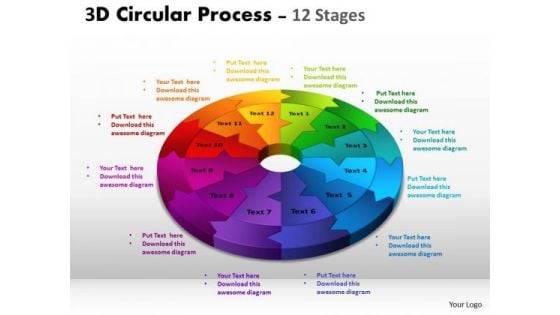
Business Diagram 3d Circular Process Cycle Diagram Chart 12 Stages Design Strategic Management
Be The Doer With Our Business Diagram 3D Circular Process Cycle Diagram Chart 12 Stages Design Strategic Management Powerpoint Templates. Put Your Thoughts Into Practice.
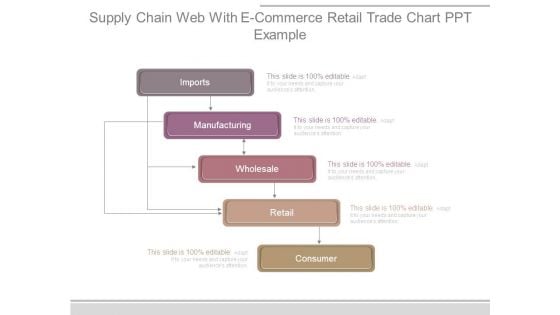
Supply Chain Web With E Commerce Retail Trade Chart Ppt Example
This is a supply chain web with e commerce retail trade chart ppt example. This is a five stage process. The stages in this process are imports, manufacturing, wholesale, retail, consumer.
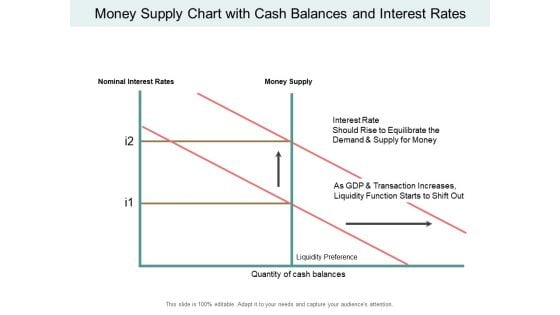
Money Supply Chart With Cash Balances And Interest Rates Ppt PowerPoint Presentation Inspiration Background Images
This is a money supply chart with cash balances and interest rates ppt powerpoint presentation inspiration background images. This is a two stage process. The stages in this process are liquidity, cash assets, solvency.
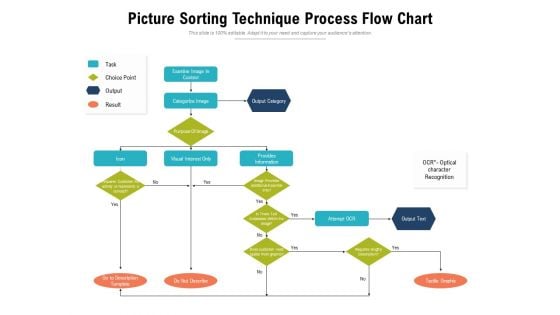
Picture Sorting Technique Process Flow Chart Ppt PowerPoint Presentation File Microsoft PDF
Persuade your audience using this picture sorting technique process flow chart ppt powerpoint presentation file microsoft pdf. This PPT design covers four stages, thus making it a great tool to use. It also caters to a variety of topics including picture sorting technique process flow chart. Download this PPT design now to present a convincing pitch that not only emphasizes the topic but also showcases your presentation skills.
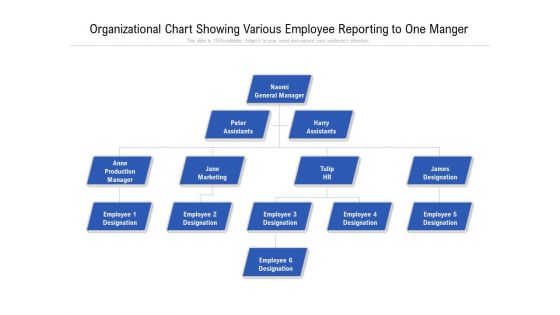
Organizational Chart Showing Various Employee Reporting To One Manger Ppt PowerPoint Presentation File Grid PDF
Persuade your audience using this organizational chart showing various employee reporting to one manger ppt powerpoint presentation file grid pdf. This PPT design covers four stages, thus making it a great tool to use. It also caters to a variety of topics including organizational chart showing various employee reporting to one manger. Download this PPT design now to present a convincing pitch that not only emphasizes the topic but also showcases your presentation skills.
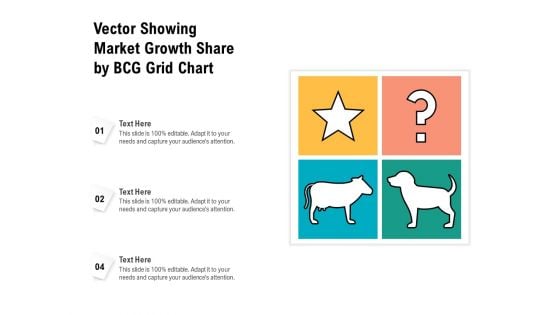
Vector Showing Market Growth Share By BCG Grid Chart Ppt PowerPoint Presentation Gallery Graphic Images PDF
Persuade your audience using this vector showing market growth share by bcg grid chart ppt powerpoint presentation gallery graphic images pdf. This PPT design covers three stages, thus making it a great tool to use. It also caters to a variety of topics including vector showing market growth share by bcg grid chart. Download this PPT design now to present a convincing pitch that not only emphasizes the topic but also showcases your presentation skills.
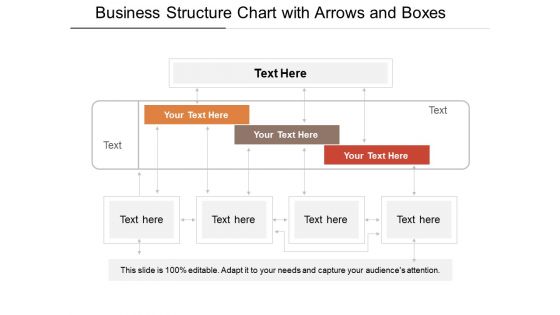
Business Structure Chart With Arrows And Boxes Ppt PowerPoint Presentation Gallery Visuals PDF
Presenting this set of slides with name business structure chart with arrows and boxes ppt powerpoint presentation gallery visuals pdf. The topics discussed in these slide is business structure chart with arrows and boxes. This is a completely editable PowerPoint presentation and is available for immediate download. Download now and impress your audience.
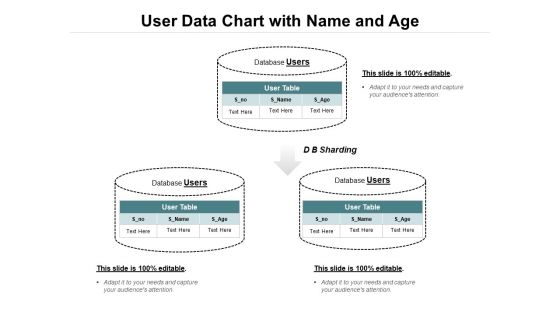
User Data Chart With Name And Age Ppt PowerPoint Presentation Summary Structure PDF
Presenting this set of slides with name user data chart with name and age ppt powerpoint presentation summary structure pdf. The topics discussed in these slide is user data chart with name and age. This is a completely editable PowerPoint presentation and is available for immediate download. Download now and impress your audience.
Input Process Output Chart For Evaluating And Selecting Supplier Icons PDF
This slide depicts the IPO input-process-output chart used to select supplier. The purpose of this IPO chart is to take make or buy decision depending on the resources required in an organization. It includes information related to the materials, supplier bids, etc. Persuade your audience using this Input Process Output Chart For Evaluating And Selecting Supplier Icons PDF. This PPT design covers Four stages, thus making it a great tool to use. It also caters to a variety of topics including Processing Activities, Outputs, Clients. Download this PPT design now to present a convincing pitch that not only emphasizes the topic but also showcases your presentation skills.
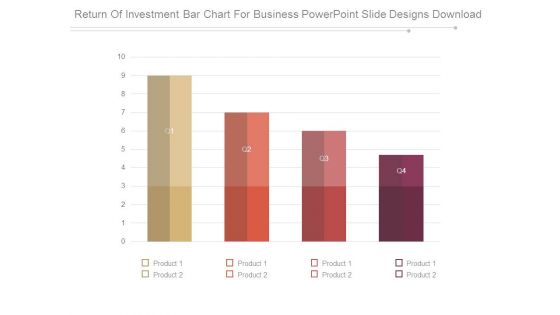
Return Of Investment Bar Chart For Business Powerpoint Slide Designs Download
This is a return of investment bar chart for business powerpoint slide designs download. This is a four stage process. The stages in this process are product.
5 Years Comparative Analysis Chart Ppt PowerPoint Presentation Complete Deck With Slides
Improve your presentation delivery using this 5 Years Comparative Analysis Chart Ppt PowerPoint Presentation Complete Deck With Slides. Support your business vision and objectives using this well-structured PPT deck. This template offers a great starting point for delivering beautifully designed presentations on the topic of your choice. Comprising twenty slides this professionally designed template is all you need to host discussion and meetings with collaborators. Each slide is self-explanatory and equipped with high-quality graphics that can be adjusted to your needs. Therefore, you will face no difficulty in portraying your desired content using this PPT slideshow. This PowerPoint slideshow contains every important element that you need for a great pitch. It is not only editable but also available for immediate download and utilization. The color, font size, background, shapes everything can be modified to create your unique presentation layout. Therefore, download it now.
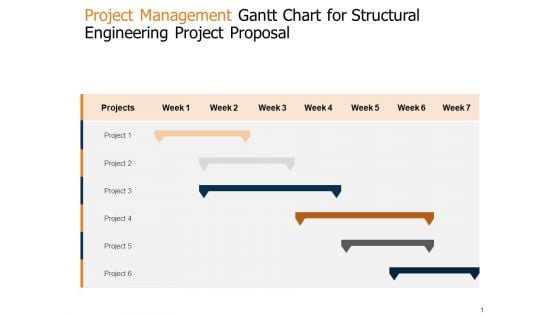
Project Management Gantt Chart For Structural Engineering Project Proposal Ppt Outline Styles PDF
Deliver an awe inspiring pitch with this creative project management gantt chart for structural engineering project proposal ppt outline styles pdf bundle. Topics like project management gantt chart for structural engineering project proposal can be discussed with this completely editable template. It is available for immediate download depending on the needs and requirements of the user.
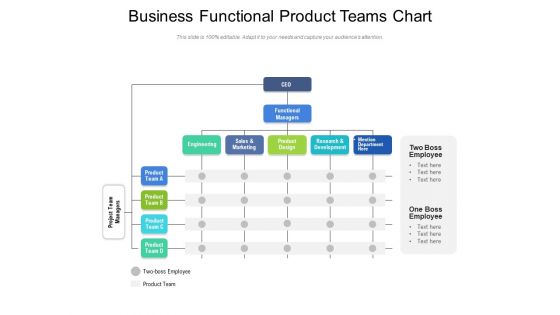
Business Functional Product Teams Chart Ppt PowerPoint Presentation Gallery Show PDF
Presenting this set of slides with name business functional product teams chart ppt powerpoint presentation gallery show pdf. This is a four stage process. The stages in this process are sales, marketing, development. This is a completely editable PowerPoint presentation and is available for immediate download. Download now and impress your audience.
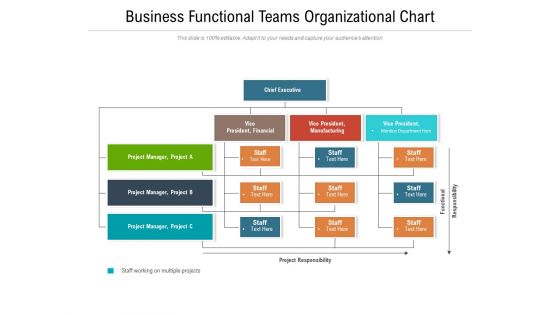
Business Functional Teams Organizational Chart Ppt PowerPoint Presentation Gallery Objects PDF
Presenting this set of slides with name business functional teams organizational chart ppt powerpoint presentation gallery objects pdf. This is a three stage process. The stages in this process are financial, manufacturing, staff. This is a completely editable PowerPoint presentation and is available for immediate download. Download now and impress your audience.
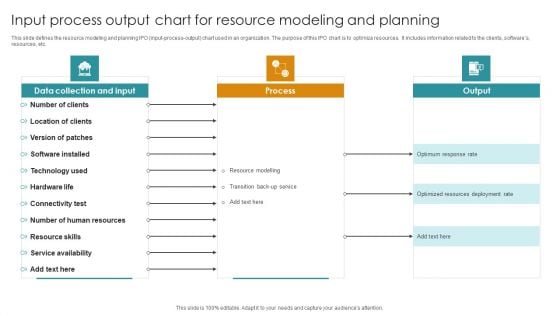
Input Process Output Chart For Resource Modeling And Planning Background PDF
This slide defines the resource modeling and planning IPO input-process-output chart used in an organization. The purpose of this IPO chart is to optimize resources. It includes information related to the clients, softwares, resources, etc. Showcasing this set of slides titled Input Process Output Chart For Resource Modeling And Planning Background PDF. The topics addressed in these templates are Data Collection And Input, Process, Output. All the content presented in this PPT design is completely editable. Download it and make adjustments in color, background, font etc. as per your unique business setting.
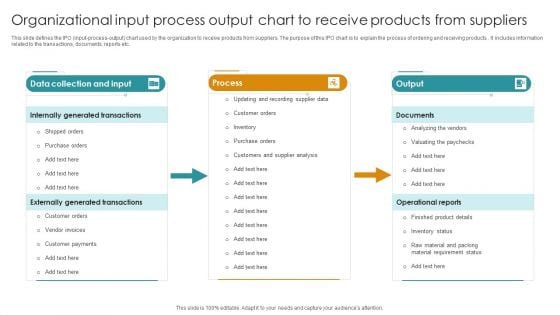
Organizational Input Process Output Chart To Receive Products From Suppliers Topics PDF
This slide defines the IPO input-process-output chart used by the organization to receive products from suppliers. The purpose of this IPO chart is to explain the process of ordering and receiving products . It includes information related to the transactions, documents, reports etc. Pitch your topic with ease and precision using this Organizational Input Process Output Chart To Receive Products From Suppliers Topics PDF. This layout presents information on Data Collection And Input, Process, Output. It is also available for immediate download and adjustment. So, changes can be made in the color, design, graphics or any other component to create a unique layout.
Food Company Financial Performance Summary Historical Food Product Sales Chart Icons PDF
The following slide shows the comparative sales growth of agricultural products and processed foods. It shows the product sales from more than three decades to assess the change in demand of company products. This Food Company Financial Performance Summary Historical Food Product Sales Chart Icons PDF from Slidegeeks makes it easy to present information on your topic with precision. It provides customization options, so you can make changes to the colors, design, graphics, or any other component to create a unique layout. It is also available for immediate download, so you can begin using it right away. Slidegeeks has done good research to ensure that you have everything you need to make your presentation stand out. Make a name out there for a brilliant performance.
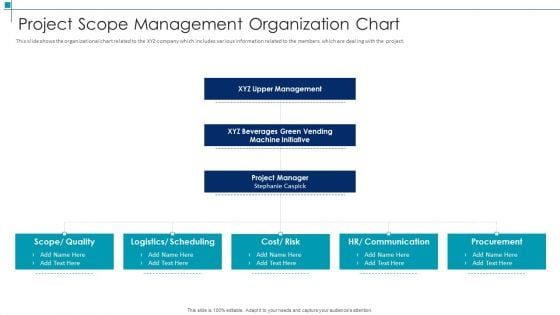
Project Scope Management Deliverables Project Scope Management Organization Chart Formats PDF
This slide shows the organizational chart related to the XYZ company which includes various information related to the members which are dealing with the project. Presenting project scope management deliverables project scope management organization chart formats pdf to provide visual cues and insights. Share and navigate important information on three stages that need your due attention. This template can be used to pitch topics like quality, scheduling, risk, cost, communication. In addtion, this PPT design contains high resolution images, graphics, etc, that are easily editable and available for immediate download.
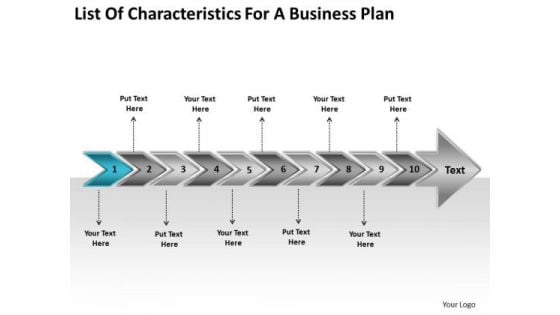
For A New Business PowerPoint Presentation Plan Flow Chart Maker Free Slides
We present our for a new business powerpoint presentation plan flow chart maker free Slides.Present our Arrows PowerPoint Templates because the atmosphere in the worplace is electric. Present our Shapes PowerPoint Templates because there are a bucketful of brilliant ideas swirling around within your group. Download our Business PowerPoint Templates because you are ready to flap your wings and launch off. All poised are you to touch the sky with glory. Present our Signs PowerPoint Templates because you can put it up there for all to see. Present our Process and Flows PowerPoint Templates because the key criteria for necessary infrastructure are at your finger tips. Radiate this knowledge to the group and see their eyes light up.Use these PowerPoint slides for presentations relating to algorithm, arrow, arrows, block, business, chart, connection, design, development, diagram, direction, element, flow, flowchart, graph, kind, linear, management, model, module, motion, of, organization, plan, process, program, section, segment, set, sign, solution, strategy, symbol, technology. The prominent colors used in the PowerPoint template are Blue, Gray, Black. The feedback we get is that our for a new business powerpoint presentation plan flow chart maker free Slides are Dazzling. PowerPoint presentation experts tell us our chart PowerPoint templates and PPT Slides are Tranquil. People tell us our for a new business powerpoint presentation plan flow chart maker free Slides are Energetic. Professionals tell us our chart PowerPoint templates and PPT Slides are Nice. You can be sure our for a new business powerpoint presentation plan flow chart maker free Slides are Majestic. We assure you our chart PowerPoint templates and PPT Slides are Glamorous. Put our For A New Business PowerPoint Presentation Plan Flow Chart Maker Free Slides under examination. They will come out with flying colours.
Viewers Trends Icon With Magnifying Glass And Chart Ppt PowerPoint Presentation Gallery Structure PDF
Presenting viewers trends icon with magnifying glass and chart ppt powerpoint presentation gallery structure pdf to dispense important information. This template comprises three stages. It also presents valuable insights into the topics including viewers trends icon with magnifying glass and chart. This is a completely customizable PowerPoint theme that can be put to use immediately. So, download it and address the topic impactfully.
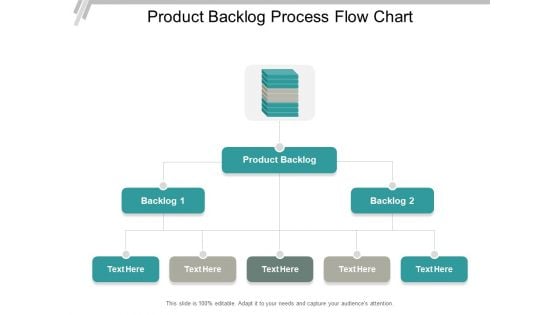
Product Backlog Process Flow Chart Ppt PowerPoint Presentation Model Design Templates
This is a product backlog process flow chart ppt powerpoint presentation model design templates. This is a two stage process. The stages in this process are backlog, uncompleted work, pending work.
Human Head With Flow Chart Symbol Ppt Powerpoint Presentation Ideas Design Templates
This is a human head with flow chart symbol ppt powerpoint presentation ideas design templates. This is a one stage process. The stages in this process are brainstorming, thinking man, innovative man.
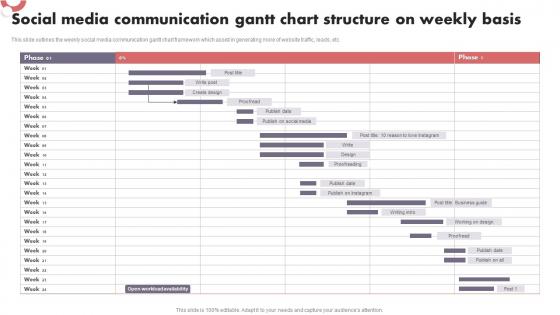
Social Media Communication Gantt Chart Structure On Weekly Basis Topics Pdf
This slide outlines the weekly social media communication gantt chart framework which assist in generating more of website traffic, leads, etc. Pitch your topic with ease and precision using this Social Media Communication Gantt Chart Structure On Weekly Basis Topics Pdf This layout presents information on Social Media, Communication, Weekly Basis It is also available for immediate download and adjustment. So, changes can be made in the color, design, graphics or any other component to create a unique layout. This slide outlines the weekly social media communication gantt chart framework which assist in generating more of website traffic, leads, etc.
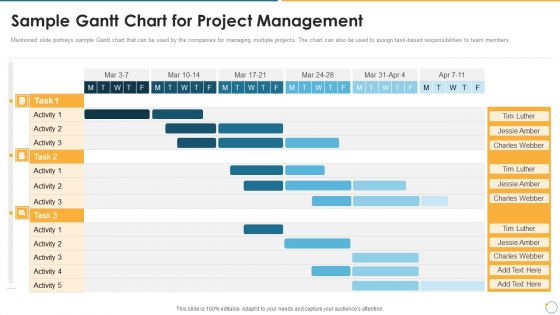
Collection Of Quality Assurance PPT Sample Gantt Chart For Project Management Topics PDF
Mentioned slide portrays sample Gantt chart that can be used by the companies for managing multiple projects. The chart can also be used to assign task based responsibilities to team members. Deliver an awe inspiring pitch with this creative collection of quality assurance ppt sample gantt chart for project management topics pdf bundle. Topics like sample gantt chart for project management can be discussed with this completely editable template. It is available for immediate download depending on the needs and requirements of the user.
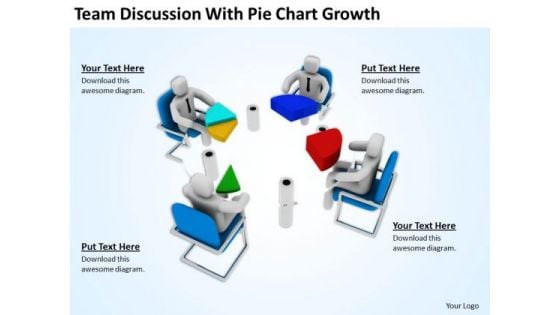
Men At Work Business As Usual With Pie Chart Growth PowerPoint Templates Ppt Backgrounds For Slides
We present our men at work business as usual with pie chart growth PowerPoint templates PPT backgrounds for slides.Download our Business PowerPoint Templates because You should Ascend the ladder of success with ease. Our PowerPoint Templates and Slides will provide strong and sturdy steps. Present our People PowerPoint Templates because They will Put your wonderful verbal artistry on display. Our PowerPoint Templates and Slides will provide you the necessary glam and glitter. Download our Teamwork PowerPoint Templates because It is Aesthetically crafted by artistic young minds. Our PowerPoint Templates and Slides are designed to display your dexterity. Download our Success PowerPoint Templates because Our PowerPoint Templates and Slides will definately Enhance the stature of your presentation. Adorn the beauty of your thoughts with their colourful backgrounds. Download and present our Pie Charts PowerPoint Templates because They will bring a lot to the table. Their alluring flavours will make your audience salivate.Use these PowerPoint slides for presentations relating to 3d, answer, colleague, collective, communication, discussion, game,group, help, icon, idea, illustration, info,information, interaction, jigsaw, join, link,mark, meet, men, office, opportunity,partner, partnership, people, person,piece, problem, professional,piechart, puzzle,render, search, shape, sign, solution,success, symbol, team, teamwork. The prominent colors used in the PowerPoint template are Blue, Red, White. Professionals tell us our men at work business as usual with pie chart growth PowerPoint templates PPT backgrounds for slides will help them to explain complicated concepts. People tell us our help PowerPoint templates and PPT Slides are incredible easy to use. We assure you our men at work business as usual with pie chart growth PowerPoint templates PPT backgrounds for slides help you meet deadlines which are an element of today's workplace. Just browse and pick the slides that appeal to your intuitive senses. Presenters tell us our discussion PowerPoint templates and PPT Slides will make the presenter look like a pro even if they are not computer savvy. We assure you our men at work business as usual with pie chart growth PowerPoint templates PPT backgrounds for slides are second to none. PowerPoint presentation experts tell us our help PowerPoint templates and PPT Slides are visually appealing. Our Men At Work Business As Usual With Pie Chart Growth PowerPoint Templates Ppt Backgrounds For Slides allow you to enter any arena. They effectively equip you for the event.
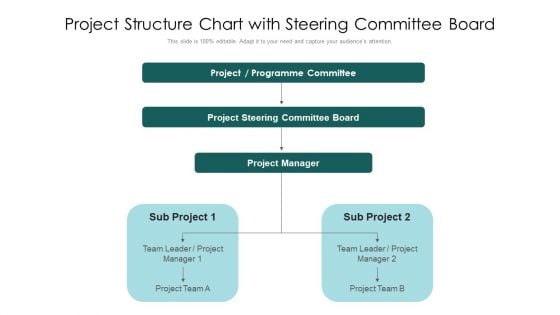
Project Structure Chart With Steering Committee Board Ppt PowerPoint Presentation File Examples PDF
Presenting project structure chart with steering committee board ppt powerpoint presentation file examples pdf to dispense important information. This template comprises two stages. It also presents valuable insights into the topics including project programme committee, project steering committee board, project manager. This is a completely customizable PowerPoint theme that can be put to use immediately. So, download it and address the topic impactfully.
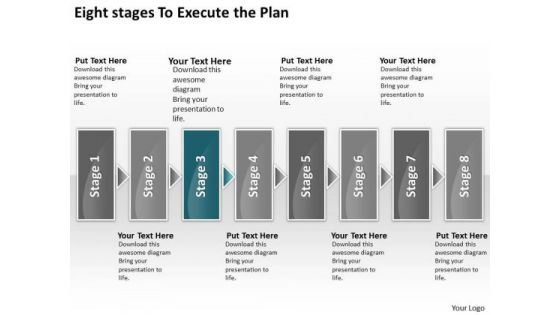
Eight Stages To Execute The Plan Chart Freeware Flowchart PowerPoint Templates
We present our eight stages to execute the plan chart freeware flowchart PowerPoint templates.Present our Arrows PowerPoint Templates because you have a good idea of the roadmap to your desired destination. Download and present our Shapes PowerPoint Templates because you can Organize your thoughts and illuminate your ideas accordingly. Download and present our Business PowerPoint Templates because this slide will fire away with all the accuracy at your command. Download our Boxes PowerPoint Templates because this Layout helps you to expand your plans to overcome obstacles and reassure the team that they shall continue to roll along merrily. Download and present our Communication PowerPoint Templates because the plans are in your head, stage by stage, year by year.Use these PowerPoint slides for presentations relating to abstract, action, attach, box, business, center, chain, chart, color, communication, concept, connection, cube, cycle, data, diagram, flow, globe, horizontal, idea, illustration, information, interaction, jigsaw, join, link, pieces, process, puzzle, relation, relationship, shape, success. The prominent colors used in the PowerPoint template are Blue, Gray, White. The feedback we get is that our eight stages to execute the plan chart freeware flowchart PowerPoint templates are Elegant. PowerPoint presentation experts tell us our chart PowerPoint templates and PPT Slides are Spiffy. People tell us our eight stages to execute the plan chart freeware flowchart PowerPoint templates are Lush. Professionals tell us our attach PowerPoint templates and PPT Slides are Sparkling. You can be sure our eight stages to execute the plan chart freeware flowchart PowerPoint templates will generate and maintain the level of interest you desire. They will create the impression you want to imprint on your audience. We assure you our center PowerPoint templates and PPT Slides are Magnificent. Celebrate the occassion with our Eight Stages To Execute The Plan Chart Freeware Flowchart PowerPoint Templates. They will enhance the feeling of good cheer.


 Continue with Email

 Home
Home


