Organization Change
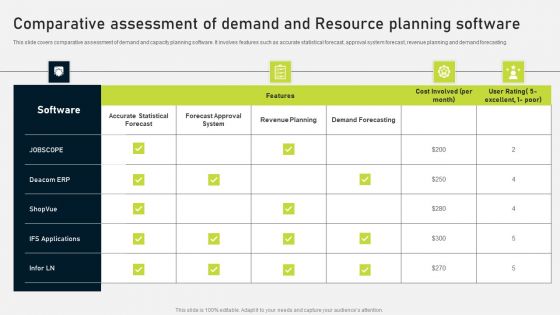
Comparative Assessment Of Demand And Resource Planning Software Inspiration PDF
This slide covers comparative assessment of demand and capacity planning software. It involves features such as accurate statistical forecast, approval system forecast, revenue planning and demand forecasting. Pitch your topic with ease and precision using this Alternate Demand Planning Strategies For Different Capacity Situations Demonstration PDF. This layout presents information on Forecast Approval System, Accurate Statistical Forecast, Revenue Planning. It is also available for immediate download and adjustment. So, changes can be made in the color, design, graphics or any other component to create a unique layout.
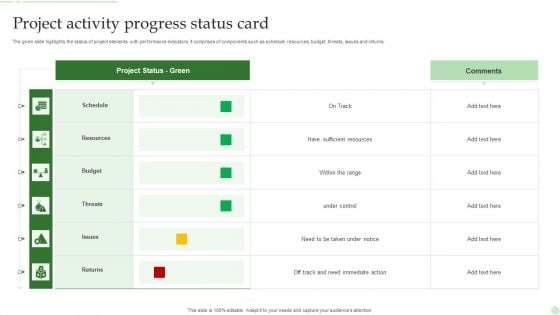
Project Activity Progress Status Card Ppt PowerPoint Presentation File Designs PDF
The given slide highlights the status of project elements with performance indicators. It comprises of components such as schedule, resources, budget, threats, issues and returns. Pitch your topic with ease and precision using this Project Activity Progress Status Card Ppt PowerPoint Presentation File Designs PDF. This layout presents information on Project Status, Resources, Budget, Threats, Issues. It is also available for immediate download and adjustment. So, changes can be made in the color, design, graphics or any other component to create a unique layout.
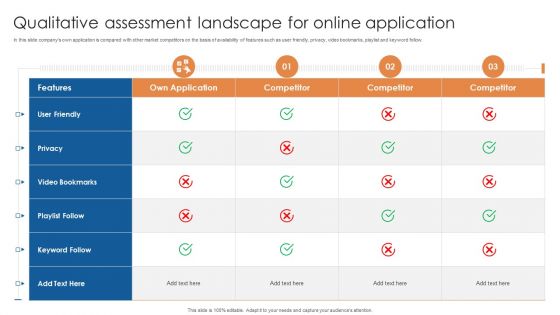
Qualitative Assessment Landscape For Online Application Ppt Professional Backgrounds PDF
In this slide companys own application is compared with other market competitors on the basis of availability of features such as user friendly, privacy, video bookmarks, playlist and keyword follow. Pitch your topic with ease and precision using this Qualitative Assessment Landscape For Online Application Ppt Professional Backgrounds PDF. This layout presents information on Own Application, User Friendly, Video Bookmarks. It is also available for immediate download and adjustment. So, changes can be made in the color, design, graphics or any other component to create a unique layout.

Actual Time Marketing Advantages For Companies And Agencies Ppt PowerPoint Presentation File Information PDF
The slide illustrates a company report highlighting the benefits from investing in a real-time marketing program for responding quickly to the trends. Various advantages included are increases customer experience, boosts customer retention rate, better conversion rates, etc. Pitch your topic with ease and precision using this Actual Time Marketing Advantages For Companies And Agencies Ppt PowerPoint Presentation File Information PDF. This layout presents information on Increases Customer Experience, Better Conversion Rates, Improved Brand Perception, Facilitates Personalization. It is also available for immediate download and adjustment. So, changes can be made in the color, design, graphics or any other component to create a unique layout.
Actual Time Marketing Challenges In Using Social Data Ppt PowerPoint Presentation Icon Infographics PDF
The slide inculcates a survey highlighting various barriers in real-time marketing for using social data to increase customer engagement. Various challenges included are inadequate budget, inappropriate skills, limited search analytical tools, etc. Pitch your topic with ease and precision using this Actual Time Marketing Challenges In Using Social Data Ppt PowerPoint Presentation Icon Infographics PDF. This layout presents information on Inadequate Budget, Inappropriate Skills, Limited Staff Abilities, Quick Responses. It is also available for immediate download and adjustment. So, changes can be made in the color, design, graphics or any other component to create a unique layout.
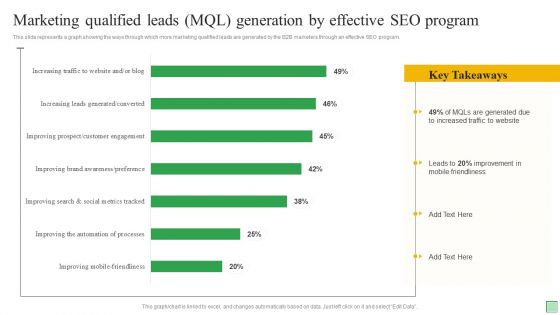
Marketing Qualified Leads MQL Generation By Effective SEO Program Ppt Slides Example Topics PDF
This slide represents a graph showing the ways through which more marketing qualified leads are generated by the B2B marketers through an effective SEO program. Pitch your topic with ease and precision using this Marketing Qualified Leads MQL Generation By Effective SEO Program Ppt Slides Example Topics PDF. This layout presents information on Mobile Friendliness, Due To Increased, Traffic To Website. It is also available for immediate download and adjustment. So, changes can be made in the color, design, graphics or any other component to create a unique layout.
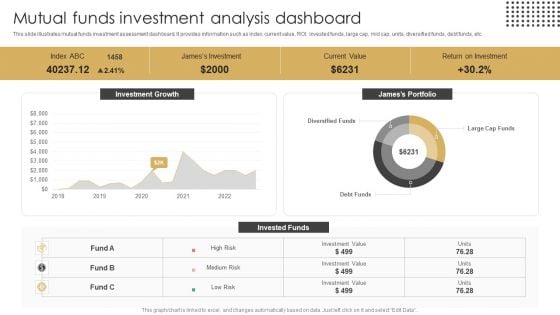
Mutual Funds Investment Analysis Dashboard Ppt Outline Background Images PDF
This slide illustrates mutual funds investment assessment dashboard. It provides information such as index, current value, ROI, invested funds, large cap, mid cap, units, diversified funds, debt funds, etc. Pitch your topic with ease and precision using this Mutual Funds Investment Analysis Dashboard Ppt Outline Background Images PDF. This layout presents information on Current Value, Return On Investment, Jamess Portfolio. It is also available for immediate download and adjustment. So, changes can be made in the color, design, graphics or any other component to create a unique layout.
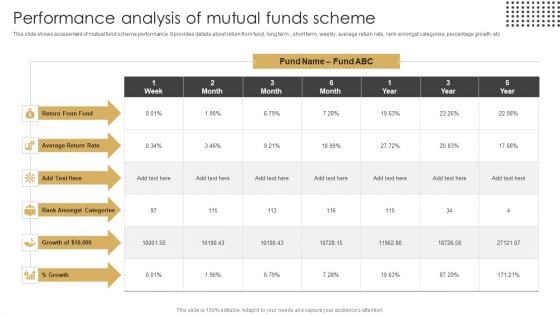
Performance Analysis Of Mutual Funds Scheme Ppt Professional Grid PDF
This slide shows assessment of mutual fund scheme performance. It provides details about return from fund, long term , short term, weekly, average return rate, rank amongst categories, percentage growth, etc. Pitch your topic with ease and precision using this Performance Analysis Of Mutual Funds Scheme Ppt Professional Grid PDF. This layout presents information on Return From Fund, Average Return Rate, Rank Amongst Categories. It is also available for immediate download and adjustment. So, changes can be made in the color, design, graphics or any other component to create a unique layout.
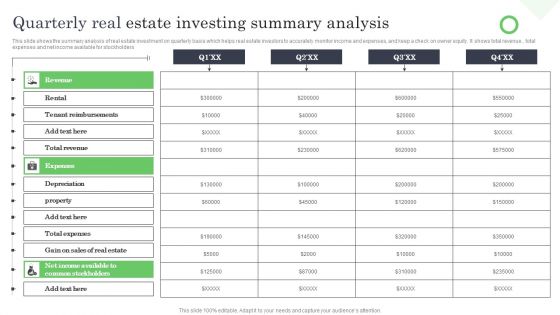
Quarterly Real Estate Investing Summary Analysis Ppt Pictures Background Images PDF
This slide shows the summary analysis of real estate investment on quarterly basis which helps real estate investors to accurately monitor income and expenses, and keep a check on owner equity. It shows total revenue , total expenses and net income available for stockholders. Pitch your topic with ease and precision using this Quarterly Real Estate Investing Summary Analysis Ppt Pictures Background Images PDF. This layout presents information on Expenses, Revenue, Net Income, Available To Common, Stockholders. It is also available for immediate download and adjustment. So, changes can be made in the color, design, graphics or any other component to create a unique layout.
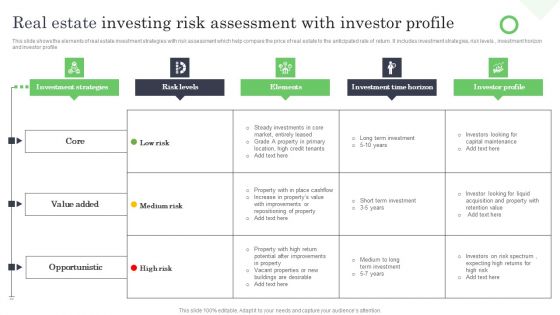
Real Estate Investing Risk Assessment With Investor Profiles Ppt Slide PDF
This slide shows the elements of real estate investment strategies with risk assessment which help compare the price of real estate to the anticipated rate of return. It includes investment strategies, risk levels , investment horizon and investor profile Pitch your topic with ease and precision using this Real Estate Investing Risk Assessment With Investor Profiles Ppt Slide PDF. This layout presents information on Investment Strategies, Risk Levels, Elements, Investment Time Horizon. It is also available for immediate download and adjustment. So, changes can be made in the color, design, graphics or any other component to create a unique layout.
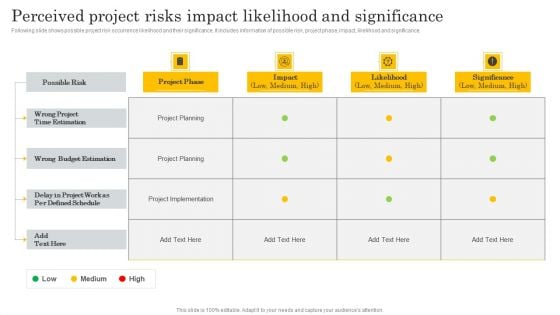
Financial Evaluation Report Perceived Project Risks Impact Likelihood And Significance Demonstration PDF
Following slide shows possible project risk occurrence likelihood and their significance. It includes information of possible risk, project phase, impact, likelihood and significance. If your project calls for a presentation, then Slidegeeks is your go-to partner because we have professionally designed, easy-to-edit templates that are perfect for any presentation. After downloading, you can easily edit Financial Evaluation Report Perceived Project Risks Impact Likelihood And Significance Demonstration PDF and make the changes accordingly. You can rearrange slides or fill them with different images. Check out all the handy templates.

Customer Effort Score And NPS Comparative Analysis Matrix Ppt Portfolio Pictures PDF
The slide carries a comparison between Customer Effort Score CES, Net Promoter Score NPS and Customer Satisfaction CSAT to effectively evaluate the user experience. Various basis of difference are description, purpose, rating scale, type of questions and industrial benchmark. Pitch your topic with ease and precision using this Customer Effort Score And NPS Comparative Analysis Matrix Ppt Portfolio Pictures PDF. This layout presents information on Basis, Customer Effort Score, Net Promoter Score, Customer Satisfaction. It is also available for immediate download and adjustment. So, changes can be made in the color, design, graphics or any other component to create a unique layout.
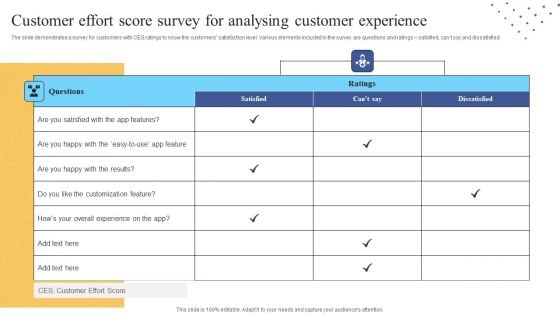
Customer Effort Score Survey For Analysing Customer Experience Ppt Professional Show PDF
The slide demonstrates a survey for customers with CES ratings to know the customers satisfaction level. Various elements included in the survey are questions and ratings satisfied, cant say and dissatisfied. Pitch your topic with ease and precision using this Customer Effort Score Survey For Analysing Customer Experience Ppt Professional Show PDF. This layout presents information on Customer Effort Score, Overall Experience, Rating. It is also available for immediate download and adjustment. So, changes can be made in the color, design, graphics or any other component to create a unique layout.
Yearly Status Report For Average Customer Effort Score Assessment Ppt Icon Layout Ideas PDF
The slide carries a summary report to assess average CES for predicting the customer behaviour and purchasing habits. Various elements included are average rating, yearly graphs and key takeaways. Pitch your topic with ease and precision using this Yearly Status Report For Average Customer Effort Score Assessment Ppt Icon Layout Ideas PDF. This layout presents information on Good Customer Experience, Easy To Purchase, Processes, Increase Churn Rate. It is also available for immediate download and adjustment. So, changes can be made in the color, design, graphics or any other component to create a unique layout.
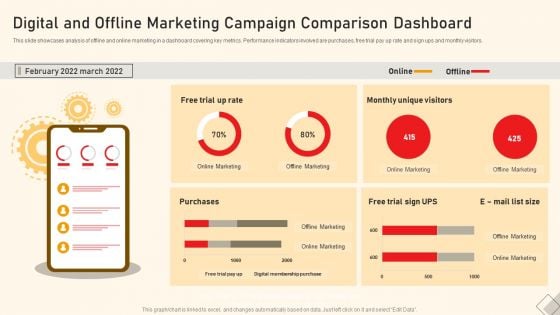
Digital And Offline Marketing Campaign Comparison Dashboard Ppt Inspiration Microsoft PDF
This slide showcases analysis of offline and online marketing in a dashboard covering key metrics. Performance indicators involved are purchases, free trial pay up rate and sign ups and monthly visitors. Pitch your topic with ease and precision using this Digital And Offline Marketing Campaign Comparison Dashboard Ppt Inspiration Microsoft PDF. This layout presents information on Online Marketing, Offline Marketing, Free Trial Sign, UPS. It is also available for immediate download and adjustment. So, changes can be made in the color, design, graphics or any other component to create a unique layout.

Framework For Organizational Strategic Planning And Decision Making Ppt Gallery Outfit PDF
The following slide showcases scorecard for strategic planning and decision points. It includes objective, measurement and target for financial, customer and internal processes. Pitch your topic with ease and precision using this Framework For Organizational Strategic Planning And Decision Making Ppt Gallery Outfit PDF. This layout presents information on Objective, Measurement, Target, Strategic Plan, Decision Point. It is also available for immediate download and adjustment. So, changes can be made in the color, design, graphics or any other component to create a unique layout.
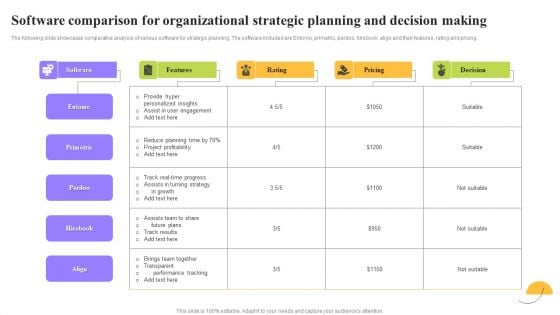
Software Comparison For Organizational Strategic Planning And Decision Making Ppt Summary Graphic Images PDF
The following slide showcases comparative analysis of various software for strategic planning. The software included are Entomo, primetric, perdoo, hirebook, align and their features, rating and pricing. Pitch your topic with ease and precision using this Software Comparison For Organizational Strategic Planning And Decision Making Ppt Summary Graphic Images PDF. This layout presents information on Features, Rating, Pricing, Decision. It is also available for immediate download and adjustment. So, changes can be made in the color, design, graphics or any other component to create a unique layout.
Multiple Organizational Project Plan Summary Ppt PowerPoint Presentation Icon Layouts PDF
This slide showcases report depicting status of companys projects. The report includes tasks, status, owner, assigned to, anticipated start and end date, estimated and actual cost. Pitch your topic with ease and precision using this Multiple Organizational Project Plan Summary Ppt PowerPoint Presentation Icon Layouts PDF. This layout presents information on In Progress, Review Storyboard Designs, Research Analysis Phase. It is also available for immediate download and adjustment. So, changes can be made in the color, design, graphics or any other component to create a unique layout.
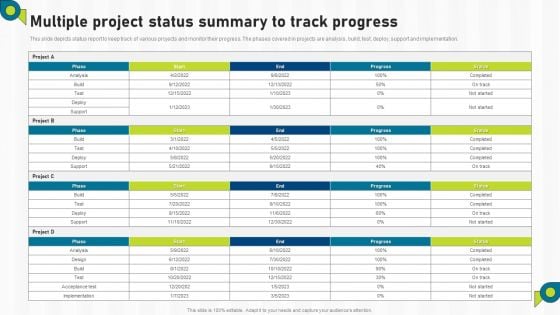
Multiple Project Status Summary To Track Progress Ppt PowerPoint Presentation File Rules PDF
This slide depicts status report to keep track of various projects and monitor their progress. The phases covered in projects are analysis, build, test, deploy, support and implementation. Pitch your topic with ease and precision using this Multiple Project Status Summary To Track Progress Ppt PowerPoint Presentation File Rules PDF. This layout presents information on Build, Test, Support. It is also available for immediate download and adjustment. So, changes can be made in the color, design, graphics or any other component to create a unique layout.
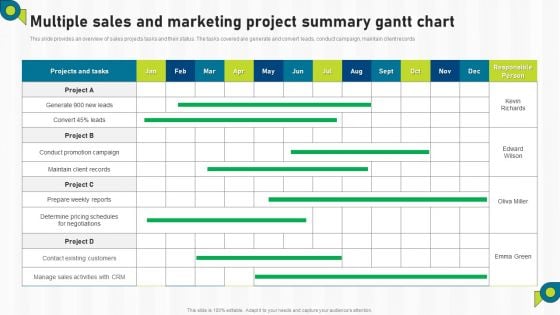
Multiple Sales And Marketing Project Summary Gantt Chart Ppt Outline Layouts PDF
This slide provides an overview of sales projects tasks and their status. The tasks covered are generate and convert leads, conduct campaign, maintain client records Pitch your topic with ease and precision using this Multiple Sales And Marketing Project Summary Gantt Chart Ppt Outline Layouts PDF. This layout presents information on Conduct Promotion Campaign, Prepare Weekly Reports, Contact Existing Customers. It is also available for immediate download and adjustment. So, changes can be made in the color, design, graphics or any other component to create a unique layout.
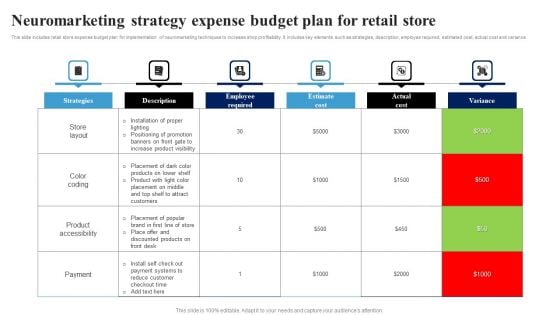
Neuromarketing Strategy Expense Budget Plan For Retail Store Ppt Ideas Background PDF
This slide includes retail store expense budget plan for implementation of neuromarketing techniques to increase shop profitability. It includes key elements such as strategies, description, employee required, estimated cost, actual cost and variance. Pitch your topic with ease and precision using this Neuromarketing Strategy Expense Budget Plan For Retail Store Ppt Ideas Background PDF. This layout presents information on Strategies, Color Coding, Estimate Cost, Actual Cost. It is also available for immediate download and adjustment. So, changes can be made in the color, design, graphics or any other component to create a unique layout.
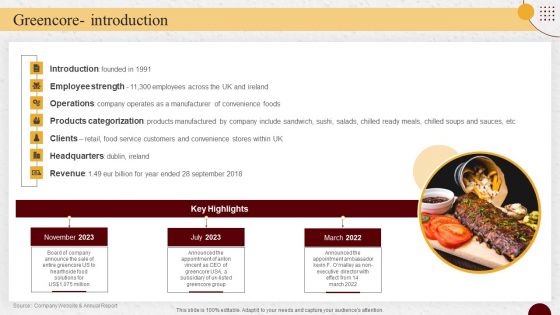
Industry Report Of Packaged Food Products Part 2 Greencore Introduction Structure PDF
This Industry Report Of Packaged Food Products Part 2 Greencore Introduction Structure PDF from Slidegeeks makes it easy to present information on your topic with precision. It provides customization options, so you can make changes to the colors, design, graphics, or any other component to create a unique layout. It is also available for immediate download, so you can begin using it right away. Slidegeeks has done good research to ensure that you have everything you need to make your presentation stand out. Make a name out there for a brilliant performance.
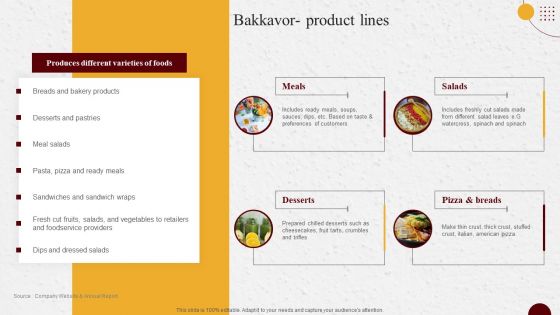
Industry Report Of Packaged Food Products Part 2 Bakkavor Product Lines Pictures PDF
This Industry Report Of Packaged Food Products Part 2 Bakkavor Product Lines Pictures PDF from Slidegeeks makes it easy to present information on your topic with precision. It provides customization options, so you can make changes to the colors, design, graphics, or any other component to create a unique layout. It is also available for immediate download, so you can begin using it right away. Slidegeeks has done good research to ensure that you have everything you need to make your presentation stand out. Make a name out there for a brilliant performance.
Difference Between Bitcoin Solana And Ethereum Blockchain Technology Icons PDF
The slides cover key distinction between the Bitcoin, Ethereum and Solana Blockchain Technology. The key differences are related to market value, usage, transaction speed and cost and uses in real life. Pitch your topic with ease and precision using this Difference Between Bitcoin Solana And Ethereum Blockchain Technology Icons PDF. This layout presents information on Crypto Currency, Transaction Time, Price, Market Value Equivalent. It is also available for immediate download and adjustment. So, changes can be made in the color, design, graphics or any other component to create a unique layout.
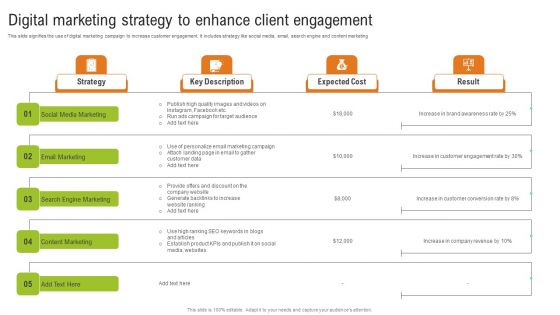
Digital Marketing Strategy To Enhance Client Engagement Portrait PDF
This slide signifies the use of digital marketing campaign to increase customer engagement. It includes strategy like social media, email, search engine and content marketing. Pitch your topic with ease and precision using this Digital Marketing Strategy To Enhance Client Engagement Portrait PDF. This layout presents information on Social Media Marketing, Email Marketing, Search Engine Marketing, Content Marketing. It is also available for immediate download and adjustment. So, changes can be made in the color, design, graphics or any other component to create a unique layout.
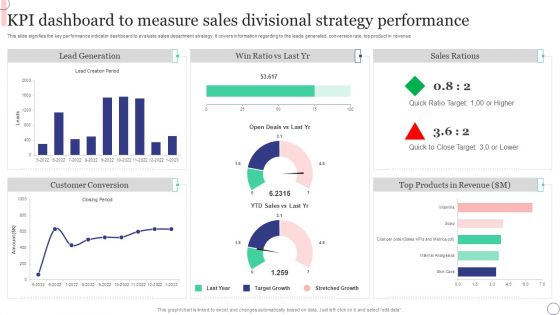
KPI Dashboard To Measure Sales Divisional Strategy Performance Microsoft PDF
This slide signifies the key performance indicator dashboard to evaluate sales department strategy. It covers information regarding to the leads generated, conversion rate, top product in revenue. Pitch your topic with ease and precision using this KPI Dashboard To Measure Sales Divisional Strategy Performance Microsoft PDF. This layout presents information on Sales Rations, Lead Generation, Customer Conversion. It is also available for immediate download and adjustment. So, changes can be made in the color, design, graphics or any other component to create a unique layout.

Implementing Cybersecurity Awareness Program To Prevent Attacks How Much Employees Are Aware Elements PDF
The purpose of this slide is to showcase the cyber security assessment test result. It covers information about the pass fail rate of employees who received the security awareness training and fail rate by age. If your project calls for a presentation, then Slidegeeks is your go to partner because we have professionally designed, easy to edit templates that are perfect for any presentation. After downloading, you can easily edit Implementing Cybersecurity Awareness Program To Prevent Attacks How Much Employees Are Aware Elements PDF and make the changes accordingly. You can rearrange slides or fill them with different images. Check out all the handy templates
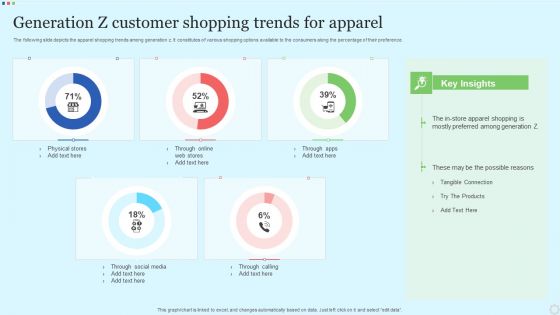
Generation Z Customer Shopping Trends For Apparel Designs PDF
The following slide depicts the apparel shopping trends among generation z. It constitutes of various shopping options available to the consumers along the percentage of their preference. Pitch your topic with ease and precision using this Generation Z Customer Shopping Trends For Apparel Designs PDF. This layout presents information on Physical Stores, Through Social Media, Through Calling. It is also available for immediate download and adjustment. So, changes can be made in the color, design, graphics or any other component to create a unique layout.
Lead Tracking Dashboard With Metric Comparison Brochure PDF
This slide showcases dashboard of lead pipeline that can help to identify total number of leads generated and expenses incurred to acquire the audience. It also showcases other key performance metrics like lead breakdown by status and number of leads per month. Pitch your topic with ease and precision using this Lead Tracking Dashboard With Metric Comparison Brochure PDF. This layout presents information on Metric Comparison, Lead Pipeline, Lead Breakdown Status. It is also available for immediate download and adjustment. So, changes can be made in the color, design, graphics or any other component to create a unique layout.
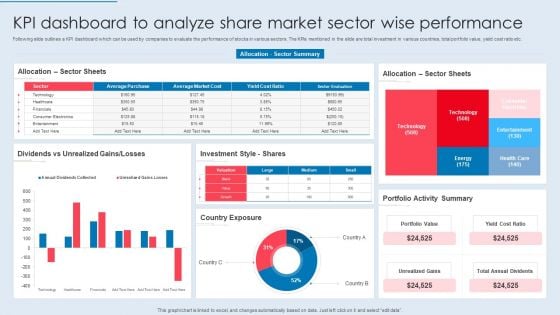
KPI Dashboard To Analyze Share Market Sector Wise Performance Summary PDF
Following slide outlines a KPI dashboard which can be used by companies to evaluate the performance of stocks in various sectors. The KPIs mentioned in the slide are total investment in various countries, total portfolio value, yield cost ratio etc. Pitch your topic with ease and precision using this KPI Dashboard To Analyze Share Market Sector Wise Performance Summary PDF. This layout presents information on Sector Sheets, Dividends Vs Unrealized, Investment Style. It is also available for immediate download and adjustment. So, changes can be made in the color, design, graphics or any other component to create a unique layout.
Share Portfolio Tracking Sheet To Analyze Market Indices Themes PDF
Following slide showcases portfolio tracking sheet to analyze stock market performance. This slide provides information about total number of shares purchased, price at which share bought, total cost, current market value of share, etc. Pitch your topic with ease and precision using this Share Portfolio Tracking Sheet To Analyze Market Indices Themes PDF. This layout presents information on Share Portfolio, Tracking Sheet, Market Indices. It is also available for immediate download and adjustment. So, changes can be made in the color, design, graphics or any other component to create a unique layout.
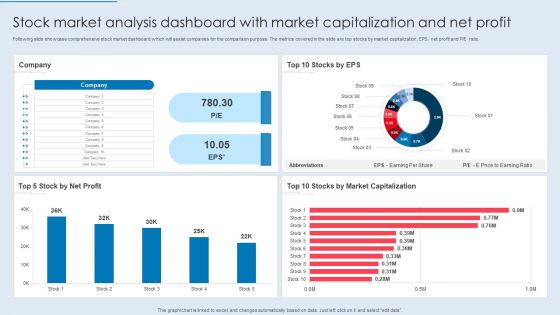
Stock Market Analysis Dashboard With Market Capitalization And Net Profit Elements PDF
Following slide showcase comprehensive stock market dashboard which will assist companies for the comparison purpose. The metrics covered in the slide are top stocks by market capitalization, EPS, net profit and PE ratio. Pitch your topic with ease and precision using this Stock Market Analysis Dashboard With Market Capitalization And Net Profit Elements PDF. This layout presents information on Company, Net Profit, Market Capitalization. It is also available for immediate download and adjustment. So, changes can be made in the color, design, graphics or any other component to create a unique layout.
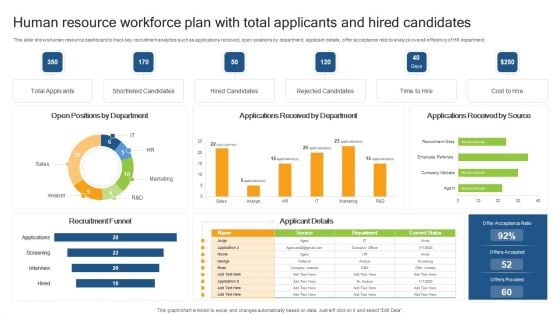
Human Resource Workforce Plan With Total Applicants And Hired Candidates Clipart PDF
This slide shows human resource dashboard to track key recruitment analytics such as applications received, open positions by department, applicant details, offer acceptance ratio to analyze overall efficiency of HR department. Pitch your topic with ease and precision using this Human Resource Workforce Plan With Total Applicants And Hired Candidates Clipart PDF. This layout presents information on Total Applicants, Shortlisted Candidates, Recruitment Funnel. It is also available for immediate download and adjustment. So, changes can be made in the color, design, graphics or any other component to create a unique layout.
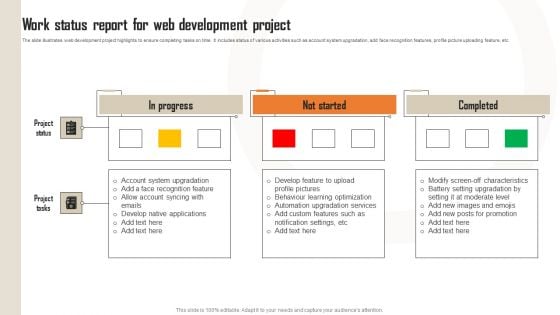
Work Status Report For Web Development Project Template PDF
The slide illustrates web development project highlights to ensure completing tasks on time. It includes status of various activities such as account system upgradation, add face recognition features, profile picture uploading feature, etc. Pitch your topic with ease and precision using this Work Status Report For Web Development Project Template PDF. This layout presents information on Develop, Optimization, Services. It is also available for immediate download and adjustment. So, changes can be made in the color, design, graphics or any other component to create a unique layout.
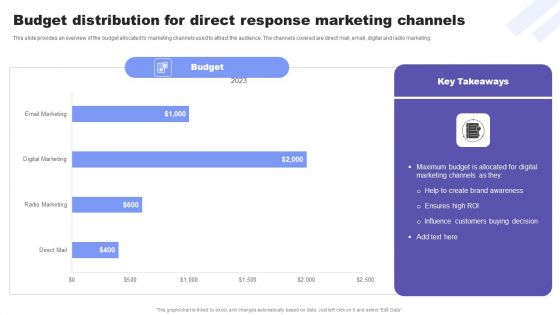
Direct Response Marketing Guide Ultimate Success Budget Distribution For Direct Sample PDF
This slide provides an overview of the budget allocated to marketing channels used to attract the audience. The channels covered are direct mail, email, digital and radio marketing. If your project calls for a presentation, then Slidegeeks is your go-to partner because we have professionally designed, easy-to-edit templates that are perfect for any presentation. After downloading, you can easily edit Direct Response Marketing Guide Ultimate Success Budget Distribution For Direct Sample PDF and make the changes accordingly. You can rearrange slides or fill them with different images. Check out all the handy templates

Cost Breakdown For Conducting Marketing Research Formats PDF
This slide covers cost breakdown for conducting market research more efficiently. It involves key elements such as reporting, project initiation, research design, field work and data analysis. If your project calls for a presentation, then Slidegeeks is your go-to partner because we have professionally designed, easy-to-edit templates that are perfect for any presentation. After downloading, you can easily edit Cost Breakdown For Conducting Marketing Research Formats PDF and make the changes accordingly. You can rearrange slides or fill them with different images. Check out all the handy templates
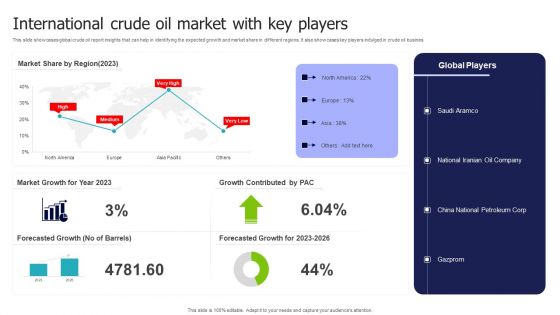
International Crude Oil Market With Key Players Demonstration PDF
This slide showcases global crude oil report insights that can help in identifying the expected growth and market share in different regions. It also showcases key players indulged in crude oil busines. Pitch your topic with ease and precision using this International Crude Oil Market With Key Players Demonstration PDF. This layout presents information on Market Share, Market Growth, Growth Contributed . It is also available for immediate download and adjustment. So, changes can be made in the color, design, graphics or any other component to create a unique layout.
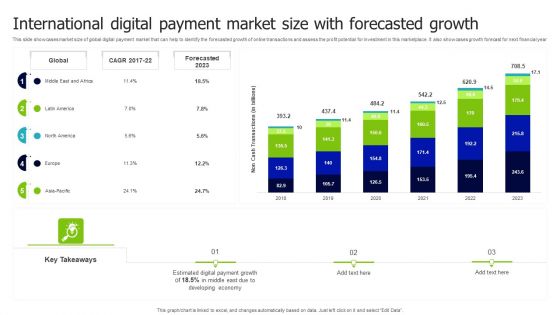
International Digital Payment Market Size With Forecasted Growth Inspiration PDF
This slide showcases market size of global digital payment market that can help to identify the forecasted growth of online transactions and assess the profit potential for investment in this marketplace. It also showcases growth forecast for next financial year. Pitch your topic with ease and precision using this International Digital Payment Market Size With Forecasted Growth Inspiration PDF. This layout presents information on Global, Forecasted, Growth. It is also available for immediate download and adjustment. So, changes can be made in the color, design, graphics or any other component to create a unique layout.
Comparative Analysis For Manual And Automation Testing Lifecycle Icons PDF
This slide showcases graphical report to compare test expenses from manual and automated testing cycles over the years. It further includes details about benefits that can be derived from test automation cycle. Pitch your topic with ease and precision using this Comparative Analysis For Manual And Automation Testing Lifecycle Icons PDF. This layout presents information on Comparative Analysis For Manual, Automation Testing Lifecycle. It is also available for immediate download and adjustment. So, changes can be made in the color, design, graphics or any other component to create a unique layout.
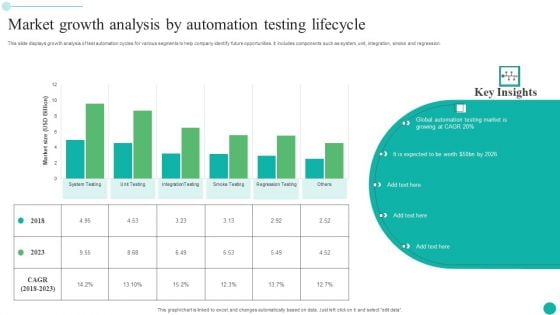
Market Growth Analysis By Automation Testing Lifecycle Themes PDF
This slide displays growth analysis of test automation cycles for various segments to help company identify future opportunities. It includes components such as system, unit, integration, smoke and regression. Pitch your topic with ease and precision using this Market Growth Analysis By Automation Testing Lifecycle Themes PDF. This layout presents information on Market Growth Analysis, Automation Testing Lifecycle. It is also available for immediate download and adjustment. So, changes can be made in the color, design, graphics or any other component to create a unique layout.
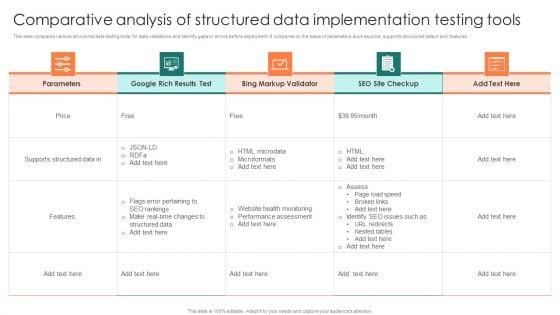
Comparative Analysis Of Structured Data Implementation Testing Tools Topics PDF
This slide compares various structured data testing tools for data validations and identify gaps or errors before deployment. It compares on the basis of parameters such as price, supports structured data in and features. Pitch your topic with ease and precision using this Comparative Analysis Of Structured Data Implementation Testing Tools Topics PDF. This layout presents information on Parameters, Google Rich Results Test, Bing Markup Validator, Seo Site Checkup. It is also available for immediate download and adjustment. So, changes can be made in the color, design, graphics or any other component to create a unique layout.
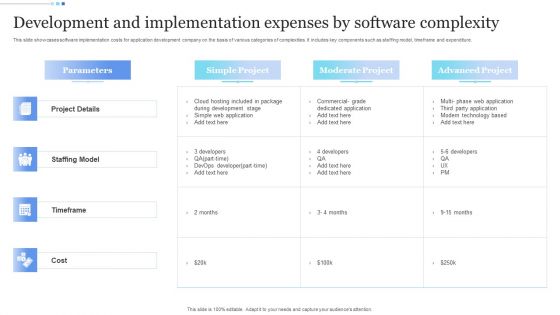
Development And Implementation Expenses By Software Complexity Clipart PDF
This slide showcases software implementation costs for application development company on the basis of various categories of complexities. It includes key components such as staffing model, timeframe and expenditure. Pitch your topic with ease and precision using this Development And Implementation Expenses By Software Complexity Clipart PDF. This layout presents information on Project Details, Staffing Model, Timeframe, Cost. It is also available for immediate download and adjustment. So, changes can be made in the color, design, graphics or any other component to create a unique layout.
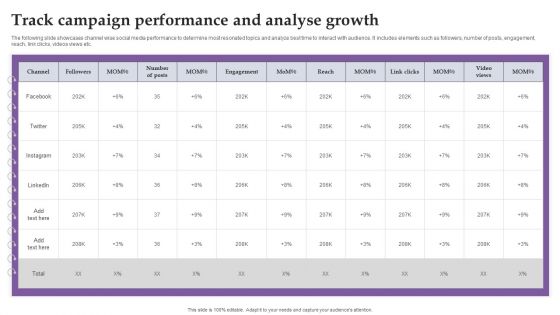
Track Campaign Performance And Analyse Growth Ppt Pictures Graphic Tips PDF
The following slide showcases channel wise social media performance to determine most resonated topics and analyze best time to interact with audience. It includes elements such as followers, number of posts, engagement, reach, link clicks, videos views etc. If your project calls for a presentation, then Slidegeeks is your go-to partner because we have professionally designed, easy-to-edit templates that are perfect for any presentation. After downloading, you can easily edit Track Campaign Performance And Analyse Growth Ppt Pictures Graphic Tips PDF and make the changes accordingly. You can rearrange slides or fill them with different images. Check out all the handy templates
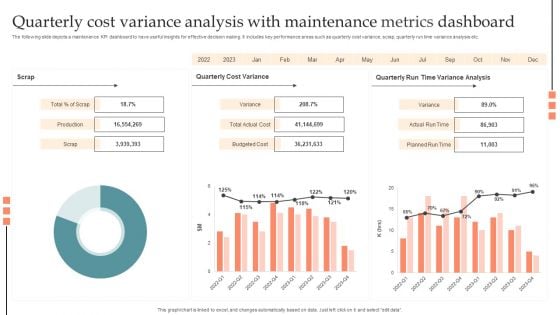
Quarterly Cost Variance Analysis With Maintenance Metrics Dashboard Information PDF
The following slide depicts a maintenance KPI dashboard to have useful insights for effective decision making. It includes key performance areas such as quarterly cost variance, scrap, quarterly run time variance analysis etc. Pitch your topic with ease and precision using this Quarterly Cost Variance Analysis With Maintenance Metrics Dashboard Information PDF. This layout presents information on Production, Budgeted Cost, Planned Run Time, Actual Run Time. It is also available for immediate download and adjustment. So, changes can be made in the color, design, graphics or any other component to create a unique layout.

Market Survey Evaluation Tools Comparison Summary PDF
This slide present a comparison between various tools used for analyzing results from market survey questionnaire. It highlights various tools, features, free trial period, pricing and rating. Pitch your topic with ease and precision using this Market Survey Evaluation Tools Comparison Summary PDF. This layout presents information on Various Tools, Features, Free Trial Period, Pricing And Rating. It is also available for immediate download and adjustment. So, changes can be made in the color, design, graphics or any other component to create a unique layout.
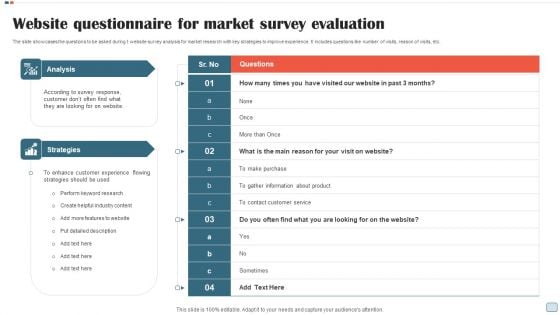
Website Questionnaire For Market Survey Evaluation Diagrams PDF
The slide showcases the questions to be asked during t website survey analysis for market research with key strategies to improve experience. It includes questions like number of visits, reason of visits, etc. Pitch your topic with ease and precision using this Website Questionnaire For Market Survey Evaluation Diagrams PDF. This layout presents information on Analysis, Survey Response, Strategies, Perform, Industry Content. It is also available for immediate download and adjustment. So, changes can be made in the color, design, graphics or any other component to create a unique layout.
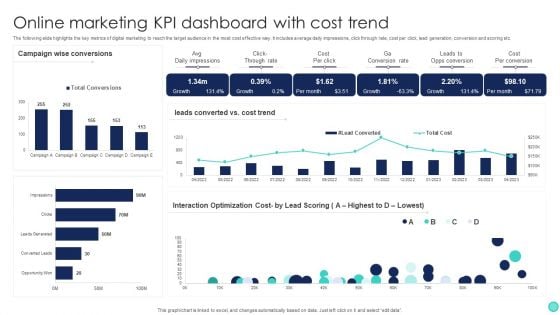
Online Marketing KPI Dashboard With Cost Trend Slides PDF
The following slide highlights the key metrics of digital marketing to reach the target audience in the most cost effective way. It includes average daily impressions, click through rate, cost per click, lead generation, conversion and scoring etc. Pitch your topic with ease and precision using this Online Marketing KPI Dashboard With Cost Trend Slides PDF. This layout presents information on Average Daily Impressions, Click Through Rate, Cost Per Click, Lead Generation, Conversion And Scoring. It is also available for immediate download and adjustment. So, changes can be made in the color, design, graphics or any other component to create a unique layout.
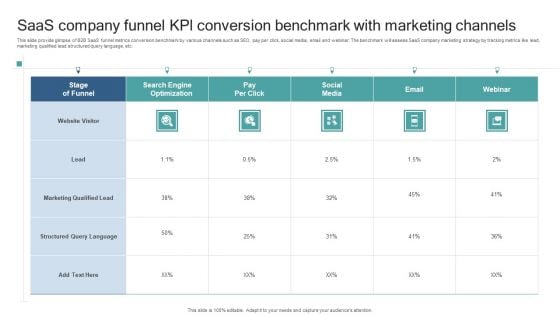
Saas Company Funnel Kpl Conversion Benchmark With Marketing Channels Slides PDF
This slide provide glimpse of B2B SaaS funnel metrics conversion benchmark by various channels such as SEO, pay per click, social media, email and webinar. The benchmark will assess SaaS company marketing strategy by tracking metrics like lead, marketing qualified lead structured query language, etc. Pitch your topic with ease and precision using this Saas Company Funnel Kpl Conversion Benchmark With Marketing Channels Slides PDF. This layout presents information on Search Engine Optimization, Pay Per Click, Social Media, Email, Webinar. It is also available for immediate download and adjustment. So, changes can be made in the color, design, graphics or any other component to create a unique layout.
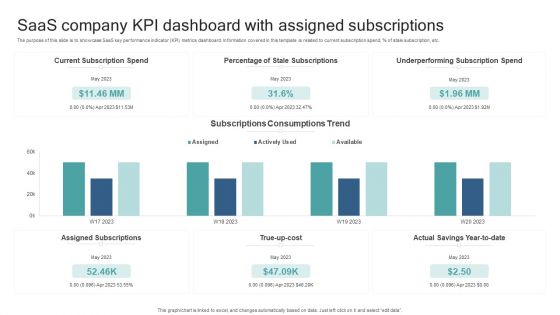
Saas Company KPI Dashboard With Assigned Subscriptions Formats PDF
The purpose of this slide is to showcase SaaS key performance indicator KPI metrics dashboard. Information covered in this template is related to current subscription spend, percent of stale subscription, etc. Pitch your topic with ease and precision using this Saas Company KPI Dashboard With Assigned Subscriptions Formats PDF. This layout presents information on Current Subscription Spend, Percentage Of Stale Subscriptions, True Up Cost, Underperforming Subscription Spend. It is also available for immediate download and adjustment. So, changes can be made in the color, design, graphics or any other component to create a unique layout.
IT Checklist For Successful Implementation Of Software Requirement Parameters Icons PDF
This slide signifies the information technology checklist for implementation of application requirement specification. It covers various questions related to the strategies that are either implemented in an organisation for growth. Pitch your topic with ease and precision using this IT Checklist For Successful Implementation Of Software Requirement Parameters Icons PDF. This layout presents information on Performance, Capabilities, Systematic, Graphic. It is also available for immediate download and adjustment. So, changes can be made in the color, design, graphics or any other component to create a unique layout.

Quarterly Timeline For New Product Launch Work Strategy Diagrams PDF
Following slides contains quarterly work plan for new product launch to gain competitive advantage. It includes three phases such as planning phase, sales phase and product marketing phase. Pitch your topic with ease and precision using this Quarterly Timeline For New Product Launch Work Strategy Diagrams PDF. This layout presents information on Planning Phase, Sales Phase, Product Marketing Phase. It is also available for immediate download and adjustment. So, changes can be made in the color, design, graphics or any other component to create a unique layout.
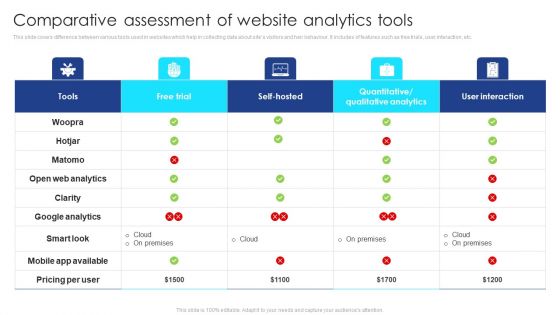
Comparative Assessment Of Website Analytics Tools Infographics PDF
This slide covers difference between various tools used in websites which help in collecting data about sites visitors and heir behaviour. It includes of features such as free trials, user interaction, etc. Pitch your topic with ease and precision using this Comparative Assessment Of Website Analytics Tools Infographics PDF. This layout presents information on Tools, Free Trial, Self-Hosted, Quantitative Or Qualitative Analytics, User Interaction. It is also available for immediate download and adjustment. So, changes can be made in the color, design, graphics or any other component to create a unique layout.
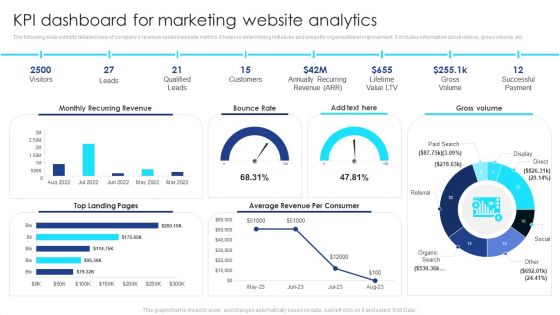
KPI Dashboard For Marketing Website Analytics Summary PDF
The following slide exhibits detailed view of companys revenue-related website metrics. It helps in determining initiatives and areas for organisational improvement. It includes information about visitors, gross volume, etc. Pitch your topic with ease and precision using this KPI Dashboard For Marketing Website Analytics Summary PDF. This layout presents information on Visitors, Leads, Qualified Leads, Customers, Gross Volume, Successful Payment. It is also available for immediate download and adjustment. So, changes can be made in the color, design, graphics or any other component to create a unique layout.
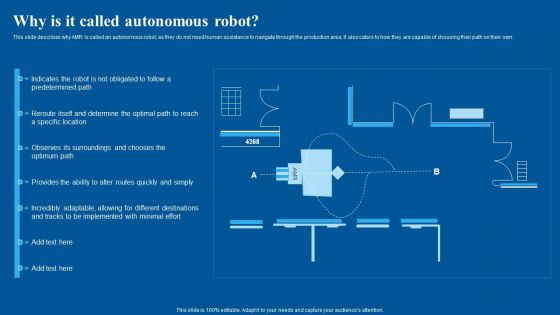
Why Is IT Called Autonomous Robot Brochure PDF
This slide describes why AMR is called an autonomous robot, as they do not need human assistance to navigate through the production area. It also caters to how they are capable of choosing their path on their own. If your project calls for a presentation, then Slidegeeks is your go to partner because we have professionally designed, easy to edit templates that are perfect for any presentation. After downloading, you can easily edit Why Is IT Called Autonomous Robot Brochure PDF and make the changes accordingly. You can rearrange slides or fill them with different images. Check out all the handy templates.
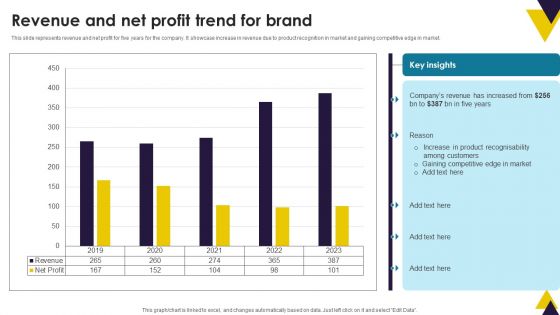
Developing Brand Identity Culture Through Branding Revenue And Net Profit Trend For Brand Brochure PDF
This slide represents revenue and net profit for five years for the company. It showcase increase in revenue due to product recognition in market and gaining competitive edge in market. If your project calls for a presentation, then Slidegeeks is your go to partner because we have professionally designed, easy to edit templates that are perfect for any presentation. After downloading, you can easily edit Developing Brand Identity Culture Through Branding Revenue And Net Profit Trend For Brand Brochure PDF and make the changes accordingly. You can rearrange slides or fill them with different images. Check out all the handy templates
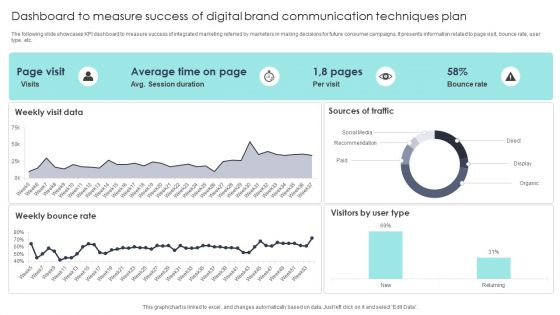
Dashboard To Measure Success Of Digital Brand Communication Techniques Plan Themes PDF
The following slide showcases KPI dashboard to measure success of integrated marketing referred by marketers in making decisions for future consumer campaigns. It presents information related to page visit, bounce rate, user type, etc. Pitch your topic with ease and precision using this Dashboard To Measure Success Of Digital Brand Communication Techniques Plan Themes PDF. This layout presents information on Sources Of Traffic, Social Media, Brand Communication Techniques Plan. It is also available for immediate download and adjustment. So, changes can be made in the color, design, graphics or any other component to create a unique layout.
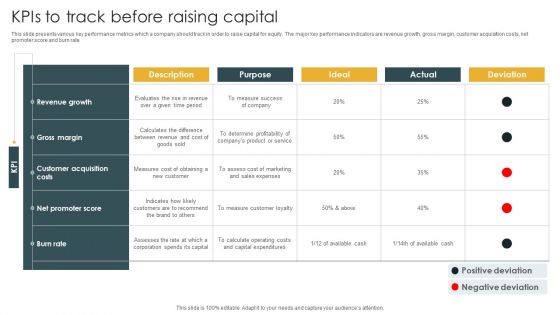
Kpis To Track Before Raising Capital Portrait PDF
This slide presents various key performance metrics which a company should track in order to raise capital for equity. The major key performance indicators are revenue growth, gross margin, customer acquisition costs, net promoter score and burn rate. Pitch your topic with ease and precision using this Kpis To Track Before Raising Capital Portrait PDF. This layout presents information on Net Promoter Score, Customer Acquisition Costs, Gross Margin. It is also available for immediate download and adjustment. So, changes can be made in the color, design, graphics or any other component to create a unique layout.
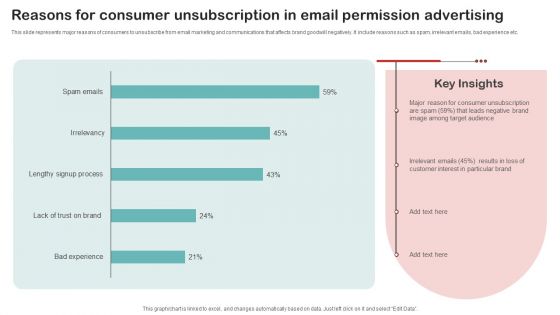
Reasons For Consumer Unsubscription In Email Permission Advertising Diagrams PDF
This slide represents major reasons of consumers to unsubscribe from email marketing and communications that affects brand goodwill negatively. It include reasons such as spam, irrelevant emails, bad experience etc. Pitch your topic with ease and precision using this Reasons For Consumer Unsubscription In Email Permission Advertising Diagrams PDF. This layout presents information on Irrelevant Emails, Customer Interest, Target Audience. It is also available for immediate download and adjustment. So, changes can be made in the color, design, graphics or any other component to create a unique layout.
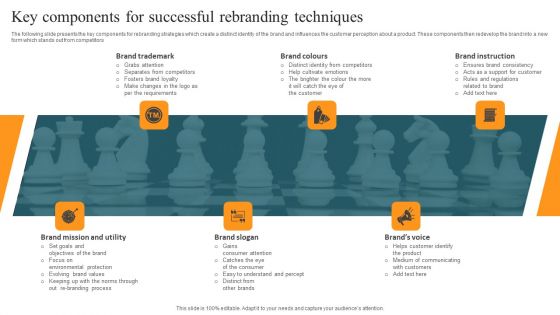
Key Components For Successful Rebranding Techniques Infographics PDF
The following slide presents the key components for rebranding strategies which create a distinct identity of the brand and influences the customer perception about a product. These components then redevelop the brand into a new form which stands out from competitors. Pitch your topic with ease and precision using this Key Components For Successful Rebranding Techniques Infographics PDF. This layout presents information on Brand Trademark, Brand Instruction, Brand Mission And Utility. It is also available for immediate download and adjustment. So, changes can be made in the color, design, graphics or any other component to create a unique layout.
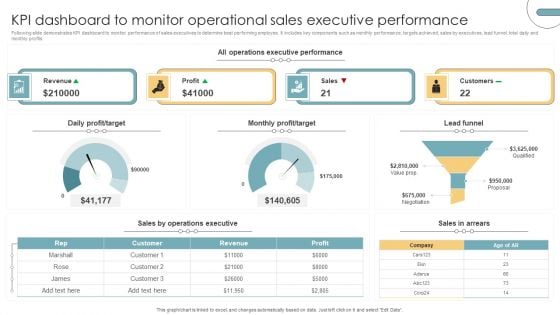
KPI Dashboard To Monitor Operational Sales Executive Performance Portrait PDF
Following slide demonstrates KPI dashboard to monitor performance of sales executives to determine best performing employee. It includes key components such as monthly performance, targets achieved, sales by executives, lead funnel, total daily and monthly profits. Pitch your topic with ease and precision using this KPI Dashboard To Monitor Operational Sales Executive Performance Portrait PDF. This layout presents information on Revenue, Profit, Sales, Customers. It is also available for immediate download and adjustment. So, changes can be made in the color, design, graphics or any other component to create a unique layout.


 Continue with Email

 Home
Home


