Organization Icon
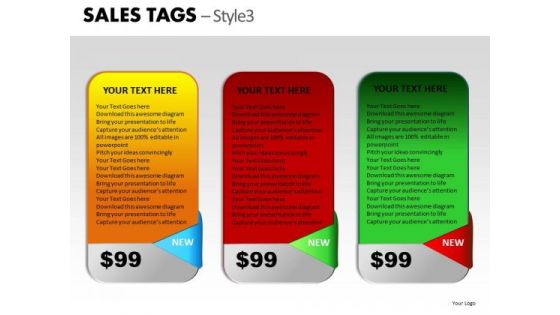
Prices Sales Tags PowerPoint Slides And Ppt Diagram Templates
Prices Sales Tags PowerPoint Slides And PPT Diagram Templates-These high quality, editable pre-designed powerpoint slides have been carefully created by our professional team to help you impress your audience. Each graphic in every slide is vector based and is 100% editable in powerpoint. Each and every property of any slide - color, size, shading etc can be modified to build an effective powerpoint presentation. Use these slides to convey complex business concepts in a simplified manner. Any text can be entered at any point in the powerpoint slide. Simply DOWNLOAD, TYPE and PRESENT! Edit plans with our Prices Sales Tags PowerPoint Slides And Ppt Diagram Templates. Download without worries with our money back guaranteee.
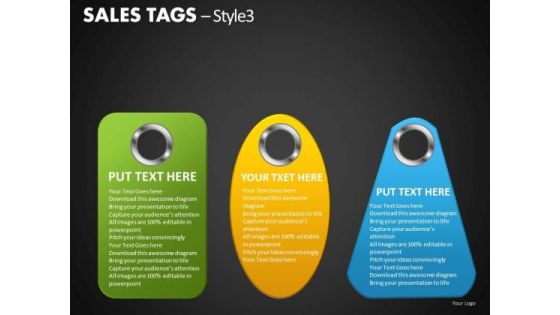
Sales And Marketing Tags PowerPoint Slides And Ppt Diagram Templates
Sales and Marketing Tags PowerPoint Slides And PPT Diagram Templates-These high quality, editable pre-designed powerpoint slides have been carefully created by our professional team to help you impress your audience. Each graphic in every slide is vector based and is 100% editable in powerpoint. Each and every property of any slide - color, size, shading etc can be modified to build an effective powerpoint presentation. Use these slides to convey complex business concepts in a simplified manner. Any text can be entered at any point in the powerpoint slide. Simply DOWNLOAD, TYPE and PRESENT! Classify goals with our Sales And Marketing Tags PowerPoint Slides And Ppt Diagram Templates. Download without worries with our money back guaranteee.
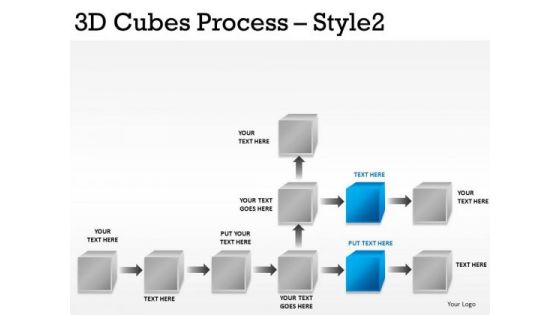
PowerPoint Flowchart Diagram With 3d Cubes Editable Ppt Slides
PowerPoint Flowchart Diagram with 3D Cubes Editable PPT Slides-These high quality, editable pre-designed powerpoint slides have been carefully created by our professional team to help you impress your audience. Each graphic in every slide is vector based and is 100% editable in powerpoint. Each and every property of any slide - color, size, shading etc can be modified to build an effective powerpoint presentation. Use these slides to convey complex business concepts in a simplified manner. Any text can be entered at any point in the powerpoint slide. Simply DOWNLOAD, TYPE and PRESENT! Guide your team to victory with our PowerPoint Flowchart Diagram With 3d Cubes Editable Ppt Slides. Try us out and see what a difference our templates make.
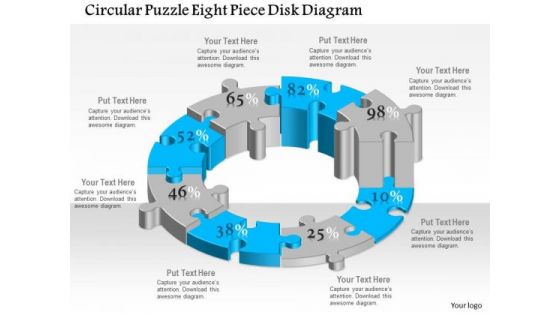
Business Diagram Circular Puzzle Eight Piece Disk Diagram Presentation Template
This business plan power point template has been designed with six staged circular puzzle diagram. This diagram template contains the concept of business process flow and result analysis representation. Use this diagram in your presentation and show these concepts.
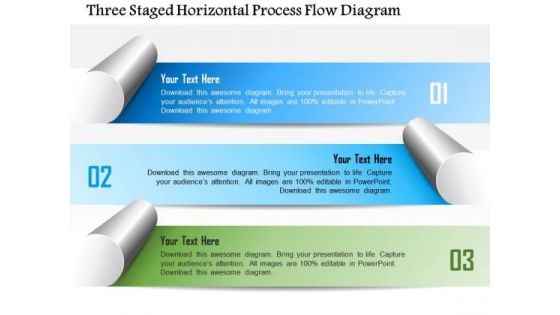
Business Diagram Three Staged Horizontal Process Flow Diagram Presentation Template
This business slide displays three staged horizontal process flow diagram. This diagram is useful for data display. Use this colorful diagram to depict three steps of any business process. It helps in clearly conveying your message to clients and audience.
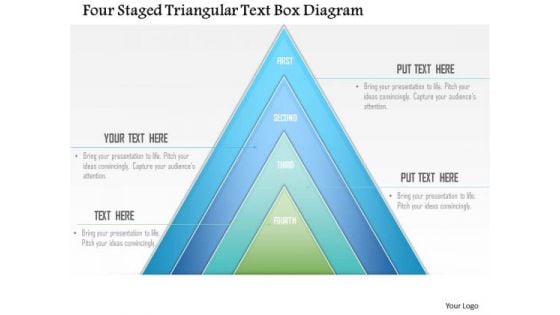
Business Diagram Four Staged Triangular Text Box Diagram Presentation Template
Four staged triangular design text boxes are used to design this business diagram. Download this diagram to display business information in an impressive manner. Use this innovative diagram slide to build exclusive presentation.
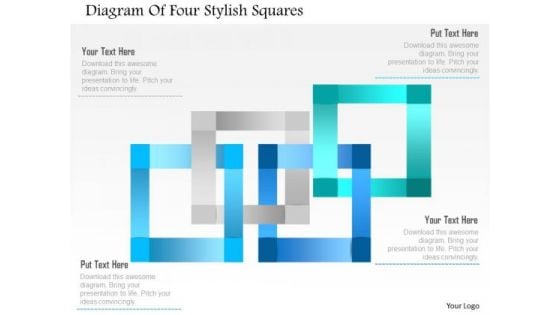
Business Diagram Diagram Of Four Stylish Squares Presentation Template
four stylish squares has been used to design this business diagram. Display four business options in visual manner with this diagram. Download this diagram slide to make professional presentations.
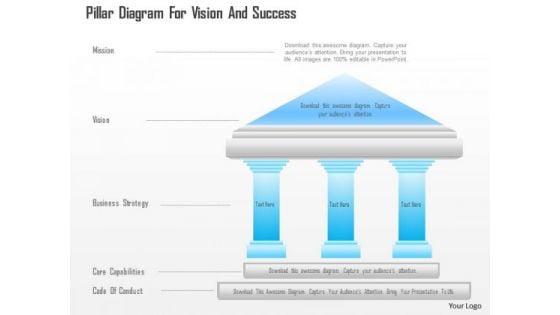
Business Diagram Pillar Diagram For Vision And Success Presentation Template
Graphic of pillar diagram has been used to design this business diagram. This diagram depicts the concept of vision and success. Use this slide for business and marketing related presentations.
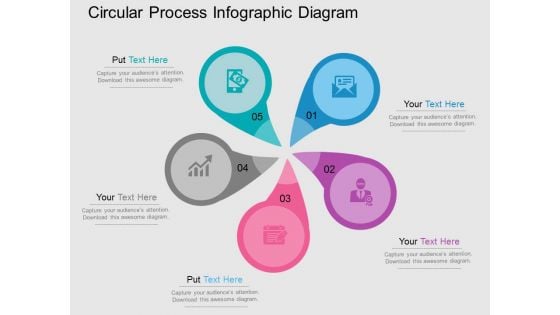
Circular Process Infographic Diagram Powerpoint Templates
Our above business diagram has been designed with circular process info graphic. This slide is suitable to present business processes. Use this business diagram to present your work in a more smart and precise manner.
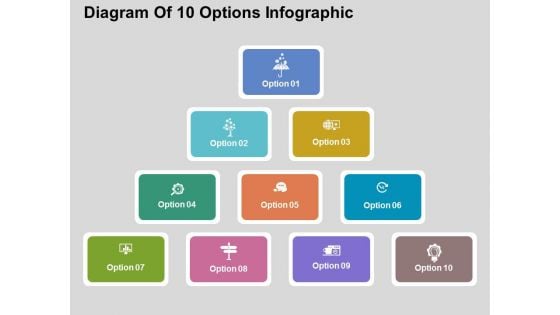
Diagram Of 10 Options Infographic Powerpoint Templates
Flowchart of 10 business options has been displayed in this business slide. This business diagram helps to exhibit concepts of strategy, planning, communication, management and analysis. Use this diagram to build an exclusive presentation.
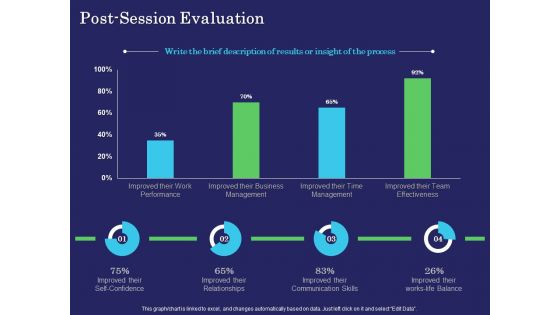
Business Coaching Post Session Evaluation Ppt PowerPoint Presentation Infographics Graphics PDF
Presenting this set of slides with name business coaching post session evaluation ppt powerpoint presentation infographics graphics pdf. The topics discussed in these slides are improved their work performance, improved their business management, improved their time management, improved their team effectiveness. This is a completely editable PowerPoint presentation and is available for immediate download. Download now and impress your audience.
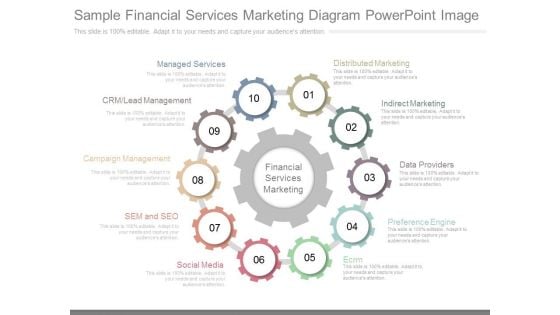
Sample Financial Services Marketing Diagram Powerpoint Image
This is a sample financial services marketing diagram powerpoint image. This is a ten stage process. The stages in this process are distributed marketing, indirect marketing, data providers, preference engine, ecrm, social media, sem and seo, campaign management, crm lead management, managed services.
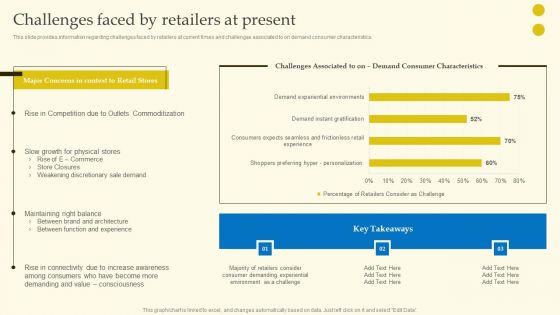
Experiential Shopping Outlet Overview Challenges Faced By Retailers At Present Information PDF
This slide provides information regarding challenges faced by retailers at current times and challenges associated to on demand consumer characteristics. Are you in need of a template that can accommodate all of your creative concepts This one is crafted professionally and can be altered to fit any style. Use it with Google Slides or PowerPoint. Include striking photographs, symbols, depictions, and other visuals. Fill, move around, or remove text boxes as desired. Test out color palettes and font mixtures. Edit and save your work, or work with colleagues. Download Experiential Shopping Outlet Overview Challenges Faced By Retailers At Present Information PDF and observe how to make your presentation outstanding. Give an impeccable presentation to your group and make your presentation unforgettable.
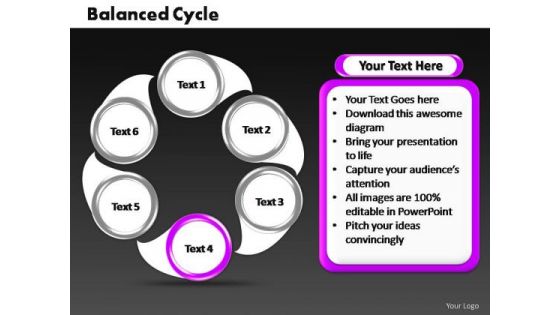
PowerPoint Presentation Chart Cycle Process Ppt Template
PowerPoint Presentation Chart Cycle Process PPT Template-In a cycle diagram, you can explain the main events in the cycle, how they interact, and how the cycle repeats. These Diagrams can be used to interact visually and logically with audiences. Use this graphic to represent a continuing sequence of stages, tasks, or events in a circular flow and emphasize the connection between all components.-PowerPoint Presentation Chart Cycle Process PPT Template Develop their craving for your creativity. Become a brand name with our PowerPoint Presentation Chart Cycle Process Ppt Template.
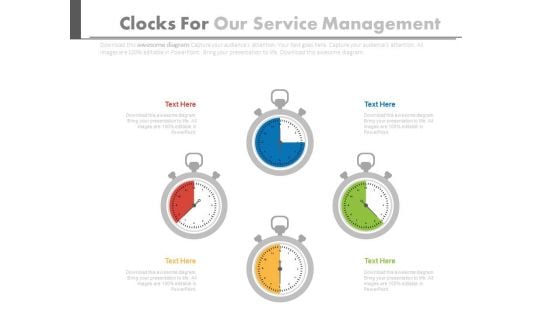
Four Stopwatches In Pie Chart Style Powerpoint Slides
This PPT slide has been designed with graphics of four stop watches in pie chart style. You may sue this PowerPoint template for time management. This dashboard slide may useful for multilevel status report creation and approval process.
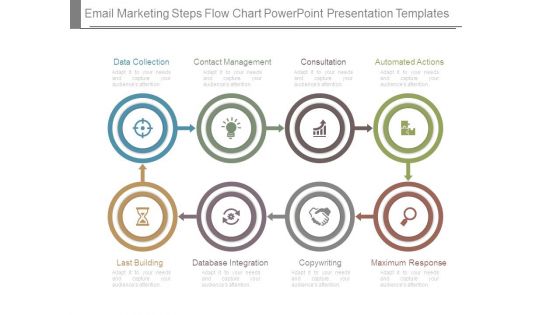
Email Marketing Steps Flow Chart Powerpoint Presentation Templates
This is a email marketing steps flow chart powerpoint presentation templates. This is a eight stage process. The stages in this process are data collection, contact management, consultation, automated actions, last building, database integration, copywriting, maximum response.
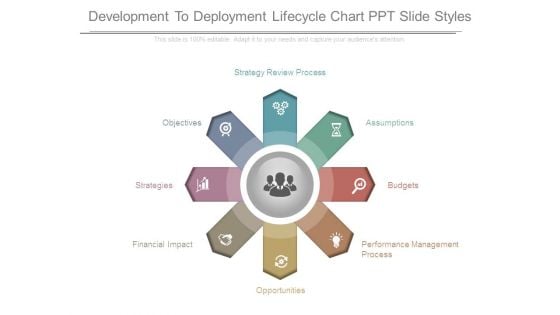
Development To Deployment Lifecycle Chart Ppt Slide Styles
This is a development to deployment lifecycle chart ppt slide styles. This is a eight stage process. The stages in this process are performance management process, opportunities, financial impact, strategies, objectives, strategy review process, assumptions, budgets.
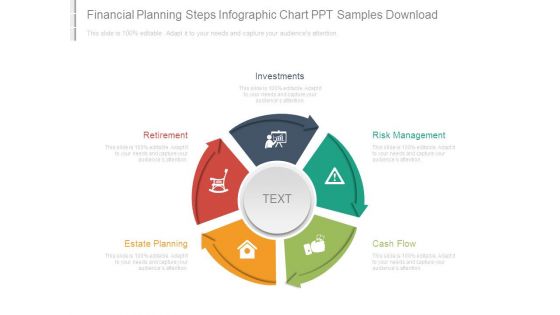
Financial Planning Steps Infographic Chart Ppt Samples Download
This is a financial planning steps infographic chart ppt samples download. This is a five stage process. The stages in this process are investments, retirement, estate planning, risk management, cash flow.
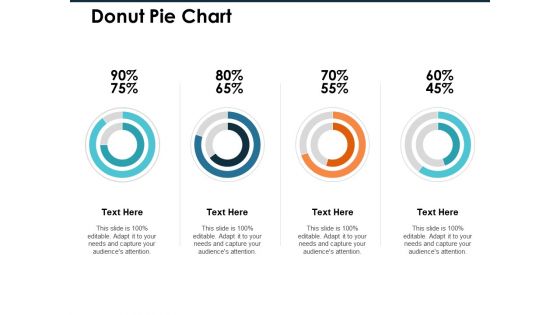
Donut Pie Chart Ppt PowerPoint Presentation Infographic Template Professional
This is a donut pie chart ppt powerpoint presentation infographic template professional. This is a four stage process. The stages in this process are finance, marketing, management, investment, analysis.
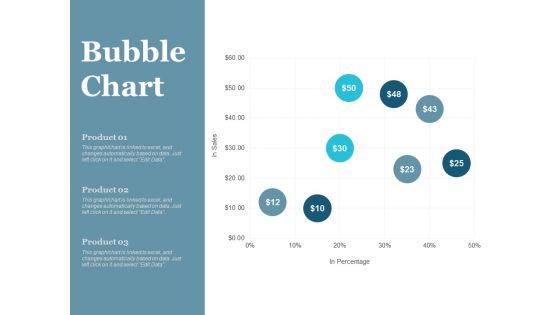
Bubble Chart Finance Ppt PowerPoint Presentation File Master Slide
This is a bubble chart finance ppt powerpoint presentation file master slide. This is a three stage process. The stages in this process are finance, marketing, management, investment, analysis.
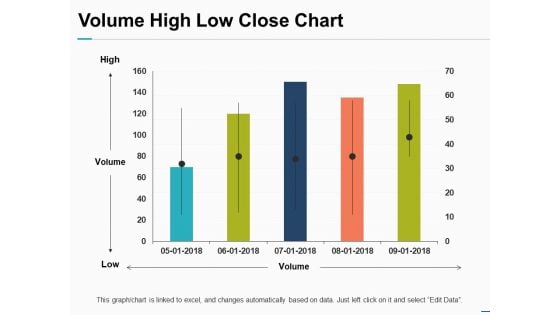
Volume High Low Close Chart Ppt PowerPoint Presentation Pictures Objects
This is a volume high low close chart ppt powerpoint presentation pictures objects. This is a one stage process. The stages in this process are finance, marketing, management, investment, analysis.
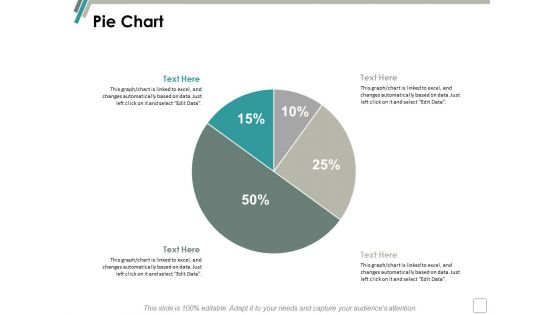
Pie Chart Finance Marketing Ppt Powerpoint Presentation Infographics Background
This is a pie chart finance marketing ppt powerpoint presentation infographics background. This is a two stage process. The stages in this process are finance, marketing, management, investment, analysis.
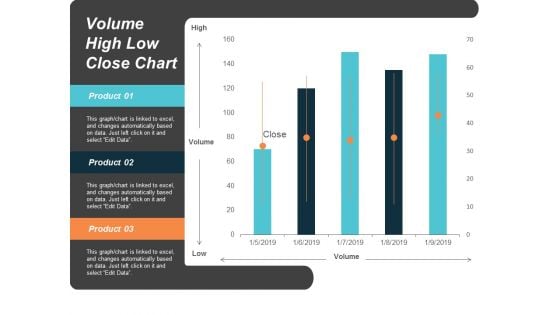
Volume High Low Close Chart Ppt Powerpoint Presentation Slides Images
This is a volume high low close chart ppt powerpoint presentation slides images. This is a five stage process. The stages in this process are finance, marketing, management, investment, analysis.

Area Chart Finance Marketing Ppt Powerpoint Presentation Gallery Slides
This is a area chart finance marketing ppt powerpoint presentation gallery slides. This is a three stage process. The stages in this process are finance, marketing, management, investment, analysis.
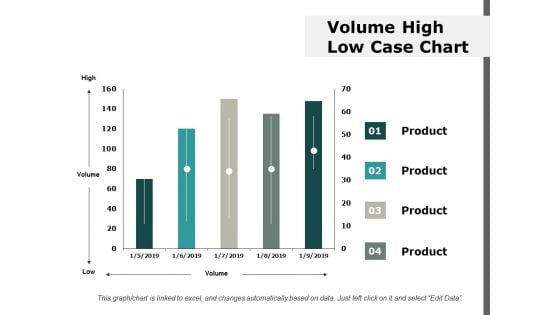
Volume High Low Case Chart Ppt Powerpoint Presentation Ideas Information
This is a volume high low case chart ppt powerpoint presentation ideas information. This is a four stage process. The stages in this process are finance, marketing, management, investment, analysis.
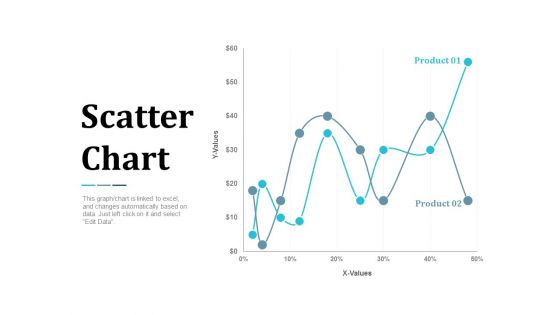
Scatter Chart Analysis Marketing Ppt Powerpoint Presentation Summary Infographic Template
This is a scatter chart analysis marketing ppt powerpoint presentation summary infographic template. This is a two stage process. The stages in this process are finance, marketing, management, investment, analysis.
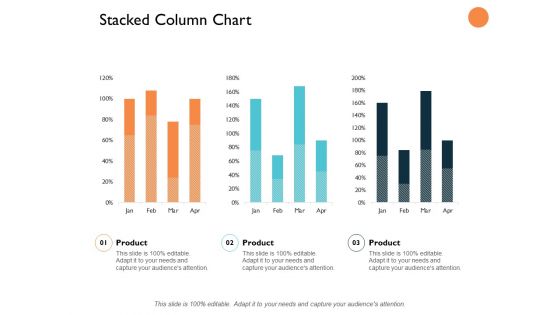
Stacked Column Chart Analysis Ppt PowerPoint Presentation Slides Graphics Design
This is a stacked column chart analysis ppt powerpoint presentation slides graphics design. This is a three stage process. The stages in this process are finance, marketing, management, investment, analysis.
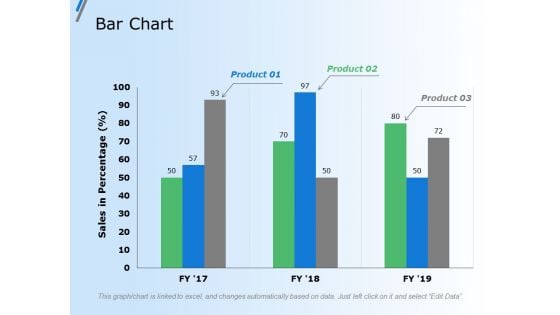
Bar Chart Finance Marketing Ppt Powerpoint Presentation Gallery Grid
This is a bar chart finance marketing ppt powerpoint presentation gallery grid. This is a three stage process. The stages in this process are finance, marketing, management, investment, analysis.
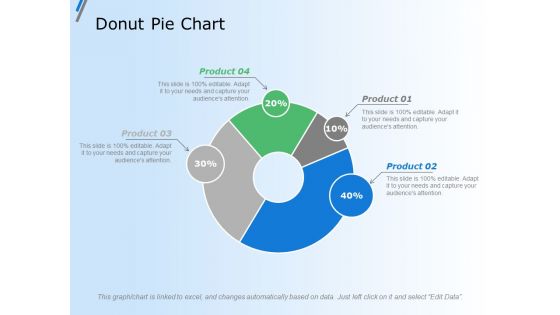
Donut Pie Chart Finance Ppt Powerpoint Presentation Outline Vector
This is a donut pie chart finance ppt powerpoint presentation outline vector. This is a four stage process. The stages in this process are finance, marketing, management, investment, analysis.

Pie Chart Finance Ppt Powerpoint Presentation Layouts Design Ideas
This is a pie chart finance ppt powerpoint presentation layouts design ideas. This is a four stage process. The stages in this process are finance, marketing, management, investment, analysis.
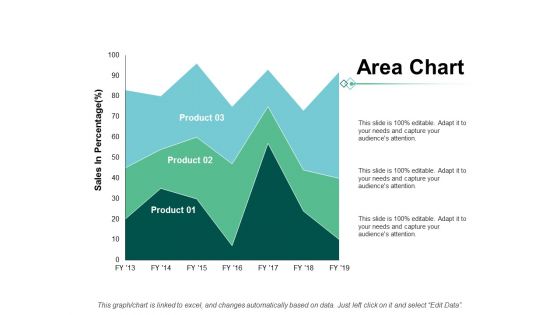
Area Chart Finance Marketing Ppt Powerpoint Presentation Show Grid
This is a area chart finance marketing ppt powerpoint presentation show grid. This is a three stage process. The stages in this process are finance, marketing, management, investment, analysis.
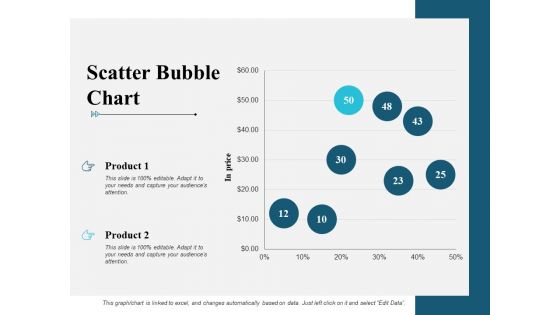
Scatter Bubble Chart Graph Ppt PowerPoint Presentation Infographic Template Maker
This is a scatter bubble chart graph ppt powerpoint presentation infographic template maker. This is a two stage process. The stages in this process are finance, marketing, management, investment, analysis.
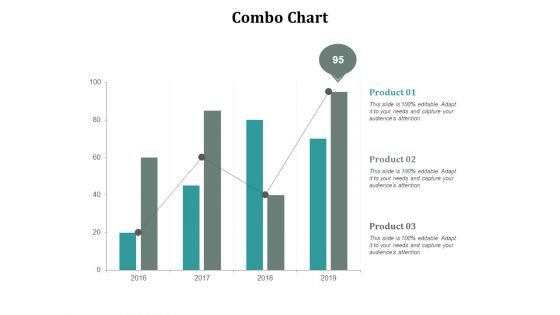
Combo Chart Marketing Ppt Powerpoint Presentation Ideas Format Ideas Cpb
This is a combo chart marketing ppt powerpoint presentation ideas format ideas cpb. This is a three stage process. The stages in this process are finance, marketing, management, investment, analysis.
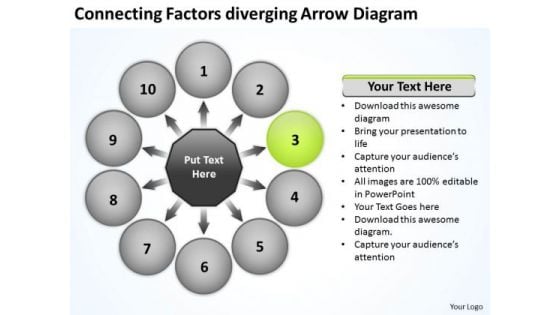
Connecting Factors Diverging Arrow Diagram Ppt Circular Process Network PowerPoint Templates
We present our connecting factors diverging arrow diagram ppt Circular Process Network PowerPoint templates.Download and present our Circle Charts PowerPoint Templates because this diagram helps you to light up enthusiasm in your team like dream emerge.ge. Use our Flow Charts PowerPoint Templates because you can Signpost your preferred roadmap to your eager co- travellers and demonstrate clearly how you intend to navigate them towards the desired corporate goal. Download and present our Business PowerPoint Templates because this template helps you to grab the attention of your listeners. Download our Shapes PowerPoint Templates because there is a key aspect to be emphasised. Download our Success PowerPoint Templates because iT outlines the entire thought process for the benefit of others. Tell it to the world with your characteristic aplomb.Use these PowerPoint slides for presentations relating to Access, Arrow, Business, Concept, Conceptual, Connection, Corporate, Creative, Cycle, Design, Different, Empty, Graphic, Idea, Illustration, Process, Shape, Solution, Strategy, Symbol, Template. The prominent colors used in the PowerPoint template are Green lime , White, Black. People tell us our connecting factors diverging arrow diagram ppt Circular Process Network PowerPoint templates are Second to none. Use our Concept PowerPoint templates and PPT Slides are Nice. Professionals tell us our connecting factors diverging arrow diagram ppt Circular Process Network PowerPoint templates are Beautiful. Presenters tell us our Conceptual PowerPoint templates and PPT Slides are Wonderful. Professionals tell us our connecting factors diverging arrow diagram ppt Circular Process Network PowerPoint templates are Upbeat. PowerPoint presentation experts tell us our Cycle PowerPoint templates and PPT Slides are Romantic. Be an organizational driver with our Connecting Factors Diverging Arrow Diagram Ppt Circular Process Network PowerPoint Templates. They will make you look good.
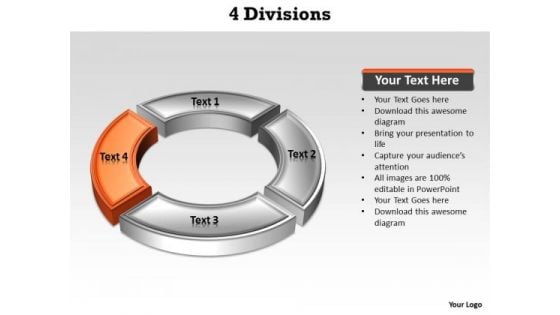
Ppt Orange Division Illustrating Four Issue PowerPoint Templates
PPT orange division illustrating four issue PowerPoint Templates-This PowerPoint Diagram consists of four divisions forming a circle. This Diagram explains one issue using Orange part of division. It signifies diagnosis, disjuncture, dismemberment, disporting, distinguishing, distribution, disunion, conflict, dispute, and dissonance.-Can be used for presentations on 3d, backdrop, background, brochure, business, catalog, chart, circle, concept, corporate, design, development, diagram, division, economic, economy, eps10, financial, flyer, four, graph, graphic, human, illustration, image, man, manager, one, part, poster, print, progress, round, scheme, section, situation, state, tab, vector, wallpaper-PPT orange division illustrating four issue PowerPoint Templates With our Ppt Orange Division Illustrating Four Issue PowerPoint Templates you won't play second fiddle. They help you dominate the action.
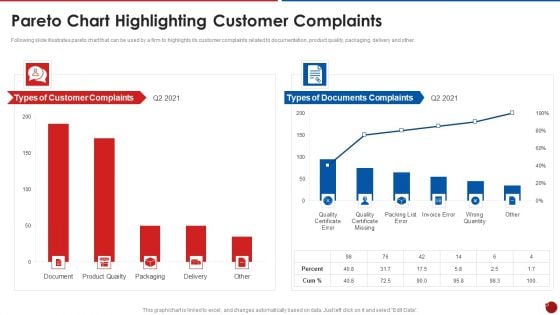
Quality Assurance Templates Set 2 Pareto Chart Highlighting Customer Complaints Elements PDF
Following slide illustrates pareto chart that can be used by a firm to highlights its customer complaints related to documentation, product quality, packaging, delivery and other. Deliver an awe inspiring pitch with this creative quality assurance templates set 2 pareto chart highlighting customer complaints elements pdf bundle. Topics like pareto chart highlighting customer complaints can be discussed with this completely editable template. It is available for immediate download depending on the needs and requirements of the user.
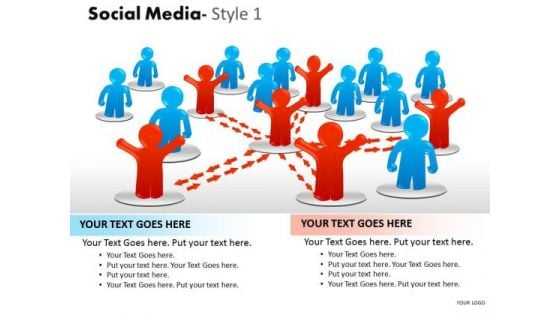
Business Framework Model Social Media Style 1 Diagram Strategy Diagram
Analyze Ailments On Our Business Framework Model Social Media Style 1 diagram Strategy Diagram Powerpoint Templates. Bring Out The Thinking Doctor In You. Dock Your Thoughts With Our Business Framework Model Social Media Style 1 diagram Strategy Diagram Powerpoint Templates. They Will Launch Them Into Orbit.
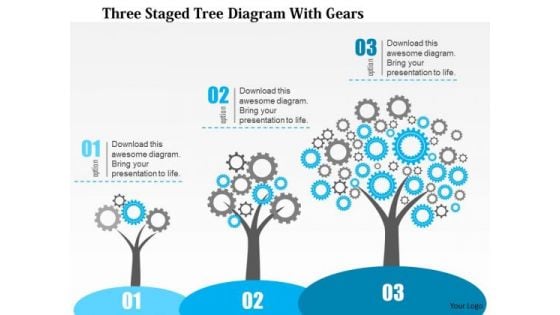
Business Diagram Three Staged Tree Diagram With Gears Presentation Template
This business diagram has been designed with graphic of three staged tree diagram with gears. Download this diagram to analyze the key points. This diagram offers a way for your audience to visually conceptualize the process.
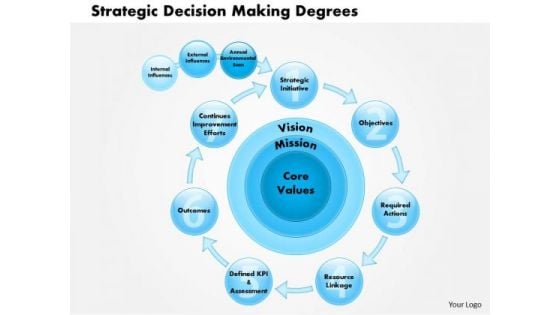
Business Framework Strategic Decision Making Degrees PowerPoint Presentation
This business framework has been designed with graphic of multistage process flow diagram. This business framework is useful for strategic decision chart. This chart is useful for displaying degrees of core values for making strategic decisions. Use this PPT diagram for business and marketing presentations.
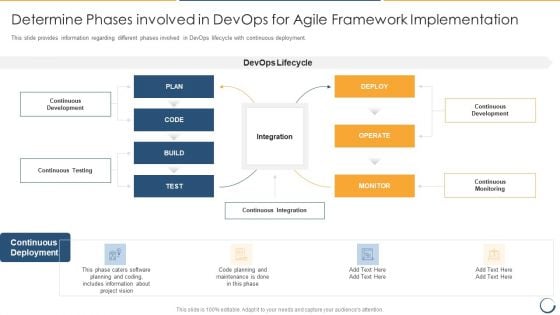
Determine Phases Involved In Devops For Agile Framework Implementation Slides PDF
This slide provides information regarding different phases involved in DevOps lifecycle with continuous deployment. Deliver an awe inspiring pitch with this creative determine phases involved in devops for agile framework implementation slides pdf bundle. Topics like continuous development, continuous testing, continuous monitoring can be discussed with this completely editable template. It is available for immediate download depending on the needs and requirements of the user.
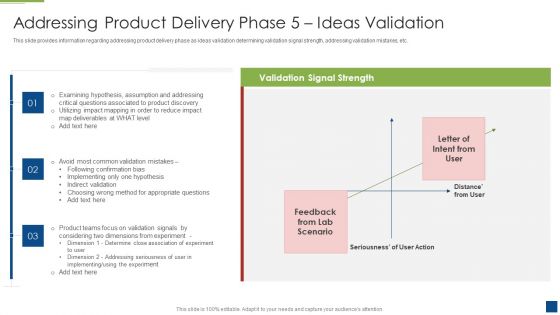
Ascertain Primary Stage For Successful Application Development Addressing Product Delivery Phase 5 Ideas Graphics PDF
This slide provides information regarding addressing product delivery phase as ideas validation determining validation signal strength, addressing validation mistakes, etc. Deliver an awe inspiring pitch with this creative ascertain primary stage for successful application development addressing product delivery phase 5 ideas graphics pdf bundle. Topics like product, implementing, teams, determine can be discussed with this completely editable template. It is available for immediate download depending on the needs and requirements of the user.
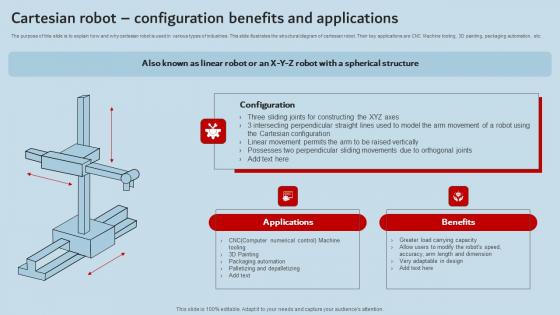
Cartesian Robot Configuration Benefits And Applications Industrial Robots Guidelines Pdf
The purpose of this slide is to explain how and why cartesian robot is used in various types of industries. This slide illustrates the structural diagram of cartesian robot. Their key applications are CNC Machine tooling, 3D painting, packaging automation, etc. Crafting an eye-catching presentation has never been more straightforward. Let your presentation shine with this tasteful yet straightforward Cartesian Robot Configuration Benefits And Applications Industrial Robots Guidelines Pdf template. It offers a minimalistic and classy look that is great for making a statement. The colors have been employed intelligently to add a bit of playfulness while still remaining professional. Construct the ideal Cartesian Robot Configuration Benefits And Applications Industrial Robots Guidelines Pdf that effortlessly grabs the attention of your audience. Begin now and be certain to wow your customers. The purpose of this slide is to explain how and why cartesian robot is used in various types of industries. This slide illustrates the structural diagram of cartesian robot. Their key applications are CNC Machine tooling, 3D painting, packaging automation, etc.
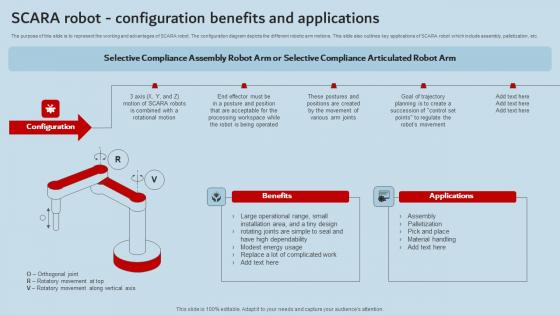
Scara Robot Configuration Benefits And Applications Industrial Robots Background Pdf
The purpose of this slide is to represent the working and advantages of SCARA robot. The configuration diagram depicts the different robotic arm motions. This slide also outlines key applications of SCARA robot which include assembly, palletization, etc. Slidegeeks is here to make your presentations a breeze with Scara Robot Configuration Benefits And Applications Industrial Robots Background Pdf With our easy-to-use and customizable templates, you can focus on delivering your ideas rather than worrying about formatting. With a variety of designs to choose from, you are sure to find one that suits your needs. And with animations and unique photos, illustrations, and fonts, you can make your presentation pop. So whether you are giving a sales pitch or presenting to the board, make sure to check out Slidegeeks first. The purpose of this slide is to represent the working and advantages of SCARA robot. The configuration diagram depicts the different robotic arm motions. This slide also outlines key applications of SCARA robot which include assembly, palletization, etc.
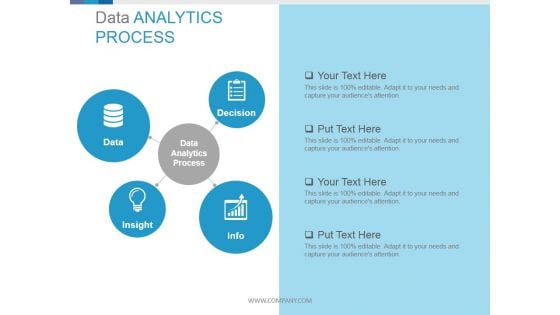
Data Analytics Process Circular Diagrams Ppt PowerPoint Presentation Guidelines
This is a data analytics process circular diagrams ppt powerpoint presentation guidelines. This is a four stage process. The stages in this process are data analytics process, data, decision, insight, info.
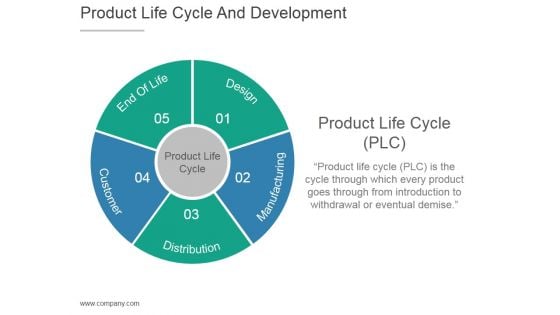
Product Life Cycle And Development Diagram Ppt PowerPoint Presentation Layout
This is a product life cycle and development diagram ppt powerpoint presentation layout. This is a five stage process. The stages in this process are end of life, design, manufacturing, distribution, customer.
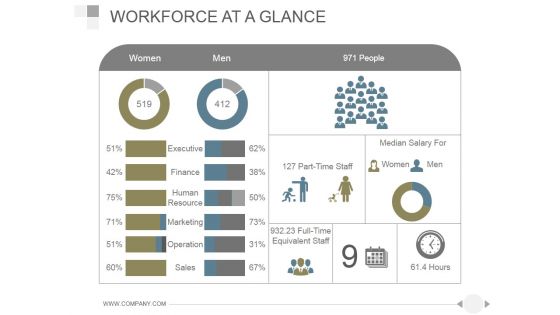
Workforce At A Glance Ppt PowerPoint Presentation Diagrams
This is a workforce at a glance ppt powerpoint presentation diagrams. This is a two stage process. The stages in this process are women, men, people, executive, finance, human resource, marketing.
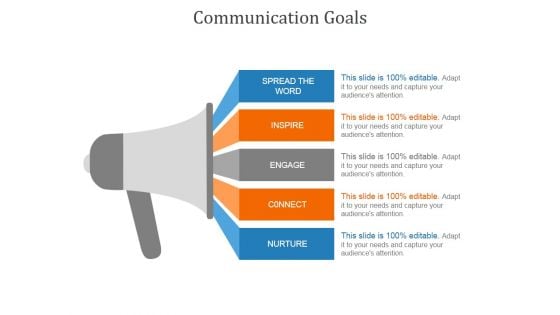
Communication Goals Template 1 Ppt PowerPoint Presentation Diagrams
This is a communication goals template 1 ppt powerpoint presentation diagrams. This is a five stage process. The stages in this process are spread the word, inspire, engage, connect, nurture.
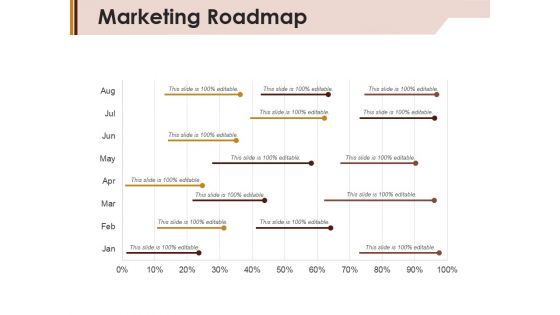
Marketing Roadmap Ppt Powerpoint Presentation Visual Aids Diagrams
This is a marketing roadmap ppt powerpoint presentation visual aids diagrams. This is a eight stage process. The stages in this process are jan, feb, mar, apr, may, june.
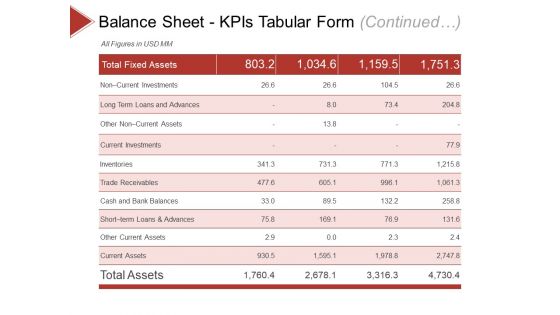
Balance Sheet Kpis Template 1 Ppt PowerPoint Presentation Diagram Ppt
This is a balance sheet kpis template 1 ppt powerpoint presentation diagram ppt. This is a four stage process. The stages in this process are non current investments, current investments, inventories, trade receivables, trade receivables.
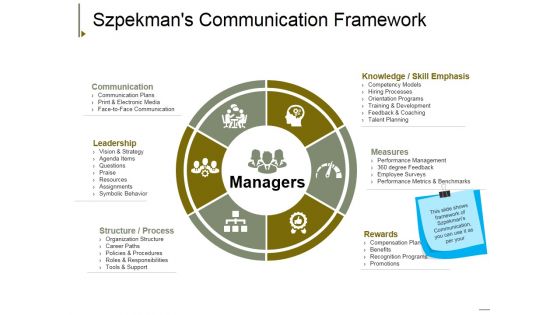
Szpekmans Communication Framework Ppt PowerPoint Presentation Show Diagrams
This is a szpekmans communication framework ppt powerpoint presentation show diagrams. This is a six stage process. The stages in this process are communication, leadership, measures, rewards, structure process.
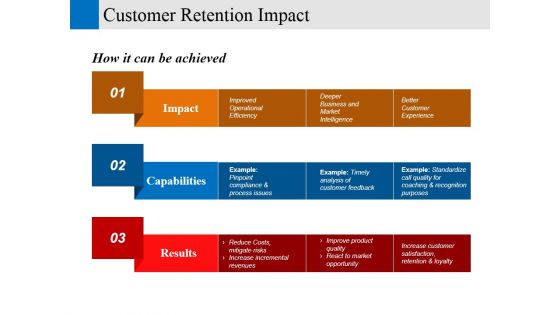
Customer Retention Impact Ppt PowerPoint Presentation Pictures Diagrams
This is a customer retention impact ppt powerpoint presentation pictures diagrams. This is a three stage process. The stages in this process are impact, capabilities, results, better customer experience, improved operational efficiency.
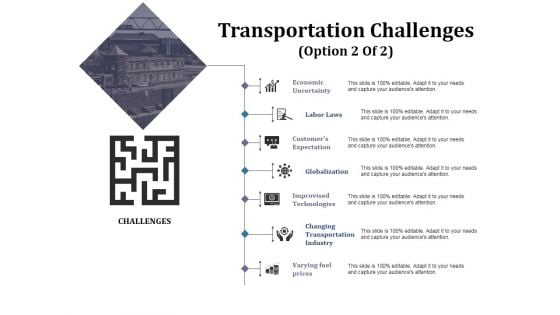
Transportation Challenges Template 2 Ppt PowerPoint Presentation File Diagrams
This is a transportation challenges template 2 ppt powerpoint presentation file diagrams. This is a seven stage process. The stages in this process are economic uncertainty, labor laws, globalization, varying fuel prices, improvised technologies.
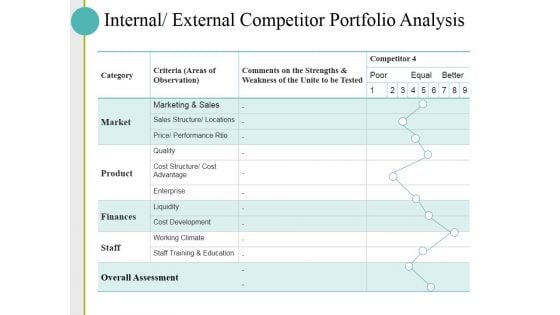
Internal External Competitor Portfolio Analysis Ppt PowerPoint Presentation Pictures Diagrams
This is a internal external competitor portfolio analysis ppt powerpoint presentation pictures diagrams. This is a five stage process. The stages in this process are market, product, finances, staff, overall assessment.
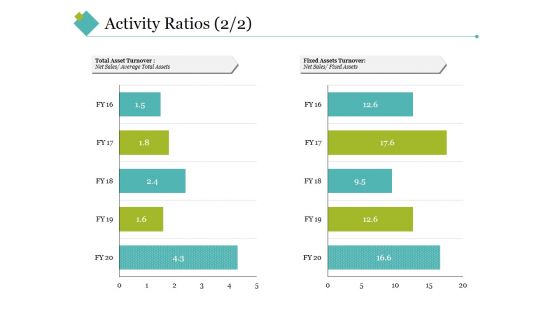
Activity Ratios Template 3 Ppt PowerPoint Presentation File Diagrams
This is a activity ratios template 3 ppt powerpoint presentation file diagrams. This is a two stage process. The stages in this process are total asset turnover, fixed assets turnover, net sales.
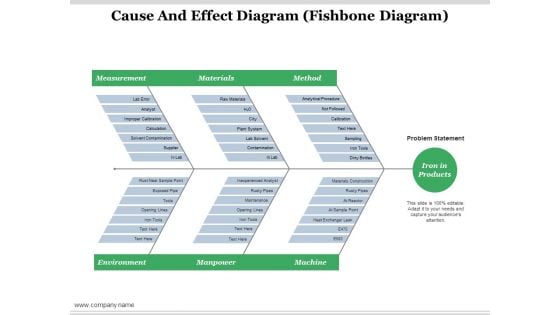
Cause And Effect Diagram Ppt PowerPoint Presentation Professional Example Topics
This is a cause and effect diagram ppt powerpoint presentation professional example topics. This is a three stage process. The stages in this process are measurement, materials, environment, manpower, machine.
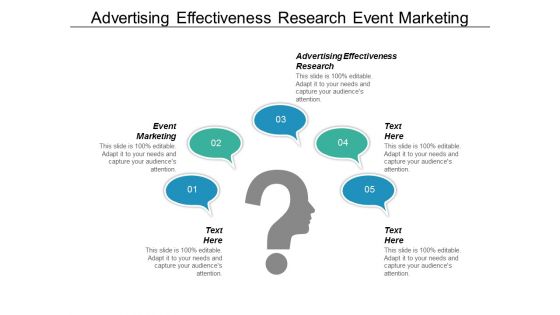
Advertising Effectiveness Research Event Marketing Ppt PowerPoint Presentation Diagrams
This is a advertising effectiveness research event marketing ppt powerpoint presentation diagrams. This is a five stage process. The stages in this process are advertising effectiveness research, event marketing.

Cause And Effect Puzzle Diagram Ppt Powerpoint Presentation Layouts
This is a cause and effect puzzle diagram ppt powerpoint presentation layouts. This is a two stage process. The stages in this process are action and reaction, causality, causes and effects.
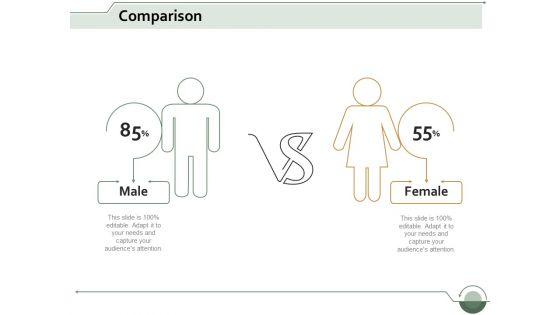
Comparison Marketing Ppt Powerpoint Presentation Visual Aids Diagrams
This is a comparison marketing ppt powerpoint presentation visual aids diagrams. This is a two stage process. The stages in this process are comparison, male, female, marketing, strategy .
Sample Evaluation Forms Employees Ppt PowerPoint Presentation Slides Diagrams Cpb
This is a sample evaluation forms employees ppt powerpoint presentation slides diagrams cpb. This is a four stage process. The stages in this process are sample evaluation forms employees.
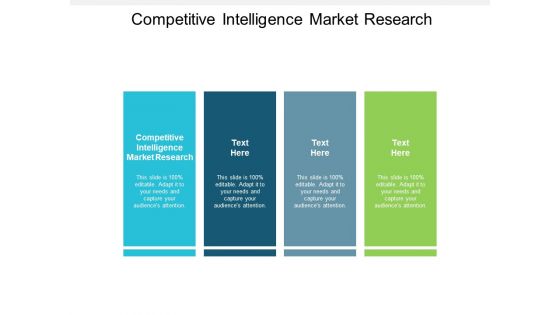
Competitive Intelligence Market Research Ppt PowerPoint Presentation Diagram Lists Cpb
This is a competitive intelligence market research ppt powerpoint presentation diagram lists cpb. This is a four stage process. The stages in this process are competitive intelligence market research.


 Continue with Email

 Home
Home


