Organization Structure
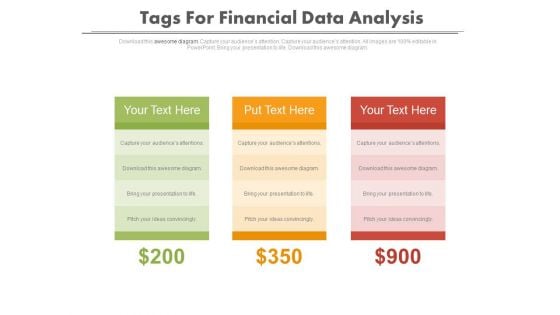
Tags For Financial Data Comparison Powerpoint Slides
Graphic of three text tag with dollar values has been used to design this power point template. This diagram may be used for financial data comparison. Use this diagram to build a professional presentation.
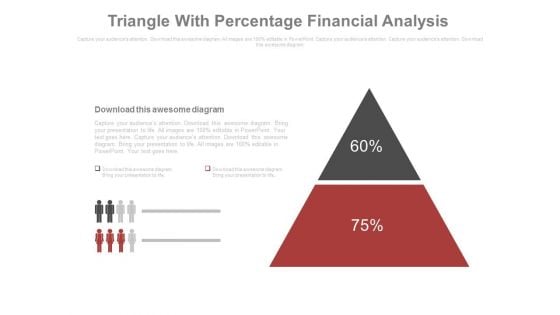
Triangle With Two Segments And Percentage Values Powerpoint Slides
This PowerPoint template contains graphics of triangle with two segments and percentage values. You may use this PPT slide for financial planning. The color coding of this template is specifically designed to highlight you points.
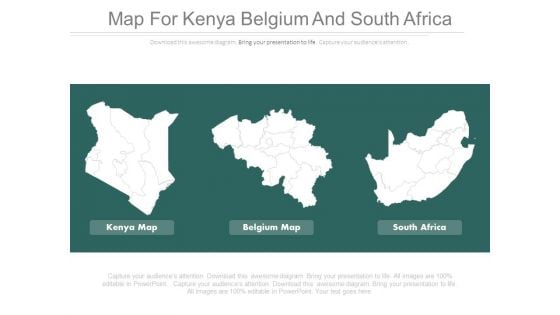
Maps For Kenya Belgium And South Africa Powerpoint Slides
This PowerPoint template has been designed with maps of Kenya, Belgium and South Africa. You may use this PPT slide depict area comparison of these three countries. Above slide provide ideal backdrop to make impressive presentations.

Successful Team For Effective Communication Powerpoint Slides

Team Of Eight Professional Persons Powerpoint Slides
Our above PowerPoint template displays a flexible yet unique design to introduce your team. This contains team of eight professional persons. You may download this PPT slide to present topics like team strategy and success.

Team Of Professionals For Specific Task Powerpoint Slides
Our above PowerPoint template displays a flexible yet unique design to introduce your team. This contains graphics of team working on specific task. You may download this PPT slide to present topics like team strategy and success.
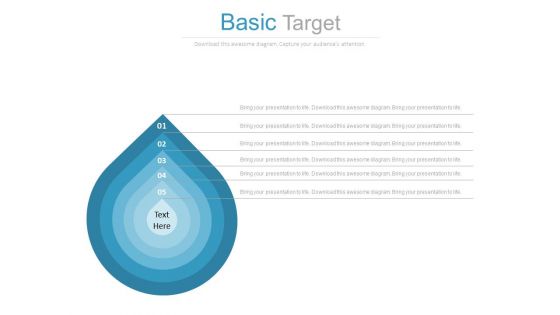
Five Steps Concentric Drops For Target Planning Powerpoint Slides
This PowerPoint template has been designed with graphics of concentric steps in water drop shape. Download this PPT slide to define and achieve goals with more success. This diagram may be used for goal planning related topics.
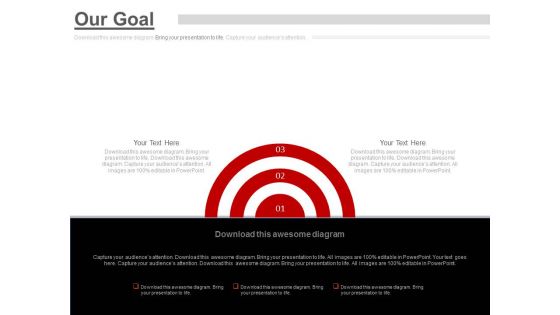
Three Steps To Focus On Target Powerpoint Slides
This PowerPoint template has been designed with our goals graphics.. Download this PPT slide to define and achieve goals with more success. This diagram may be used for goal planning related topics.

Five Yearly Sequential Timeline With Percentage Values Powerpoint Slides
This PowerPoint timeline slide design can be used to display timeline operations. It contains sequential timeline diagram with percentage values. This timeline template can be used in presentations where you need to display time planning and analysis.
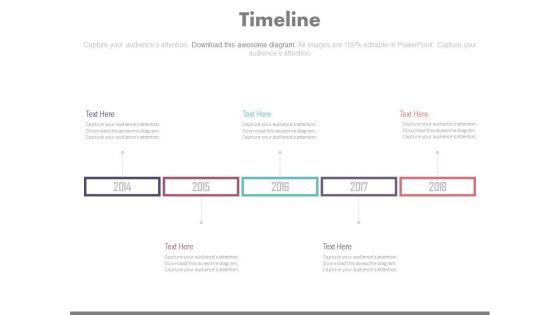
Graphical Representation Of Yearly Events Powerpoint Slides
This PowerPoint template has been designed with year based infographic timeline diagram. This PPT slide may be helpful for graphical representation of yearly events. Download this PowerPoint timeline template to make impressive presentations.
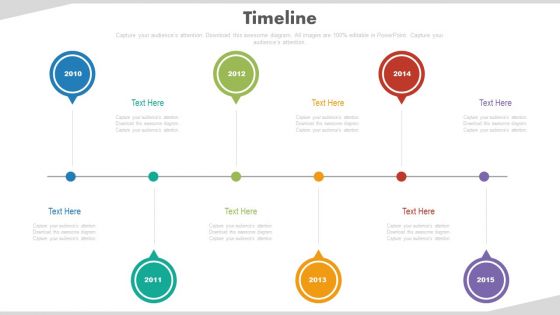
Linear Representation Of Timeline Events Powerpoint Slides
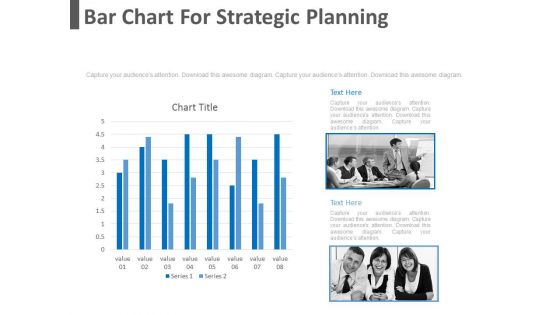
Bar Chart For Strategic Planning Powerpoint Slides
This PowerPoint template has been designed with bar graph with two teams. This diagram is useful to exhibit strategic planning. This diagram slide can be used to make impressive presentations.
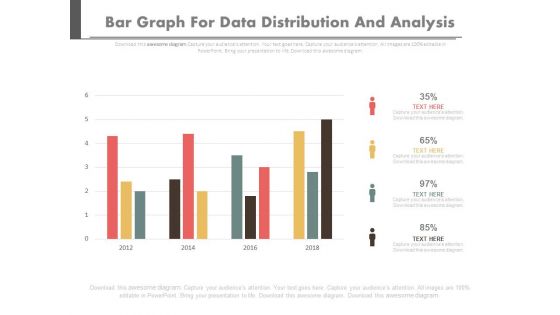
Bar Graph For Data Distribution And Analysis Powerpoint Slides
This PowerPoint template has been designed with bar graph. This PowerPoint diagram is useful for data distribution and analysis This diagram slide can be used to make impressive presentations.
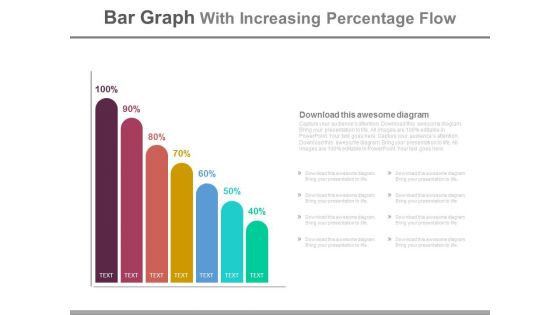
Bar Graph With Increasing Percentage Flow Powerpoint Slides
This PowerPoint slide has been designed with bar graph and increasing percentage values. This diagram slide may be used to display profit growth. Prove the viability of your ideas with this professional slide.
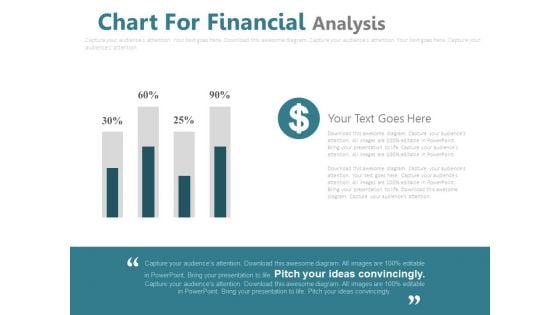
Chart For Financial Percentage Analysis Powerpoint Slides
This PowerPoint template has been designed with financial chart with dollar icon. This PPT slide may be used to display dollar value analysis chart. Download this slide to build unique presentation.
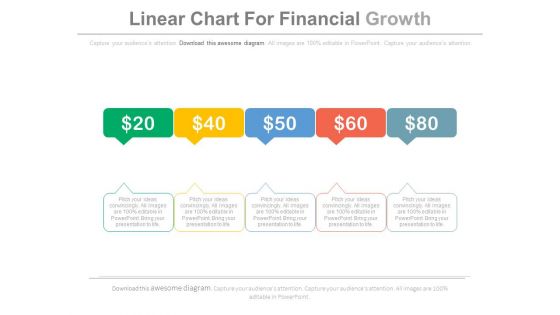
Five Steps Linear Chart For Financial Growth Powerpoint Slides
This PowerPoint template has been designed with five steps linear chart. This PPT slide may be used to display financial planning and growth. Download this slide to build unique presentation.
Market Trends Chart With Percentage And Icons Powerpoint Slides
This PowerPoint template has been designed with graphics of chart with percentage values and icons. This PowerPoint template may be used to market trends and financial analysis. Prove the viability of your ideas using this impressive slide.

About Us Page For Team Information Powerpoint Slides
This PowerPoint template has been designed with about us page slide. Download this PPT slide to display team information. You can easily customize this template to make it more unique as per your need.
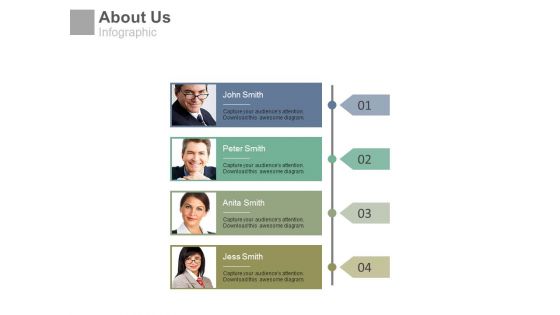
About Us Page With Team Profiles Tags Powerpoint Slides
This PowerPoint template has been designed with team profile tags. Use this template as about us slide for your presentation. You can easily customize this template to make it more unique as per your need.

Employee Contribution For Company Growth Powerpoint Slides
This PowerPoint template has been designed with employee picture and huge building in background. This diagram is excellent visual tools to display leading employee and strategic planning. Capture the attention of your audience using this PPT diagram slide.

Three Person Tags With Skill Percentage Charts Powerpoint Slides
This PowerPoint template has been designed with three person?s tags with percentage values. This Info graphic diagram may be used to display team skill analysis. Download this impressive diagram to build unique presentations.
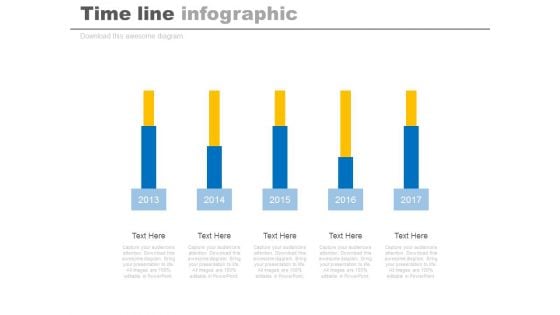
Five Years Planning Timeline Chart Powerpoint Slides
This timeline diagram displays five sequential year steps. This PowerPoint template may be used to display when statistical analysis. This timeline design is most useful for showing important milestones and deadlines.
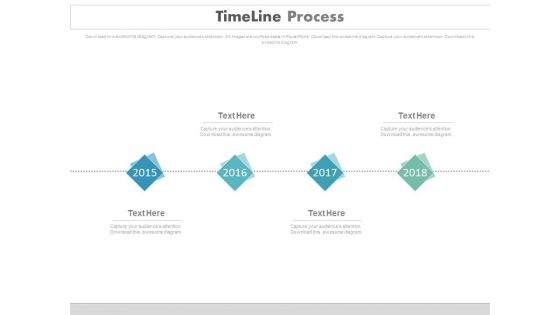
Timeline Linear Process With Years Powerpoint Slides
This timeline diagram displays four linear steps. This PowerPoint template may be used to display when events or steps should happen. This timeline design is most useful for showing important milestones and deadlines.
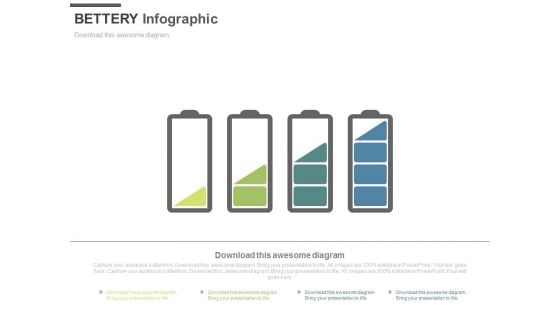
Four Batteries For Power Backup Storage Powerpoint Slides
This PPT slide contains graphics of four batteries. Download this PowerPoint template to depict concepts in informative and descriptive manner. Deliver amazing presentations to mesmerize your audience by using this PPT slide design.
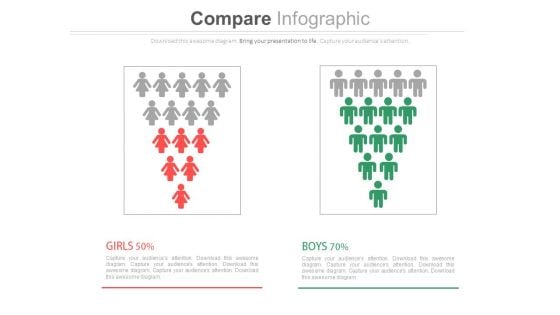
Male Female Gender Ratio Analysis Comparison Chart Powerpoint Slides
This PowerPoint template has been designed with graphics of male and female icons. Download this PPT slide to depict gender ratio analysis. Grab the attention of your team with this eye catching template.
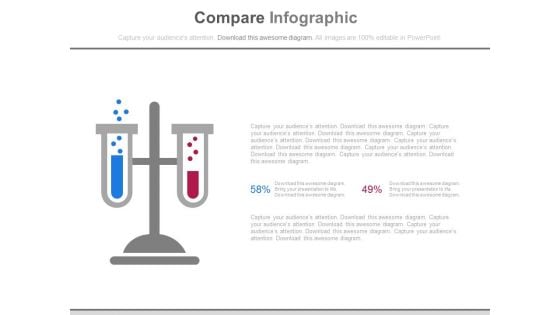
Two Test Tubes For Compare Analysis Powerpoint Slides
This PPT slide contains graphics of two test tubes. Download this PowerPoint template for comparison and analysis. Deliver amazing presentations to mesmerize your audience by using this PPT slide design.

Thank You Message On Social Network Powerpoint Slides
This PowerPoint template contains graphics of thanks giving design with social media icons. Download this PPT slide to build unique yet impressive presentations. You can easily customize this template to make it more unique as per your need.
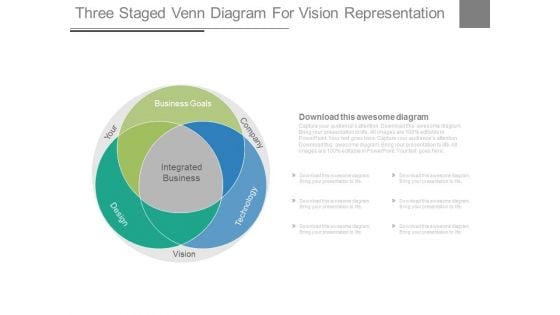
Venn Diagram For Company Vision Powerpoint Slides
This power point template has been designed with graphic of Venn diagram. Use this Venn diagram to display company vision. Illustrate your ideas and imprint them in the minds of your team with this template.
Magnifying Glass With Team And Icons Powerpoint Slides
This PPT slide contains graphics of magnifying glass with team and icons. You may use this PowerPoint template team strategy and analysis. Download this team slide design to deliver amazing presentations.

Mind Map Diagram For Team Network Powerpoint Slides
This PPT slide contains our team mind map layout with team pictures. You may use this PowerPoint template to display team strategy for successful goal planning. Download this team slide design to deliver amazing presentations.
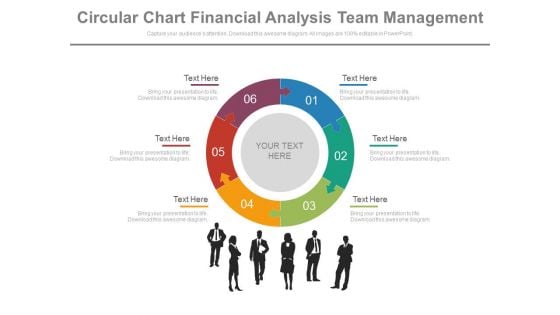
Puzzle Pie Chart With Team For Financial Analysis Powerpoint Slides
This PPT slide contains graphics of puzzle pie chart with team icons. You may use this PowerPoint template to display team strategy and success. Download this professional slide design to deliver amazing presentations.

Team With Social Media Network Powerpoint Slides
Our compelling template consists with graphics of team with social media network. This slide has been professionally designed to display team network and planning. This template offers an excellent background to build impressive presentation.
Four Banners With Education And Idea Icons Powerpoint Template
Adjust the above diagram into your presentations to visually support your content. This slide has been professionally designed with banners infographic. This template offers an excellent background to display education and idea concepts.
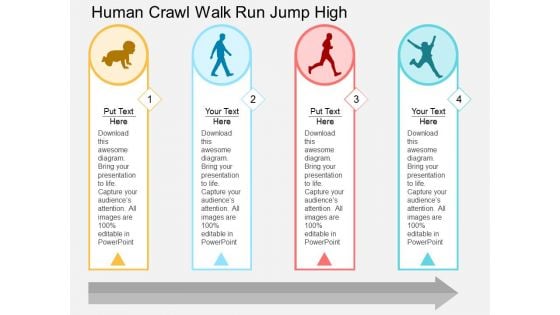
Human Crawl Walk Run Jump High Powerpoint Template
Visually support your presentation with our above template showing man crawl, walk, run and jumping high. This slide has been professionally designed to depict slow and steady progress. Deliver amazing presentations to mesmerize your audience.
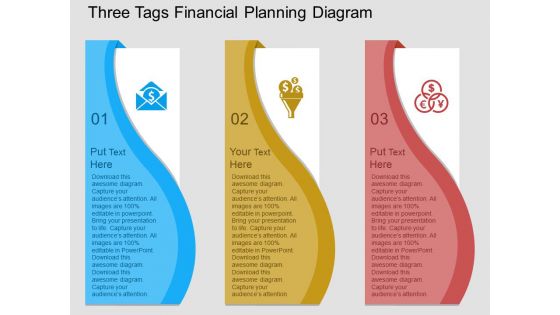
Three Tags Financial Planning Diagram Powerpoint Template
This PowerPoint template has been designed with three infographic banners. This diagram helps to portray concepts of marketing and financial planning. Present your views using this innovative slide and be assured of leaving a lasting impression.
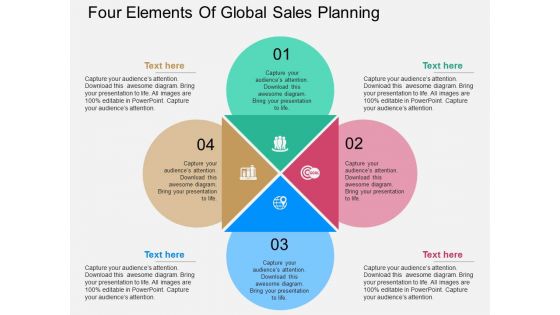
Four Elements Of Global Sales Planning Powerpoint Template
This PowerPoint slide has been designed with process infographic. This PPT diagram may be used to display global sales planning. This diagram slide can be used to make impressive presentations.
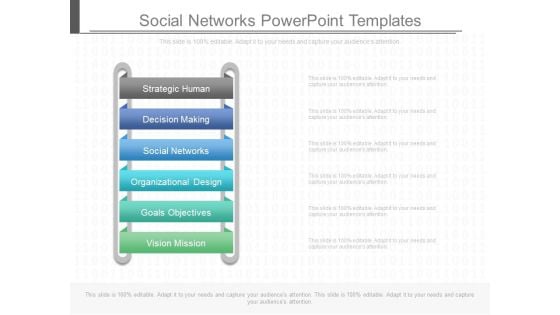
Social Networks Powerpoint Templates
This is a social networks powerpoint templates. This is a six stage process. The stages in this process are strategic human, decision making, social networks, organizational design, goals objectives, vision mission.
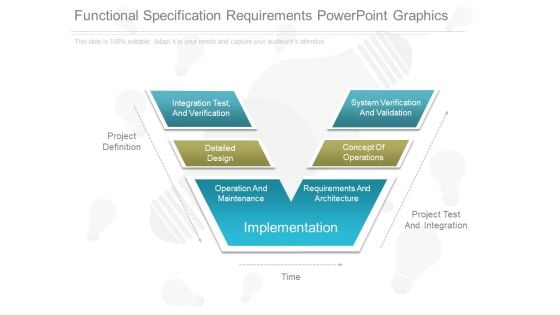
Functional Specification Requirements Powerpoint Graphics
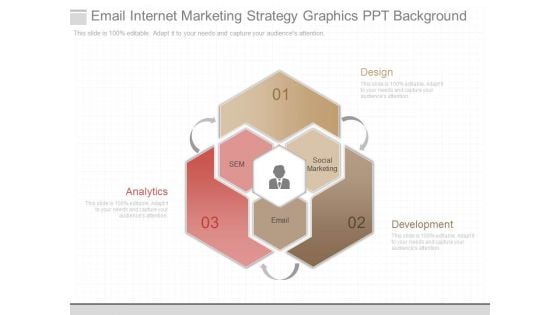
Email Internet Marketing Strategy Graphics Ppt Background
This is a email internet marketing strategy graphics ppt background. This is a three stage process. The stages in this process are design, analytics, development, sem, social marketing, email.
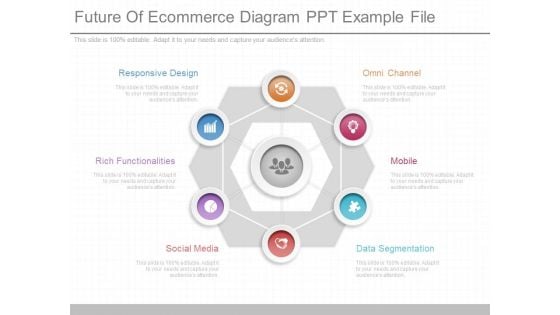
Future Of Ecommerce Diagram Ppt Example File
This is a future of ecommerce diagram ppt example file. This is a six stage process. The stages in this process are responsive design, rich functionalities, social media, omni channel, mobile, data segmentation.
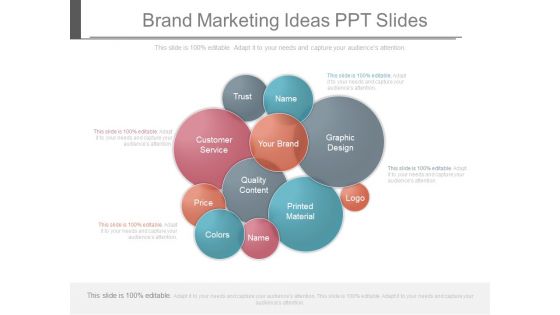
Brand Marketing Ideas Ppt Slides
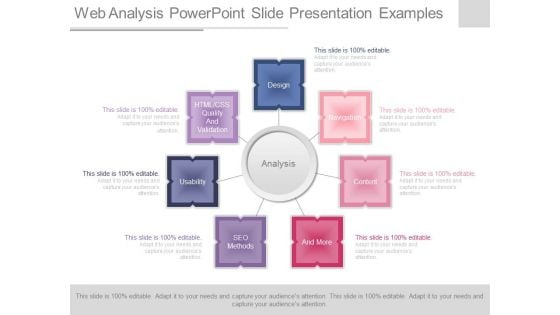
Web Analysis Powerpoint Slide Presentation Examples
This is a web analysis powerpoint slide presentation examples. This is a seven stage process. The stages in this process are design, navigation, content, and more, seo methods, usability, html css quality and validation.
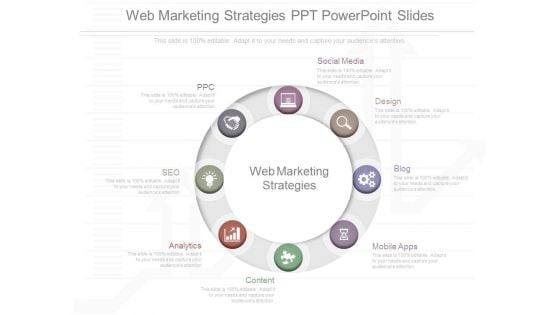
Web Marketing Strategies Ppt Powerpoint Slides
This is a web marketing strategies ppt powerpoint slides. This is a eight stage process. The stages in this process are social media, design, blog, mobile apps, content, analytics, seo, ppc.
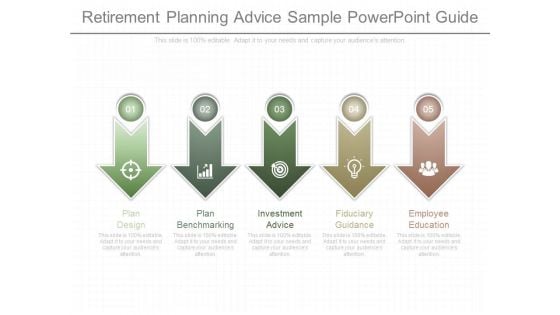
Retirement Planning Advice Sample Powerpoint Guide
This is a retirement planning advice sample powerpoint guide. This is a five stage process. The stages in this process are plan design, plan benchmarking, investment advice, fiduciary guidance, employee education.
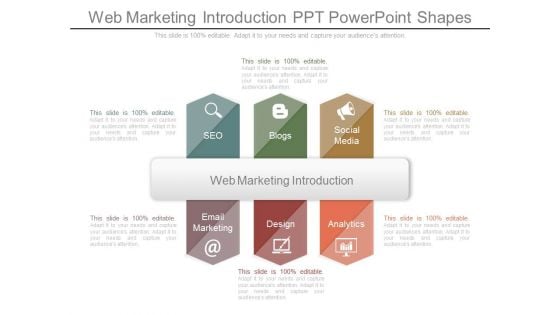
Web Marketing Introduction Ppt Powerpoint Shapes
This is a web marketing introduction ppt powerpoint shapes. This is a three stage process. The stages in this process are web marketing introduction, email marketing, design, analytics, social media, blogs, seo.
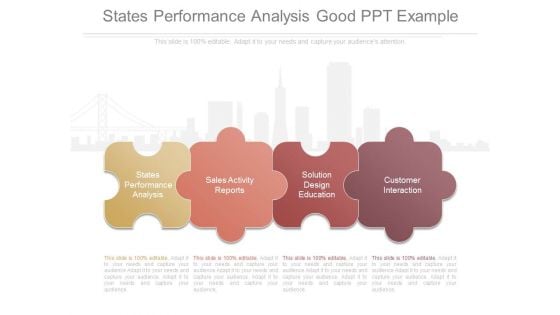
States Performance Analysis Good Ppt Example
This is a states performance analysis good ppt example. This is a four stage process. The stages in this process are strategy and states performance analysis, sales activity reports, solution design education, customer interaction.
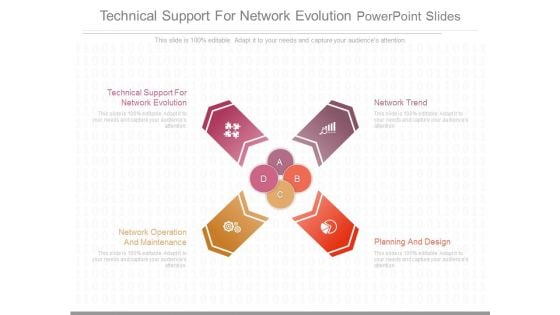
Technical Support For Network Evolution Powerpoint Slides
This is a technical support for network evolution powerpoint slides. This is a four stage process. The stages in this process are technical support for network evolution, network operation and maintenance, network trend, planning and design.
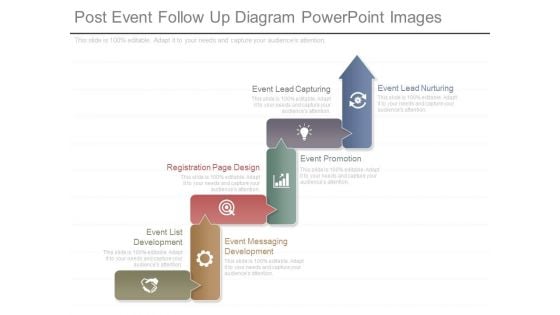
Post Event Follow Up Diagram Powerpoint Images
This is a post event follow up diagram powerpoint images. This is a six stage process. The stages in this process are event lead nurturing, event lead capturing, event promotion, registration, page design, event messaging development, event list development.
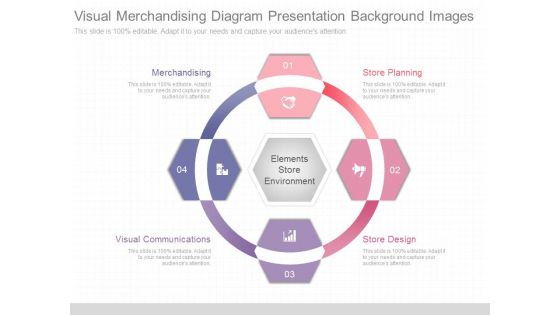
Visual Merchandising Diagram Presentation Background Images
This is a visual merchandising diagram presentation background images. This is a four stage process. The stages in this process are elements store environment, store planning, store design, visual communications, merchandising.
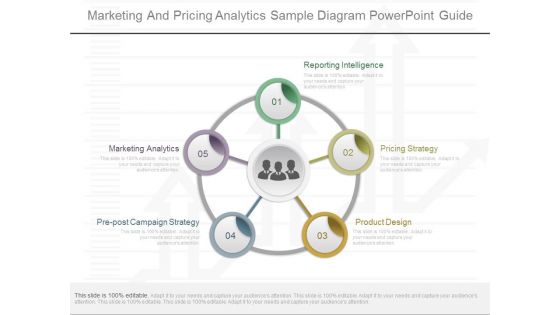
Marketing And Pricing Analytics Sample Diagram Powerpoint Guide
This is a marketing and pricing analytics sample diagram powerpoint guide. This is a five stage process. The stages in this process are reporting intelligence, pricing strategy, product design, pre post campaign strategy, marketing analytics.

Collecting Information Powerpoint Presentation Template
This is a collecting information powerpoint presentation template. This is a four stage process. The stages in this process are conducting tests, collecting information, forming ideas, the design thinking process.
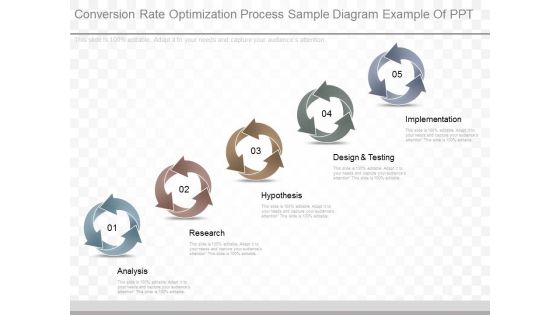
Conversion Rate Optimization Process Sample Diagram Example Of Ppt
This is a conversion rate optimization process sample diagram example of ppt. This is a five stage process. The stages in this process are implementation, design and testing, hypothesis, research, analysis.
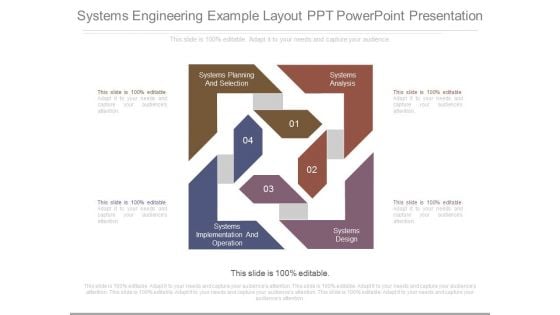
Systems Engineering Example Layout Ppt Powerpoint Presentation
This is a systems engineering example layout ppt powerpoint presentation. This is a four stage process. The stages in this process are systems planning and selection, systems implementation and operation, systems analysis, systems design.
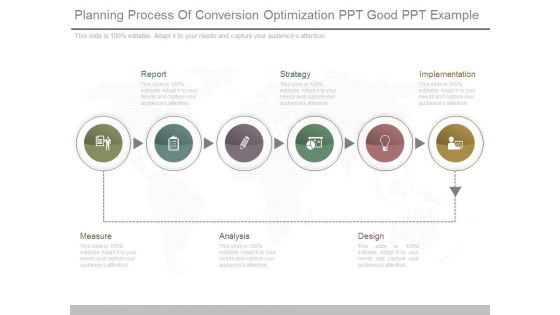
Planning Process Of Conversion Optimization Ppt Good Ppt Example
This is a planning process of conversion optimization ppt good ppt example. This is a six stage process. The stages in this process are report, strategy, implementation, measure, analysis, design.
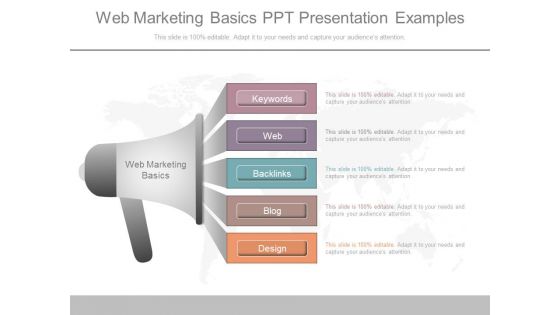
Web Marketing Basics Ppt Presentation Examples
This is a web marketing basics ppt presentation examples. This is a five stage process. The stages in this process are keywords, web, backlinks, blog, design, web marketing basics.
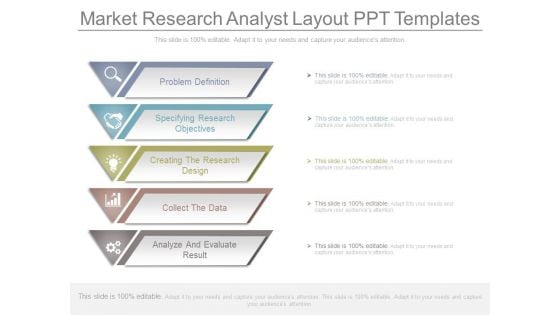
Market Research Analyst Layout Ppt Templates
This is a market research analyst layout ppt templates. This is a five stage process. The stages in this process are problem definition, specifying research objectives, creating the research design, collect the data, analyze and evaluate result.
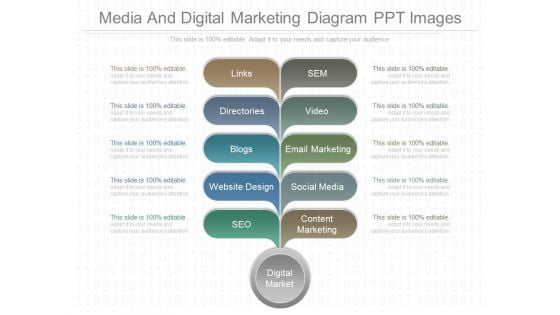
Media And Digital Marketing Diagram Ppt Images
This is a media and digital marketing diagram ppt images. This is a ten stage process. The stages in this process are links, directories, blogs, website design, seo, content marketing, social media, email marketing, video, sem, digital market.

Process Of Cro Analysis Sample Diagram Powerpoint Image
This is a process of cro analysis sample diagram powerpoint image. This is a four stage process. The stages in this process are review performance, development and testing, research and analysis, design variations.
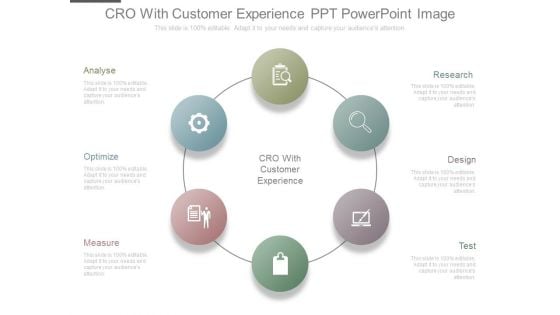
Cro With Customer Experience Ppt Powerpoint Image
This is a cro with customer experience ppt powerpoint image. This is a six stage process. The stages in this process are analyse, optimize, measure, cro with customer experience, research, design, test.
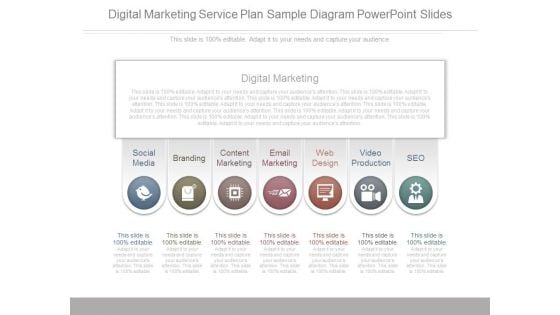
Digital Marketing Service Plan Sample Diagram Powerpoint Slides
This is a digital marketing service plan sample diagram powerpoint slides. This is a seven stage process. The stages in this process are digital marketing, social media, branding, content marketing, email marketing, web design, video production, seo.


 Continue with Email

 Home
Home


