Organization Structure
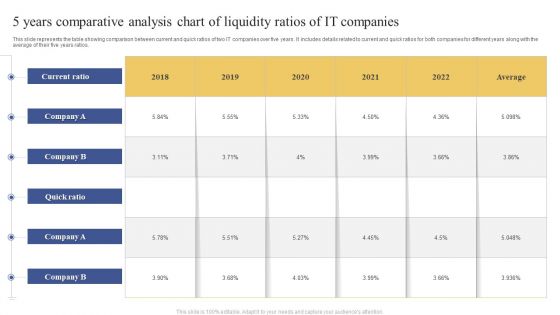
5 Years Comparative Analysis Chart Of Liquidity Ratios Of IT Companies Ppt Portfolio Visual Aids PDF
This slide represents the table showing comparison between current and quick ratios of two IT companies over five years. It includes details related to current and quick ratios for both companies for different years along with the average of their five years ratios. Pitch your topic with ease and precision using this 5 Years Comparative Analysis Chart Of Liquidity Ratios Of IT Companies Ppt Portfolio Visual Aids PDF. This layout presents information on Current Ratio, Average, 2018 To 2022. It is also available for immediate download and adjustment. So, changes can be made in the color, design, graphics or any other component to create a unique layout.
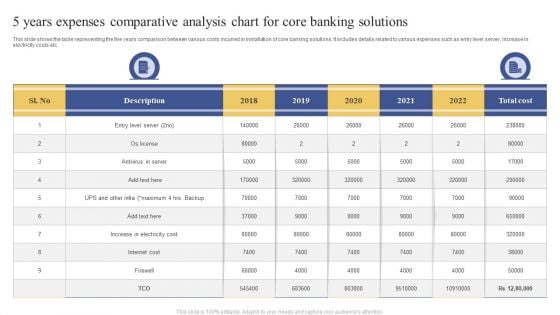
5 Years Expenses Comparative Analysis Chart For Core Banking Solutions Ppt Portfolio Clipart Images PDF
This slide shows the table representing the five years comparison between various costs incurred in installation of core banking solutions. It includes details related to various expenses such as entry level server, increase in electricity costs etc. Pitch your topic with ease and precision using this 5 Years Expenses Comparative Analysis Chart For Core Banking Solutions Ppt Portfolio Clipart Images PDF. This layout presents information on Entry Level Server, Antivirus Server, Increase Electricity Cost. It is also available for immediate download and adjustment. So, changes can be made in the color, design, graphics or any other component to create a unique layout.
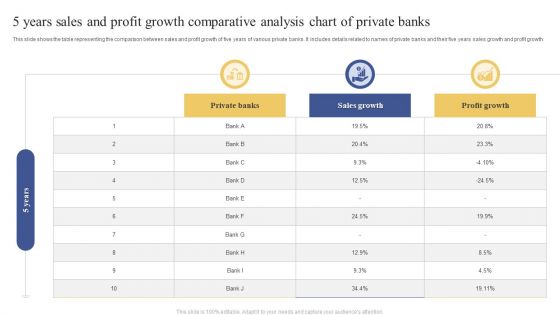
5 Years Sales And Profit Growth Comparative Analysis Chart Of Private Banks Infographics PDF
This slide shows the table representing the comparison between sales and profit growth of five years of various private banks. It includes details related to names of private banks and their five years sales growth and profit growth. Pitch your topic with ease and precision using this 5 Years Sales And Profit Growth Comparative Analysis Chart Of Private Banks Infographics PDF. This layout presents information on Private Banks, Sales Growth, Profit Growth. It is also available for immediate download and adjustment. So, changes can be made in the color, design, graphics or any other component to create a unique layout.
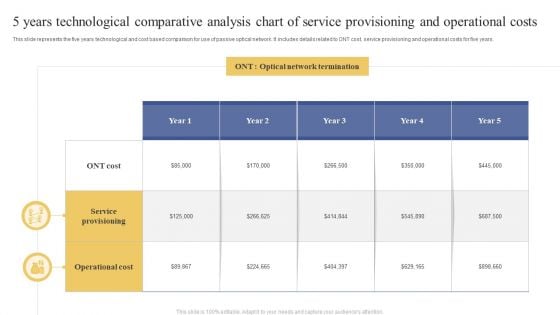
5 Years Technological Comparative Analysis Chart Of Service Provisioning And Operational Costs Information PDF
This slide represents the five years technological and cost based comparison for use of passive optical network. It includes details related to ONT cost, service provisioning and operational costs for five years. Pitch your topic with ease and precision using this 5 Years Technological Comparative Analysis Chart Of Service Provisioning And Operational Costs Information PDF. This layout presents information on Optical Network Termination, Service Provisioning, Operational Cost. It is also available for immediate download and adjustment. So, changes can be made in the color, design, graphics or any other component to create a unique layout.
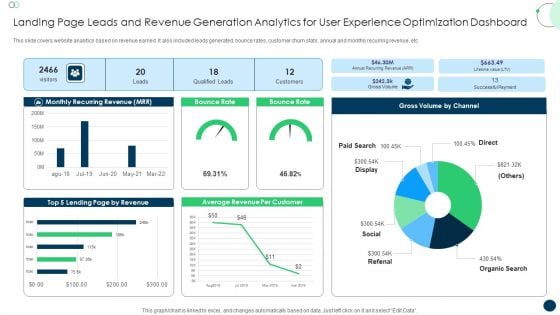
Landing Page Leads And Revenue Generation Analytics For User Experience Optimization Dashboard Formats PDF
This slide covers website analytics based on revenue earned. It also included leads generated, bounce rates, customer churn stats, annual and monthly recurring revenue, etc. Pitch your topic with ease and precision using this Landing Page Leads And Revenue Generation Analytics For User Experience Optimization Dashboard Formats PDF. This layout presents information on Monthly Recurring Revenue, Bounce Rate, Gross Volume. It is also available for immediate download and adjustment. So, changes can be made in the color, design, graphics or any other component to create a unique layout.
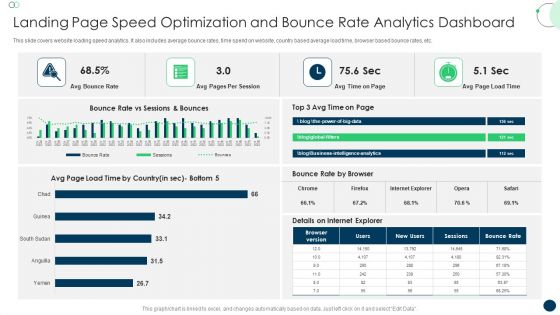
Landing Page Speed Optimization And Bounce Rate Analytics Dashboard Topics PDF
This slide covers website loading speed analytics. It also includes average bounce rates, time spend on website, country based average load time, browser based bounce rates, etc. Pitch your topic with ease and precision using this Landing Page Speed Optimization And Bounce Rate Analytics Dashboard Topics PDF. This layout presents information on Avg Bounce Rate, Avg Pages, Per Session. It is also available for immediate download and adjustment. So, changes can be made in the color, design, graphics or any other component to create a unique layout.
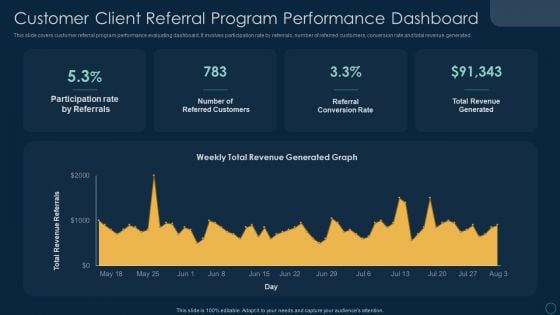
Customer Client Referral Program Performance Dashboard Ppt File Visual Aids PDF
This slide covers customer referral program performance evaluating dashboard. It involves participation rate by referrals, number of referred customers, conversion rate and total revenue generated. Pitch your topic with ease and precision using this Customer Client Referral Program Performance Dashboard Ppt File Visual Aids PDF. This layout presents information on Participation Rate Referrals, Number Referred Customers, Referral Conversion Rate. It is also available for immediate download and adjustment. So, changes can be made in the color, design, graphics or any other component to create a unique layout.

Four Techniques For Profitable Youtube Marketing Ppt Outline Format Ideas PDF
This slide covers different ways to increase revenue through YouTube advertising strategy. It includes techniques such as selecting YouTube ad format wisely, using YouTube targeting options, setting up video remarketing, driving action with interactive links, etc. Pitch your topic with ease and precision using this Four Techniques For Profitable Youtube Marketing Ppt Outline Format Ideas PDF. This layout presents information on Action Steps, Techniques, Video Remarketing. It is also available for immediate download and adjustment. So, changes can be made in the color, design, graphics or any other component to create a unique layout.
Youtube Video Marketing Analytics Dashboard Ppt Icon Portrait PDF
This slide covers dashboard illustrating performance of ad campaigns on YouTube. It includes elements such as total gained subscribers, likes, dislikes, daily active users, views, campaign performance, traffic sources by views, etc. Pitch your topic with ease and precision using this Youtube Video Marketing Analytics Dashboard Ppt Icon Portrait PDF. This layout presents information on Average Vies, Per Week, Campaigns, Traffic Sources. It is also available for immediate download and adjustment. So, changes can be made in the color, design, graphics or any other component to create a unique layout.
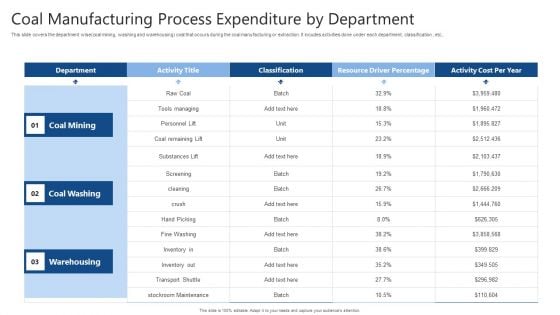
Coal Manufacturing Process Expenditure By Department Ppt Portfolio Format Ideas PDF
This slide covers the department wise coal mining, washing and warehousing cost that occurs during the coal manufacturing or extraction. It incudes activities done under each department, classification , etc. Pitch your topic with ease and precision using this Coal Manufacturing Process Expenditure By Department Ppt Portfolio Format Ideas PDF. This layout presents information on Coal Mining, Coal Washing, Warehousing. It is also available for immediate download and adjustment. So, changes can be made in the color, design, graphics or any other component to create a unique layout.
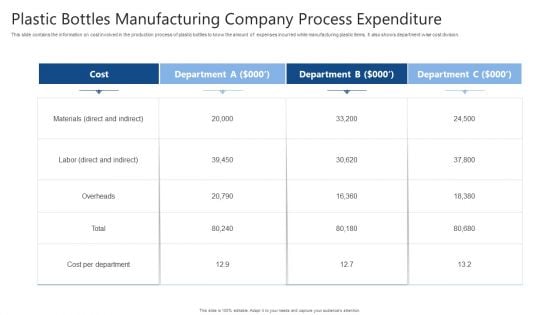
Plastic Bottles Manufacturing Company Process Expenditure Ppt File Templates PDF
This slide contains the information on cost involved in the production process of plastic bottles to know the amount of expenses incurred while manufacturing plastic items. It also shows department wise cost division. Pitch your topic with ease and precision using this Plastic Bottles Manufacturing Company Process Expenditure Ppt File Templates PDF. This layout presents information on Department, COST, Cost Per Department. It is also available for immediate download and adjustment. So, changes can be made in the color, design, graphics or any other component to create a unique layout.
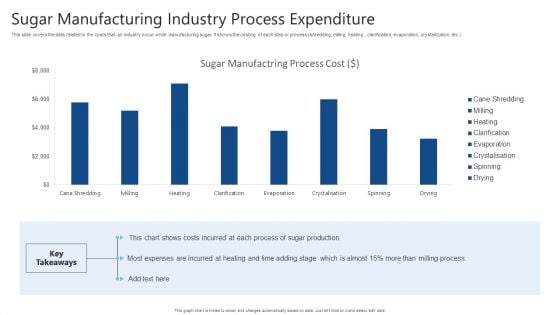
Sugar Manufacturing Industry Process Expenditure Ppt Infographic Template Information PDF
This slide covers the data related to the costs that an industry occur while manufacturing sugar. It shows the costing of each step or process shredding, milling, heating, clarification, evaporation, crystallization, etc. Pitch your topic with ease and precision using this Sugar Manufacturing Industry Process Expenditure Ppt Infographic Template Information PDF. This layout presents information on Sugar Manufactring Process, Cost, Sugar Production. It is also available for immediate download and adjustment. So, changes can be made in the color, design, graphics or any other component to create a unique layout.

Blockchain Technology Comparative Assessment Table With Cost Per Transaction Guidelines PDF
The purpose of this slide is to outline comparison of various blockchain technologies. The technologies mentioned in the slide are bit shares, bitcoin, Ethereum, bitcoin cash, Litecoin and dash. Pitch your topic with ease and precision using this Blockchain Technology Comparative Assessment Table With Cost Per Transaction Guidelines PDF. This layout presents information on Median Confirmation Time, Transactions Per Second, Cost Per Transaction. It is also available for immediate download and adjustment. So, changes can be made in the color, design, graphics or any other component to create a unique layout.
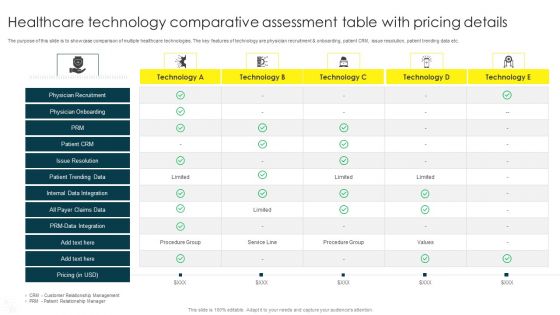
Healthcare Technology Comparative Assessment Table With Pricing Details Elements PDF
The purpose of this slide is to showcase comparison of multiple healthcare technologies. The key features of technology are physician recruitment and onboarding, patient CRM, issue resolution, patient trending data etc. Pitch your topic with ease and precision using this Healthcare Technology Comparative Assessment Table With Pricing Details Elements PDF. This layout presents information on Physician Recruitment, Physician Onboarding, PRM. It is also available for immediate download and adjustment. So, changes can be made in the color, design, graphics or any other component to create a unique layout.
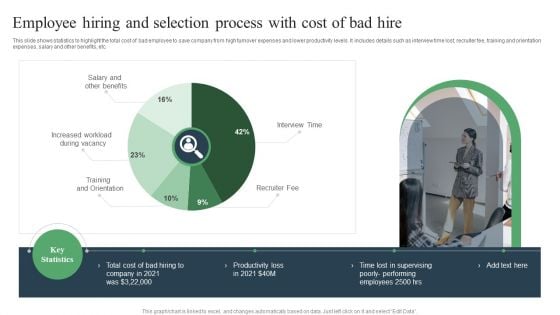
Employee Hiring And Selection Process With Cost Of Bad Hire Ppt PowerPoint Presentation Outline Skills PDF
This slide shows statistics to highlight the total cost of bad employee to save company from high turnover expenses and lower productivity levels. It includes details such as interview time lost, recruiter fee, training and orientation expenses, salary and other benefits, etc. Pitch your topic with ease and precision using this Employee Hiring And Selection Process With Cost Of Bad Hire Ppt PowerPoint Presentation Outline Skills PDF. This layout presents information on Employee Hiring, Selection Process, Candidate Screening. It is also available for immediate download and adjustment. So, changes can be made in the color, design, graphics or any other component to create a unique layout.
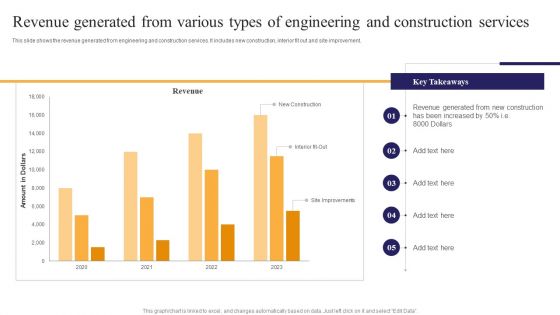
Revenue Generated From Various Types Of Engineering And Construction Services Ppt PowerPoint Presentation File Guide PDF
This slide shows the revenue generated from engineering and construction services. It includes new construction, interior fit out and site improvement. Pitch your topic with ease and precision using this Revenue Generated From Various Types Of Engineering And Construction Services Ppt PowerPoint Presentation File Guide PDF. This layout presents information on Revenue Generated, New Construction, Been Increased. It is also available for immediate download and adjustment. So, changes can be made in the color, design, graphics or any other component to create a unique layout.
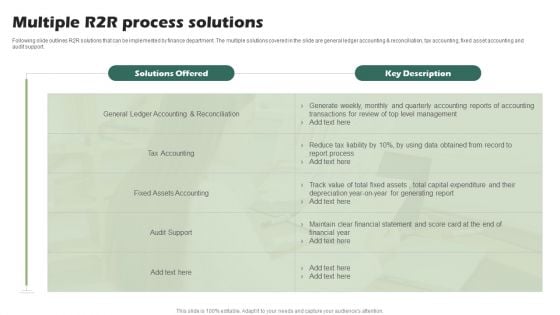
Multiple R2R Process Solutions Ppt PowerPoint Presentation Portfolio Topics PDF
Following slide outlines R2R solutions that can be implemented by finance department. The multiple solutions covered in the slide are general ledger accounting and reconciliation, tax accounting, fixed asset accounting and audit support.Pitch your topic with ease and precision using this Multiple R2R Process Solutions Ppt PowerPoint Presentation Portfolio Topics PDF. This layout presents information on Accounting Reconciliation, Assets Accounting, Financial Statement. It is also available for immediate download and adjustment. So, changes can be made in the color, design, graphics or any other component to create a unique layout.

Customer Acquisition Plan Infographics PDF
This slide illustrate various inbound and outbound marketing strategies tools to attract new customer. It includes techniques such as search engine optimization, email marketing, copywriting, content marketing and conversion rate optimization. Pitch your topic with ease and precision using this Customer Acquisition Plan Infographics PDF. This layout presents information on Marketing Strategy, Price, Customer Acquisition Plan. It is also available for immediate download and adjustment. So, changes can be made in the color, design, graphics or any other component to create a unique layout.
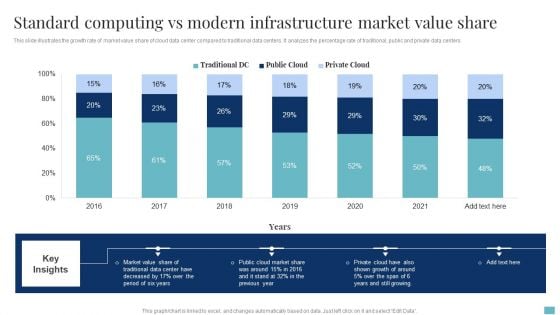
Standard Computing Vs Modern Infrastructure Market Value Share Brochure PDF
This slide illustrates the growth rate of market value share of cloud data center compared to traditional data centers. It analyzes the percentage rate of traditional, public and private data centers. Pitch your topic with ease and precision using this Standard Computing Vs Modern Infrastructure Market Value Share Brochure PDF. This layout presents information on Cloud Market Share, Market Value Share, Growth. It is also available for immediate download and adjustment. So, changes can be made in the color, design, graphics or any other component to create a unique layout.
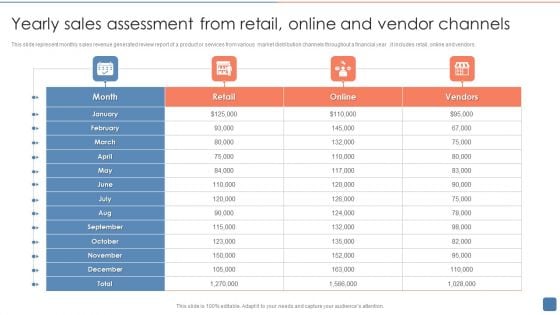
Yearly Sales Assessment From Retail Online And Vendor Channels Summary PDF
This slide represent monthly sales revenue generated review report of a product or services from various market distribution channels throughout a financial year .it includes retail, online and vendors. Pitch your topic with ease and precision using this Yearly Sales Assessment From Retail Online And Vendor Channels Summary PDF. This layout presents information on Retail, Yearly Sales Assessment, Online And Vendor Channels. It is also available for immediate download and adjustment. So, changes can be made in the color, design, graphics or any other component to create a unique layout.
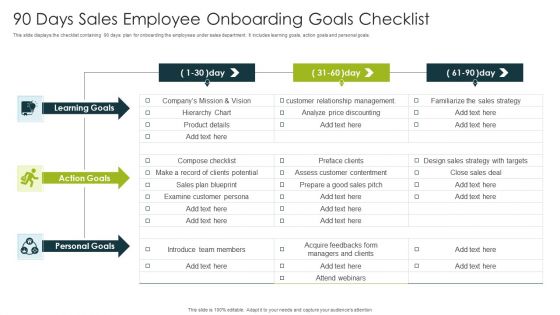
90 Days Sales Employee Onboarding Goals Checklist Ppt Pictures Master Slide PDF
This slide displays the checklist containing 90 days plan for onboarding the employees under sales department. It includes learning goals, action goals and personal goals. Pitch your topic with ease and precision using this 90 Days Sales Employee Onboarding Goals Checklist Ppt Pictures Master Slide PDF. This layout presents information on Learning Goals, Action Goals, Personal Goals. It is also available for immediate download and adjustment. So, changes can be made in the color, design, graphics or any other component to create a unique layout.
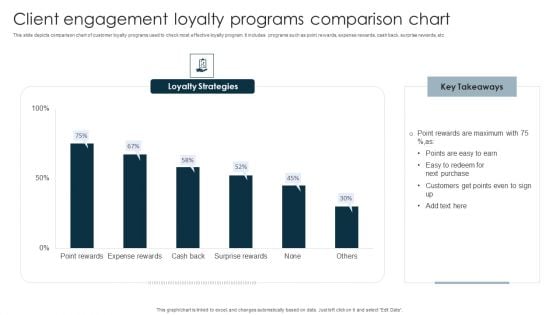
Client Engagement Loyalty Programs Comparison Chart Infographics PDF
This slide depicts comparison chart of customer loyalty programs used to check most effective loyalty program. It includes programs such as point rewards, expense rewards, cash back, surprise rewards, etc. Pitch your topic with ease and precision using this Client Engagement Loyalty Programs Comparison Chart Infographics PDF. This layout presents information on Point Rewards, Next Purchase, Customers. It is also available for immediate download and adjustment. So, changes can be made in the color, design, graphics or any other component to create a unique layout.
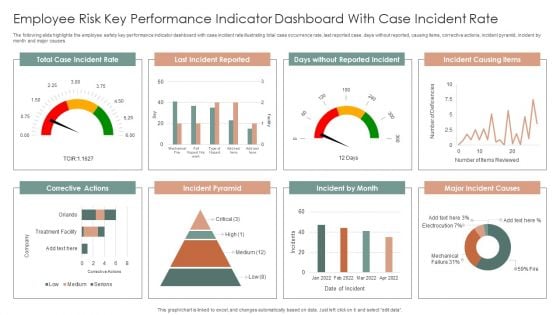
Employee Risk Key Performance Indicator Dashboard With Case Incident Rate Ppt Professional Information PDF
The following slide highlights the employee safety key performance indicator dashboard with case incident rate illustrating total case occurrence rate, last reported case, days without reported, causing items, corrective actions, incident pyramid, incident by month and major causes. Pitch your topic with ease and precision using this Employee Risk Key Performance Indicator Dashboard With Case Incident Rate Ppt Professional Information PDF. This layout presents information on Total Case, Incident Rate, Last Incident Reported, Incident Causing Items. It is also available for immediate download and adjustment. So, changes can be made in the color, design, graphics or any other component to create a unique layout.

Patient Health And Risk Key Performance Indicator Dashboard Ppt Infographic Template Summary PDF
The following slide highlights the patient health and safety key performance indicator dashboard illustrating admission by department, admission by cost, patient satisfaction, total patients, operations cost, patient density, total staff, waiting time, treatment satisfaction and treatment confidence. Pitch your topic with ease and precision using this Patient Health And Risk Key Performance Indicator Dashboard Ppt Infographic Template Summary PDF. This layout presents information on Admission By Department, Admission Vs Cost, Patient Satisfaction. It is also available for immediate download and adjustment. So, changes can be made in the color, design, graphics or any other component to create a unique layout.
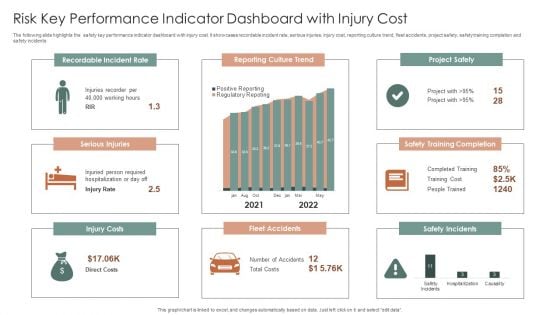
Risk Key Performance Indicator Dashboard With Injury Cost Ppt Summary Brochure PDF
The following slide highlights the safety key performance indicator dashboard with injury cost. It showcases recordable incident rate, serious injuries, injury cost, reporting culture trend, fleet accidents, project safety, safety training completion and safety incidents. Pitch your topic with ease and precision using this Risk Key Performance Indicator Dashboard With Injury Cost Ppt Summary Brochure PDF. This layout presents information on Recordable Incident Rate, Reporting Culture Trend, Project Safety. It is also available for immediate download and adjustment. So, changes can be made in the color, design, graphics or any other component to create a unique layout.
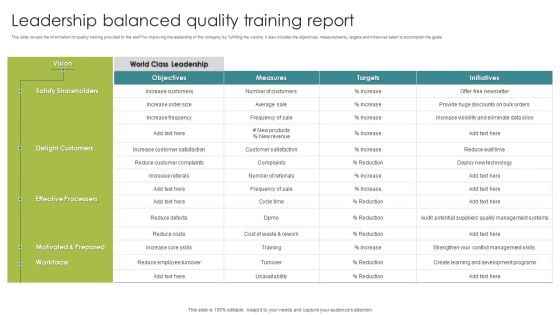
Leadership Balanced Quality Training Report Ppt Infographic Template Show PDF
This slide covers the information on quality training provided to the staff for improving the leadership of the company by fulfilling the visions. It also includes the objectives, measurements, targets and initiatives taken to accomplish the goals. Pitch your topic with ease and precision using this Leadership Balanced Quality Training Report Ppt Infographic Template Show PDF. This layout presents information on Satisfy Shareholders, Delight Customers, Effective Processers. It is also available for immediate download and adjustment. So, changes can be made in the color, design, graphics or any other component to create a unique layout.
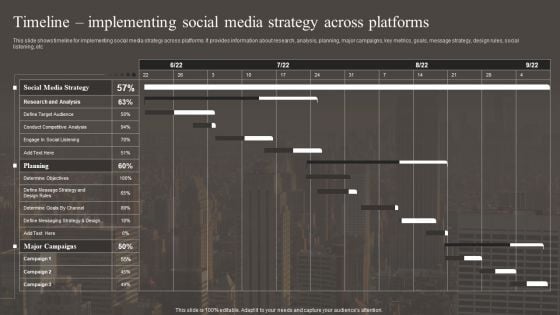
Timeline Implementing Social Media Strategy Across Platforms Background PDF
This slide shows timeline for implementing social media strategy across platforms. It provides information about research, analysis, planning, major campaigns, key metrics, goals, message strategy, design rules, social listening, etc. Deliver and pitch your topic in the best possible manner with this Timeline Implementing Social Media Strategy Across Platforms Background PDF. Use them to share invaluable insights on Social Media Strategy, Research And Analysis, Planning and impress your audience. This template can be altered and modified as per your expectations. So, grab it now.
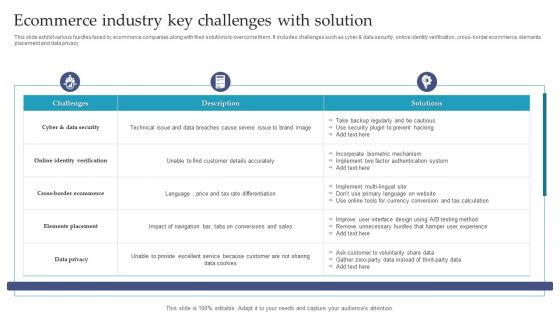
Ecommerce Industry Key Challenges With Solution Ppt Pictures Background PDF
This slide exhibit various hurdles faced by ecommerce companies along with their solutions to overcome them. It includes challenges such as cyber and data security, online identity verification, cross-border ecommerce, elements placement and data privacy. Pitch your topic with ease and precision using this Ecommerce Industry Key Challenges With Solution Ppt Pictures Background PDF. This layout presents information on Online Identity Verification, Cross Border Ecommerce, Elements Placement. It is also available for immediate download and adjustment. So, changes can be made in the color, design, graphics or any other component to create a unique layout.
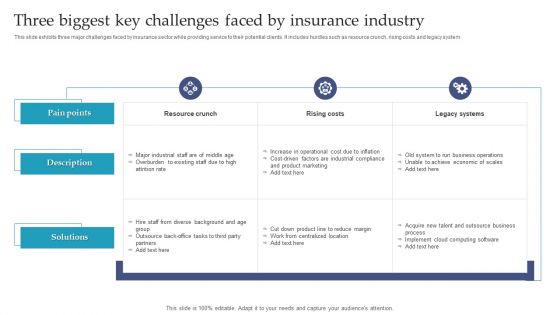
Three Biggest Key Challenges Faced By Insurance Industry Ppt Portfolio Outline PDF
This slide exhibits three major challenges faced by insurance sector while providing service to their potential clients. It includes hurdles such as resource crunch, rising costs and legacy system. Pitch your topic with ease and precision using this Three Biggest Key Challenges Faced By Insurance Industry Ppt Portfolio Outline PDF. This layout presents information on Resource Crunch, Rising Costs, Legacy Systems. It is also available for immediate download and adjustment. So, changes can be made in the color, design, graphics or any other component to create a unique layout.
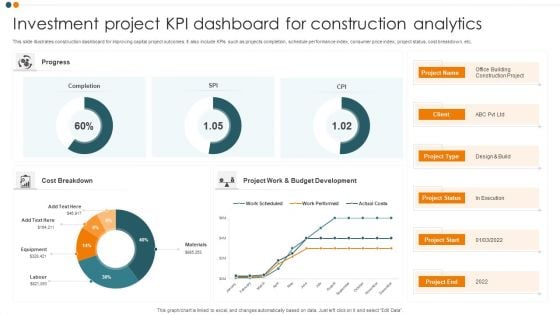
Investment Project KPI Dashboard For Construction Analytics Background PDF
This slide illustrates construction dashboard for improving capital project outcomes. It also include KPIs such as projects completion, schedule performance index, consumer price index, project status, cost breakdown, etc. Pitch your topic with ease and precision using this Investment Project KPI Dashboard For Construction Analytics Background PDF. This layout presents information on Cost Breakdown, Completion, Progress. It is also available for immediate download and adjustment. So, changes can be made in the color, design, graphics or any other component to create a unique layout.
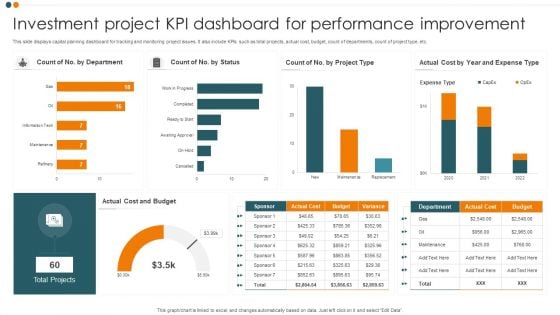
Investment Project KPI Dashboard For Performance Improvement Guidelines PDF
This slide displays capital planning dashboard for tracking and monitoring project issues. It also include KPIs such as total projects, actual cost, budget, count of departments, count of project type, etc. Pitch your topic with ease and precision using this Investment Project KPI Dashboard For Performance Improvement Guidelines PDF. This layout presents information on Cost And Budget, Total Projects, Expense Type. It is also available for immediate download and adjustment. So, changes can be made in the color, design, graphics or any other component to create a unique layout.
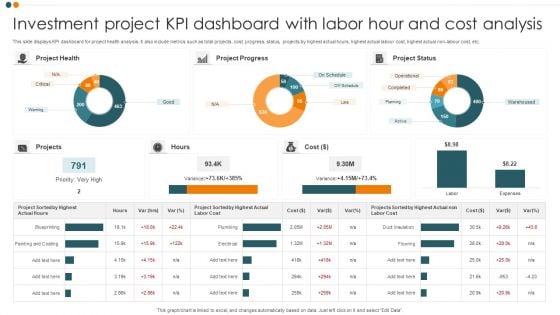
Investment Project KPI Dashboard With Labor Hour And Cost Analysis Portrait PDF
This slide displays KPI dashboard for project health analysis. It also include metrics such as total projects, cost, progress, status, projects by highest actual hours, highest actual labour cost, highest actual non-labour cost, etc. Pitch your topic with ease and precision using this Investment Project KPI Dashboard With Labor Hour And Cost Analysis Portrait PDF. This layout presents information on Project Health, Project Progress, Project Status. It is also available for immediate download and adjustment. So, changes can be made in the color, design, graphics or any other component to create a unique layout.
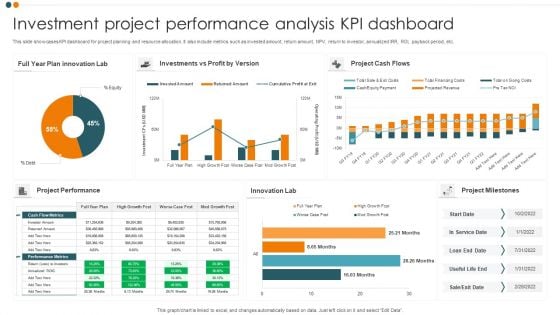
Investment Project Performance Analysis KPI Dashboard Professional PDF
This slide showcases KPI dashboard for project planning and resource allocation. It also include metrics such as invested amount, return amount, NPV, return to investor, annualized IRR, ROI, payback period, etc. Pitch your topic with ease and precision using this Investment Project Performance Analysis KPI Dashboard Professional PDF. This layout presents information on Project Cash Flows, Project Performance, Innovation Lab. It is also available for immediate download and adjustment. So, changes can be made in the color, design, graphics or any other component to create a unique layout.
Monthly Project Investment Expense Tracking KPI Dashboard Themes PDF
This slide showcases KPI dashboard for analysing the variance between billed and budgeted expenses. It also include metrics such as project budget, potential, billed, cost, margin billed vs. budget labour cost, hours details by resources, etc. Pitch your topic with ease and precision using this Monthly Project Investment Expense Tracking KPI Dashboard Themes PDF. This layout presents information on Project Summary, Sales Potential. It is also available for immediate download and adjustment. So, changes can be made in the color, design, graphics or any other component to create a unique layout.
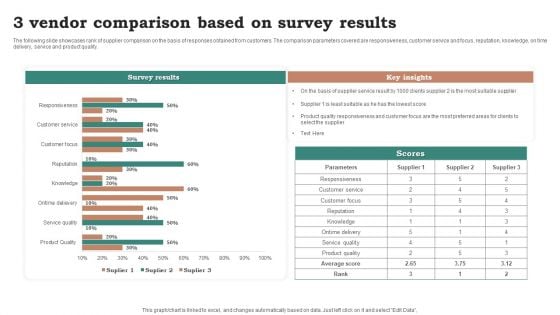
3 Vendor Comparison Based On Survey Results Ppt Ideas Graphic Tips PDF
The following slide showcases rank of supplier comparison on the basis of responses obtained from customers. The comparison parameters covered are responsiveness, customer service and focus, reputation, knowledge, on time delivery, service and product quality. Pitch your topic with ease and precision using this 3 Vendor Comparison Based On Survey Results Ppt Ideas Graphic Tips PDF. This layout presents information on Survey Results, Key Insights, Parameters. It is also available for immediate download and adjustment. So, changes can be made in the color, design, graphics or any other component to create a unique layout.

3 Vendor Price Comparison Sheet Ppt Inspiration Display PDF
The following slide showcases comparison of price between various suppliers to identify the most suitable. The comparison is done on the basis of chair, table, cabinet, desk and cupboard cost. Pitch your topic with ease and precision using this 3 Vendor Price Comparison Sheet Ppt Inspiration Display PDF. This layout presents information on Price Comparison, Supplier, Particulars. It is also available for immediate download and adjustment. So, changes can be made in the color, design, graphics or any other component to create a unique layout.
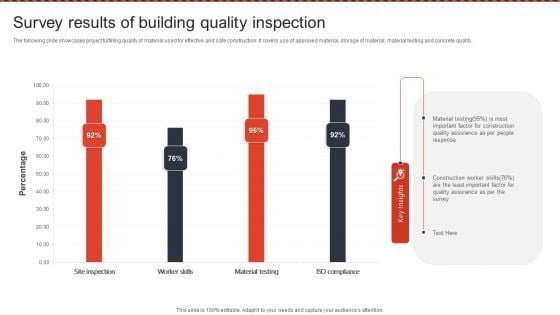
Survey Results Of Building Quality Inspection Ppt PowerPoint Presentation File Show PDF
The following slide showcases project fulfilling quality of material used for effective and safe construction. It covers use of approved material, storage of material, material testing and concrete quality. Pitch your topic with ease and precision using this Survey Results Of Building Quality Inspection Ppt PowerPoint Presentation File Show PDF. This layout presents information on Material Testing, Quality Assurance, Construction Worker Skills. It is also available for immediate download and adjustment. So, changes can be made in the color, design, graphics or any other component to create a unique layout.
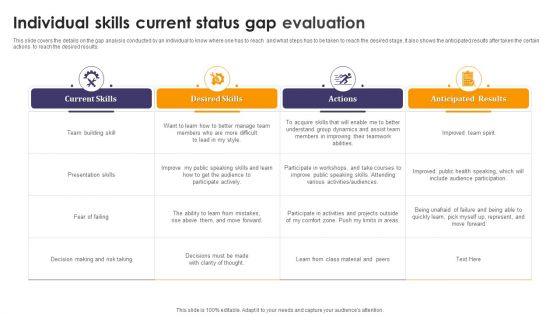
Individual Skills Current Status Gap Evaluation Ppt Infographic Template Diagrams PDF
This slide covers the details on the gap analysis conducted by an individual to know where one has to reach and what steps has to be taken to reach the desired stage. It also shows the anticipated results after taken the certain actions to reach the desired results. Pitch your topic with ease and precision using this Individual Skills Current Status Gap Evaluation Ppt Infographic Template Diagrams PDF. This layout presents information on Current Skills, Desired Skills, Actions, Anticipated Results. It is also available for immediate download and adjustment. So, changes can be made in the color, design, graphics or any other component to create a unique layout.
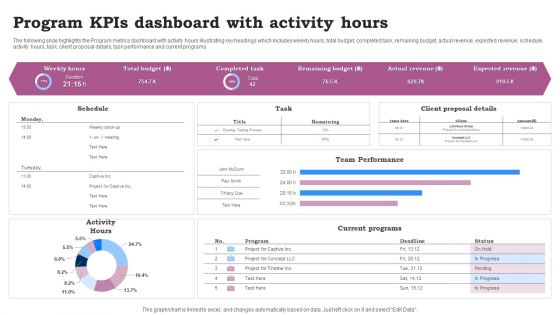
Program Kpis Dashboard With Activity Hours Ppt Infographics Clipart Images PDF
The following slide highlights the Program metrics dashboard with activity hours illustrating key headings which includes weekly hours, total budget, completed task, remaining budget, actual revenue, expected revenue, schedule, activity hours, task, client proposal details, task performance and current programs. Pitch your topic with ease and precision using this Program Kpis Dashboard With Activity Hours Ppt Infographics Clipart Images PDF. This layout presents information on Team Performance, Current Programs, Activity Hours. It is also available for immediate download and adjustment. So, changes can be made in the color, design, graphics or any other component to create a unique layout.
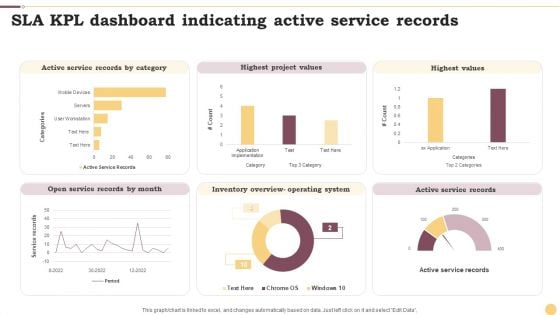
SLA KPL Dashboard Indicating Active Service Records Ppt Professional Graphics Example PDF
This graph or chart is linked to excel, and changes automatically based on data. Just left click on it and select Edit Data. Pitch your topic with ease and precision using this SLA KPL Dashboard Indicating Active Service Records Ppt Professional Graphics Example PDF. This layout presents information on Active Service Records, Highest Project Values, Highest Values. It is also available for immediate download and adjustment. So, changes can be made in the color, design, graphics or any other component to create a unique layout.
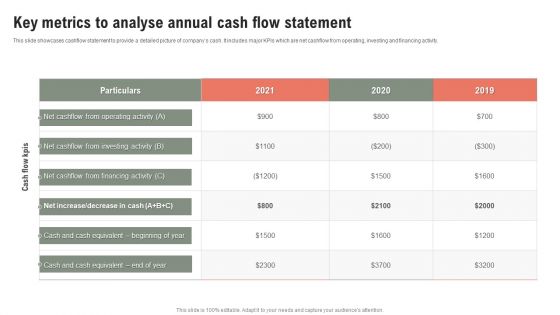
Key Metrics To Analyse Annual Cash Flow Statement Ppt Gallery Microsoft PDF
This slide showcases cashflow statement to provide a detailed picture of companys cash. It includes major KPIs which are net cashflow from operating, investing and financing activity. Pitch your topic with ease and precision using this Key Metrics To Analyse Annual Cash Flow Statement Ppt Gallery Microsoft PDF. This layout presents information on Net Cashflow, 2019 To 2021, Investing Activity. It is also available for immediate download and adjustment. So, changes can be made in the color, design, graphics or any other component to create a unique layout.
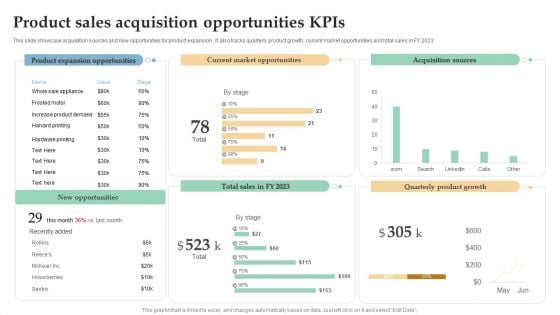
Product Sales Acquisition Opportunities Kpis Ppt Pictures Slide PDF
This slide showcase acquisition sources and new opportunities for product expansion . It also tracks quarterly product growth, current market opportunities and total sales in FY 2023. Pitch your topic with ease and precision using this Product Sales Acquisition Opportunities Kpis Ppt Pictures Slide PDF. This layout presents information on Product Expansion Opportunities, Current Market Opportunities, Acquisition Sources. It is also available for immediate download and adjustment. So, changes can be made in the color, design, graphics or any other component to create a unique layout.
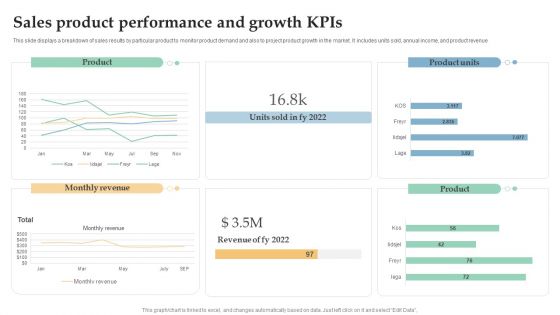
Sales Product Performance And Growth Kpis Ppt Layouts Mockup PDF
This slide displays a breakdown of sales results by particular product to monitor product demand and also to project product growth in the market. It includes units sold, annual income, and product revenue. Pitch your topic with ease and precision using this Sales Product Performance And Growth Kpis Ppt Layouts Mockup PDF. This layout presents information on Monthly Revenue, Product, Product Units. It is also available for immediate download and adjustment. So, changes can be made in the color, design, graphics or any other component to create a unique layout.
Consumer Journey Mapping Techniques Dashboard For Tracking Customer Service Team Performance Summary PDF
This slide covers the KPI dashboard for analyzing the performance of client support department. It includes metrics such as first call resolution, unresolved calls, average response rate, the best day to call, average time to solve issues, etc. Pitch your topic with ease and precision using this Consumer Journey Mapping Techniques Dashboard For Tracking Customer Service Team Performance Summary PDF. This layout presents information on Dashboard For Tracking Customer, Service Team Performance. It is also available for immediate download and adjustment. So, changes can be made in the color, design, graphics or any other component to create a unique layout.
Consumer Journey Mapping Techniques Dashboard For Tracking Social Media Platforms Introduction PDF
This slide covers the KPI dashboard for analyzing social media channels. It includes metrics such as social media followers, Facebook daily reach, Facebook engaged users and page impressions, etc. Pitch your topic with ease and precision using this Consumer Journey Mapping Techniques Dashboard For Tracking Social Media Platforms Introduction PDF. This layout presents information on Linkedin Key Metrics, Social Media Followers, Awareness. It is also available for immediate download and adjustment. So, changes can be made in the color, design, graphics or any other component to create a unique layout.
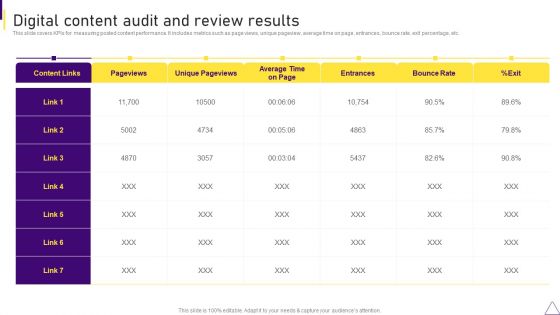
Consumer Journey Mapping Techniques Digital Content Audit And Review Results Graphics PDF
This slide covers KPIs for measuring posted content performance. It includes metrics such as page views, unique pageview, average time on page, entrances, bounce rate, exit percentage, etc. Pitch your topic with ease and precision using this Consumer Journey Mapping Techniques Digital Content Audit And Review Results Graphics PDF. This layout presents information on Digital Content Audit, Review Results. It is also available for immediate download and adjustment. So, changes can be made in the color, design, graphics or any other component to create a unique layout.

Consumer Journey Mapping Techniques Online Ad Campaign Performance Audit And Review Results Introduction PDF
This slide covers the digital camping effectiveness tracking sheet. It includes various details such as visits, new visits, bounce rate, pages or views, average visit duration, goal conversion rate, and goal completions. Pitch your topic with ease and precision using this Consumer Journey Mapping Techniques Online Ad Campaign Performance Audit And Review Results Introduction PDF. This layout presents information on Goal Completions, Goal Conversion Rate, Bounce Rate. It is also available for immediate download and adjustment. So, changes can be made in the color, design, graphics or any other component to create a unique layout.

Consumer Journey Mapping Techniques Referral Program Audit And Review Results Sample PDF
This slide covers the referral campaign results tracking sheet. It includes various details such as referral code, name, email, phone, referrals owed, count, rewards earned, promoter rewards redemption, rewards redeemed, etc. Pitch your topic with ease and precision using this Consumer Journey Mapping Techniques Referral Program Audit And Review Results Sample PDF. This layout presents information on Referral Program, Audit And Review Results. It is also available for immediate download and adjustment. So, changes can be made in the color, design, graphics or any other component to create a unique layout.
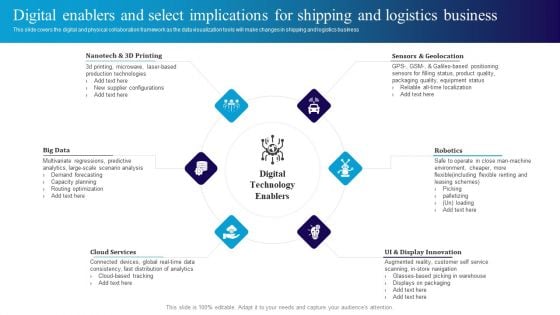
Deploying Automation In Logistics To Improve Digital Enablers And Select Implications Pictures PDF
Do you have an important presentation coming up Are you looking for something that will make your presentation stand out from the rest Look no further than Deploying Automation In Logistics To Improve Digital Enablers And Select Implications Pictures PDF. With our professional designs, you can trust that your presentation will pop and make delivering it a smooth process. And with Slidegeeks, you can trust that your presentation will be unique and memorable. So why wait Grab Deploying Automation In Logistics To Improve Digital Enablers And Select Implications Pictures PDF today and make your presentation stand out from the rest.

Social Media Content Promotion Playbook Ppt PowerPoint Presentation Complete Deck With Slides
This Social Media Content Promotion Playbook Ppt PowerPoint Presentation Complete Deck With Slides is designed to help you retain your audiences attention. This content-ready PowerPoint Template enables you to take your audience on a journey and share information in a way that is easier to recall. It helps you highlight the crucial parts of your work so that the audience does not get saddled with information download. Thisfourty six slide PPT Deck comes prepared with the graphs and charts you could need to showcase your information through visuals. You only need to enter your own data in them. Download this editable PowerPoint Theme and walk into that meeting with confidence.
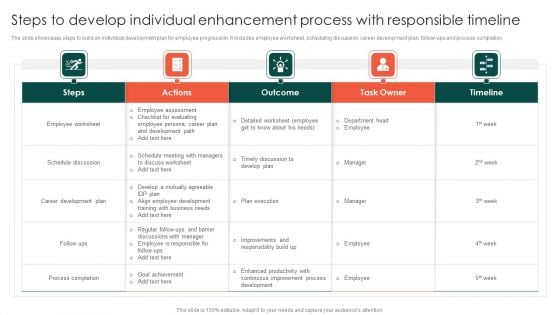
Steps To Develop Individual Enhancement Process With Responsible Timeline Slides PDF
The slide showcases steps to build an individual development plan for employee progression. It includes employee worksheet, scheduling discussion, career development plan, follow ups and process completion.Pitch your topic with ease and precision using this Steps To Develop Individual Enhancement Process With Responsible Timeline Slides PDF. This layout presents information on Employee Worksheet, Career Development, Process Completion. It is also available for immediate download and adjustment. So, changes can be made in the color, design, graphics or any other component to create a unique layout.
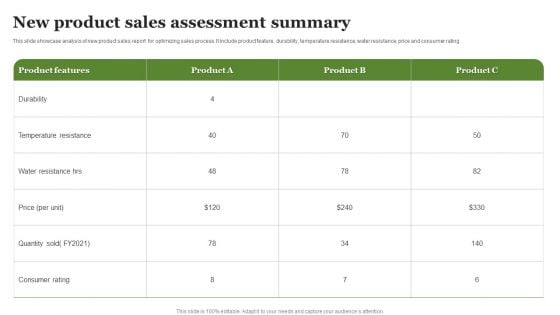
New Product Sales Assessment Summary Tips Ppt PowerPoint Presentation Visual Aids Example 2015 PDF
This slide showcase analysis of new product sales report for optimizing sales process. It include product feature, durability, temperature resistance, water resistance, price and consumer rating.Pitch your topic with ease and precision using this New Product Sales Assessment Summary Tips Ppt PowerPoint Presentation Visual Aids Example 2015 PDF. This layout presents information on New Product, Sales Assessment Summary. It is also available for immediate download and adjustment. So, changes can be made in the color, design, graphics or any other component to create a unique layout.
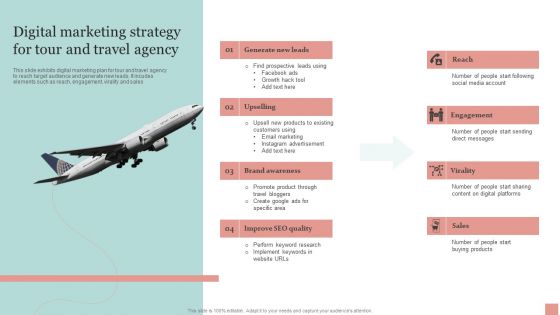
Digital Marketing Strategy For Tour And Travel Agency Ppt PowerPoint Presentation Professional Show PDF
This slide exhibits digital marketing plan for tour and travel agency to reach target audience and generate new leads. It incudes elements such as reach, engagement, virality and sales.Pitch your topic with ease and precision using this Digital Marketing Strategy For Tour And Travel Agency Ppt PowerPoint Presentation Professional Show PDF. This layout presents information on Brand Awareness, Engagement, Virality. It is also available for immediate download and adjustment. So, changes can be made in the color, design, graphics or any other component to create a unique layout.

Workforce Skill Gap Analysis And Evaluation Ppt PowerPoint Presentation Portfolio Format Ideas PDF
The slide provides a glance at employees skill gap analysis which help highlight areas for improvement and devise a plan for it. It includes skill description, current and desired skill level, action plan, timeframe, priority and notes.Pitch your topic with ease and precision using this Workforce Skill Gap Analysis And Evaluation Ppt PowerPoint Presentation Portfolio Format Ideas PDF. This layout presents information on Communicate Effectively, Communicate Effectively, Skill Development. It is also available for immediate download and adjustment. So, changes can be made in the color, design, graphics or any other component to create a unique layout.
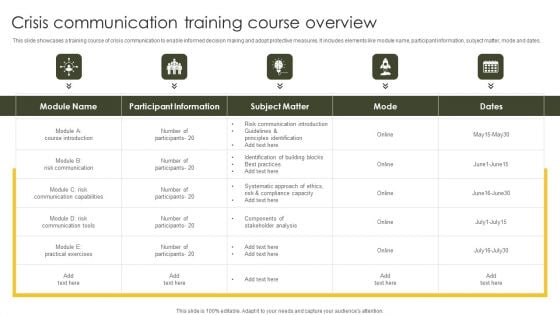
Crisis Communication Training Course Overview Professional PDF
This slide showcases a training course of crisis communication to enable informed decision making and adopt protective measures. It includes elements like module name, participant information, subject matter, mode and dates. Pitch your topic with ease and precision using this Crisis Communication Training Course Overview Professional PDF. This layout presents information on Participant Information, Risk Communication, Analysis. It is also available for immediate download and adjustment. So, changes can be made in the color, design, graphics or any other component to create a unique layout.
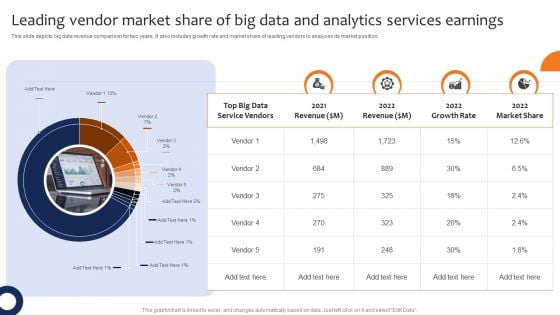
Leading Vendor Market Share Of Big Data And Analytics Services Earnings Professional PDF
This slide depicts big data revenue comparison for two years. It also includes growth rate and market share of leading vendors to analyses its market position. Pitch your topic with ease and precision using this Leading Vendor Market Share Of Big Data And Analytics Services Earnings Professional PDF. This layout presents information on Revenue, Growth Rate, Market Share. It is also available for immediate download and adjustment. So, changes can be made in the color, design, graphics or any other component to create a unique layout.
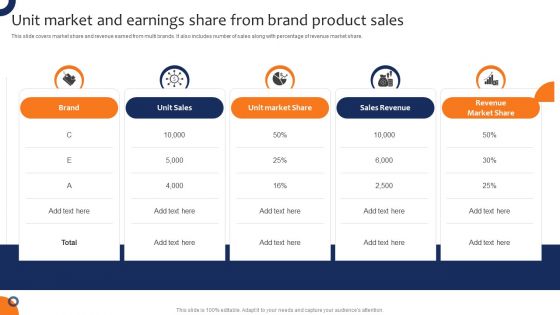
Unit Market And Earnings Share From Brand Product Sales Clipart PDF
This slide covers market share and revenue earned from multi brands. It also includes number of sales along with percentage of revenue market share. Pitch your topic with ease and precision using this Unit Market And Earnings Share From Brand Product Sales Clipart PDF. This layout presents information on Unit Sales, Unit Market Share, Sales Revenue. It is also available for immediate download and adjustment. So, changes can be made in the color, design, graphics or any other component to create a unique layout.
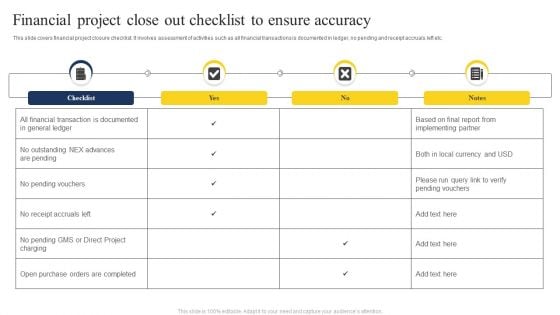
Financial Project Close Out Checklist To Ensure Accuracy Professional PDF
This slide covers financial project closure checklist. It involves assessment of activities such as all financial transactions is documented in ledger, no pending and receipt accruals left etc. Pitch your topic with ease and precision using this Financial Project Close Out Checklist To Ensure Accuracy Professional PDF. This layout presents information on Financial Transaction, Purchase, Implementing Partner. It is also available for immediate download and adjustment. So, changes can be made in the color, design, graphics or any other component to create a unique layout.
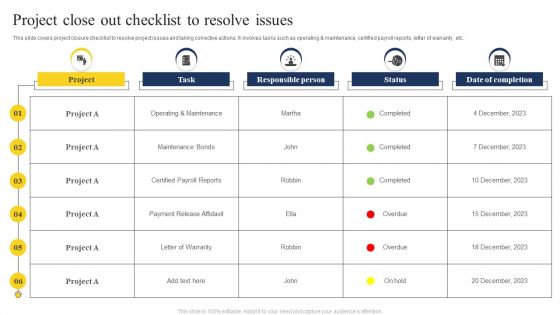
Project Close Out Checklist To Resolve Issues Template PDF
This slide covers project closure checklist to resolve project issues and taking corrective actions. It involves tasks such as operating and maintenance, certified payroll reports, letter of warranty, etc. Pitch your topic with ease and precision using this Project Close Out Checklist To Resolve Issues Template PDF. This layout presents information on Payment Release Affidavit, Operating And Maintenance, Project. It is also available for immediate download and adjustment. So, changes can be made in the color, design, graphics or any other component to create a unique layout.
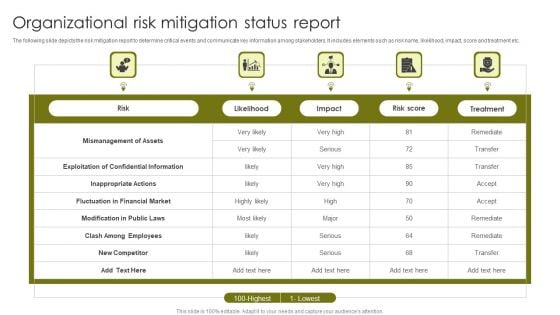
Organizational Risk Mitigation Status Report Pictures PDF
The following slide depicts the risk mitigation report to determine critical events and communicate key information among stakeholders. It includes elements such as risk name, likelihood, impact, score and treatment etc. Pitch your topic with ease and precision using this Organizational Risk Mitigation Status Report Pictures PDF. This layout presents information on Risk, Mismanagement Of Assets, Confidential Information. It is also available for immediate download and adjustment. So, changes can be made in the color, design, graphics or any other component to create a unique layout.


 Continue with Email

 Home
Home


