Organizational Change
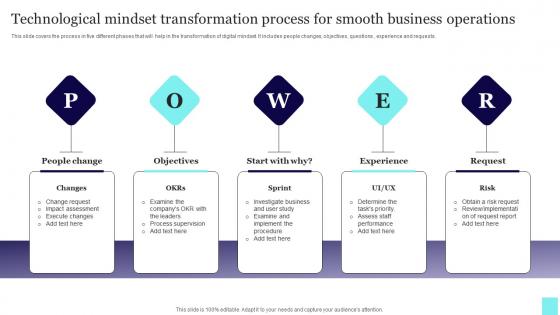
Technological Mindset Transformation Process For Smooth Business Operations Mockup Pdf
This slide covers the process in five different phases that will help in the transformation of digital mindset. It includes people changes, objectives, questions , experience and requests. Pitch your topic with ease and precision using this Technological Mindset Transformation Process For Smooth Business Operations Mockup Pdf. This layout presents information on People Change, Objectives, Experience. It is also available for immediate download and adjustment. So, changes can be made in the color, design, graphics or any other component to create a unique layout. This slide covers the process in five different phases that will help in the transformation of digital mindset. It includes people changes, objectives, questions , experience and requests.

Technology Transformation Analysis Chart With Comments Ppt PowerPoint Presentation Professional Show PDF
Pitch your topic with ease and precision using this technology transformation analysis chart with comments ppt powerpoint presentation professional show pdf. This layout presents information on desired digital change, priority, complexity, comments, value ranking. It is also available for immediate download and adjustment. So, changes can be made in the color, design, graphics or any other component to create a unique layout.
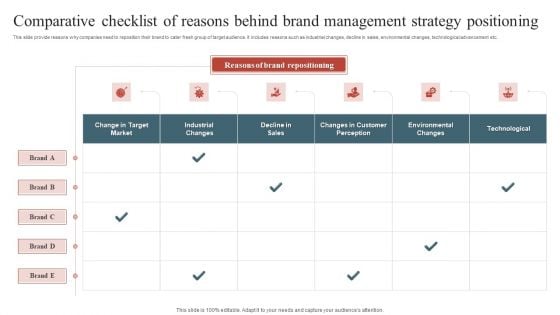
Comparative Checklist Of Reasons Behind Brand Management Strategy Positioning Introduction PDF
This slide provide reasons why companies need to reposition their brand to cater fresh group of target audience. It includes reasons such as industrial changes, decline in sales, environmental changes, technological advancement etc. Pitch your topic with ease and precision using this Comparative Checklist Of Reasons Behind Brand Management Strategy Positioning Introduction PDF. This layout presents information on Target Market, Industrial Changes, Environmental Changes, Technological. It is also available for immediate download and adjustment. So, changes can be made in the color, design, graphics or any other component to create a unique layout.
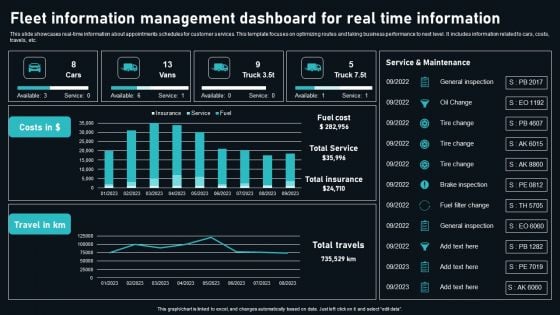
Fleet Information Management Dashboard For Real Time Information Graphics PDF
This slide showcases real time information about appointments schedules for customer services. This template focuses on optimizing routes and taking business performance to next level. It includes information related to cars, costs, travels, etc. Pitch your topic with ease and precision using this Fleet Information Management Dashboard For Real Time Information Graphics PDF. This layout presents information on General Inspection, Oil Change, Tire Change. It is also available for immediate download and adjustment. So, changes can be made in the color, design, graphics or any other component to create a unique layout.

Timeline Plan For Deploying HMS Designs PDF
The following slide showcases phases of hospital management system to maintain electronic patient record. It presents information related to receiving implementation idea, establishing structure, etc. Pitch your topic with ease and precision using this Timeline Plan For Deploying HMS Designs PDF. This layout presents information on Strategies, Develop Organizational, Establish Structure. It is also available for immediate download and adjustment. So, changes can be made in the color, design, graphics or any other component to create a unique layout.
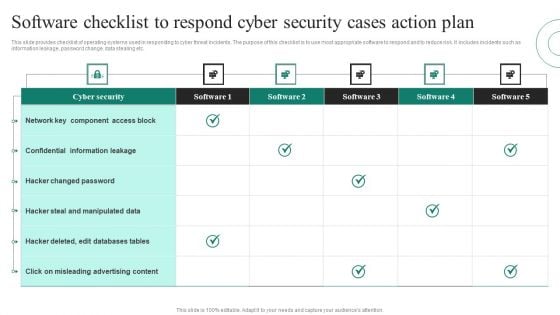
Software Checklist To Respond Cyber Security Cases Action Plan Ppt PowerPoint Presentation File Visuals PDF
This slide provides checklist of operating systems used in responding to cyber threat incidents. The purpose of this checklist is to use most appropriate software to respond and to reduce risk. It includes incidents such as information leakage, password change, data stealing etc. Pitch your topic with ease and precision using this Software Checklist To Respond Cyber Security Cases Action Plan Ppt PowerPoint Presentation File Visuals PDF. This layout presents information on Cyber Security, Confidential Information Leakage, Hacker Changed Password. It is also available for immediate download and adjustment. So, changes can be made in the color, design, graphics or any other component to create a unique layout.
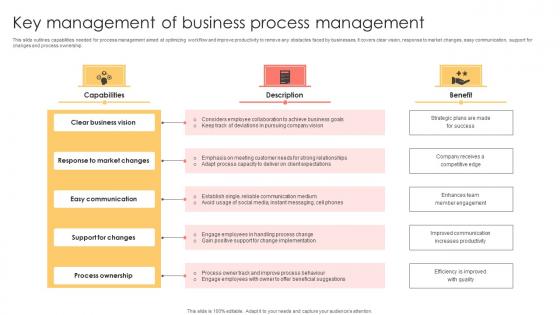
Key Management Of Business Process Management Rules Pdf
This slide outlines capabilities needed for process management aimed at optimizing workflow and improve productivity to remove any obstacles faced by businesses. It covers clear vision, response to market changes, easy communication, support for changes and process ownership. Pitch your topic with ease and precision using this Key Management Of Business Process Management Rules Pdf. This layout presents information on Clear Business Vision, Easy Communication, Support Changes . It is also available for immediate download and adjustment. So, changes can be made in the color, design, graphics or any other component to create a unique layout. This slide outlines capabilities needed for process management aimed at optimizing workflow and improve productivity to remove any obstacles faced by businesses. It covers clear vision, response to market changes, easy communication, support for changes and process ownership.
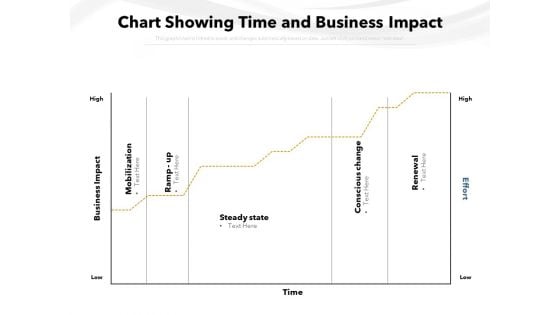
Chart Showing Time And Business Impact Ppt PowerPoint Presentation Example 2015 PDF
Pitch your topic with ease and precision using this chart showing time and business impact ppt powerpoint presentation example 2015 pdf. This layout presents information on business impact mobilization, ramp up, steady state, time, conscious change, renewal, effort. It is also available for immediate download and adjustment. So, changes can be made in the color, design, graphics or any other component to create a unique layout.
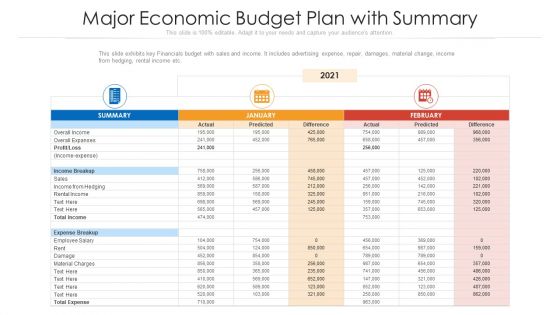
Major Economic Budget Plan With Summary Ppt PowerPoint Presentation File Layout Ideas PDF
This slide exhibits key Financials budget with sales and income. It includes advertising expense, repair, damages, material change, income from hedging, rental income etc. Pitch your topic with ease and precision using this major economic budget plan with summary ppt powerpoint presentation file layout ideas pdf. This layout presents information on sales, expanses, employee salary. It is also available for immediate download and adjustment. So, changes can be made in the color, design, graphics or any other component to create a unique layout.

Carbon Emissions Of Countries Bar Graph Professional PDF
This slide depicts emissions chart of various countries to avoid the worst impacts of climate change. It includes countries and carbon emissions in million metric tons. Pitch your topic with ease and precision using this Carbon Emissions Of Countries Bar Graph Professional PDF. This layout presents information on Maximum Production, Consumer Goods, Carbon Emissions. It is also available for immediate download and adjustment. So, changes can be made in the color, design, graphics or any other component to create a unique layout.
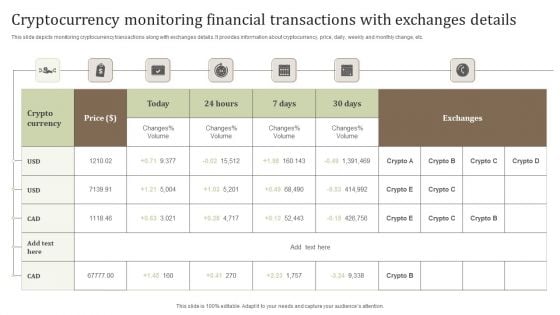
Cryptocurrency Monitoring Financial Transactions With Exchanges Details Graphics PDF
This slide depicts monitoring cryptocurrency transactions along with exchanges details. It provides information about cryptocurrency, price, daily, weekly and monthly change, etc.Pitch your topic with ease and precision using this Cryptocurrency Monitoring Financial Transactions With Exchanges Details Graphics PDF. This layout presents information on Cryptocurrency Monitoring, Financial Transactions, Exchanges Details. It is also available for immediate download and adjustment. So, changes can be made in the color, design, graphics or any other component to create a unique layout.
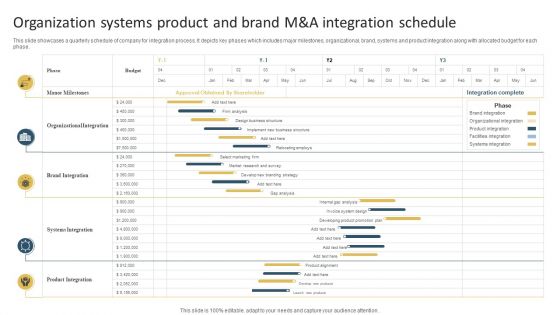
Organization Systems Product And Brand M And A Integration Schedule Elements PDF
This slide showcases a quarterly schedule of company for integration process. It depicts key phases which includes major milestones, organizational, brand, systems and product integration along with allocated budget for each phase. Pitch your topic with ease and precision using this Organization Systems Product And Brand M And A Integration Schedule Elements PDF. This layout presents information on Brand Integration, Systems Integration, Product Integration. It is also available for immediate download and adjustment. So, changes can be made in the color, design, graphics or any other component to create a unique layout.
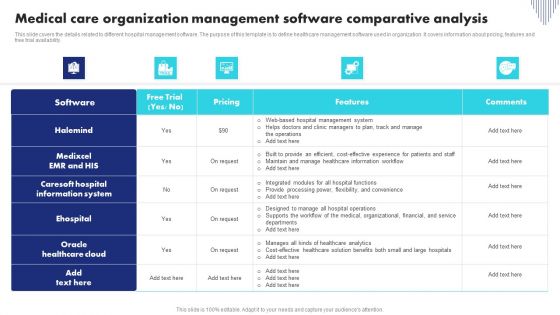
Medical Care Organization Management Software Comparative Analysis Structure PDF
This slide covers the details related to different hospital management software. The purpose of this template is to define healthcare management software used in organization. It covers information about pricing, features and free trial availability. Pitch your topic with ease and precision using this Medical Care Organization Management Software Comparative Analysis Structure PDF. This layout presents information on Information System, Organizational, Healthcare Analytics. It is also available for immediate download and adjustment. So, changes can be made in the color, design, graphics or any other component to create a unique layout.
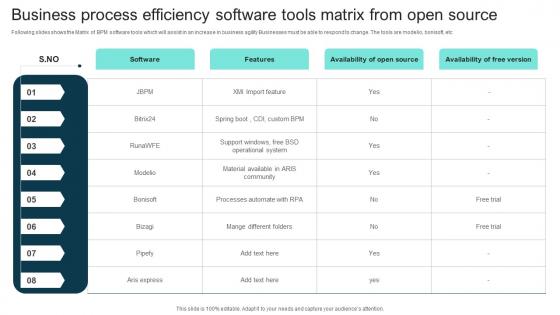
Business Process Efficiency Software Tools Matrix From Open Source Introduction Pdf
Following slides shows the Matrix of BPM software tools which will assist in an increase in business agility Businesses must be able to respond to change. The tools are modelio, bonisoft, etc Pitch your topic with ease and precision using this Business Process Efficiency Software Tools Matrix From Open Source Introduction Pdf This layout presents information on Software, Features, Availability Of Open Source It is also available for immediate download and adjustment. So, changes can be made in the color, design, graphics or any other component to create a unique layout. Following slides shows the Matrix of BPM software tools which will assist in an increase in business agility Businesses must be able to respond to change. The tools are modelio, bonisoft, etc
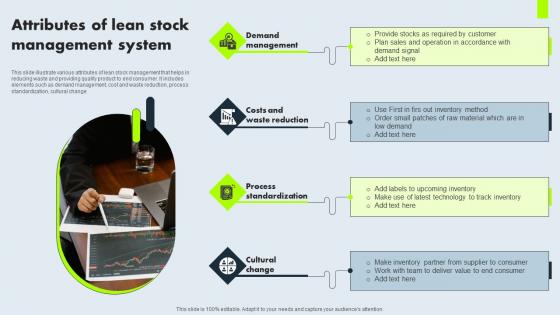
Attributes Of Lean Stock Management System Professional Pdf
This slide illustrate various attributes of lean stock management that helps in reducing waste and providing quality product to end consumer. It includes elements such as demand management, cost and waste reduction, process standardization, cultural change. Pitch your topic with ease and precision using this Attributes Of Lean Stock Management System Professional Pdf. This layout presents information on Demand Management, Costs And Waste Reduction, Process Standardization. It is also available for immediate download and adjustment. So, changes can be made in the color, design, graphics or any other component to create a unique layout. This slide illustrate various attributes of lean stock management that helps in reducing waste and providing quality product to end consumer. It includes elements such as demand management, cost and waste reduction, process standardization, cultural change.
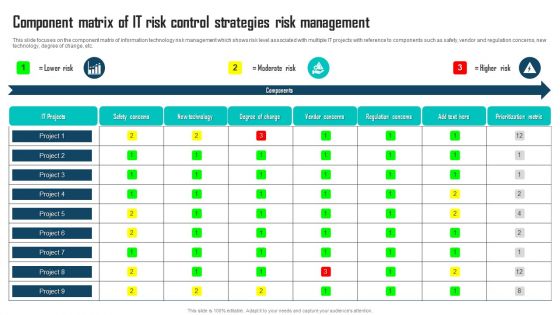
Component Matrix Of IT Risk Control Strategies Risk Management Guidelines PDF
This slide focuses on the component matrix of information technology risk management which shows risk level associated with multiple IT projects with reference to components such as safety, vendor and regulation concerns, new technology, degree of change, etc. Pitch your topic with ease and precision using this Component Matrix Of IT Risk Control Strategies Risk Management Guidelines PDF. This layout presents information on IT Projects, Moderate Risk, Lower Risk, Higher Risk. It is also available for immediate download and adjustment. So, changes can be made in the color, design, graphics or any other component to create a unique layout.
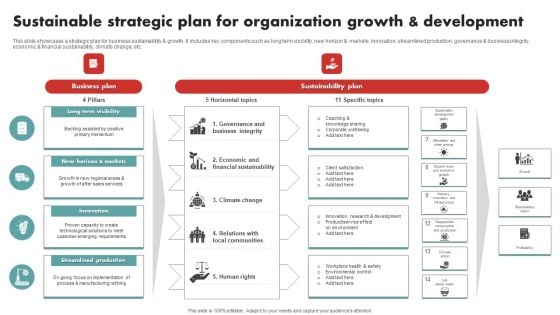
Sustainable Strategic Plan For Organization Growth And Development Microsoft PDF
This slide showcases a strategic plan for business sustainability and growth. It includes key components such as long term visibility, new horizon and markets, innovation, streamlined production, governance and business integrity, economic and financial sustainability, climate change, etc. Pitch your topic with ease and precision using this Sustainable Strategic Plan For Organization Growth And Development Microsoft PDF This layout presents information on Business Plan, Sustainability Plan, Specific Topics. It is also available for immediate download and adjustment. So, changes can be made in the color, design, graphics or any other component to create a unique layout.
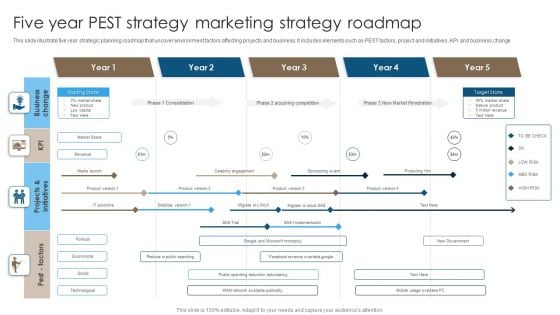
Five Year PEST Strategy Marketing Strategy Roadmap Structure PDF
This slide illustrate five year strategic planning roadmap that uncover environment factors affecting projects and business. It includes elements such as PEST factors, project and initiatives, KPI and business change. Pitch your topic with ease and precision using this Five Year PEST Strategy Marketing Strategy Roadmap Structure PDF. This layout presents information on Acquiring Competition, New Market Penetration, Consolidation. It is also available for immediate download and adjustment. So, changes can be made in the color, design, graphics or any other component to create a unique layout.
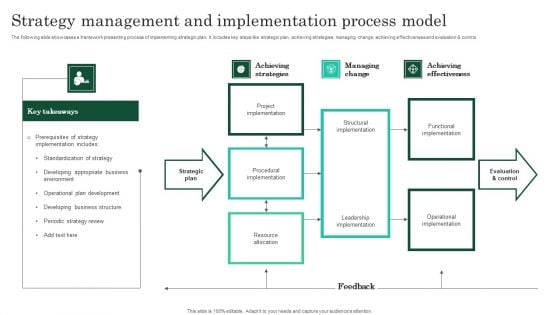
Strategy Management And Implementation Process Model Infographics PDF
The following slide showcases a framework presenting process of implementing strategic plan. It includes key steps like strategic plan, achieving strategies, managing change, achieving effectiveness and evaluation and control. Pitch your topic with ease and precision using this Strategy Management And Implementation Process Model Infographics PDF. This layout presents information on Operational Plan Development, Developing Business Structure, Periodic Strategy Review. It is also available for immediate download and adjustment. So, changes can be made in the color, design, graphics or any other component to create a unique layout.
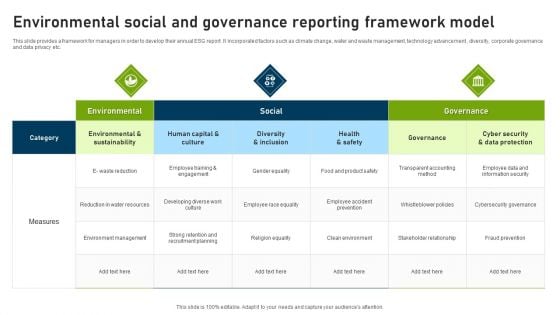
Environmental Social And Governance Reporting Framework Model Demonstration PDF
This slide provides a framework for managers in order to develop their annual ESG report. It incorporated factors such as climate change, water and waste management, technology advancement , diversity, corporate governance and data privacy etc. Pitch your topic with ease and precision using this Environmental Social And Governance Reporting Framework Model Demonstration PDF. This layout presents information on Environmental, Social, Measures. It is also available for immediate download and adjustment. So, changes can be made in the color, design, graphics or any other component to create a unique layout.
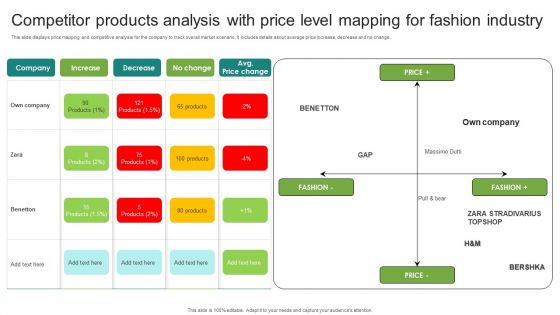
Competitor Products Analysis With Price Level Mapping For Fashion Industry Mockup PDF
This slide displays price mapping and competitive analysis for the company to track overall market scenario. It includes details about average price increase, decrease and no change. Pitch your topic with ease and precision using this Competitor Products Analysis With Price Level Mapping For Fashion Industry Mockup PDF. This layout presents information on Company, Increase, Decrease. It is also available for immediate download and adjustment. So, changes can be made in the color, design, graphics or any other component to create a unique layout.
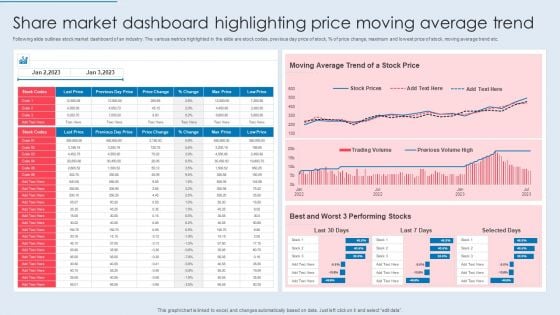
Share Market Dashboard Highlighting Price Moving Average Trend Themes PDF
Following slide outlines stock market dashboard of an industry. The various metrics highlighted in the slide are stock codes, previous day price of stock, percent of price change, maximum and lowest price of stock, moving average trend etc. Pitch your topic with ease and precision using this Share Market Dashboard Highlighting Price Moving Average Trend Themes PDF. This layout presents information on Moving Average, Stock Price, Performing Stocks. It is also available for immediate download and adjustment. So, changes can be made in the color, design, graphics or any other component to create a unique layout.
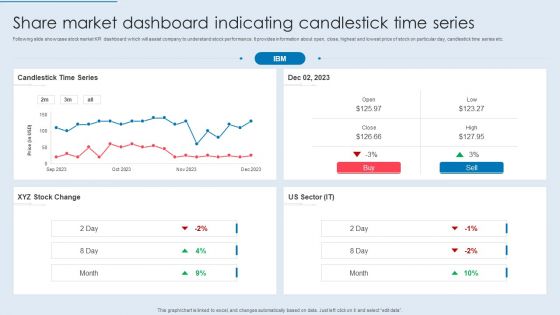
Share Market Dashboard Indicating Candlestick Time Series Formats PDF
Following slide showcase stock market KPI dashboard which will assist company to understand stock performance. It provides information about open, close, highest and lowest price of stock on particular day, candlestick time series etc. Pitch your topic with ease and precision using this Share Market Dashboard Indicating Candlestick Time Series Formats PDF. This layout presents information on Candlestick Time Series, Stock Change, US Sector. It is also available for immediate download and adjustment. So, changes can be made in the color, design, graphics or any other component to create a unique layout.
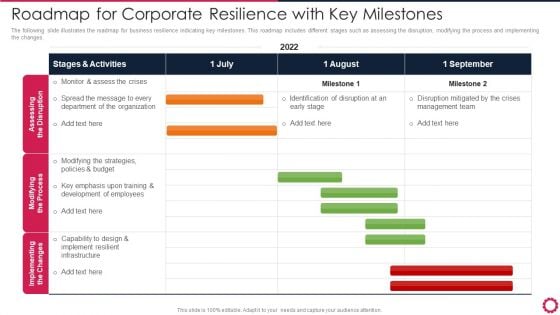
Roadmap For Corporate Resilience With Key Milestones Infographics PDF
The following slide illustrates the roadmap for business resilience indicating key milestones. This roadmap includes different stages such as assessing the disruption, modifying the process and implementing the changes. Pitch your topic with ease and precision using this Roadmap For Corporate Resilience With Key Milestones Infographics PDF. This layout presents information on Implementing The Changes, Modifying The Process, Assessing The Disruption. It is also available for immediate download and adjustment. So, changes can be made in the color, design, graphics or any other component to create a unique layout.
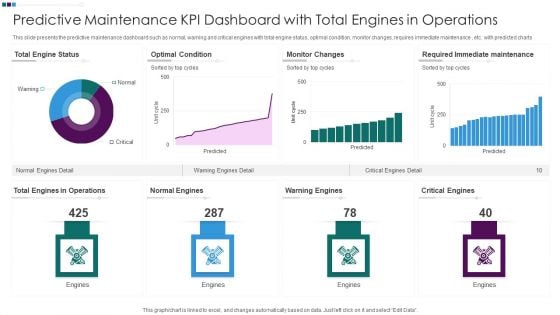
Predictive Maintenance KPI Dashboard With Total Engines In Operations Ppt Professional Inspiration PDF
This slide presents the predictive maintenance dashboard such as normal, warning and critical engines with total engine status, optimal condition, monitor changes, requires immediate maintenance , etc. with predicted charts. Pitch your topic with ease and precision using this Predictive Maintenance KPI Dashboard With Total Engines In Operations Ppt Professional Inspiration PDF. This layout presents information on Total Engine Status, Optimal Condition Monitor, Changes Warning Engines, Required Immediate Maintenance. It is also available for immediate download and adjustment. So, changes can be made in the color, design, graphics or any other component to create a unique layout.
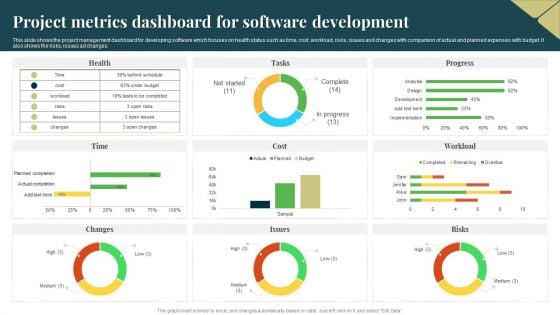
Project Metrics Dashboard For Software Development Designs PDF
This slide shows the project management dashboard for developing software which focuses on health status such as time, cost, workload, risks, issues and changes with comparison of actual and planned expenses with budget. It also shows the risks, issues ad changes. Pitch your topic with ease and precision using this Project Metrics Dashboard For Software Development Designs PDF. This layout presents information on Risks, Budget, Cost. It is also available for immediate download and adjustment. So, changes can be made in the color, design, graphics or any other component to create a unique layout.
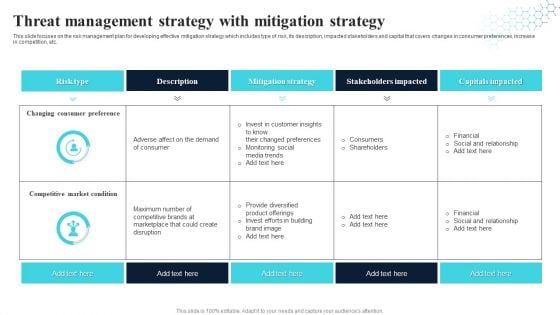
Threat Management Strategy With Mitigation Strategy Designs PDF
This slide focuses on the risk management plan for developing effective mitigation strategy which includes type of risk, its description, impacted stakeholders and capital that covers changes in consumer preferences, increase in competition, etc. Pitch your topic with ease and precision using this Threat Management Strategy With Mitigation Strategy Designs PDF. This layout presents information on Changing Consumer Preference, Competitive Market Condition, Capitals Impacted. It is also available for immediate download and adjustment. So, changes can be made in the color, design, graphics or any other component to create a unique layout.
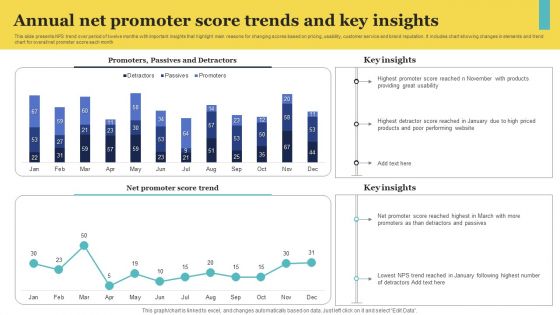
Annual Net Promoter Score Trends And Key Insights Professional PDF
This slide presents NPS trend over period of twelve months with important insights that highlight main reasons for changing scores based on pricing, usability, customer service and brand reputation. It includes chart showing changes in elements and trend chart for overall net promoter score each month Pitch your topic with ease and precision using this Annual Net Promoter Score Trends And Key Insights Professional PDF. This layout presents information on Key Insights, Score Trend, Detractors. It is also available for immediate download and adjustment. So, changes can be made in the color, design, graphics or any other component to create a unique layout.

Technology And Processes With DEI Maturity Framework Information Pdf
This slide illustrates changes in technologies, talent and processes with higher diversity and inclusion in a business. It includes stages such as stable, efficient, predictive, etc. Pitch your topic with ease and precision using this Technology And Processes With DEI Maturity Framework Information Pdf. This layout presents information on Human Only Workforce, Agile Workforce At Scale, DEI Maturity Framework. It is also available for immediate download and adjustment. So, changes can be made in the color, design, graphics or any other component to create a unique layout. This slide illustrates changes in technologies, talent and processes with higher diversity and inclusion in a business. It includes stages such as stable, efficient, predictive, etc.
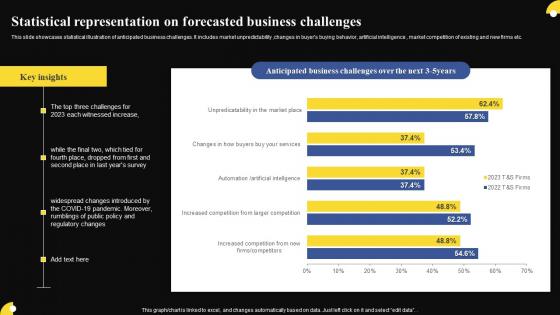
Statistical Representation On Forecasted Business Challenges Brochure Pdf
This slide showcases statistical illustration of anticipated business challenges. It includes market unpredictability, changes in buyers buying behavior, artificial intelligence, market competition of existing and new firms etc. Pitch your topic with ease and precision using this Statistical Representation On Forecasted Business Challenges Brochure Pdf This layout presents information on Anticipated Business, Challenges Over, Key Insights It is also available for immediate download and adjustment. So, changes can be made in the color, design, graphics or any other component to create a unique layout. This slide showcases statistical illustration of anticipated business challenges. It includes market unpredictability, changes in buyers buying behavior, artificial intelligence, market competition of existing and new firms etc.
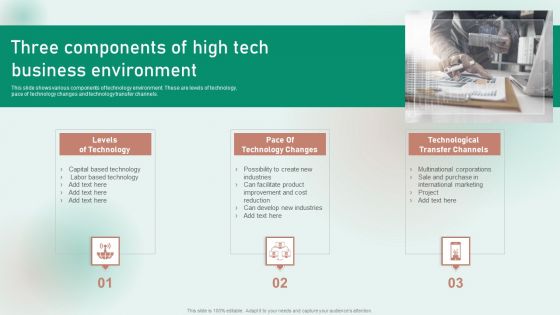
Three Components Of High Tech Business Environment Download PDF
This slide shows various components of technology environment. These are levels of technology, pace of technology changes and technology transfer channels. Presenting Three Components Of High Tech Business Environment Download PDF to dispense important information. This template comprises three stages. It also presents valuable insights into the topics including Pace Of Technology Changes, Technological Transfer Channels, Levels Of Technology. This is a completely customizable PowerPoint theme that can be put to use immediately. So, download it and address the topic impactfully.
Factors Impacting Fund Investment Assessment Decision Icons Pdf
This slide illustrate various factors that is impacting capital investment decision. It includes elements such as proposals with unequal lives, leasing versus purchasing, changes in price levels and qualitative factors. Pitch your topic with ease and precision using this Factors Impacting Fund Investment Assessment Decision Icons Pdf. This layout presents information on Proposals With Unequal Years, Leasing Versus Purchasing, Changes In Price Levels, Qualitative Factors. It is also available for immediate download and adjustment. So, changes can be made in the color, design, graphics or any other component to create a unique layout. This slide illustrate various factors that is impacting capital investment decision. It includes elements such as proposals with unequal lives, leasing versus purchasing, changes in price levels and qualitative factors.
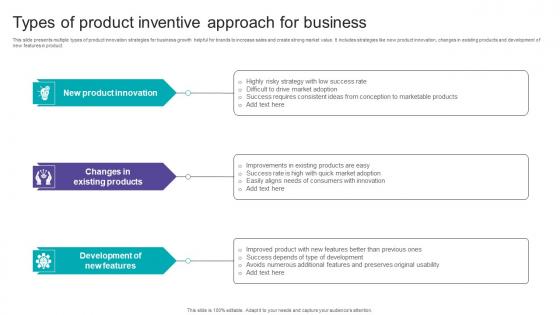
Types Of Product Inventive Approach For Business Brochure Pdf
This slide presents multiple types of product innovation strategies for business growth helpful for brands to increase sales and create strong market value. It includes strategies like new product innovation, changes in existing products and development of new features in product. Pitch your topic with ease and precision using this Types Of Product Inventive Approach For Business Brochure Pdf. This layout presents information on New Product Innovation, Changes In Existing Products, Development Of New Features. It is also available for immediate download and adjustment. So, changes can be made in the color, design, graphics or any other component to create a unique layout. This slide presents multiple types of product innovation strategies for business growth helpful for brands to increase sales and create strong market value. It includes strategies like new product innovation, changes in existing products and development of new features in product.

Scrm Framework With Key Drivers Ppt PowerPoint Presentation Model Deck PDF
Pitch your topic with ease and precision using this scrm framework with key drivers ppt powerpoint presentation model deck pdf. This layout presents information on analyse past activities, analyse current situation, emergence of new markets, changes in competitive environment, risk identification. It is also available for immediate download and adjustment. So, changes can be made in the colour, design, graphics or any other component to create a unique layout.
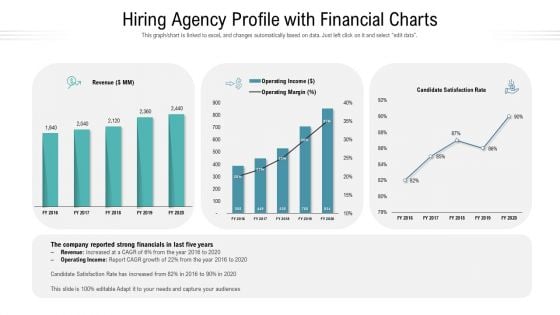
Hiring Agency Profile With Financial Charts Ppt Model Example PDF
This graph or chart is linked to excel, and changes automatically based on data. Just left click on it and select edit data. Pitch your topic with ease and precision using this hiring agency profile with financial charts ppt model example pdf. This layout presents information on revenue, operating income, operating margin, satisfaction rate. It is also available for immediate download and adjustment. So, changes can be made in the color, design, graphics or any other component to create a unique layout.
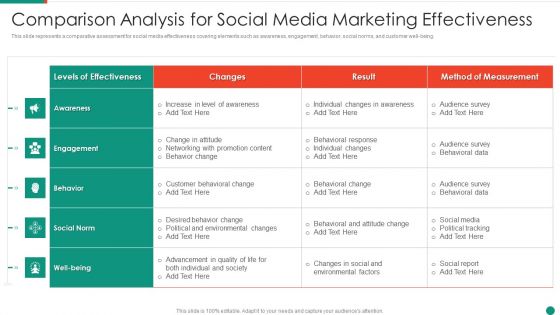
Comparison Analysis For Social Media Marketing Effectiveness Template PDF
This slide represents a comparative assessment for social media effectiveness covering elements such as awareness, engagement, behavior, social norms, and customer well-being.Pitch your topic with ease and precision using this Comparison Analysis For Social Media Marketing Effectiveness Template PDF This layout presents information on Customer Behavioral, Behavioral Response, Individual Changes It is also available for immediate download and adjustment. So, changes can be made in the color, design, graphics or any other component to create a unique layout.
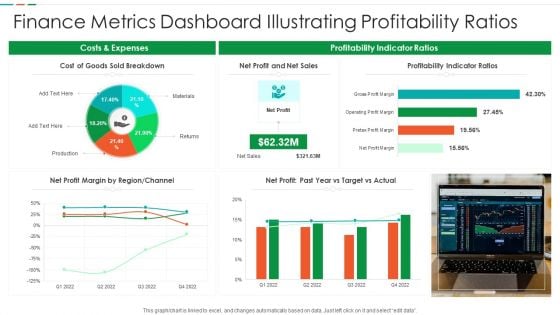
Finance Metrics Dashboard Illustrating Profitability Ratios Diagrams PDF
This graph or chart is linked to excel, and changes automatically based on data. Just left click on it and select edit data. Pitch your topic with ease and precision using this Finance Metrics Dashboard Illustrating Profitability Ratios Diagrams PDF. This layout presents information on Cost Goods Sold, Net Profit Net, Sales Profitability Indicator. It is also available for immediate download and adjustment. So, changes can be made in the color, design, graphics or any other component to create a unique layout.
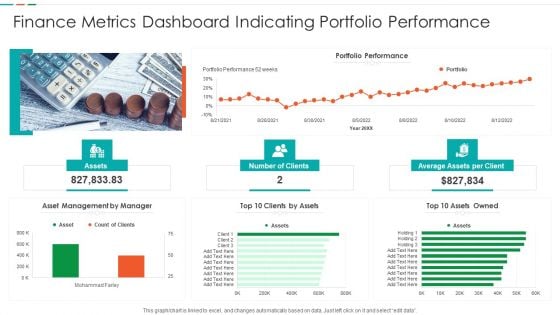
Finance Metrics Dashboard Indicating Portfolio Performance Microsoft PDF
This graph or chart is linked to excel, and changes automatically based on data. Just left click on it and select edit data. Pitch your topic with ease and precision using this Finance Metrics Dashboard Indicating Portfolio Performance Microsoft PDF. This layout presents information on Portfolio Performance Portfolio, Asset Management Manager, Top 10 Assets. It is also available for immediate download and adjustment. So, changes can be made in the color, design, graphics or any other component to create a unique layout.
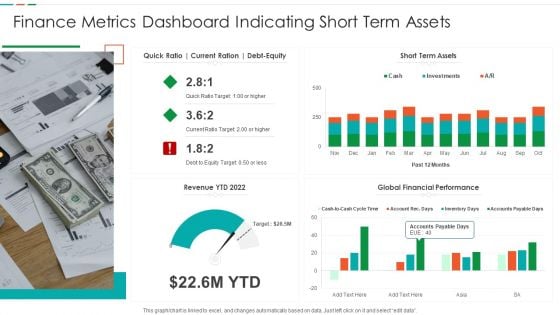
Finance Metrics Dashboard Indicating Short Term Assets Download PDF
This graph or chart is linked to excel, and changes automatically based on data. Just left click on it and select edit data. Pitch your topic with ease and precision using this Finance Metrics Dashboard Indicating Short Term Assets Download PDF. This layout presents information on Short Term Assets, Global Financial Performance, Revenue YTD 2022. It is also available for immediate download and adjustment. So, changes can be made in the color, design, graphics or any other component to create a unique layout.
Cash Performance Highlights With Turnover Rate Ppt Ideas Icon PDF
This graph or chart is linked to excel, and changes automatically based on data. Just left click on it and select Edit Data. Pitch your topic with ease and precision using this Cash Performance Highlights With Turnover Rate Ppt Ideas Icon PDF. This layout presents information on Working Capital, Cash Balance, Current Ratio. It is also available for immediate download and adjustment. So, changes can be made in the color, design, graphics or any other component to create a unique layout.
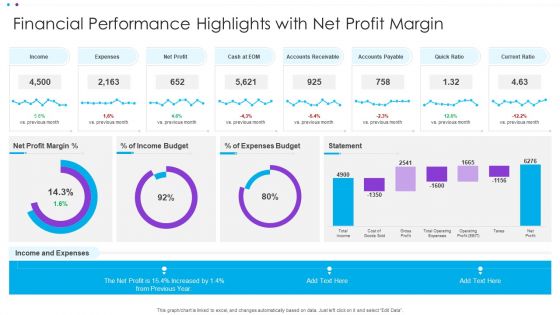
Financial Performance Highlights With Net Profit Margin Ppt Model Ideas PDF
This graph or chart is linked to excel, and changes automatically based on data. Just left click on it and select Edit Data. Pitch your topic with ease and precision using this Financial Performance Highlights With Net Profit Margin Ppt Model Ideas PDF. This layout presents information on Net Profit, Accounts Receivable, Accounts Payable. It is also available for immediate download and adjustment. So, changes can be made in the color, design, graphics or any other component to create a unique layout.
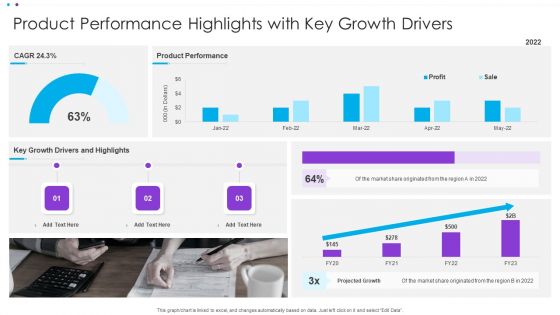
Product Performance Highlights With Key Growth Drivers Ppt Pictures Design Templates PDF
This graph or chart is linked to excel, and changes automatically based on data. Just left click on it and select Edit Data. Pitch your topic with ease and precision using this Product Performance Highlights With Key Growth Drivers Ppt Pictures Design Templates PDF. This layout presents information on Product Performance, Key Growth, Projected Growth. It is also available for immediate download and adjustment. So, changes can be made in the color, design, graphics or any other component to create a unique layout.
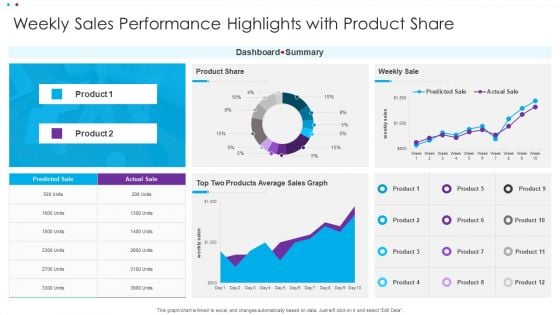
Weekly Sales Performance Highlights With Product Share Ppt File Information PDF
This graph or chart is linked to excel, and changes automatically based on data. Just left click on it and select Edit Data. Pitch your topic with ease and precision using this Weekly Sales Performance Highlights With Product Share Ppt File Information PDF. This layout presents information on Dashboard Summary, Weekly Sale, Product Share. It is also available for immediate download and adjustment. So, changes can be made in the color, design, graphics or any other component to create a unique layout.
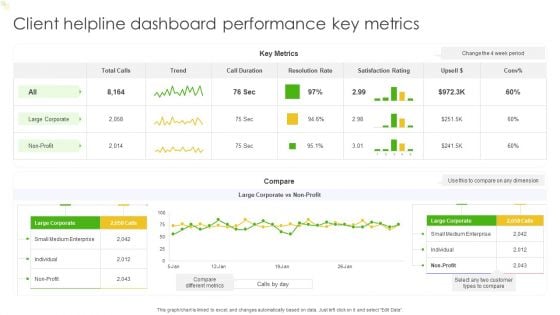
Client Helpline Dashboard Performance Key Metrics Ppt Outline Deck PDF
This graph or chart is linked to excel, and changes automatically based on data. Just left click on it and select Edit Data. Pitch your topic with ease and precision using this Client Helpline Dashboard Performance Key Metrics Ppt Outline Deck PDF. This layout presents information on Key Metrics, Trend, Compare. It is also available for immediate download and adjustment. So, changes can be made in the color, design, graphics or any other component to create a unique layout.
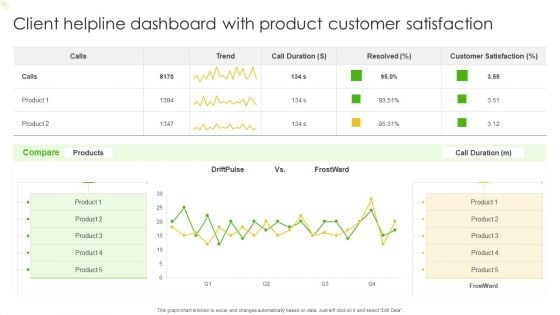
Client Helpline Dashboard With Product Customer Satisfaction Ppt Slides Graphics Template PDF
This graph or chart is linked to excel, and changes automatically based on data. Just left click on it and select Edit Data. Pitch your topic with ease and precision using this Client Helpline Dashboard With Product Customer Satisfaction Ppt Slides Graphics Template PDF. This layout presents information on Customer Satisfaction, Product, Compare. It is also available for immediate download and adjustment. So, changes can be made in the color, design, graphics or any other component to create a unique layout.
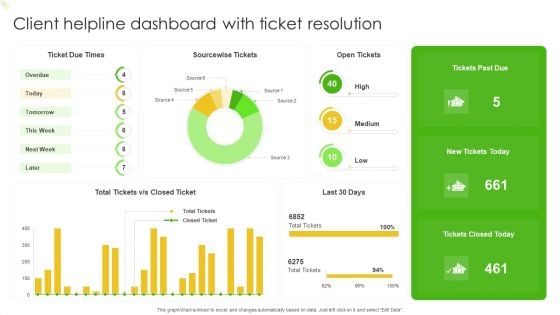
Client Helpline Dashboard With Ticket Resolution Ppt Model Graphics Design PDF
This graph or chart is linked to excel, and changes automatically based on data. Just left click on it and select Edit Data. Pitch your topic with ease and precision using this Client Helpline Dashboard With Ticket Resolution Ppt Model Graphics Design PDF. This layout presents information on Ticket Due Times, Sourcewise Tickets, Open Tickets. It is also available for immediate download and adjustment. So, changes can be made in the color, design, graphics or any other component to create a unique layout.
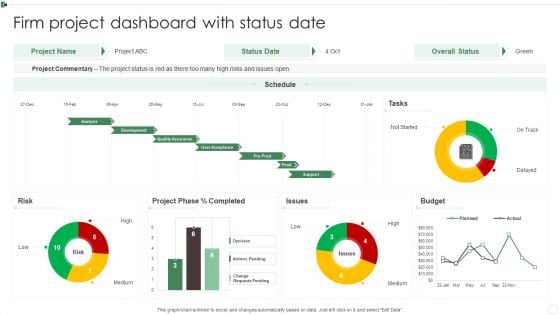
Firm Project Dashboard With Status Date Ppt Infographics Slides PDF
This graph or chart is linked to excel, and changes automatically based on data. Just left click on it and select Edit Data. Pitch your topic with ease and precision using this Firm Project Dashboard With Status Date Ppt Infographics Slides PDF. This layout presents information on Project Commentary, Budget, Project Phase, Risk. It is also available for immediate download and adjustment. So, changes can be made in the color, design, graphics or any other component to create a unique layout.
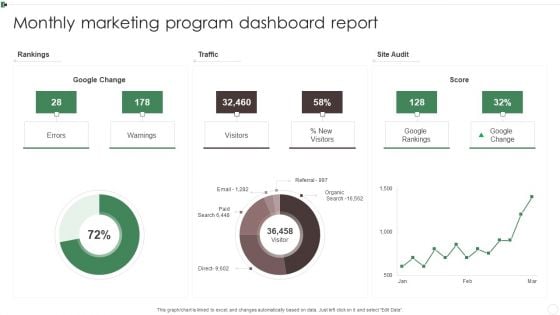
Monthly Marketing Program Dashboard Report Ppt Inspiration Information PDF
This graph or chart is linked to excel, and changes automatically based on data. Just left click on it and select Edit Data. Pitch your topic with ease and precision using this Monthly Marketing Program Dashboard Report Ppt Inspiration Information PDF. This layout presents information on Rankings, Traffic, Site Audit, Warnings. It is also available for immediate download and adjustment. So, changes can be made in the color, design, graphics or any other component to create a unique layout.
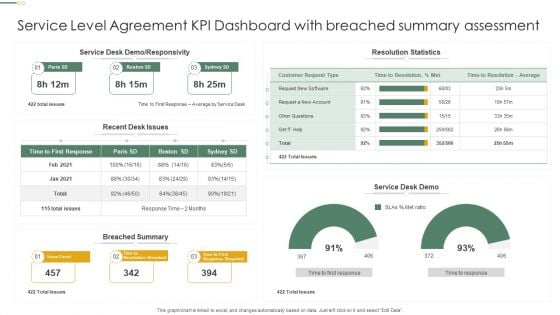
Service Level Agreement KPI Dashboard With Breached Summary Assessment Professional PDF
This graph or chart is linked to excel, and changes automatically based on data. Just left click on it and select Edit Data. Pitch your topic with ease and precision using this Service Level Agreement KPI Dashboard With Breached Summary Assessment Professional PDF. This layout presents information on Resolution Statistics, Service Desk Demo, Breached Summary. It is also available for immediate download and adjustment. So, changes can be made in the color, design, graphics or any other component to create a unique layout.
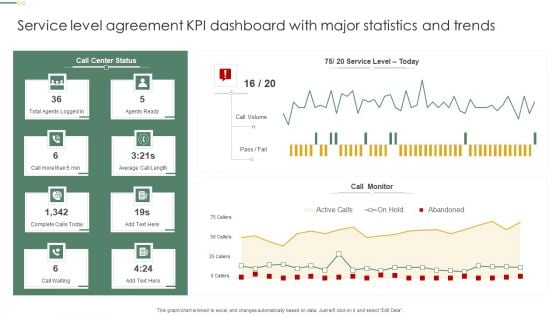
Service Level Agreement KPI Dashboard With Major Statistics And Trends Pictures PDF
This graph or chart is linked to excel, and changes automatically based on data. Just left click on it and select Edit Data. Pitch your topic with ease and precision using this Service Level Agreement KPI Dashboard With Major Statistics And Trends Pictures PDF. This layout presents information on Call Monitor, Call Volume, Agents Ready. It is also available for immediate download and adjustment. So, changes can be made in the color, design, graphics or any other component to create a unique layout.
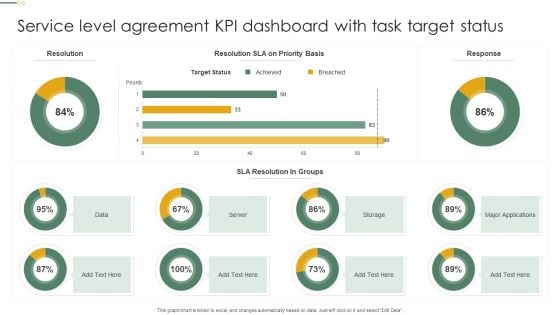
Service Level Agreement KPI Dashboard With Task Target Status Microsoft PDF
This graph or chart is linked to excel, and changes automatically based on data. Just left click on it and select Edit Data. Pitch your topic with ease and precision using this Service Level Agreement KPI Dashboard With Task Target Status Microsoft PDF. This layout presents information on Target Status, Sla Resolution, Groups, Server. It is also available for immediate download and adjustment. So, changes can be made in the color, design, graphics or any other component to create a unique layout.
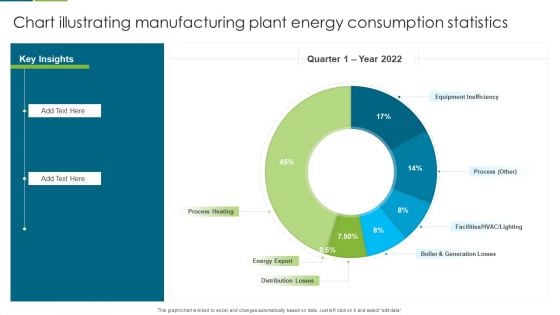
Chart Illustrating Manufacturing Plant Energy Consumption Statistics Slides PDF
This graph or chart is linked to excel, and changes automatically based on data. Just left click on it and select edit data. Pitch your topic with ease and precision using this Chart Illustrating Manufacturing Plant Energy Consumption Statistics Slides PDF. This layout presents information on Equipment Inefficiency, Process Heating, Energy Export. It is also available for immediate download and adjustment. So, changes can be made in the color, design, graphics or any other component to create a unique layout.
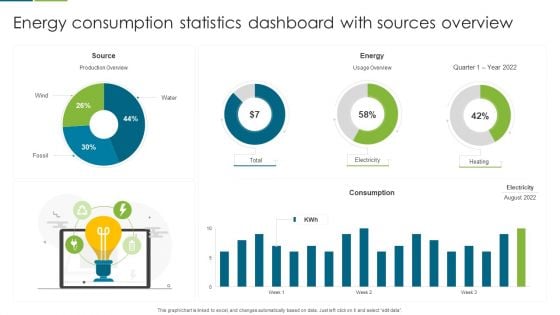
Energy Consumption Statistics Dashboard With Sources Overview Template PDF
This graph or chart is linked to excel, and changes automatically based on data. Just left click on it and select edit data. Pitch your topic with ease and precision using this Energy Consumption Statistics Dashboard With Sources Overview Template PDF. This layout presents information on Source, Energy, Consumption. It is also available for immediate download and adjustment. So, changes can be made in the color, design, graphics or any other component to create a unique layout.
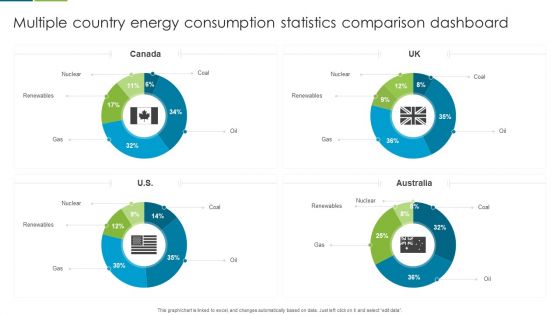
Multiple Country Energy Consumption Statistics Comparison Dashboard Formats PDF
This graph or chart is linked to excel, and changes automatically based on data. Just left click on it and select edit data. Pitch your topic with ease and precision using this Multiple Country Energy Consumption Statistics Comparison Dashboard Formats PDF. This layout presents information on Nuclear, Renewables, Gas. It is also available for immediate download and adjustment. So, changes can be made in the color, design, graphics or any other component to create a unique layout.
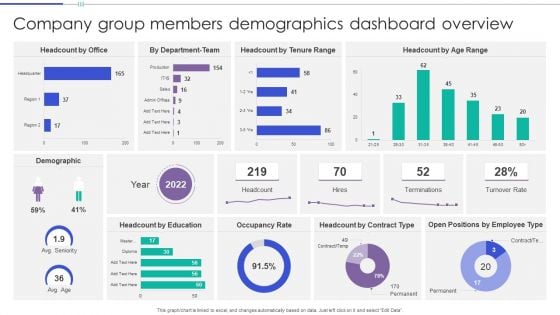
Company Group Members Demographics Dashboard Overview Clipart PDF
This graph or chart is linked to excel, and changes automatically based on data. Just left click on it and select Edit Data. Pitch your topic with ease and precision using this Company Group Members Demographics Dashboard Overview Clipart PDF. This layout presents information on Headcount Office, Headcount Tenure Range, Headcount Age Range. It is also available for immediate download and adjustment. So, changes can be made in the color, design, graphics or any other component to create a unique layout.
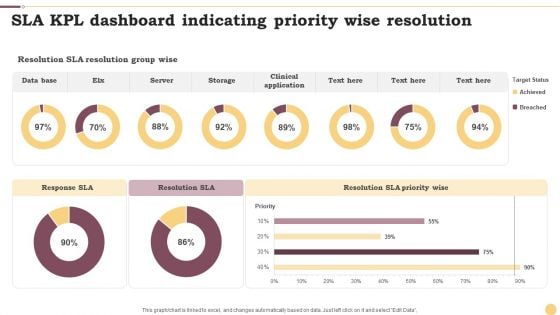
SLA KPL Dashboard Indicating Priority Wise Resolution Ppt Infographics Example File PDF
This graph or chart is linked to excel, and changes automatically based on data. Just left click on it and select Edit Data. Pitch your topic with ease and precision using this SLA KPL Dashboard Indicating Priority Wise Resolution Ppt Infographics Example File PDF. This layout presents information on Data Base, Server, Storage. It is also available for immediate download and adjustment. So, changes can be made in the color, design, graphics or any other component to create a unique layout.
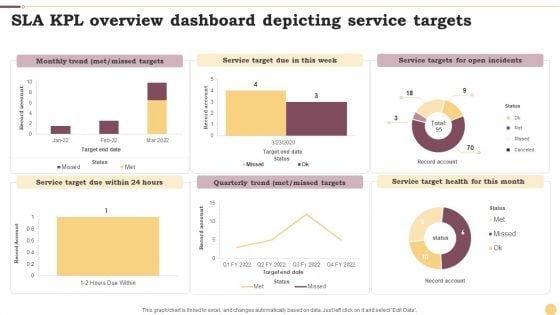
SLA KPL Overview Dashboard Depicting Service Targets Ppt Slides Maker PDF
This graph or chart is linked to excel, and changes automatically based on data. Just left click on it and select Edit Data. Pitch your topic with ease and precision using this SLA KPL Overview Dashboard Depicting Service Targets Ppt Slides Maker PDF. This layout presents information on Monthly Trend, Service Target, Quarterly Trend. It is also available for immediate download and adjustment. So, changes can be made in the color, design, graphics or any other component to create a unique layout.
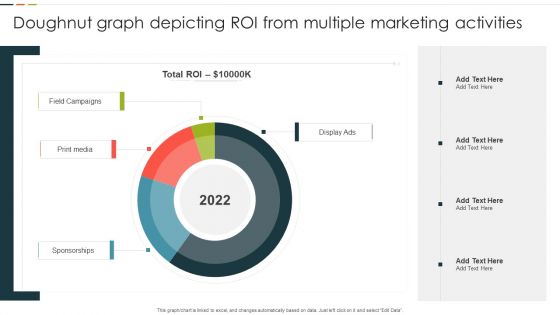
Doughnut Graph Depicting ROI From Multiple Marketing Activities Rules PDF
This graph or chart is linked to excel, and changes automatically based on data. Just left click on it and select Edit Data. Pitch your topic with ease and precision using this Doughnut Graph Depicting ROI From Multiple Marketing Activities Rules PDF. This layout presents information on Total ROI, Field Campaigns, Print Media, Display Ads. It is also available for immediate download and adjustment. So, changes can be made in the color, design, graphics or any other component to create a unique layout.
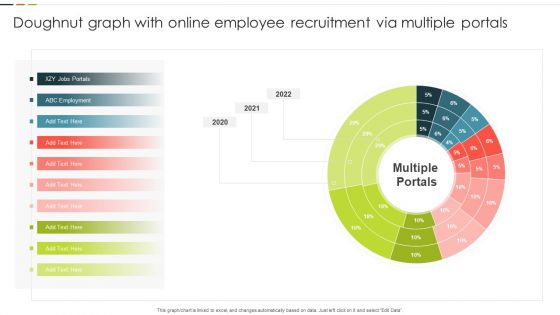
Doughnut Graph With Online Employee Recruitment Via Multiple Portals Mockup PDF
This graph or chart is linked to excel, and changes automatically based on data. Just left click on it and select Edit Data. Pitch your topic with ease and precision using this Doughnut Graph With Online Employee Recruitment Via Multiple Portals Mockup PDF. This layout presents information on ABC Employment, Multiple Portals, 2020 To 2022. It is also available for immediate download and adjustment. So, changes can be made in the color, design, graphics or any other component to create a unique layout.
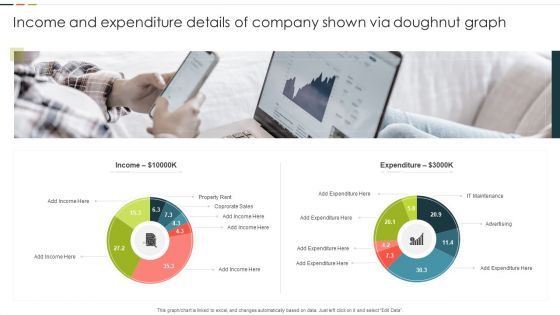
Income And Expenditure Details Of Company Shown Via Doughnut Graph Graphics PDF
This graph or chart is linked to excel, and changes automatically based on data. Just left click on it and select Edit Data. Pitch your topic with ease and precision using this Income And Expenditure Details Of Company Shown Via Doughnut Graph Graphics PDF. This layout presents information on Property Rent, Corporate Sales, Expenditure. It is also available for immediate download and adjustment. So, changes can be made in the color, design, graphics or any other component to create a unique layout.


 Continue with Email

 Home
Home


