Organizational Design Executive Summary
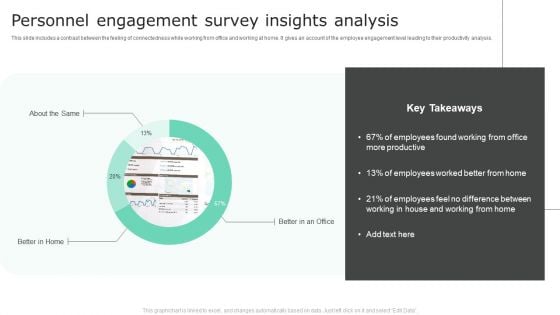
Personnel Engagement Survey Insights Analysis Mockup PDF
This slide includes a contrast between the feeling of connectedness while working from office and working at home. It gives an account of the employee engagement level leading to their productivity analysis. Pitch your topic with ease and precision using this Personnel Engagement Survey Insights Analysis Mockup PDF. This layout presents information on About The Same, Better In Home. It is also available for immediate download and adjustment. So, changes can be made in the color, design, graphics or any other component to create a unique layout.
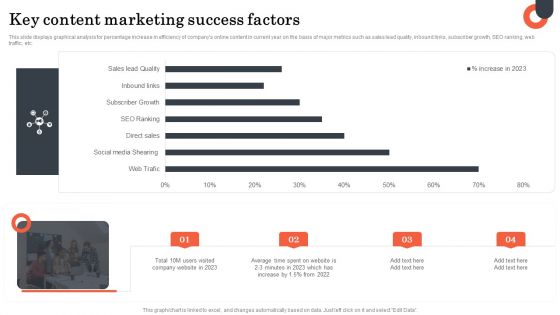
Key Content Marketing Success Factors Microsoft PDF
This slide displays graphical analysis for percentage increase in efficiency of companys online content in current year on the basis of major metrics such as sales lead quality, inbound links, subscriber growth, SEO ranking, web traffic, etc. Pitch your topic with ease and precision using this Key Content Marketing Success Factors Microsoft PDF. This layout presents information on Key Content, Marketing Success Factors. It is also available for immediate download and adjustment. So, changes can be made in the color, design, graphics or any other component to create a unique layout.
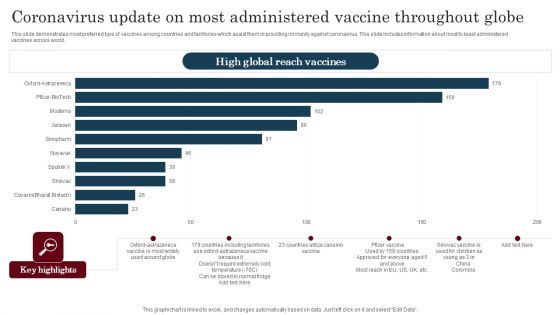
Coronavirus Update On Most Administered Vaccine Throughout Globe Mockup PDF
This slide demonstrates most preferred type of vaccines among countries and territories which assist them in providing immunity against coronavirus. This slide includes information about most to least administered vaccines across world. Pitch your topic with ease and precision using this Coronavirus Update On Most Administered Vaccine Throughout Globe Mockup PDF. This layout presents information on Coronavirus Update, Most Administered Vaccine. It is also available for immediate download and adjustment. So, changes can be made in the color, design, graphics or any other component to create a unique layout.
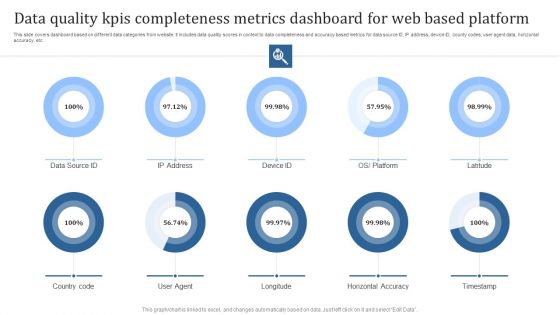
Data Quality Kpis Completeness Metrics Dashboard For Web Based Platform Graphics PDF
This slide covers dashboard based on different data categories from website. It includes data quality scores in context to data completeness and accuracy based metrics for data source ID, IP address, device ID, county codes, user agent data, horizontal accuracy, etc. Pitch your topic with ease and precision using this Data Quality Kpis Completeness Metrics Dashboard For Web Based Platform Graphics PDF. This layout presents information on Country Code, User Agent, Longitude. It is also available for immediate download and adjustment. So, changes can be made in the color, design, graphics or any other component to create a unique layout.
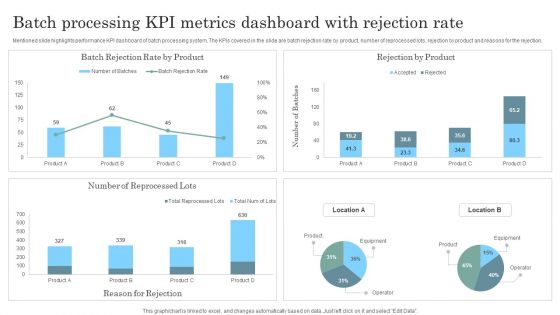
Batch Processing KPI Metrics Dashboard With Rejection Rate Topics PDF
Mentioned slide highlights performance KPI dashboard of batch processing system. The KPIs covered in the slide are batch rejection rate by product, number of reprocessed lots, rejection by product and reasons for the rejection. Pitch your topic with ease and precision using this Batch Processing KPI Metrics Dashboard With Rejection Rate Topics PDF. This layout presents information on Batch Processing KPI Metrics, Dashboard Rejection Rate. It is also available for immediate download and adjustment. So, changes can be made in the color, design, graphics or any other component to create a unique layout.
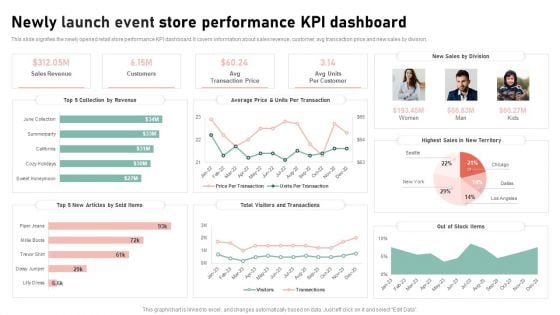
Newly Launch Event Store Performance Kpi Dashboard Elements Sample PDF
This slide signifies the newly opened retail store performance KPI dashboard. It covers information about sales revenue, customer, avg transaction price and new sales by division. Pitch your topic with ease and precision using this Newly Launch Event Store Performance Kpi Dashboard Elements Sample PDF. This layout presents information on Collection By Revenue, Articles By Sold Items, Visitors And Transactions. It is also available for immediate download and adjustment. So, changes can be made in the color, design, graphics or any other component to create a unique layout.
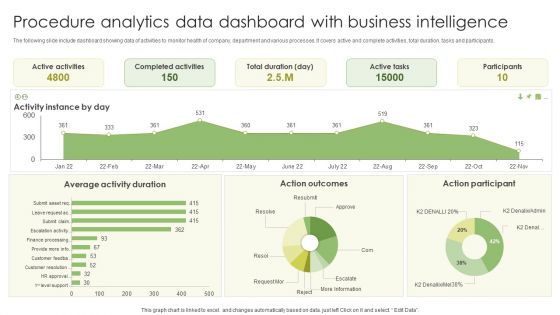
Procedure Analytics Data Dashboard With Business Intelligence Slides PDF
The following slide include dashboard showing data of activities to monitor health of company, department and various processes. It covers active and complete activities, total duration, tasks and participants. Pitch your topic with ease and precision using this Procedure Analytics Data Dashboard With Business Intelligence Slides PDF. This layout presents information on Active Activities, Completed Activities, Active Tasks . It is also available for immediate download and adjustment. So, changes can be made in the color, design, graphics or any other component to create a unique layout.
KPI Dashboard For Tracking Commercial Banking And Financial Activities Download PDF
This slide depicts a dashboard for tracking the banking and financial activities of a business enterprise to measure the income and expenses. The key performing indicators are business accounts, paid, pending and cancelled transactions etc. Pitch your topic with ease and precision using this KPI Dashboard For Tracking Commercial Banking And Financial Activities Download PDF. This layout presents information on KPI Dashboard, Tracking Commercial Banking, Financial Activities. It is also available for immediate download and adjustment. So, changes can be made in the color, design, graphics or any other component to create a unique layout.
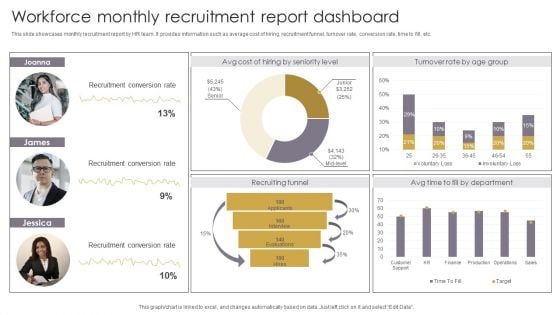
Workforce Monthly Recruitment Report Dashboard Themes PDF
This slide showcases monthly recruitment report by HR team. It provides information such as average cost of hiring, recruitment funnel, turnover rate, conversion rate, time to fill, etc. Pitch your topic with ease and precision using this Workforce Monthly Recruitment Report Dashboard Themes PDF. This layout presents information on Recruiting Funnel, Recruitment Conversion Rate, Recruitment Report Dashboard. It is also available for immediate download and adjustment. So, changes can be made in the color, design, graphics or any other component to create a unique layout.
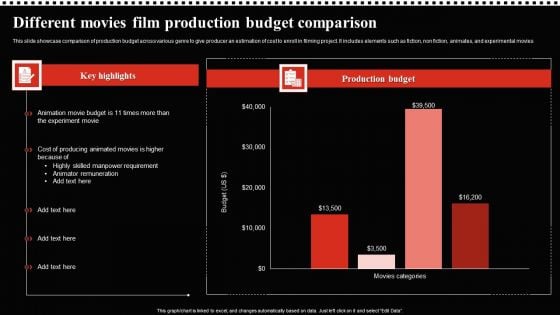
Different Movies Film Production Budget Comparison Inspiration PDF
This slide showcase comparison of production budget across various genre to give producer an estimation of cost to enroll in filming project. It includes elements such as fiction, non fiction, animates, and experimental movies. Pitch your topic with ease and precision using this Different Movies Film Production Budget Comparison Inspiration PDF. This layout presents information on Different Movies Film, Production Budget Comparison. It is also available for immediate download and adjustment. So, changes can be made in the color, design, graphics or any other component to create a unique layout.
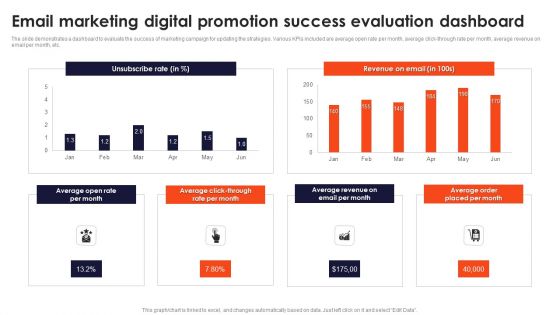
Email Marketing Digital Promotion Success Evaluation Dashboard Sample PDF
The slide demonstrates a dashboard to evaluate the success of marketing campaign for updating the strategies. Various KPIs included are average open rate per month, average click-through rate per month, average revenue on email per month, etc. Pitch your topic with ease and precision using this Email Marketing Digital Promotion Success Evaluation Dashboard Sample PDF. This layout presents information on Open Rate Per Month, Order Placed Per Month. It is also available for immediate download and adjustment. So, changes can be made in the color, design, graphics or any other component to create a unique layout.
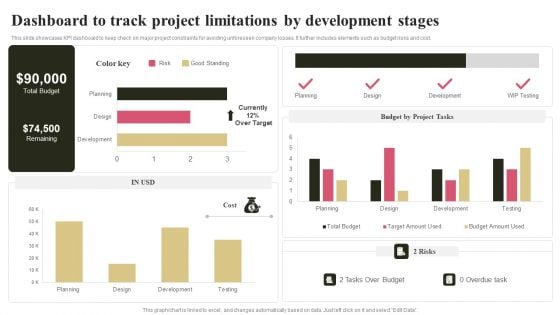
Dashboard To Track Project Limitations By Development Stages Ideas PDF
This slide showcases KPI dashboard to keep check on major project constraints for avoiding unforeseen company losses. It further includes elements such as budget risks and cost. Pitch your topic with ease and precision using this Dashboard To Track Project Limitations By Development Stages Ideas PDF. This layout presents information on Budget By Project Tasks, Risks. It is also available for immediate download and adjustment. So, changes can be made in the color, design, graphics or any other component to create a unique layout.
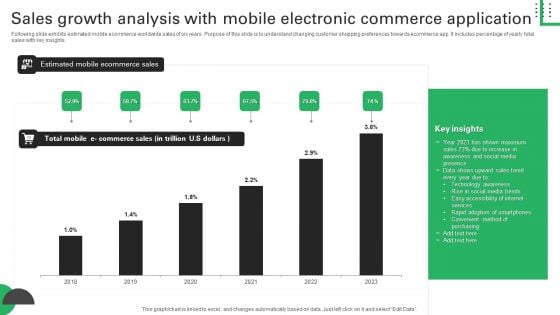
Sales Growth Analysis With Mobile Electronic Commerce Application Structure PDF
Following slide exhibits estimated mobile ecommerce worldwide sales of six years. Purpose of this slide is to understand changing customer shopping preferences towards ecommerce app. It includes percentage of yearly total sales with key insights. Pitch your topic with ease and precision using this Sales Growth Analysis With Mobile Electronic Commerce Application Structure PDF. This layout presents information on Shown Maximum, Awareness Social Media, Accessibility Internet. It is also available for immediate download and adjustment. So, changes can be made in the color, design, graphics or any other component to create a unique layout.
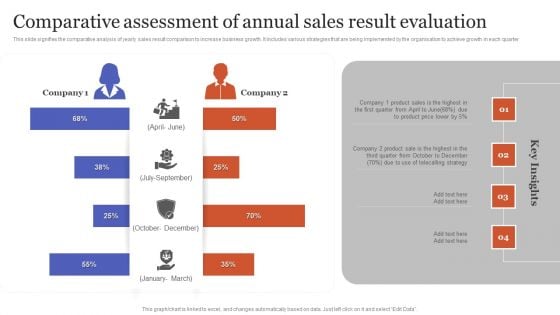
Comparative Assessment Of Annual Sales Result Evaluation Elements PDF
This slide signifies the comparative analysis of yearly sales result comparison to increase business growth. It includes various strategies that are being implemented by the organisation to achieve growth in each quarter Pitch your topic with ease and precision using this Comparative Assessment Of Annual Sales Result Evaluation Elements PDF. This layout presents information on Telecalling Strategy, Product Sales, Product Lower. It is also available for immediate download and adjustment. So, changes can be made in the color, design, graphics or any other component to create a unique layout.
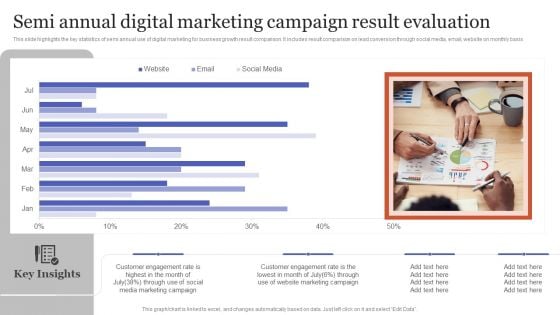
Semi Annual Digital Marketing Campaign Result Evaluation Topics PDF
This slide highlights the key statistics of semi annual use of digital marketing for business growth result comparison. It includes result comparison on lead conversion through social media, email, website on monthly basis. Pitch your topic with ease and precision using this Semi Annual Digital Marketing Campaign Result Evaluation Topics PDF. This layout presents information on Customer Engagement, Marketing Campaign, Through Social. It is also available for immediate download and adjustment. So, changes can be made in the color, design, graphics or any other component to create a unique layout.
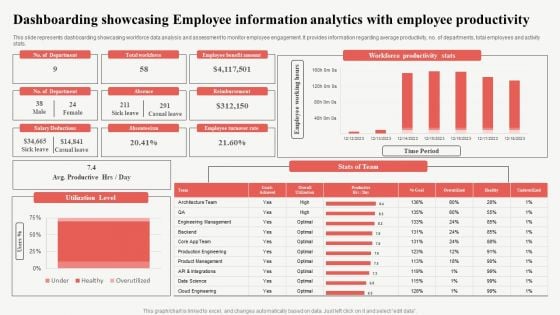
Dashboarding Showcasing Employee Information Analytics With Employee Productivity Slides PDF
This slide represents dashboarding showcasing workforce data analysis and assessment to monitor employee engagement. It provides information regarding average productivity, no. of departments, total employees and activity stats. Pitch your topic with ease and precision using this Dashboarding Showcasing Employee Information Analytics With Employee Productivity Slides PDF. This layout presents information on Reimbursement, Productive, Workforce Productivity Stats. It is also available for immediate download and adjustment. So, changes can be made in the color, design, graphics or any other component to create a unique layout.
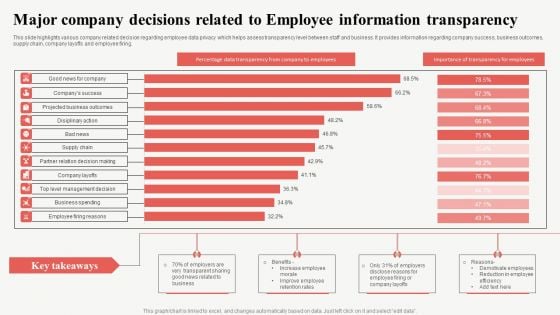
Major Company Decisions Related To Employee Information Transparency Professional PDF
This slide highlights various company related decision regarding employee data privacy which helps assess transparency level between staff and business. It provides information regarding company success, business outcomes, supply chain, company layoffs and employee firing. Pitch your topic with ease and precision using this Major Company Decisions Related To Employee Information Transparency Professional PDF. This layout presents information on Projected Business Outcomes, Supply Chain, Company Layoffs. It is also available for immediate download and adjustment. So, changes can be made in the color, design, graphics or any other component to create a unique layout.
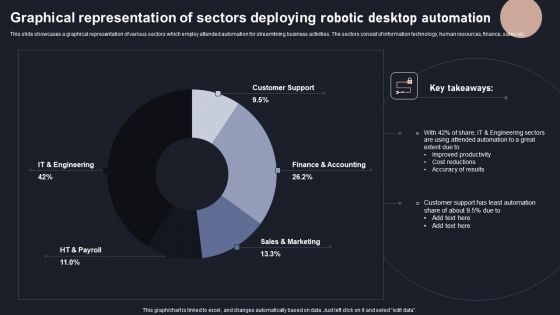
Graphical Representation Of Sectors Deploying Robotic Desktop Automation Formats PDF
This slide showcases a graphical representation of various sectors which employ attended automation for streamlining business activities. The sectors consist of information technology, human resources, finance, sales etc. Pitch your topic with ease and precision using this Graphical Representation Of Sectors Deploying Robotic Desktop Automation Formats PDF. This layout presents information on Productivity, Cost Reductions, Finance. It is also available for immediate download and adjustment. So, changes can be made in the color, design, graphics or any other component to create a unique layout.
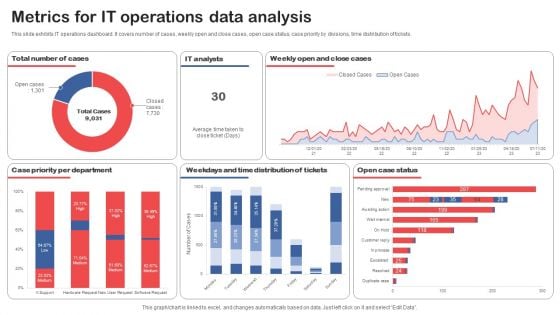
Metrics For IT Operations Data Analysis Topics PDF
This slide exhibits IT operations dashboard. It covers number of cases, weekly open and close cases, open case status, case priority by divisions, time distribution of tickets. Pitch your topic with ease and precision using this Metrics For IT Operations Data Analysis Topics PDF. This layout presents information on Case Priority Per Department, Distribution Of Tickets, Open Case Status. It is also available for immediate download and adjustment. So, changes can be made in the color, design, graphics or any other component to create a unique layout.
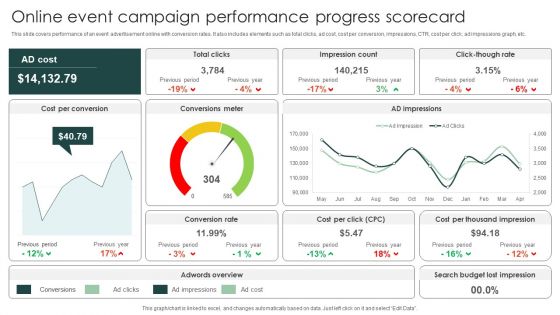
Online Event Campaign Performance Progress Scorecard Themes PDF
This slide covers performance of an event advertisement online with conversion rates. It also includes elements such as total clicks, ad cost, cost per conversion, impressions, CTR, cost per click, ad impressions graph, etc.Pitch your topic with ease and precision using this Online Event Campaign Performance Progress Scorecard Themes PDF. This layout presents information on Cost Per Conversion, Impression Count, Thousand Impression. It is also available for immediate download and adjustment. So, changes can be made in the color, design, graphics or any other component to create a unique layout.
Multi Channel Marketing Strategies Performance Tracking Dashboard Elements PDF
This slide covers dashboard to track achievements of various communication channel. It includes elements such as revenue, sessions, costs, CTR. ROAS. It also includes communication channels such as Instagram, Facebook, Google Ads, Pinterest and Twitter. Pitch your topic with ease and precision using this Multi Channel Marketing Strategies Performance Tracking Dashboard Elements PDF. This layout presents information on Channel Grouping, Revenue Cost Date, Sessions. It is also available for immediate download and adjustment. So, changes can be made in the color, design, graphics or any other component to create a unique layout.
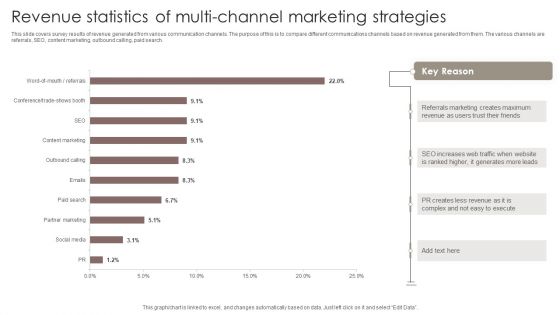
Revenue Statistics Of Multi Channel Marketing Strategies Microsoft PDF
This slide covers survey results of revenue generated from various communication channels. The purpose of this is to compare different communications channels based on revenue generated from them. The various channels are referrals, SEO, content marketing, outbound calling, paid search.Pitch your topic with ease and precision using this Revenue Statistics Of Multi Channel Marketing Strategies Microsoft PDF. This layout presents information on Referrals Marketing, Creates Maximum, Generates Leads. It is also available for immediate download and adjustment. So, changes can be made in the color, design, graphics or any other component to create a unique layout.
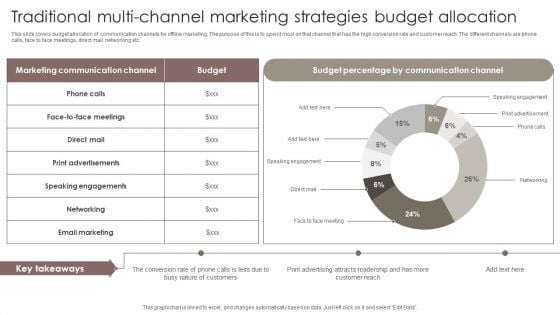
Traditional Multi Channel Marketing Strategies Budget Allocation Diagrams PDF
This slide covers budget allocation of communication channels for offline marketing. The purpose of this is to spend most on that channel that has the high conversion rate and customer reach. The different channels are phone calls, face to face meetings, direct mail, networking etc. Pitch your topic with ease and precision using this Traditional Multi Channel Marketing Strategies Budget Allocation Diagrams PDF. This layout presents information on Communication Channel, Budget Percentage, Speaking Engagements. It is also available for immediate download and adjustment. So, changes can be made in the color, design, graphics or any other component to create a unique layout.
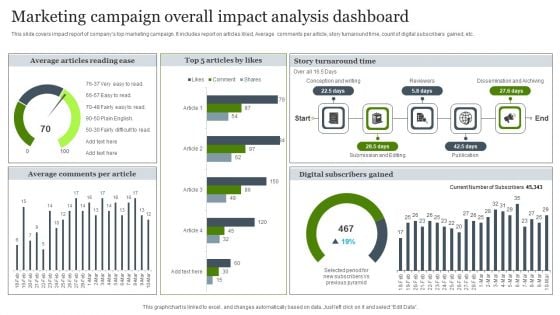
Marketing Campaign Overall Impact Analysis Dashboard Brochure PDF
This slide covers impact report of companys top marketing campaign. It includes report on articles liked, Average comments per article, story turnaround time, count of digital subscribers gained, etc. Pitch your topic with ease and precision using this Marketing Campaign Overall Impact Analysis Dashboard Brochure PDF. This layout presents information on Marketing Campaign, Overall Impact Analysis Dashboard. It is also available for immediate download and adjustment. So, changes can be made in the color, design, graphics or any other component to create a unique layout.
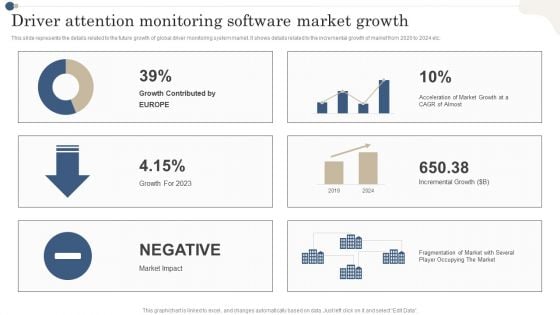
Driver Attention Monitoring Software Market Growth Structure PDF
This slide represents the details related to the future growth of global driver monitoring system market. It shows details related to the incremental growth of market from 2020 to 2024 etc. Pitch your topic with ease and precision using this Driver Attention Monitoring Software Market Growth Structure PDF. This layout presents information on Incremental Growth, Acceleration OF Market, Market Impact . It is also available for immediate download and adjustment. So, changes can be made in the color, design, graphics or any other component to create a unique layout.
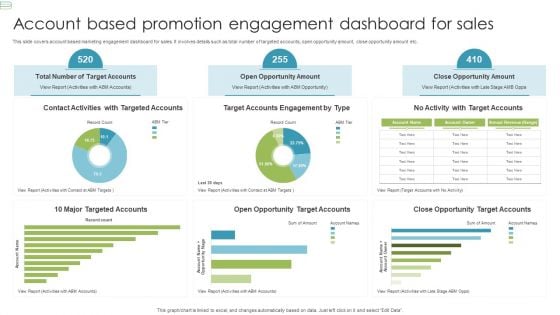
Account Based Promotion Engagement Dashboard For Sales Background PDF
This slide covers account based marketing engagement dashboard for sales. It involves details such as total number of targeted accounts, open opportunity amount, close opportunity amount etc. Pitch your topic with ease and precision using this Account Based Promotion Engagement Dashboard For Sales Background PDF. This layout presents information on Target Accounts, Open Opportunity Amount, Close Opportunity Amount. It is also available for immediate download and adjustment. So, changes can be made in the color, design, graphics or any other component to create a unique layout.
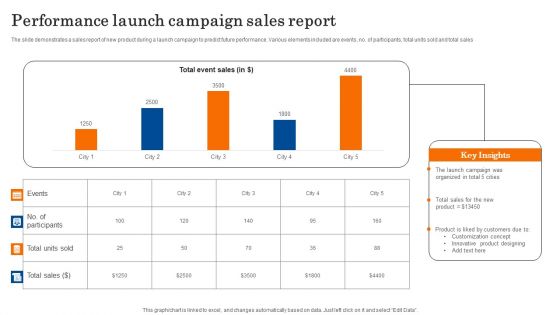
Performance Launch Campaign Sales Report Demonstration PDF
The slide demonstrates a sales report of new product during a launch campaign to predict future performance. Various elements included are events, no. of participants, total units sold and total sales. Pitch your topic with ease and precision using this Performance Launch Campaign Sales Report Demonstration PDF. This layout presents information on Sales, Product, Customization Concept. It is also available for immediate download and adjustment. So, changes can be made in the color, design, graphics or any other component to create a unique layout.
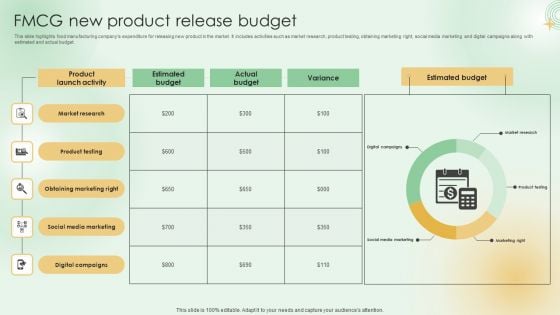
FMCG New Product Release Budget Formats PDF
This slide highlights food manufacturing companys expenditure for releasing new product in the market. It includes activities such as market research, product testing, obtaining marketing right, social media marketing and digital campaigns along with estimated and actual budget. Pitch your topic with ease and precision using this FMCG New Product Release Budget Formats PDF. This layout presents information on Market Research, Product Testing, Obtaining Marketing Right. It is also available for immediate download and adjustment. So, changes can be made in the color, design, graphics or any other component to create a unique layout.
Production Department Open And Closed Error Tracking Report Sample PDF
This slide showcases the tracking report for opened and closed issues concerning the manufacturing department. It also includes the priority level, open date, close date, current status, closed by, etc. Pitch your topic with ease and precision using this Production Department Open And Closed Error Tracking Report Sample PDF. This layout presents information on Open Issue Tracker, Issues Closed, Error Tracking Report. It is also available for immediate download and adjustment. So, changes can be made in the color, design, graphics or any other component to create a unique layout.
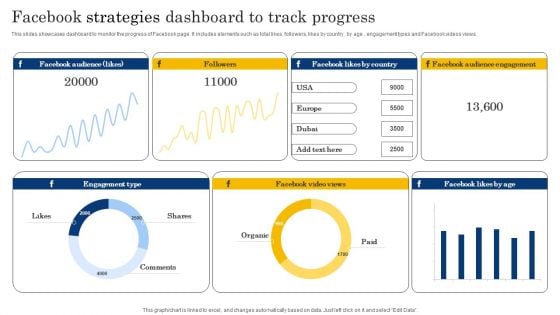
Facebook Strategies Dashboard To Track Progress Structure PDF
This slides showcases dashboard to monitor the progress of Facebook page. It includes elements such as total likes, followers, likes by country, by age , engagement types and Facebook videos views. Pitch your topic with ease and precision using this Facebook Strategies Dashboard To Track Progress Structure PDF. This layout presents information on Followers, Engagement Type, Shares. It is also available for immediate download and adjustment. So, changes can be made in the color, design, graphics or any other component to create a unique layout.
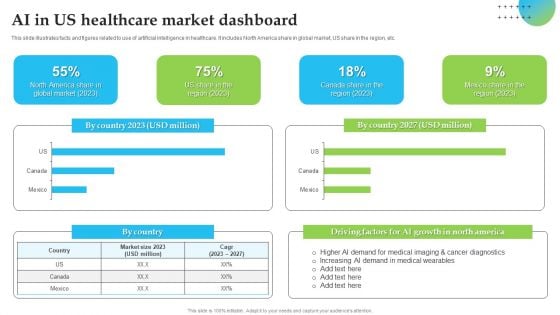
AI In US Healthcare Market Dashboard Brochure PDF
This slide illustrates facts and figures related to use of artificial intelligence in healthcare. It includes North America share in global market, US share in the region, etc. Pitch your topic with ease and precision using this AI In US Healthcare Market Dashboard Brochure PDF. This layout presents information on Driving Factors, AI Growth, Market Dashboard. It is also available for immediate download and adjustment. So, changes can be made in the color, design, graphics or any other component to create a unique layout.
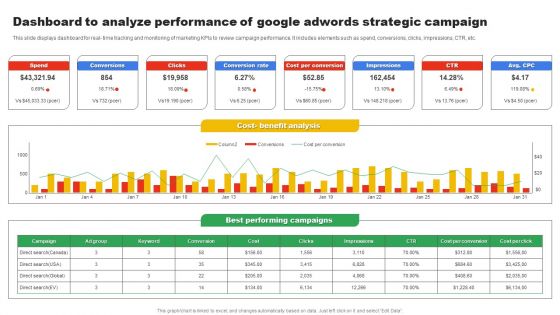
Dashboard To Analyze Performance Of Google Adwords Strategic Campaign Inspiration PDF
This slide displays dashboard for real time tracking and monitoring of marketing KPIs to review campaign performance. It includes elements such as spend, conversions, clicks, impressions, CTR, etc. Pitch your topic with ease and precision using this Dashboard To Analyze Performance Of Google Adwords Strategic Campaign Inspiration PDF. This layout presents information on Spend, Conversions, Cost Benefit Analysis . It is also available for immediate download and adjustment. So, changes can be made in the color, design, graphics or any other component to create a unique layout.
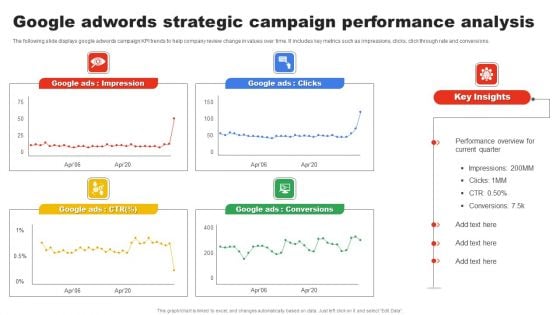
Google Adwords Strategic Campaign Performance Analysis Download PDF
The following slide displays google adwords campaign KPI trends to help company review change in values over time. It includes key metrics such as impressions, clicks, click through rate and conversions. Pitch your topic with ease and precision using this Google Adwords Strategic Campaign Performance Analysis Download PDF. This layout presents information on Google Ads Impression, Google Ads Clicks, Google Ads Conversions. It is also available for immediate download and adjustment. So, changes can be made in the color, design, graphics or any other component to create a unique layout.
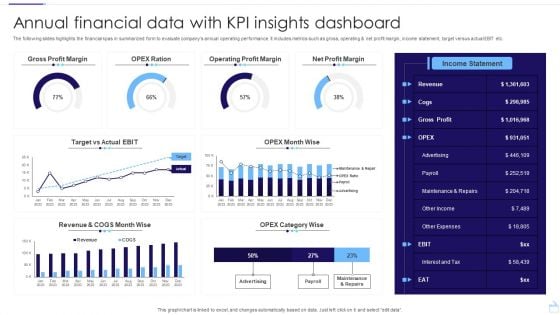
Annual Financial Data With KPI Insights Dashboard Structure PDF
The following slides highlights the financial kpas in summarized form to evaluate companys annual operating performance. It includes metrics such as gross, operating and net profit margin, income statement, target versus actual EBIT etc. Pitch your topic with ease and precision using this Annual Financial Data With KPI Insights Dashboard Structure PDF. This layout presents information on Gross Profit Margin, Operating Profit Margin, Net Profit Margin. It is also available for immediate download and adjustment. So, changes can be made in the color, design, graphics or any other component to create a unique layout.
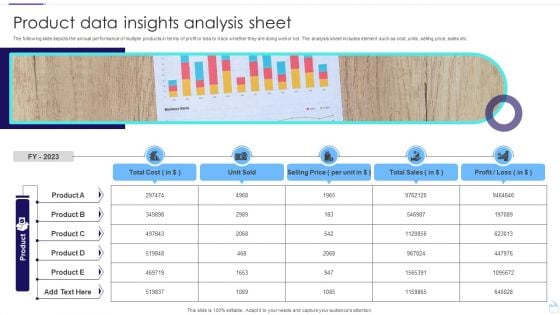
Product Data Insights Analysis Sheet Infographics PDF
The following slide depicts the annual performance of multiple products in terms of profit or loss to track whether they are doing well or not. The analysis sheet includes element such as cost, units, selling price, sales etc. Pitch your topic with ease and precision using this Product Data Insights Analysis Sheet Infographics PDF. This layout presents information on Unit Sold, Selling Price, Total Sales. It is also available for immediate download and adjustment. So, changes can be made in the color, design, graphics or any other component to create a unique layout.
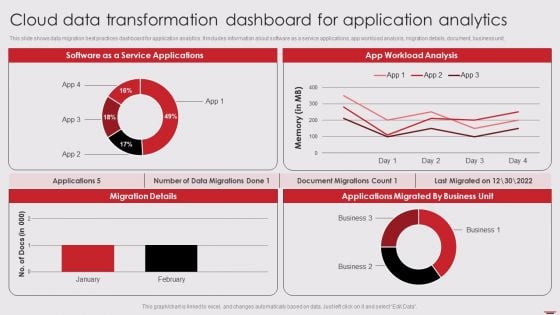
Cloud Data Transformation Dashboard For Application Analytics Information PDF
This slide shows data migration best practices dashboard for application analytics. It includes information about software as a service applications, app workload analysis, migration details, document, business unit. Pitch your topic with ease and precision using this Cloud Data Transformation Dashboard For Application Analytics Information PDF. This layout presents information on Software Service Applications, App Workload Analysis, Migration Details. It is also available for immediate download and adjustment. So, changes can be made in the color, design, graphics or any other component to create a unique layout.
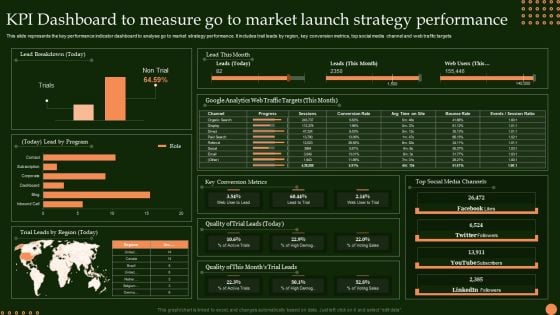
KPI Dashboard To Measure Go To Market Launch Strategy Performance Sample PDF
This slide represents the key performance indicator dashboard to analyse go to market strategy performance. It includes trail leads by region, key conversion metrics, top social media channel and web traffic targets Pitch your topic with ease and precision using this KPI Dashboard To Measure Go To Market Launch Strategy Performance Sample PDF. This layout presents information on Lead Breakdown, Lead By Program, Trial Leads Region. It is also available for immediate download and adjustment. So, changes can be made in the color, design, graphics or any other component to create a unique layout.
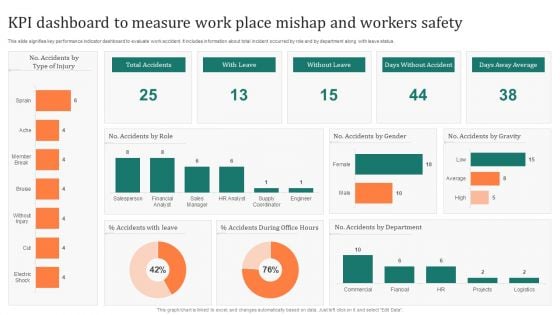
KPI Dashboard To Measure Work Place Mishap And Workers Safety Inspiration PDF
This slide signifies key performance indicator dashboard to evaluate work accident. It includes information about total incident occurred by role and by department along with leave status. Pitch your topic with ease and precision using this KPI Dashboard To Measure Work Place Mishap And Workers Safety Inspiration PDF. This layout presents information on Accidents Role, Accidents Leave, Accidents Department. It is also available for immediate download and adjustment. So, changes can be made in the color, design, graphics or any other component to create a unique layout.
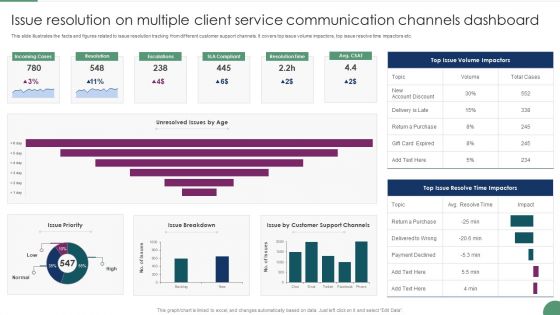
Issue Resolution On Multiple Client Service Communication Channels Dashboard Microsoft PDF
This slide illustrates the facts and figures related to issue resolution tracking from different customer support channels. It covers top issue volume impactors, top issue resolve time impactors etc. Pitch your topic with ease and precision using this Issue Resolution On Multiple Client Service Communication Channels Dashboard Microsoft PDF This layout presents information on Incoming Cases, Resolution, Escalations. It is also available for immediate download and adjustment. So, changes can be made in the color, design, graphics or any other component to create a unique layout.
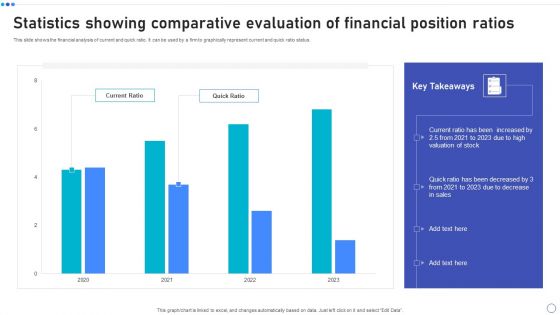
Statistics Showing Comparative Evaluation Of Financial Position Ratios Download PDF
This slide shows the financial analysis of current and quick ratio. It can be used by a firm to graphically represent current and quick ratio status. Pitch your topic with ease and precision using this Statistics Showing Comparative Evaluation Of Financial Position Ratios Download PDF. This layout presents information on Current Ratio, Quick Ratio, 2021 To 2023. It is also available for immediate download and adjustment. So, changes can be made in the color, design, graphics or any other component to create a unique layout.
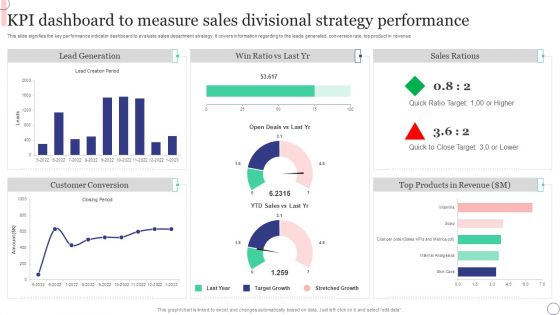
KPI Dashboard To Measure Sales Divisional Strategy Performance Microsoft PDF
This slide signifies the key performance indicator dashboard to evaluate sales department strategy. It covers information regarding to the leads generated, conversion rate, top product in revenue. Pitch your topic with ease and precision using this KPI Dashboard To Measure Sales Divisional Strategy Performance Microsoft PDF. This layout presents information on Sales Rations, Lead Generation, Customer Conversion. It is also available for immediate download and adjustment. So, changes can be made in the color, design, graphics or any other component to create a unique layout.
Lead Tracking Dashboard With Metric Comparison Brochure PDF
This slide showcases dashboard of lead pipeline that can help to identify total number of leads generated and expenses incurred to acquire the audience. It also showcases other key performance metrics like lead breakdown by status and number of leads per month. Pitch your topic with ease and precision using this Lead Tracking Dashboard With Metric Comparison Brochure PDF. This layout presents information on Metric Comparison, Lead Pipeline, Lead Breakdown Status. It is also available for immediate download and adjustment. So, changes can be made in the color, design, graphics or any other component to create a unique layout.
Website Leads Tracking Dashboard With Traffic Sources Infographics PDF
This slide showcases dashboard for lead generation that can help organziation to identify the traffic sources plus visitors and make changes in SEO of website. It also showcases key metrics that are bounce rate by week, visitors by user type, top channels by conversion, top campaign by conversion and top pages by conversion. Pitch your topic with ease and precision using this Website Leads Tracking Dashboard With Traffic Sources Infographics PDF. This layout presents information on Visitors User Type, Traffic Sources, Bounce Rate Week. It is also available for immediate download and adjustment. So, changes can be made in the color, design, graphics or any other component to create a unique layout.
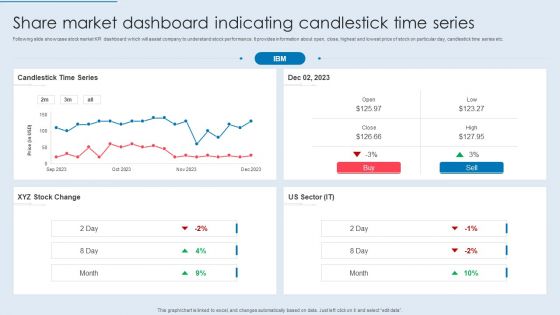
Share Market Dashboard Indicating Candlestick Time Series Formats PDF
Following slide showcase stock market KPI dashboard which will assist company to understand stock performance. It provides information about open, close, highest and lowest price of stock on particular day, candlestick time series etc. Pitch your topic with ease and precision using this Share Market Dashboard Indicating Candlestick Time Series Formats PDF. This layout presents information on Candlestick Time Series, Stock Change, US Sector. It is also available for immediate download and adjustment. So, changes can be made in the color, design, graphics or any other component to create a unique layout.
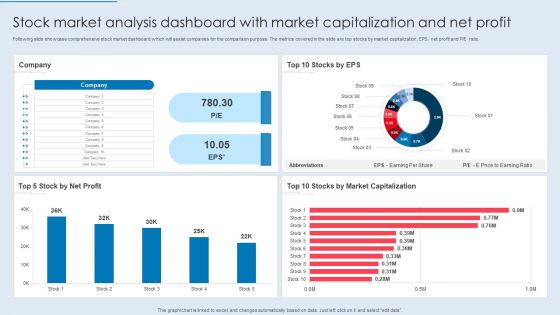
Stock Market Analysis Dashboard With Market Capitalization And Net Profit Elements PDF
Following slide showcase comprehensive stock market dashboard which will assist companies for the comparison purpose. The metrics covered in the slide are top stocks by market capitalization, EPS, net profit and PE ratio. Pitch your topic with ease and precision using this Stock Market Analysis Dashboard With Market Capitalization And Net Profit Elements PDF. This layout presents information on Company, Net Profit, Market Capitalization. It is also available for immediate download and adjustment. So, changes can be made in the color, design, graphics or any other component to create a unique layout.
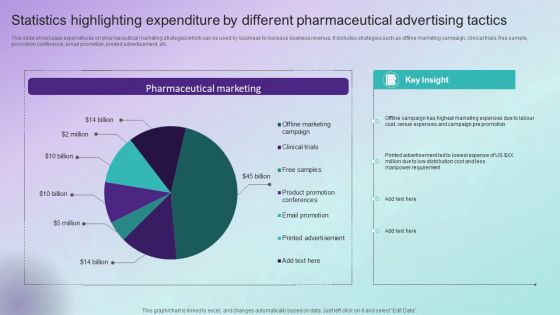
Statistics Highlighting Expenditure By Different Pharmaceutical Advertising Tactics Mockup PDF
This slide showcases expenditures on pharmaceutical marketing strategies which can be used by business to increase business revenue. It includes strategies such as offline marketing campaign, clinical trials, free sample, promotion conference, email promotion, printed advertisement, etc. Pitch your topic with ease and precision using this Statistics Highlighting Expenditure By Different Pharmaceutical Advertising Tactics Mockup PDF. This layout presents information on Offline Marketing Campaign, Clinical Trials, Free Sample, Promotion Conference, Email Promotion, Printed Advertisement. It is also available for immediate download and adjustment. So, changes can be made in the color, design, graphics or any other component to create a unique layout.
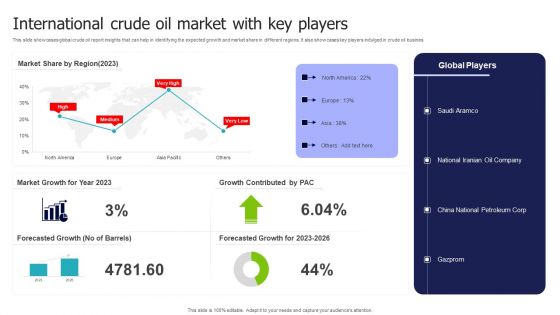
International Crude Oil Market With Key Players Demonstration PDF
This slide showcases global crude oil report insights that can help in identifying the expected growth and market share in different regions. It also showcases key players indulged in crude oil busines. Pitch your topic with ease and precision using this International Crude Oil Market With Key Players Demonstration PDF. This layout presents information on Market Share, Market Growth, Growth Contributed . It is also available for immediate download and adjustment. So, changes can be made in the color, design, graphics or any other component to create a unique layout.
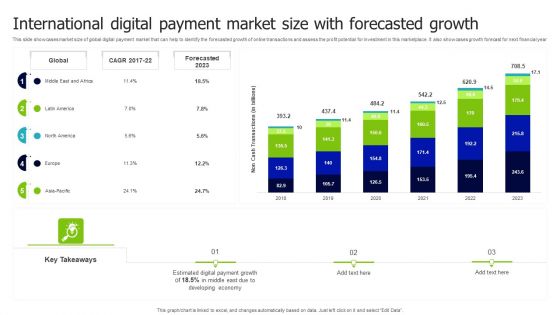
International Digital Payment Market Size With Forecasted Growth Inspiration PDF
This slide showcases market size of global digital payment market that can help to identify the forecasted growth of online transactions and assess the profit potential for investment in this marketplace. It also showcases growth forecast for next financial year. Pitch your topic with ease and precision using this International Digital Payment Market Size With Forecasted Growth Inspiration PDF. This layout presents information on Global, Forecasted, Growth. It is also available for immediate download and adjustment. So, changes can be made in the color, design, graphics or any other component to create a unique layout.
Comparative Analysis For Manual And Automation Testing Lifecycle Icons PDF
This slide showcases graphical report to compare test expenses from manual and automated testing cycles over the years. It further includes details about benefits that can be derived from test automation cycle. Pitch your topic with ease and precision using this Comparative Analysis For Manual And Automation Testing Lifecycle Icons PDF. This layout presents information on Comparative Analysis For Manual, Automation Testing Lifecycle. It is also available for immediate download and adjustment. So, changes can be made in the color, design, graphics or any other component to create a unique layout.
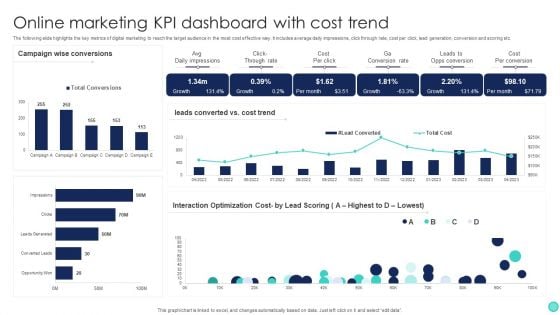
Online Marketing KPI Dashboard With Cost Trend Slides PDF
The following slide highlights the key metrics of digital marketing to reach the target audience in the most cost effective way. It includes average daily impressions, click through rate, cost per click, lead generation, conversion and scoring etc. Pitch your topic with ease and precision using this Online Marketing KPI Dashboard With Cost Trend Slides PDF. This layout presents information on Average Daily Impressions, Click Through Rate, Cost Per Click, Lead Generation, Conversion And Scoring. It is also available for immediate download and adjustment. So, changes can be made in the color, design, graphics or any other component to create a unique layout.

Quarterly Sales Performance Of Business Analysis With Key Insights Information PDF
In this slide sales performance of each product is recorded as their percentage share in total sales first quarter of company. The goods include headphones, joystick, mouse pad, bluetooth speaker, etc. Pitch your topic with ease and precision using this Quarterly Sales Performance Of Business Analysis With Key Insights Information PDF. This layout presents information on Wireless Mouse, Keyboard, Mouse Pad, Joystick, Headsets. It is also available for immediate download and adjustment. So, changes can be made in the color, design, graphics or any other component to create a unique layout.
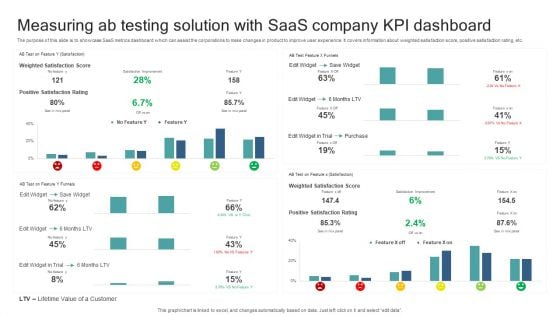
Measuring Ab Testing Solution With Saas Company KPI Dashboard Guidelines PDF
The purpose of this slide is to showcase SaaS metrics dashboard which can assist the corporations to make changes in product to improve user experience. It covers information about weighted satisfaction score, positive satisfaction rating, etc. Pitch your topic with ease and precision using this Measuring Ab Testing Solution With Saas Company KPI Dashboard Guidelines PDF. This layout presents information on Lifetime Value Customer, Positive Satisfaction Rating, Save Widget, Weighted Satisfaction Score. It is also available for immediate download and adjustment. So, changes can be made in the color, design, graphics or any other component to create a unique layout.
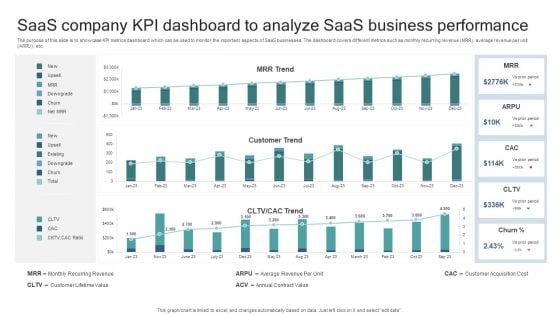
Saas Company KPI Dashboard To Analyze Saas Business Performance Elements PDF
The purpose of this slide is to showcase KPI metrics dashboard which can be used to monitor the important aspects of SaaS businesses. The dashboard covers different metrics such as monthly recurring revenue MRR, average revenue per unit ARPU, etc. Pitch your topic with ease and precision using this Saas Company KPI Dashboard To Analyze Saas Business Performance Elements PDF. This layout presents information on Monthly Recurring Revenue, Customer Lifetime Value, Average Revenue Per Unit, Annual Contract Value, Customer Acquisition Cost. It is also available for immediate download and adjustment. So, changes can be made in the color, design, graphics or any other component to create a unique layout.
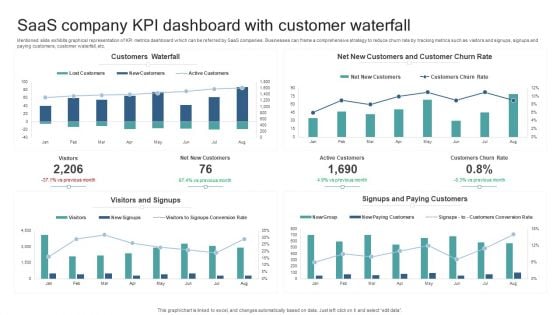
Saas Company KPI Dashboard With Customer Waterfall Slides PDF
Mentioned slide exhibits graphical representation of KPI metrics dashboard which can be referred by SaaS companies. Businesses can frame a comprehensive strategy to reduce churn rate by tracking metrics such as visitors and signups, signups and paying customers, customer waterfall, etc. Pitch your topic with ease and precision using this Saas Company KPI Dashboard With Customer Waterfall Slides PDF. This layout presents information on Customers Waterfall, Visitors And Signups, Signups And Paying Customers. It is also available for immediate download and adjustment. So, changes can be made in the color, design, graphics or any other component to create a unique layout.
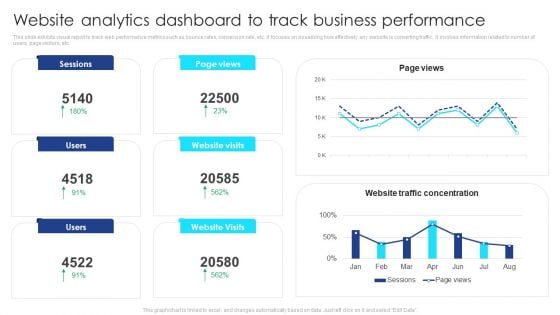
Website Analytics Dashboard To Track Business Performance Guidelines PDF
This slide exhibits visual report to track web performance metrics such as bounce rates, conversion rate, etc. It focuses on visualizing how effectively any website is converting traffic. It involves information related to number of users, page visitors, etc. Pitch your topic with ease and precision using this Website Analytics Dashboard To Track Business Performance Guidelines PDF. This layout presents information on Website Analytics, Dashboard To Track, Business Performance. It is also available for immediate download and adjustment. So, changes can be made in the color, design, graphics or any other component to create a unique layout.
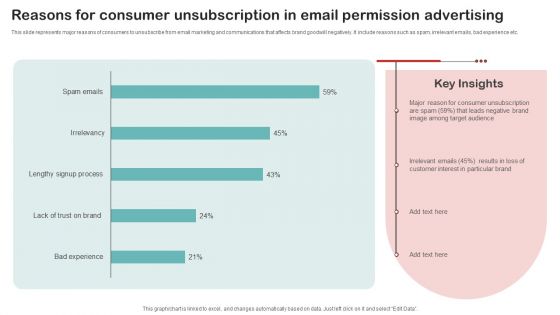
Reasons For Consumer Unsubscription In Email Permission Advertising Diagrams PDF
This slide represents major reasons of consumers to unsubscribe from email marketing and communications that affects brand goodwill negatively. It include reasons such as spam, irrelevant emails, bad experience etc. Pitch your topic with ease and precision using this Reasons For Consumer Unsubscription In Email Permission Advertising Diagrams PDF. This layout presents information on Irrelevant Emails, Customer Interest, Target Audience. It is also available for immediate download and adjustment. So, changes can be made in the color, design, graphics or any other component to create a unique layout.
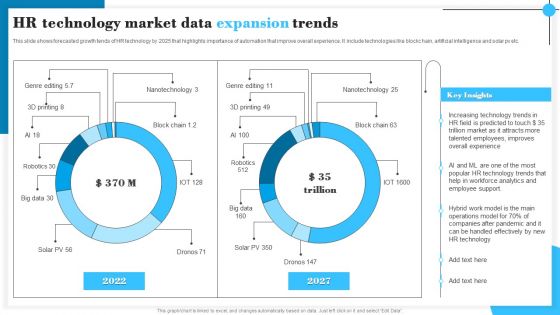
HR Technology Market Data Expansion Trends Information PDF
This slide shows forecasted growth tends of HR technology by 2025 that highlights importance of automation that improve overall experience. It include technologies like blockc hain, artificial intelligence and solar pv etc. Pitch your topic with ease and precision using this HR Technology Market Data Expansion Trends Information PDF. This layout presents information on Increasing Technology, Talented Employees, Employee Support. It is also available for immediate download and adjustment. So, changes can be made in the color, design, graphics or any other component to create a unique layout.
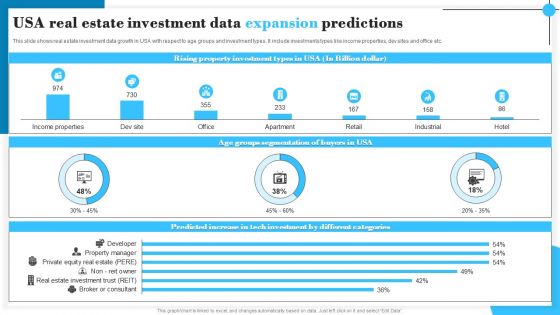
USA Real Estate Investment Data Expansion Predictions Graphics PDF
This slide shows real estate investment data growth in USA with respect to age groups and investment types. It include investments types like income properties, dev sites and office etc. Pitch your topic with ease and precision using this USA Real Estate Investment Data Expansion Predictions Graphics PDF. This layout presents information on Rising Property, Age Groups Segmentation, Investment Types. It is also available for immediate download and adjustment. So, changes can be made in the color, design, graphics or any other component to create a unique layout.
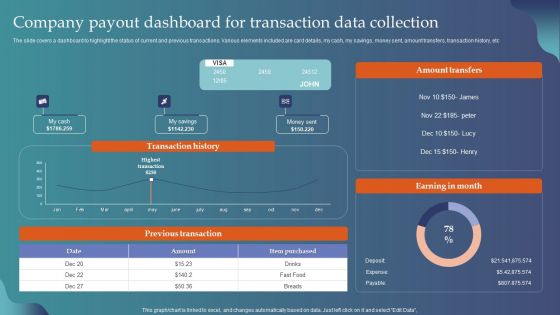
Company Payout Dashboard For Transaction Data Collection Themes PDF
The slide covers a dashboard to highlight the status of current and previous transactions. Various elements included are card details, my cash, my savings, money sent, amount transfers, transaction history, etc. Pitch your topic with ease and precision using this Company Payout Dashboard For Transaction Data Collection Themes PDF. This layout presents information on Amount Transfers, Earning Month, Previous Transaction. It is also available for immediate download and adjustment. So, changes can be made in the color, design, graphics or any other component to create a unique layout.
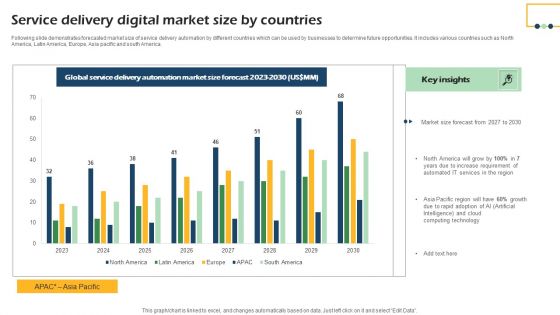
Service Delivery Digital Market Size By Countries Demonstration PDF
Following slide demonstrates forecasted market size of service delivery automation by different countries which can be used by businesses to determine future opportunities. It includes various countries such as North America, Latin America, Europe, Asia pacific and south America. Pitch your topic with ease and precision using this Service Delivery Digital Market Size By Countries Demonstration PDF. This layout presents information on Global Service, Delivery Automation, Market Size Forecast. It is also available for immediate download and adjustment. So, changes can be made in the color, design, graphics or any other component to create a unique layout.


 Continue with Email

 Home
Home


