Organizational Design
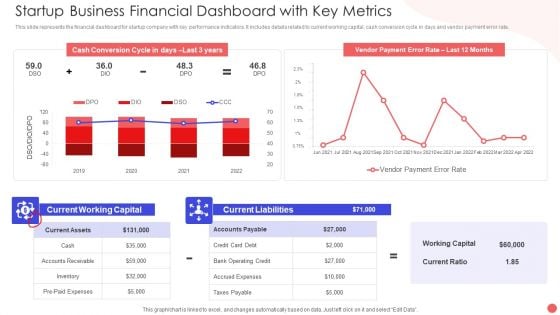
Startup Business Financial Dashboard With Key Metrics Sample PDF
This slide represents the financial dashboard for startup company with key performance indicators. It includes details related to current working capital, cash conversion cycle in days and vendor payment error rate. Pitch your topic with ease and precision using this Startup Business Financial Dashboard With Key Metrics Sample PDF. This layout presents information on Cash Conversion Cycle, Current Working Capital, Current Liabilities Debt. It is also available for immediate download and adjustment. So, changes can be made in the color, design, graphics or any other component to create a unique layout.
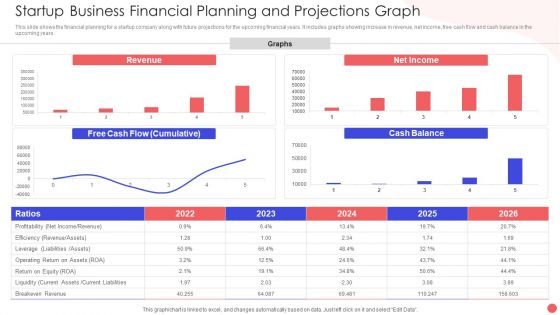
Startup Business Financial Planning And Projections Graph Slides PDF
This slide shows the financial planning for a startup company along with future projections for the upcoming financial years. It includes graphs showing increase in revenue, net income, free cash flow and cash balance in the upcoming years. Pitch your topic with ease and precision using this Startup Business Financial Planning And Projections Graph Slides PDF. This layout presents information on Revenue Graphs Operating, Free Cash Flow, Net Income Ration. It is also available for immediate download and adjustment. So, changes can be made in the color, design, graphics or any other component to create a unique layout.

Information Technology System Dashboard For Monitoring Business Operations Themes PDF
This slide shows information technology system dashboard for monitoring business operations which can be beneficial for making decisions for their growth. It contains information about learning, internal, finance or customers and users. Pitch your topic with ease and precision using this Information Technology System Dashboard For Monitoring Business Operations Themes PDF. This layout presents information on Finance Customers Users, Learning Internal Tickets, Hiring And Firing. It is also available for immediate download and adjustment. So, changes can be made in the color, design, graphics or any other component to create a unique layout.
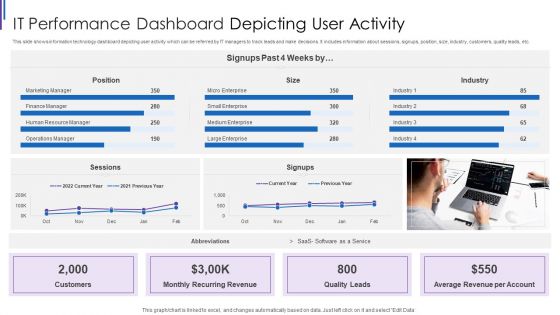
IT Performance Dashboard Depicting User Activity Inspiration PDF
This slide shows information technology dashboard depicting user activity which can be referred by IT managers to track leads and make decisions. It includes information about sessions, signups, position, size, industry, customers, quality leads, etc. Pitch your topic with ease and precision using this IT Performance Dashboard Depicting User Activity Inspiration PDF. This layout presents information on Monthly Recurring Revenue, Average Revenue Per, Account Quality Leads, Customers Position Sessions. It is also available for immediate download and adjustment. So, changes can be made in the color, design, graphics or any other component to create a unique layout.
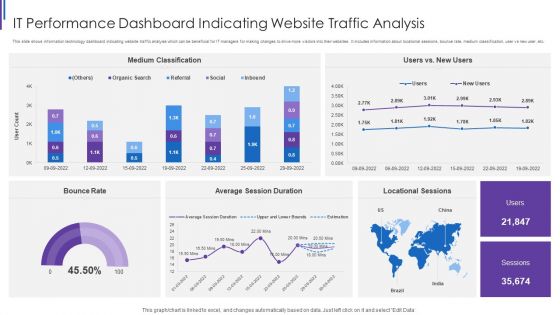
IT Performance Dashboard Indicating Website Traffic Analysis Background PDF
This slide shows information technology dashboard indicating website traffic analysis which can be beneficial for IT managers for making changes to drive more visitors into their websites. It includes information about locational sessions, bounce rate, medium classification, user vs new user, etc. Pitch your topic with ease and precision using this IT Performance Dashboard Indicating Website Traffic Analysis Background PDF. This layout presents information on Medium Classification Rate, Average Session Duration, Locational Sessions Bounce. It is also available for immediate download and adjustment. So, changes can be made in the color, design, graphics or any other component to create a unique layout.
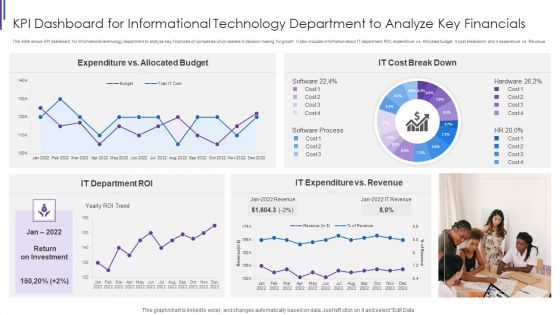
KPI Dashboard For Informational Technology Department To Analyze Key Financials Structure PDF
This slide shows KPI dashboard for informational technology department to analyze key financials of companies which assists in decision making for growth. It also includes information about IT department ROI, expenditure vs. Allocated budget, it cost breakdown and it expenditure vs. Revenue. Pitch your topic with ease and precision using this KPI Dashboard For Informational Technology Department To Analyze Key Financials Structure PDF. This layout presents information on Expenditure Vs Allocated, Budget IT Cost, Break Down IT, Expenditure Vs Revenue, IT Department ROI. It is also available for immediate download and adjustment. So, changes can be made in the color, design, graphics or any other component to create a unique layout.
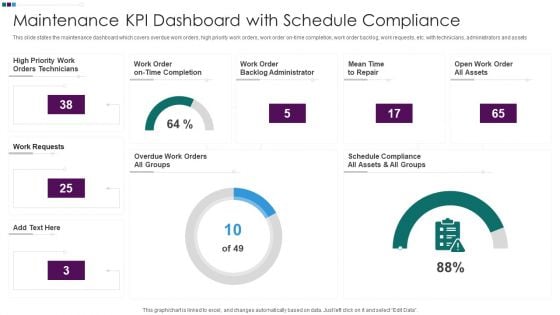
Maintenance KPI Dashboard With Schedule Compliance Ppt Styles Demonstration PDF
This slide states the maintenance dashboard which covers overdue work orders, high priority work orders, work order on-time completion, work order backlog, work requests, etc. with technicians, administrators and assets. Pitch your topic with ease and precision using this Maintenance KPI Dashboard With Schedule Compliance Ppt Styles Demonstration PDF. This layout presents information on High Priority Work, Work Order Backlog, Mean Time Repair, Open Work Order. It is also available for immediate download and adjustment. So, changes can be made in the color, design, graphics or any other component to create a unique layout.
Maintenance Software Dashboard With Charts Ppt Icon Slide Download PDF
This slide shows the dashboard of maintenance software which covers tasks per subsystem, highest maintenance time, task count, mean time to repair per level with motherboard, camera, propeller assembly, ground controller, motor , etc. Pitch your topic with ease and precision using this Maintenance Software Dashboard With Charts Ppt Icon Slide Download PDF. This layout presents information on 10 Highest Mean, Time To Repair, 10 Highest Task, Task Per Subsystem, 10 Highest Maintenance. It is also available for immediate download and adjustment. So, changes can be made in the color, design, graphics or any other component to create a unique layout.
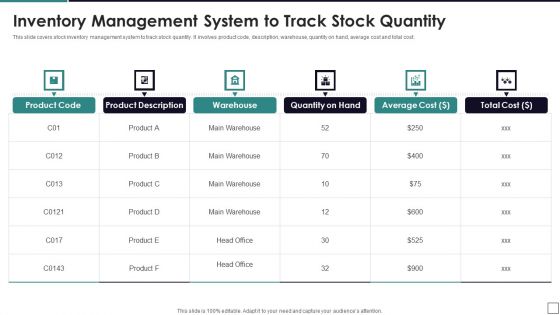
Inventory Management System To Track Stock Quantity Demonstration PDF
This slide covers stock inventory management system to track stock quantity. It involves product code, description, warehouse, quantity on hand, average cost and total cost. Pitch your topic with ease and precision using this Inventory Management System To Track Stock Quantity Demonstration PDF. This layout presents information on Inventory Management System, Stock Quantity, Quantity On Hand. It is also available for immediate download and adjustment. So, changes can be made in the color, design, graphics or any other component to create a unique layout.
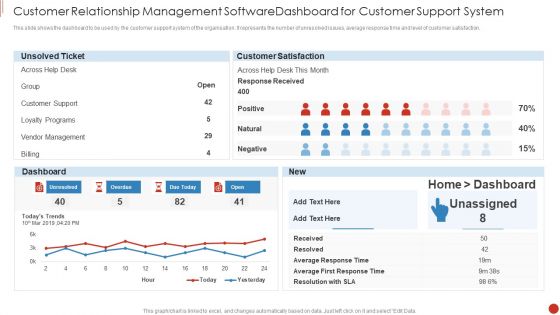
Customer Relationship Management Software Dashboard For Customer Support System Demonstration PDF
This slide shows the dashboard to be used by the customer support system of the organisation. It represents the number of unresolved issues, average response time and level of customer satisfaction.Pitch your topic with ease and precision using this Customer Relationship Management Software Dashboard For Customer Support System Demonstration PDF This layout presents information on Customer Support, Vendor Management, Loyalty Programs It is also available for immediate download and adjustment. So, changes can be made in the color, design, graphics or any other component to create a unique layout.
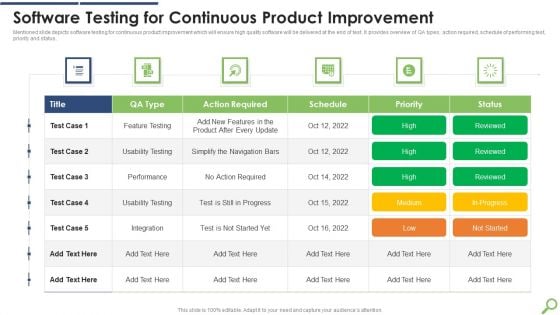
Software Testing For Continuous Product Improvement Graphics PDF
Mentioned slide depicts software testing for continuous product improvement which will ensure high quality software will be delivered at the end of test. It provides overview of QA types, action required, schedule of performing test, priority and status.Pitch your topic with ease and precision using this Software Testing For Continuous Product Improvement Graphics PDF This layout presents information on Action Required, Usability Testing, Simplify Navigation It is also available for immediate download and adjustment. So, changes can be made in the color, design, graphics or any other component to create a unique layout.
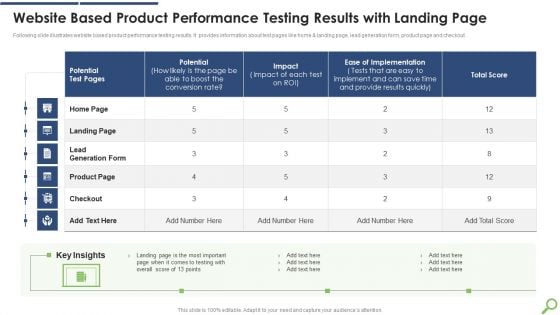
Website Based Product Performance Testing Results With Landing Page Mockup PDF
Following slide illustrates website based product performance testing results. It provides information about test pages like home and landing page, lead generation form, product page and checkout. Pitch your topic with ease and precision using this Website Based Product Performance Testing Results With Landing Page Mockup PDF This layout presents information on Provide Results, Potential Test, Ease Of Implementation It is also available for immediate download and adjustment. So, changes can be made in the color, design, graphics or any other component to create a unique layout.
Patient Healthcare Online Transformation Dashboard Ppt PowerPoint Presentation Icon Example File PDF
This slide displays the dashboard depicting the results of patients after the digital transformation. It includes the daily activity of the patients on the app, appointments, water balance, etc. Pitch your topic with ease and precision using this Patient Healthcare Online Transformation Dashboard Ppt PowerPoint Presentation Icon Example File PDF. This layout presents information on General Health, Water Balance, Transformation Dashboard. It is also available for immediate download and adjustment. So, changes can be made in the color, design, graphics or any other component to create a unique layout.

Comparative Assessment Of Inventory And Asset Monitoring Summary PDF
This slide covers comparative assessment of inventory and asset tracking based on key parameters. It involves parameters such as maintenance, return process, timeline and prepare for next use.Pitch your topic with ease and precision using this Comparative Assessment Of Inventory And Asset Monitoring Summary PDF This layout presents information on Inventory Tracking, Asset Tracking, Maintenance Needed It is also available for immediate download and adjustment. So, changes can be made in the color, design, graphics or any other component to create a unique layout.
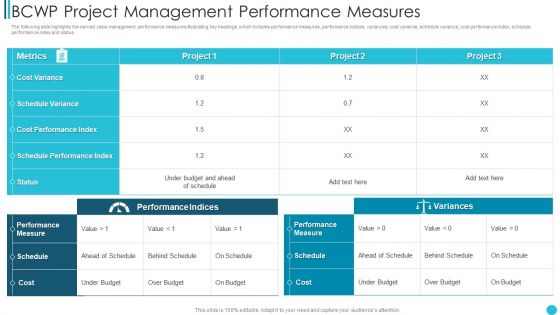
BCWP Project Management Performance Measures Download PDF
The following slide highlights the earned value management performance measures illustrating key headings which includes performance measures, performance indices, variances, cost variance, schedule variance, cost performance index, schedule performance index and status.Pitch your topic with ease and precision using this BCWP Project Management Performance Measures Download PDF This layout presents information on Schedule Variance, Cost Performance, Schedule Performance It is also available for immediate download and adjustment. So, changes can be made in the color, design, graphics or any other component to create a unique layout.
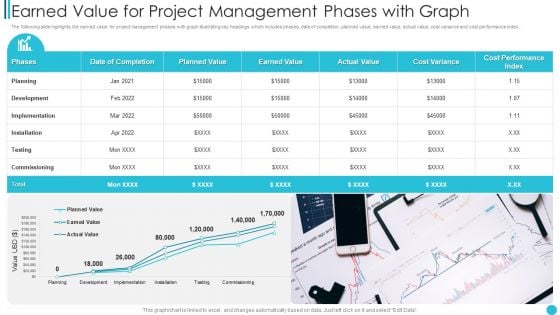
Earned Value For Project Management Phases With Graph Microsoft PDF
The following slide highlights the earned value for project management phases with graph illustrating key headings which includes phases, date of completion, planned value, earned value, actual value, cost variance and cost performance index.Pitch your topic with ease and precision using this Earned Value For Project Management Phases With Graph Microsoft PDF This layout presents information on Implementation, Installation, Commissioning It is also available for immediate download and adjustment. So, changes can be made in the color, design, graphics or any other component to create a unique layout.
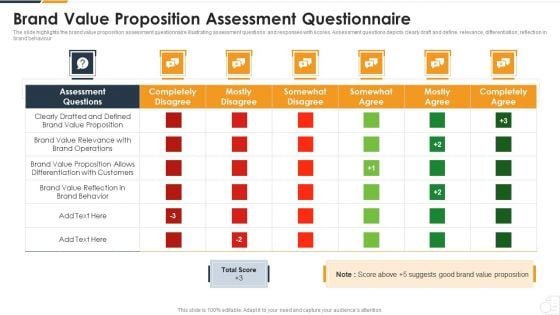
Brand Value Proposition Assessment Questionnaire Download PDF
The slide highlights the brand value proposition assessment questionnaire illustrating assessment questions and responses with scores. Assessment questions depicts clearly draft and define, relevance, differentiation, reflection in brand behaviour Pitch your topic with ease and precision using this Brand Value Proposition Assessment Questionnaire Download PDF This layout presents information on Assessment Questions, Completely Disagree, Mostly Disagree It is also available for immediate download and adjustment. So, changes can be made in the color, design, graphics or any other component to create a unique layout.
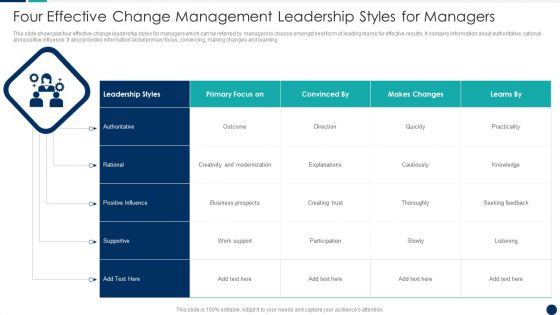
Four Effective Change Management Leadership Styles For Managers Sample PDF
This slide showcase four effective change leadership styles for managers which can be referred by managers to choose amongst best form of leading teams for effective results. It contains information about authoritative, rational and positive influence. It also provides information about primary focus, convincing, making changes and learning Pitch your topic with ease and precision using this Four Effective Change Management Leadership Styles For Managers Sample PDF This layout presents information on Creativity Modernization, Positive Influence, Makes Changes It is also available for immediate download and adjustment. So, changes can be made in the color, design, graphics or any other component to create a unique layout.
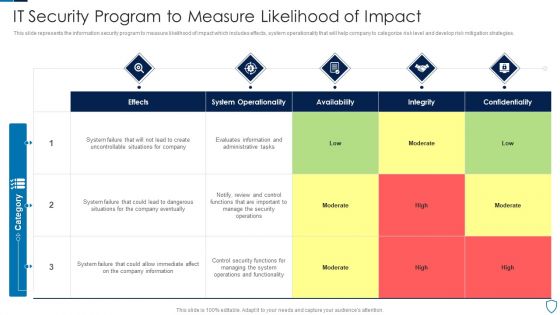
IT Security Program To Measure Likelihood Of Impact Topics PDF
This slide represents the information security program to measure likelihood of impact which includes effects, system operationality that will help company to categorize risk level and develop risk mitigation strategies.Pitch your topic with ease and precision using this IT Security Program To Measure Likelihood Of Impact Topics PDF This layout presents information on System Operationality, Uncontrollable Situations, Confidentiality It is also available for immediate download and adjustment. So, changes can be made in the color, design, graphics or any other component to create a unique layout.
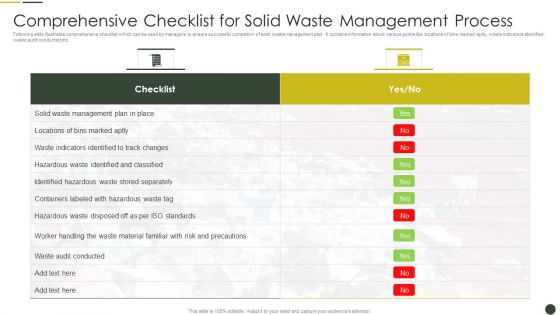
Comprehensive Checklist For Solid Waste Management Process Template PDF
Following slide illustrates comprehensive checklist which can be used by managers to ensure successful completion of solid waste management plan. It contains information about various points like locations of bins marked aptly, waste indicators identified, waste audit conducted etc. Pitch your topic with ease and precision using this Comprehensive Checklist For Solid Waste Management Process Template PDF This layout presents information on Locations Bins, Indicators Identified Worker Handling It is also available for immediate download and adjustment. So, changes can be made in the color, design, graphics or any other component to create a unique layout.
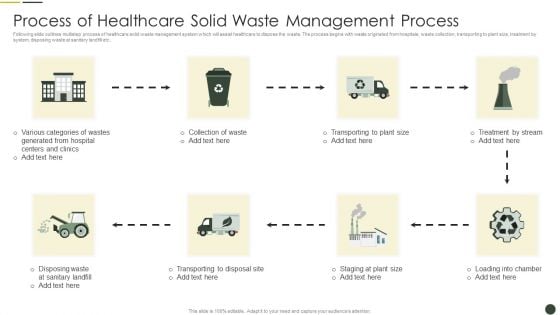
Process Of Healthcare Solid Waste Management Process Slides PDF
Following slide outlines multistep process of healthcare solid waste management system which will assist healthcare to dispose the waste. The process begins with waste originated from hospitals, waste collection, transporting to plant size, treatment by system, disposing waste at sanitary landfill etc. Pitch your topic with ease and precision using this Process Of Healthcare Solid Waste Management Process Slides PDF This layout presents information on Various Categories, Generated Hospital, Collection Waste It is also available for immediate download and adjustment. So, changes can be made in the color, design, graphics or any other component to create a unique layout.
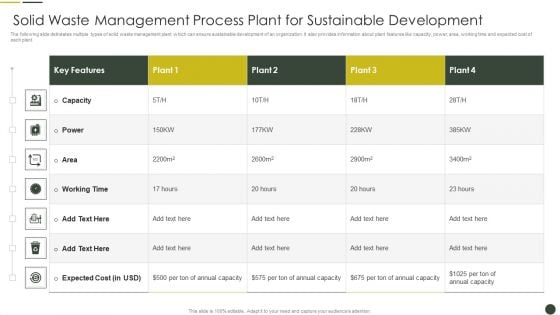
Solid Waste Management Process Plant For Sustainable Development Inspiration PDF
The following slide delineates multiple types of solid waste management plant which can ensure sustainable development of an organization. It also provides information about plant features like capacity, power, area, working time and expected cost of each plant. Pitch your topic with ease and precision using this Solid Waste Management Process Plant For Sustainable Development Inspiration PDF This layout presents information on Solid Waste, Management Process, Plant Sustainable It is also available for immediate download and adjustment. So, changes can be made in the color, design, graphics or any other component to create a unique layout.
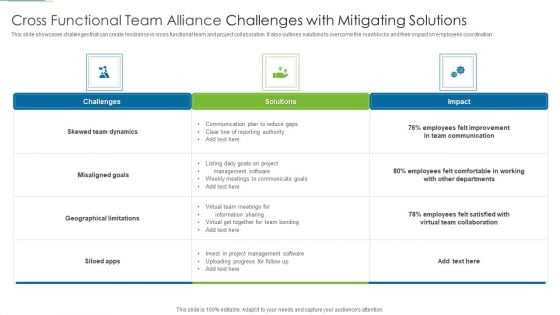
Cross Functional Team Alliance Challenges With Mitigating Solutions Pictures PDF
This slide showcases challenges that can create hindrance in cross functional team and project collaboration. It also outlines solutions to overcome the roadblocks and their impact on employees coordination Pitch your topic with ease and precision using this Cross Functional Team Alliance Challenges With Mitigating Solutions Pictures PDF This layout presents information on Geographical Limitations, Team Dynamics, Communicate Goals It is also available for immediate download and adjustment. So, changes can be made in the color, design, graphics or any other component to create a unique layout.
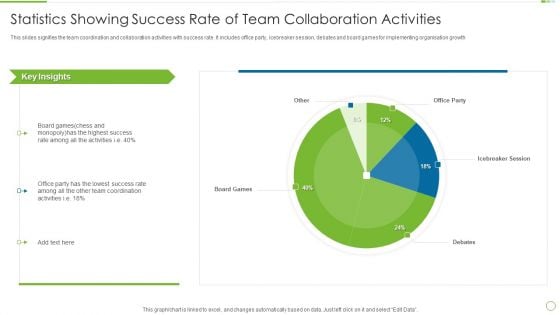
Statistics Showing Success Rate Of Team Collaboration Activities Information PDF
This slides signifies the team coordination and collaboration activities with success rate. It includes office party, icebreaker session, debates and board games for implementing organisation growth. Pitch your topic with ease and precision using this Statistics Showing Success Rate Of Team Collaboration Activities Information PDF This layout presents information on Highest Success, Lowest Success, Team Coordination It is also available for immediate download and adjustment. So, changes can be made in the color, design, graphics or any other component to create a unique layout.

Comparative Analysis Of Debt Recovery Agency Portrait PDF
This slide showcases comparative analysis of various debt collection service providers and agencies which can be referred by creditors who want to realize and collect their pending payments. It includes information about ranking, agency, rating, best for, hidden costs, online portal dashboard, credit analysis and pricing.Pitch your topic with ease and precision using this Comparative Analysis Of Debt Recovery Agency Portrait PDF This layout presents information on Corporate Companies, Businesses Or Individuals, Credit Analysis It is also available for immediate download and adjustment. So, changes can be made in the color, design, graphics or any other component to create a unique layout.
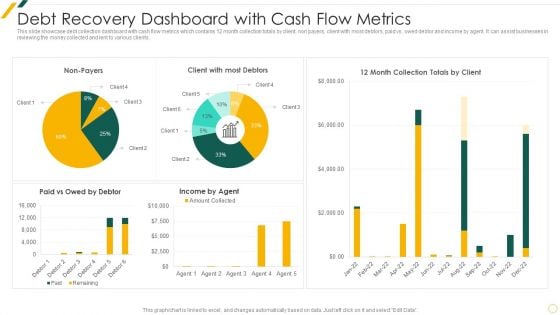
Debt Recovery Dashboard With Cash Flow Metrics Summary PDF
This slide showcase debt collection dashboard with cash flow metrics which contains 12 month collection totals by client, non payers, client with most debtors, paid vs. owed debtor and income by agent. It can assist businesses in reviewing the money collected and lent to various clients.Pitch your topic with ease and precision using this Debt Recovery Dashboard With Cash Flow Metrics Summary PDF This layout presents information on Debt Recovery, Dashboard Cash, Flow Metrics It is also available for immediate download and adjustment. So, changes can be made in the color, design, graphics or any other component to create a unique layout.
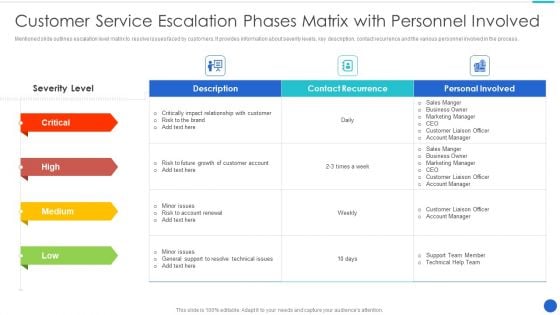
Customer Service Escalation Phases Matrix With Personnel Involved Topics PDF
Mentioned slide outlines escalation level matrix to resolve issues faced by customers. It provides information about severity levels, key description, contact recurrence and the various personnel involved in the process.Pitch your topic with ease and precision using this Customer Service Escalation Phases Matrix With Personnel Involved Topics PDF This layout presents information on Contact Recurrence, Personal Involved, Relationship With Customer It is also available for immediate download and adjustment. So, changes can be made in the color, design, graphics or any other component to create a unique layout.
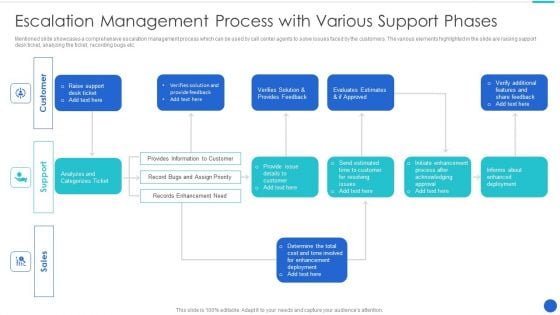
Escalation Management Process With Various Support Phases Download PDF
Mentioned slide showcases a comprehensive escalation management process which can be used by call center agents to solve issues faced by the customers. The various elements highlighted in the slide are raising support desk ticket, analyzing the ticket, recording bugs etc.Pitch your topic with ease and precision using this Escalation Management Process With Various Support Phases Download PDF This layout presents information on Initiate Enhancement, Provides Information, Enhancement Deployment It is also available for immediate download and adjustment. So, changes can be made in the color, design, graphics or any other component to create a unique layout.
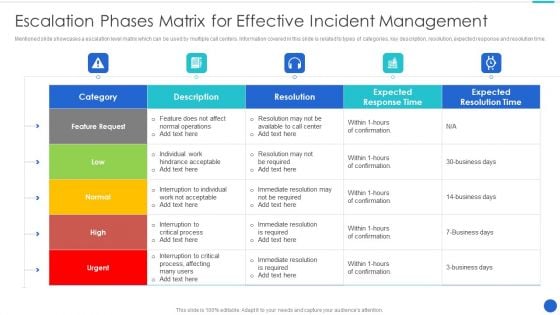
Escalation Phases Matrix For Effective Incident Management Sample PDF
Mentioned slide showcases a escalation level matrix which can be used by multiple call centers. Information covered in this slide is related to types of categories, key description, resolution, expected response and resolution time.Pitch your topic with ease and precision using this Escalation Phases Matrix For Effective Incident Management Sample PDF This layout presents information on Expected Response, Expected Resolution, Immediate Resolution It is also available for immediate download and adjustment. So, changes can be made in the color, design, graphics or any other component to create a unique layout.
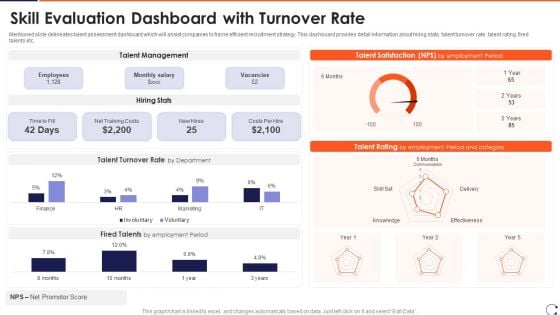
Skill Evaluation Dashboard With Turnover Rate Ideas PDF
Mentioned slide delineates talent assessment dashboard which will assist companies to frame efficient recruitment strategy. This dashboard provides detail information about hiring stats, talent turnover rate, talent rating, fired talents etc.Pitch your topic with ease and precision using this Skill Evaluation Dashboard With Turnover Rate Ideas PDF This layout presents information on Talent Management, Talent Satisfaction, Talent Rating It is also available for immediate download and adjustment. So, changes can be made in the color, design, graphics or any other component to create a unique layout.
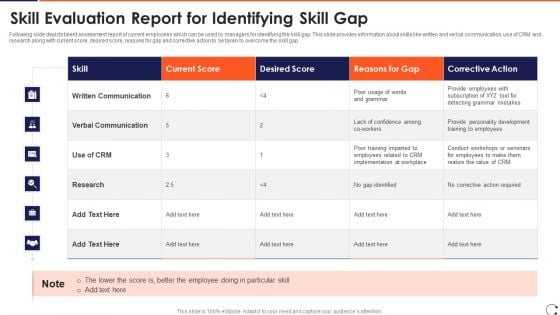
Skill Evaluation Report For Identifying Skill Gap Microsoft PDF
Following slide depicts talent assessment report of current employees which can be used by managers for identifying the skill gap. This slide provides information about skills like written and verbal communication, use of CRM and research along with current score, desired score, reasons for gap and corrective action to be taken to overcome the skill gap.Pitch your topic with ease and precision using this Skill Evaluation Report For Identifying Skill Gap Microsoft PDF This layout presents information on Verbal Communication, Corrective Required, Provide Personality It is also available for immediate download and adjustment. So, changes can be made in the color, design, graphics or any other component to create a unique layout.
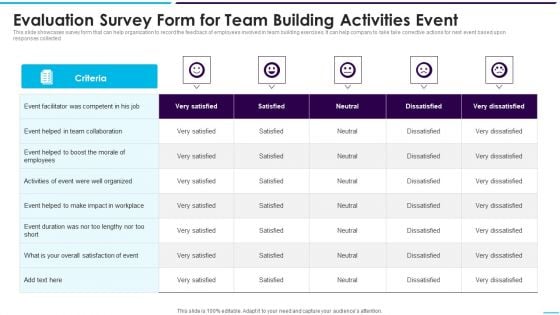
Evaluation Survey Form For Team Building Activities Event Template PDF
This slide showcases survey form that can help organization to record the feedback of employees involved in team building exercises. It can help company to take take corrective actions for next event based upon responses collected.Pitch your topic with ease and precision using this Evaluation Survey Form For Team Building Activities Event Template PDF This layout presents information on Dissatisfied, Overall Satisfaction, Event Facilitator It is also available for immediate download and adjustment. So, changes can be made in the color, design, graphics or any other component to create a unique layout.
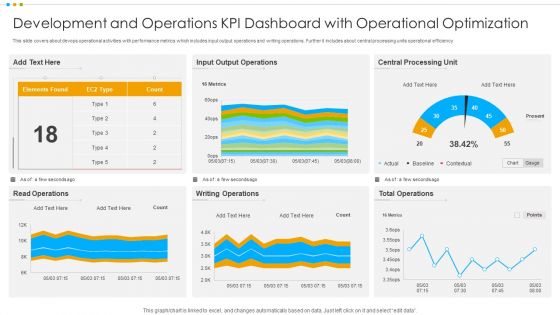
Development And Operations KPI Dashboard With Operational Optimization Pictures PDF
This slide covers about devops operational activities with performance metrics which includes input output operations and writing operations. Further it includes about central processing units operational efficiency.Pitch your topic with ease and precision using this Development And Operations KPI Dashboard With Operational Optimization Pictures PDF This layout presents information on Output Operations, Central Processing, Total Operations It is also available for immediate download and adjustment. So, changes can be made in the color, design, graphics or any other component to create a unique layout.
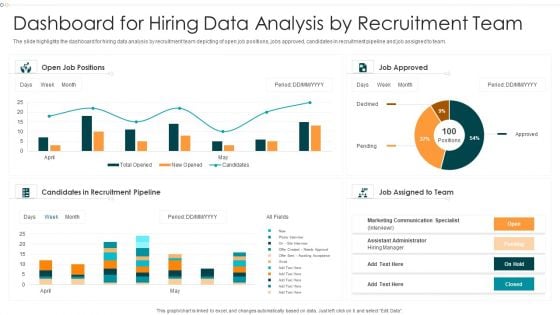
Dashboard For Hiring Data Analysis By Recruitment Team Formats PDF
The slide highlights the dashboard for hiring data analysis by recruitment team depicting of open job positions, jobs approved, candidates in recruitment pipeline and job assigned to team.Pitch your topic with ease and precision using this Dashboard For Hiring Data Analysis By Recruitment Team Formats PDF This layout presents information on Candidates Recruitment, Marketing Communication, Approved It is also available for immediate download and adjustment. So, changes can be made in the color, design, graphics or any other component to create a unique layout.
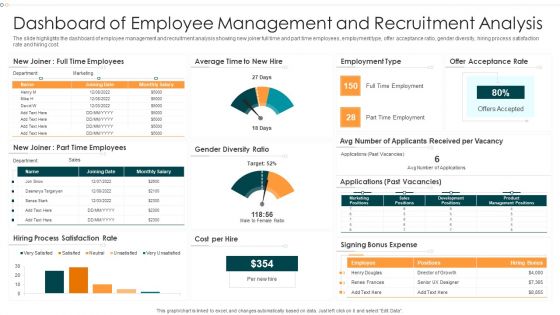
Dashboard Of Employee Management And Recruitment Analysis Infographics PDF
The slide highlights the dashboard of employee management and recruitment analysis showing new joiner full time and part time employees, employment type, offer acceptance ratio, gender diversity, hiring process satisfaction rate and hiring cost.Pitch your topic with ease and precision using this Dashboard Of Employee Management And Recruitment Analysis Infographics PDF This layout presents information on Dashboard Employee, Management, Recruitment Analysis It is also available for immediate download and adjustment. So, changes can be made in the color, design, graphics or any other component to create a unique layout.
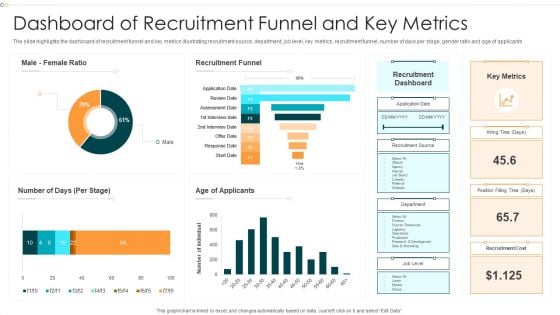
Dashboard Of Recruitment Funnel And Key Metrics Information PDF
The slide highlights the dashboard of recruitment funnel and key metrics illustrating recruitment source, department, job level, key metrics, recruitment funnel, number of days per stage, gender ratio and age of applicants.Pitch your topic with ease and precision using this Dashboard Of Recruitment Funnel And Key Metrics Information PDF This layout presents information on Recruitment Funnel, Recruitment Dashboard, Recruitment Cost It is also available for immediate download and adjustment. So, changes can be made in the color, design, graphics or any other component to create a unique layout.
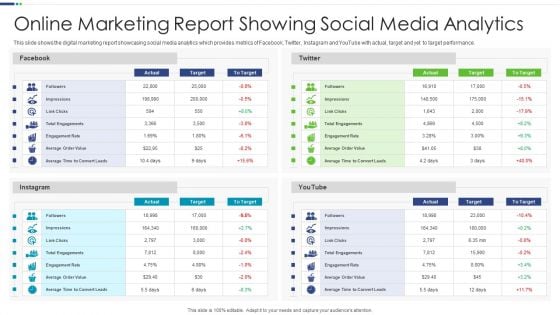
Online Marketing Report Showing Social Media Analytics Mockup PDF
This slide shows the digital marketing report showcasing social media analytics which provides metrics of Facebook, Twitter, Instagram and YouTube with actual, target and yet to target performance.Pitch your topic with ease and precision using this Online Marketing Report Showing Social Media Analytics Mockup PDF This layout presents information on Total Engagements, Marketing Report, Showing Analytics It is also available for immediate download and adjustment. So, changes can be made in the color, design, graphics or any other component to create a unique layout.
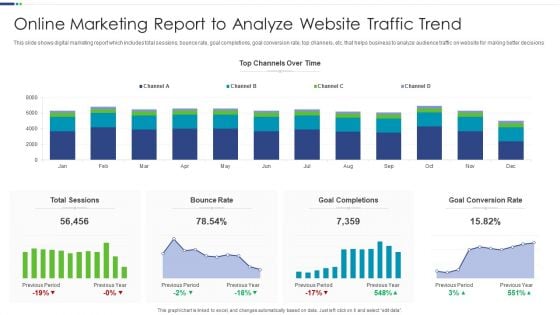
Online Marketing Report To Analyze Website Traffic Trend Introduction PDF
This slide shows digital marketing report which includes total sessions, bounce rate, goal completions, goal conversion rate, top channels, etc. that helps business to analyze audience traffic on website for making better decisions.Pitch your topic with ease and precision using this Online Marketing Report To Analyze Website Traffic Trend Introduction PDF This layout presents information on Goal Completions, Goal Conversion, Total Sessions It is also available for immediate download and adjustment. So, changes can be made in the color, design, graphics or any other component to create a unique layout.
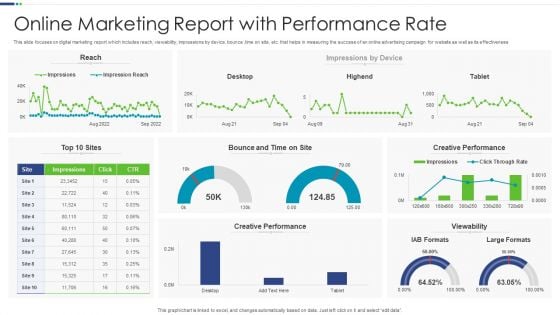
Online Marketing Report With Performance Rate Microsoft PDF
This slide focuses on digital marketing report which includes reach, viewability, impressions by device, bounce ,time on site, etc. that helps in measuring the success of an online advertising campaign for website as well as its effectiveness.Pitch your topic with ease and precision using this Online Marketing Report With Performance Rate Microsoft PDF This layout presents information on Creative Performance, Viewability, Creative Performance It is also available for immediate download and adjustment. So, changes can be made in the color, design, graphics or any other component to create a unique layout.
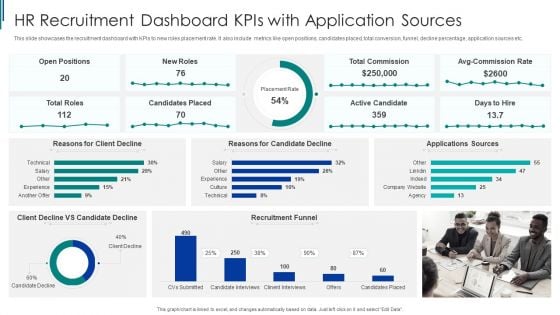
HR Recruitment Dashboard Kpis With Application Sources Ppt Pictures Styles PDF
This slide showcases the recruitment dashboard with KPIs to new roles placement rate. It also include metrics like open positions, candidates placed, total conversion, funnel, decline percentage, application sources etc. Pitch your topic with ease and precision using this HR Recruitment Dashboard Kpis With Application Sources Ppt Pictures Styles PDF. This layout presents information on Recruitment Funnel, HR Recruitment, Dashboard Kpis. It is also available for immediate download and adjustment. So, changes can be made in the color, design, graphics or any other component to create a unique layout.
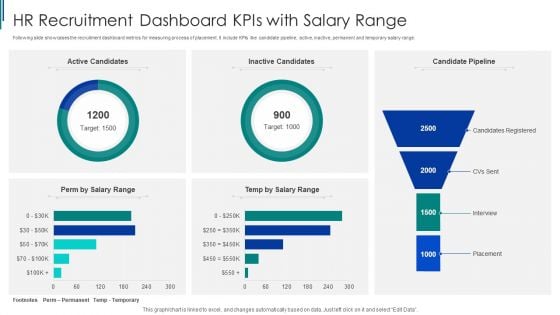
HR Recruitment Dashboard Kpis With Salary Range Ppt Inspiration Rules PDF
Following slide showcases the recruitment dashboard metrics for measuring process of placement. It include KPIs like candidate pipeline, active, inactive, permanent and temporary salary range. Pitch your topic with ease and precision using this HR Recruitment Dashboard Kpis With Salary Range Ppt Inspiration Rules PDF. This layout presents information on HR Recruitment, Dashboard Kpis, Salary Range. It is also available for immediate download and adjustment. So, changes can be made in the color, design, graphics or any other component to create a unique layout.
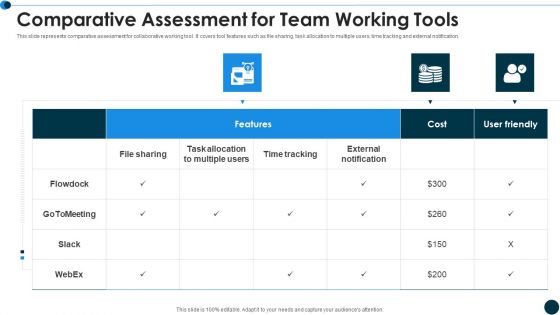
Comparative Assessment For Team Working Tools Ppt Background Image PDF
This slide represents comparative assessment for collaborative working tool. It covers tool features such as file sharing, task allocation to multiple users, time tracking and external notification. Pitch your topic with ease and precision using this Comparative Assessment For Team Working Tools Ppt Background Image PDF. This layout presents information on Cost, Team Working, Comparative Assessment. It is also available for immediate download and adjustment. So, changes can be made in the color, design, graphics or any other component to create a unique layout.
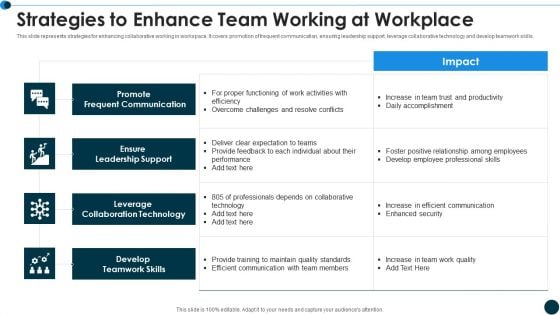
Strategies To Enhance Team Working At Workplace Ppt Pictures Objects PDF
This slide represents strategies for enhancing collaborative working in workspace. It covers promotion of frequent communication, ensuring leadership support, leverage collaborative technology and develop teamwork skills. Pitch your topic with ease and precision using this Strategies To Enhance Team Working At Workplace Ppt Pictures Objects PDF. This layout presents information on Promote Frequent Communication, Leverage Collaboration Technology, Develop Teamwork Skills. It is also available for immediate download and adjustment. So, changes can be made in the color, design, graphics or any other component to create a unique layout.
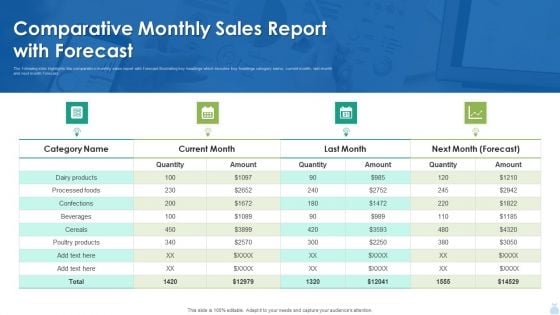
Comparative Monthly Sales Report With Forecast Portrait PDF
The following slide highlights the comparative monthly sales report with forecast illustrating key headings which includes key headings category name, current month, last month and next month forecast. Pitch your topic with ease and precision using this Comparative Monthly Sales Report With Forecast Portrait PDF. This layout presents information on Quantity, Monthly Sales Report, Dairy Products. It is also available for immediate download and adjustment. So, changes can be made in the color, design, graphics or any other component to create a unique layout.
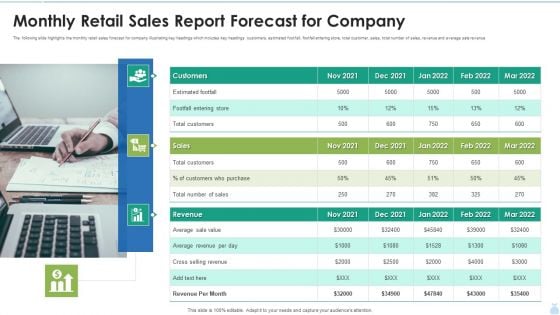
Monthly Retail Sales Report Forecast For Company Introduction PDF
The following slide highlights the monthly retail sales forecast for company illustrating key headings which includes key headings customers, estimated footfall, footfall entering store, total customer, sales, total number of sales, revenue and average sale revenue. Pitch your topic with ease and precision using this Monthly Retail Sales Report Forecast For Company Introduction PDF. This layout presents information on Customers, Sales, Revenue. It is also available for immediate download and adjustment. So, changes can be made in the color, design, graphics or any other component to create a unique layout.
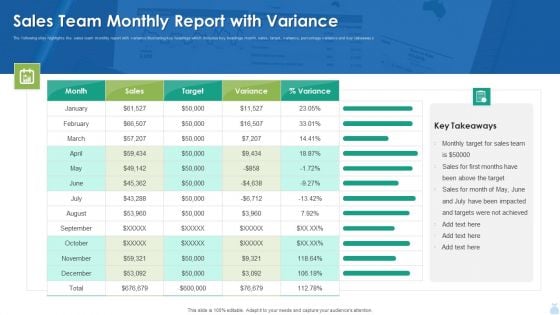
Sales Team Monthly Report With Variance Background PDF
The following slide highlights the sales team monthly report with variance illustrating key headings which includes key headings month, sales, target, variance, percentage variance and key takeaways. Pitch your topic with ease and precision using this Sales Team Monthly Report With Variance Background PDF. This layout presents information on Sales Team Monthly Report With Variance Background PDF. It is also available for immediate download and adjustment. So, changes can be made in the color, design, graphics or any other component to create a unique layout.
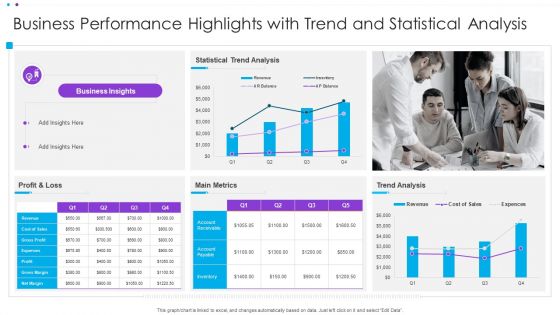
Business Performance Highlights With Trend And Statistical Analysis Ppt Infographic Template Display PDF
This graph or chart is linked to excel, and changes automatically based on data. Just left click on it and select Edit Data. Pitch your topic with ease and precision using this Business Performance Highlights With Trend And Statistical Analysis Ppt Infographic Template Display PDF. This layout presents information on Statistical Trend Analysis, Main Metrics, Profit And Loss. It is also available for immediate download and adjustment. So, changes can be made in the color, design, graphics or any other component to create a unique layout.
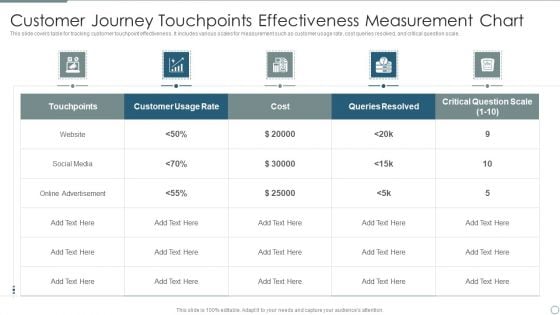
Customer Journey Touchpoints Effectiveness Measurement Chart Guidelines PDF
This slide covers table for tracking customer touchpoint effectiveness. It includes various scales for measurement such as customer usage rate, cost queries resolved, and critical question scale. Pitch your topic with ease and precision using this Customer Journey Touchpoints Effectiveness Measurement Chart Guidelines PDF. This layout presents information on Social Media, Online Advertisement, Customer Usage Rate. It is also available for immediate download and adjustment. So, changes can be made in the color, design, graphics or any other component to create a unique layout.
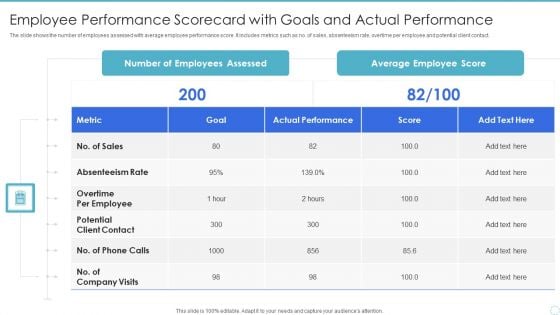
Employee Performance Scorecard With Goals And Actual Performance Guidelines PDF
The slide shows the number of employees assessed with average employee performance score. It includes metrics such as no. of sales, absenteeism rate, overtime per employee and potential client contact. Pitch your topic with ease and precision using this Employee Performance Scorecard With Goals And Actual Performance Guidelines PDF. This layout presents information on Potential Client Contact, Absenteeism Rate, Average Employee Score. It is also available for immediate download and adjustment. So, changes can be made in the color, design, graphics or any other component to create a unique layout.
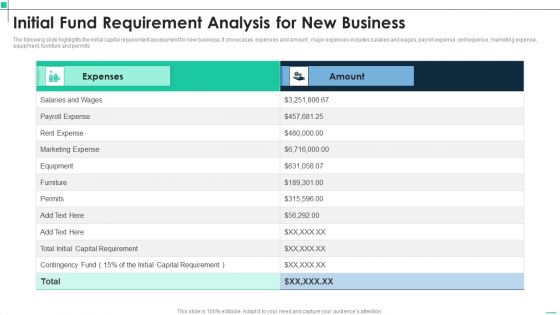
Initial Fund Requirement Analysis For New Business Portrait PDF
The following slide highlights the initial capital requirement assessment for new business. It showcases expenses and amount , major expenses includes salaries and wages, payroll expense, rent expense, marketing expense, equipment, furniture and permits. Pitch your topic with ease and precision using this Initial Fund Requirement Analysis For New Business Portrait PDF. This layout presents information on Marketing Expense, Equipment, Payroll Expense. It is also available for immediate download and adjustment. So, changes can be made in the color, design, graphics or any other component to create a unique layout.
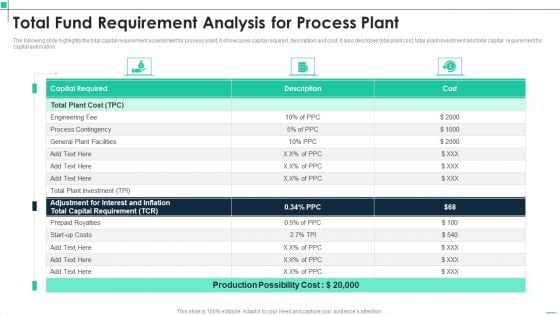
Total Fund Requirement Analysis For Process Plant Infographics PDF
The following slide highlights the total capital requirement assessment for process plant, It showcases capital required, description and cost. It also describes total plant cost, total plant investment and total capital requirement for capital estimation. Pitch your topic with ease and precision using this Total Fund Requirement Analysis For Process Plant Infographics PDF. This layout presents information on Total Plant Investment, Capital Requirement, Capital Required. It is also available for immediate download and adjustment. So, changes can be made in the color, design, graphics or any other component to create a unique layout.
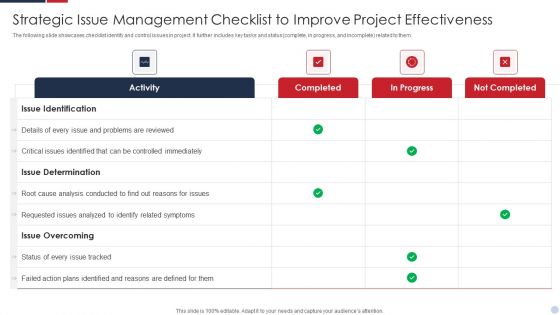
Strategic Issue Management Checklist To Improve Project Effectiveness Infographics PDF
The following slide showcases checklist identify and control issues in project. It further includes key tasks and status complete, in progress, and incomplete related to them. Pitch your topic with ease and precision using this Strategic Issue Management Checklist To Improve Project Effectiveness Infographics PDF. This layout presents information on Issue Overcoming, Issue Identification, Issue Determination. It is also available for immediate download and adjustment. So, changes can be made in the color, design, graphics or any other component to create a unique layout.
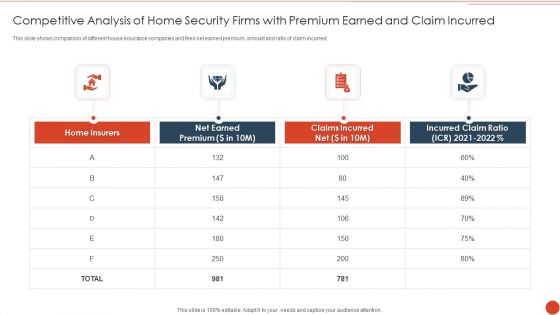
Competitive Analysis Of Home Security Firms With Premium Earned And Claim Incurred Microsoft PDF
This slide shows comparison of different house insurance companies and their net earned premium, amount and ratio of claim incurred. Pitch your topic with ease and precision using this Competitive Analysis Of Home Security Firms With Premium Earned And Claim Incurred Microsoft PDF. This layout presents information on Incurred Claim Ratio, Claims Incurred Net, Net Earned Premium. It is also available for immediate download and adjustment. So, changes can be made in the color, design, graphics or any other component to create a unique layout.
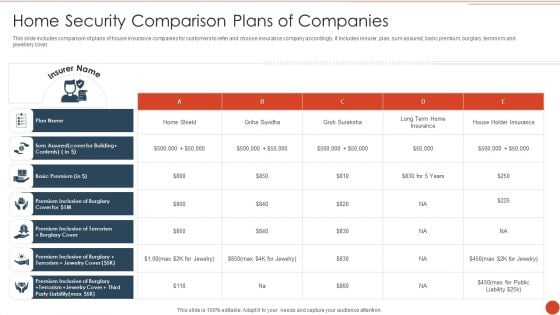
Home Security Comparison Plans Of Companies Formats PDF
This slide includes comparison of plans of house insurance companies for customers to refer and choose insurance company accordingly. It includes insurer, plan, sum assured, basic premium, burglary, terrorism and jewellery cover. Pitch your topic with ease and precision using this Home Security Comparison Plans Of Companies Formats PDF. This layout presents information on Basic Premium, Plan Name, House Holder Insurance. It is also available for immediate download and adjustment. So, changes can be made in the color, design, graphics or any other component to create a unique layout.
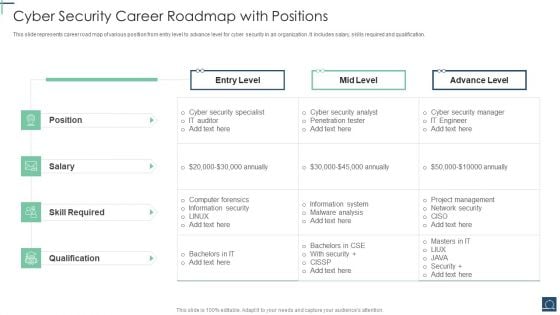
Cyber Security Career Roadmap With Positions Ppt PowerPoint Presentation File Portrait PDF
This slide represents career road map of various position from entry level to advance level for cyber security in an organization .It includes salary, skills required and qualification. Pitch your topic with ease and precision using this Cyber Security Career Roadmap With Positions Ppt PowerPoint Presentation File Portrait PDF. This layout presents information on Cyber Security Specialist, Skill Required, Advance Level. It is also available for immediate download and adjustment. So, changes can be made in the color, design, graphics or any other component to create a unique layout.
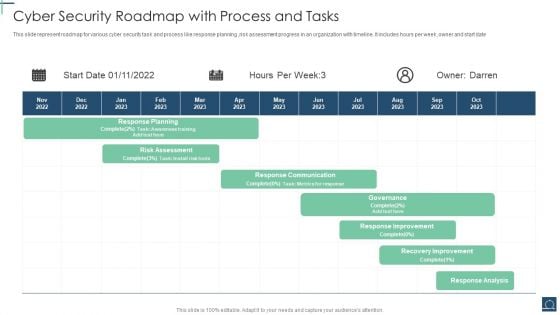
Cyber Security Roadmap With Process And Tasks Ppt PowerPoint Presentation Gallery Topics PDF
This slide represent roadmap for various cyber security task and process like response planning ,risk assessment progress in an organization with timeline. It includes hours per week ,owner and start date. Pitch your topic with ease and precision using this Cyber Security Roadmap With Process And Tasks Ppt PowerPoint Presentation Gallery Topics PDF. This layout presents information on Response Planning, Risk Assessment, Response Communication. It is also available for immediate download and adjustment. So, changes can be made in the color, design, graphics or any other component to create a unique layout.
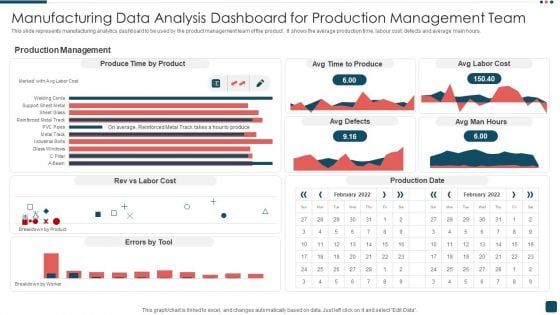
Manufacturing Data Analysis Dashboard For Production Management Team Summary PDF
This slide represents manufacturing analytics dashboard to be used by the product management team of the product . It shows the average production time, labour cost, defects and average main hours. Pitch your topic with ease and precision using this Manufacturing Data Analysis Dashboard For Production Management Team Summary PDF. This layout presents information on Production Management, Product, Cost. It is also available for immediate download and adjustment. So, changes can be made in the color, design, graphics or any other component to create a unique layout.
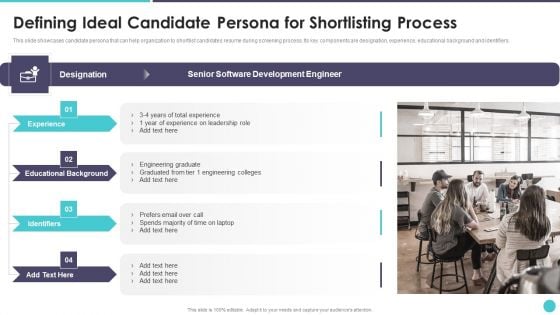
Action Plan To Optimize Hiring Process Defining Ideal Candidate Persona For Shortlisting Process Clipart PDF
This slide showcases candidate persona that can help organization to shortlist candidates resume during screening process. Its key components are designation, experience, educational background and identifiers.This is a Action Plan To Optimize Hiring Process Defining Ideal Candidate Persona For Shortlisting Process Clipart PDF template with various stages. Focus and dispense information on four stages using this creative set, that comes with editable features. It contains large content boxes to add your information on topics like Educational Background, Experience, Identifiers You can also showcase facts, figures, and other relevant content using this PPT layout. Grab it now.
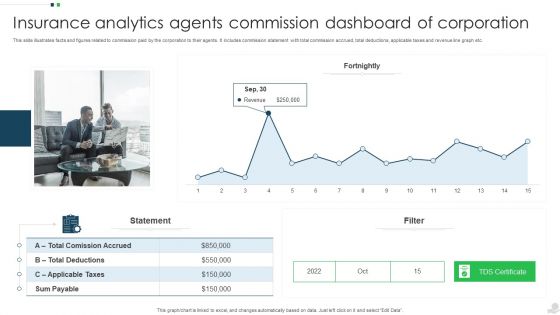
Insurance Analytics Agents Commission Dashboard Of Corporation Introduction PDF
This slide illustrates facts and figures related to commission paid by the corporation to their agents. It includes commission statement with total commission accrued, total deductions, applicable taxes and revenue line graph etc. Pitch your topic with ease and precision using this Insurance Analytics Agents Commission Dashboard Of Corporation Introduction PDF. This layout presents information on Applicable Taxes, Sum Payable, Revenue. It is also available for immediate download and adjustment. So, changes can be made in the color, design, graphics or any other component to create a unique layout.
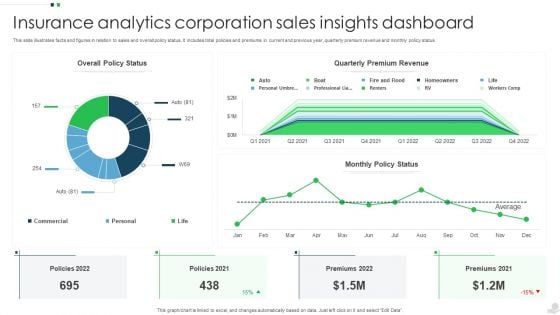
Insurance Analytics Corporation Sales Insights Dashboard Structure PDF
This slide illustrates facts and figures in relation to sales and overall policy status. It includes total policies and premiums in current and previous year, quarterly premium revenue and monthly policy status. Pitch your topic with ease and precision using this Insurance Analytics Corporation Sales Insights Dashboard Structure PDF. This layout presents information on Quarterly Premium Revenue, Sales Insights Dashboard, Insurance Analytics Corporation. It is also available for immediate download and adjustment. So, changes can be made in the color, design, graphics or any other component to create a unique layout.


 Continue with Email

 Home
Home


