Organizational Icons
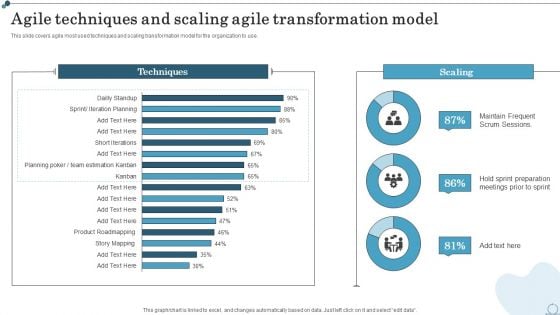
Agile Techniques And Scaling Agile Transformation Model Agile IT Methodology Introduction PDF
This slide covers agile most used techniques and scaling transformation model for the organization to use. If your project calls for a presentation, then Slidegeeks is your go-to partner because we have professionally designed, easy-to-edit templates that are perfect for any presentation. After downloading, you can easily edit Agile Techniques And Scaling Agile Transformation Model Agile IT Methodology Introduction PDF and make the changes accordingly. You can rearrange slides or fill them with different images. Check out all the handy templates.
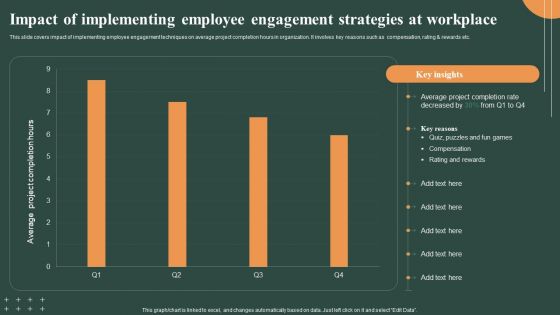
Techniques To Optimize Impact Of Implementing Employee Engagement Strategies Slides PDF
This slide covers impact of implementing employee engagement techniques on average project completion hours in organization. It involves key reasons such as compensation, rating and rewards etc. There are so many reasons you need a Techniques To Optimize Impact Of Implementing Employee Engagement Strategies Slides PDF. The first reason is you cant spend time making everything from scratch, Thus, Slidegeeks has made presentation templates for you too. You can easily download these templates from our website easily.
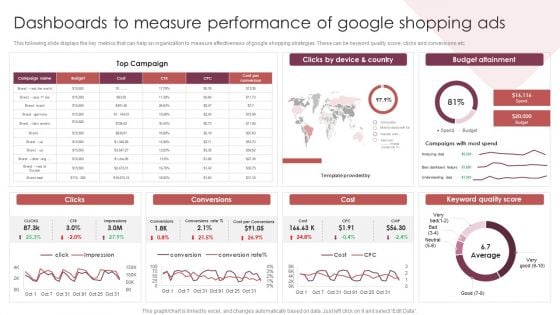
E Commerce Marketing Techniques To Boost Sales Dashboards To Measure Performance Of Google Shopping Ads Formats PDF
This following slide displays the key metrics that can help an organization to measure effectiveness of google shopping strategies. These can be keyword quality score, clicks and conversions etc. Whether you have daily or monthly meetings, a brilliant presentation is necessary. E Commerce Marketing Techniques To Boost Sales Dashboards To Measure Performance Of Google Shopping Ads Formats PDF can be your best option for delivering a presentation. Represent everything in detail using E Commerce Marketing Techniques To Boost Sales Dashboards To Measure Performance Of Google Shopping Ads Formats PDF and make yourself stand out in meetings. The template is versatile and follows a structure that will cater to your requirements. All the templates prepared by Slidegeeks are easy to download and edit. Our research experts have taken care of the corporate themes as well. So, give it a try and see the results.
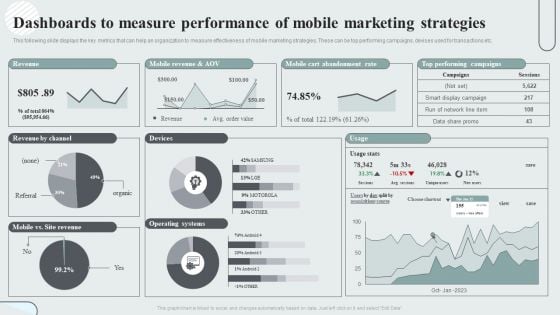
Techniques To Enhance Customer Engagement Via Digital Platforms Dashboards To Measure Performance Of Mobile Marketing Strategies Slides PDF
This following slide displays the key metrics that can help an organization to measure effectiveness of mobile marketing strategies. These can be top performing campaigns, devises used for transactions etc. Whether you have daily or monthly meetings, a brilliant presentation is necessary. Techniques To Enhance Customer Engagement Via Digital Platforms Dashboards To Measure Performance Of Mobile Marketing Strategies Slides PDF can be your best option for delivering a presentation. Represent everything in detail using Techniques To Enhance Customer Engagement Via Digital Platforms Dashboards To Measure Performance Of Mobile Marketing Strategies Slides PDF and make yourself stand out in meetings. The template is versatile and follows a structure that will cater to your requirements. All the templates prepared by Slidegeeks are easy to download and edit. Our research experts have taken care of the corporate themes as well. So, give it a try and see the results.
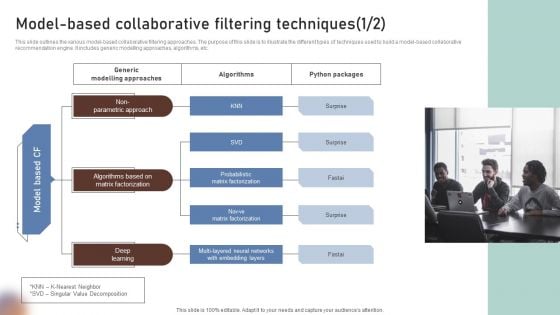
Model Based Collaborative Filtering Techniques Designs PDF
This slide outlines the various model-based collaborative filtering approaches. The purpose of this slide is to illustrate the different types of techniques used to build a model-based collaborative recommendation engine. It includes generic modelling approaches, algorithms, etc.Whether you have daily or monthly meetings, a brilliant presentation is necessary. Model Based Collaborative Filtering Techniques Designs PDF can be your best option for delivering a presentation. Represent everything in detail using Model Based Collaborative Filtering Techniques Designs PDF and make yourself stand out in meetings. The template is versatile and follows a structure that will cater to your requirements. All the templates prepared by Slidegeeks are easy to download and edit. Our research experts have taken care of the corporate themes as well. So, give it a try and see the results.
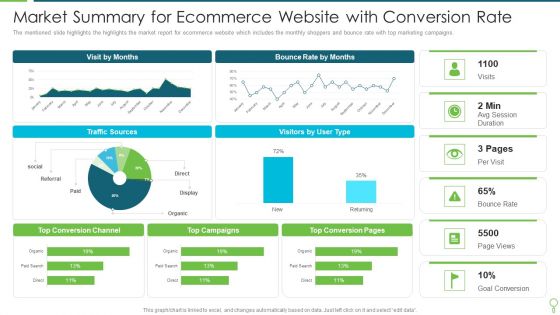
Market Summary For Ecommerce Website With Conversion Rate Diagrams PDF
The mentioned slide highlights the highlights the market report for ecommerce website which includes the monthly shoppers and bounce rate with top marketing campaigns. Pitch your topic with ease and precision using this Market Summary For Ecommerce Website With Conversion Rate Diagrams PDF. This layout presents information on Market Summary For Ecommerce Website With Conversion Rate. It is also available for immediate download and adjustment. So, changes can be made in the color, design, graphics or any other component to create a unique layout.
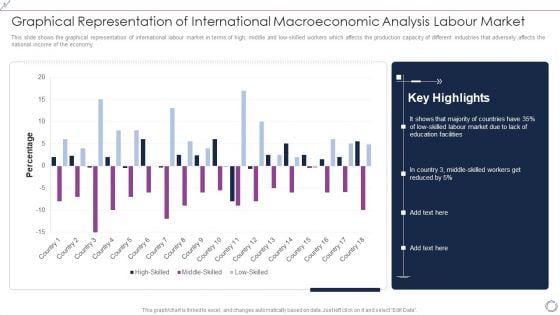
Graphical Representation Of International Macroeconomic Analysis Labour Market Diagrams PDF
This slide shows the graphical representation of international labour market in terms of high, middle and low-skilled workers which affects the production capacity of different industries that adversely affects the national income of the economy. Pitch your topic with ease and precision using this Graphical Representation Of International Macroeconomic Analysis Labour Market Diagrams PDF. This layout presents information on High Skilled, Middle Skilled, Low Skilled. It is also available for immediate download and adjustment. So, changes can be made in the color, design, graphics or any other component to create a unique layout.
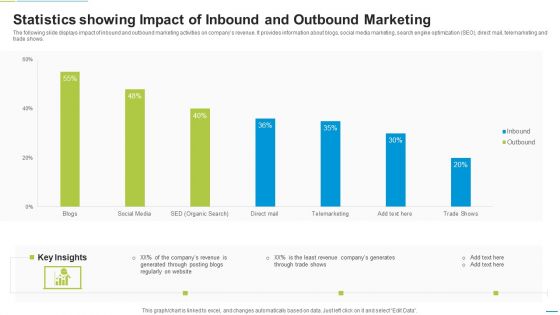
Statistics Showing Impact Of Inbound And Outbound Marketing Diagrams PDF
The following slide displays impact of inbound and outbound marketing activities on companys revenue. It provides information about blogs, social media marketing, search engine optimization SEO, direct mail, telemarketing and trade shows. Pitch your topic with ease and precision using this Statistics Showing Impact Of Inbound And Outbound Marketing Diagrams PDF. This layout presents information on Telemarketing, Social Media, Blogs. It is also available for immediate download and adjustment. So, changes can be made in the color, design, graphics or any other component to create a unique layout.
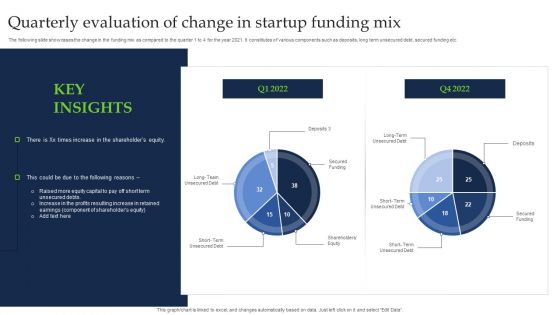
Quarterly Evaluation Of Change In Startup Funding Mix Diagrams PDF
The following slide showcases the change in the funding mix as compared to the quarter 1 to 4 for the year 2021. It constitutes of various components such as deposits, long term unsecured debt, secured funding etc. Showcasing this set of slides titled Quarterly Evaluation Of Change In Startup Funding Mix Diagrams PDF. The topics addressed in these templates are Secured Funding, Term Unsecured Debt, Shareholder Equity. All the content presented in this PPT design is completely editable. Download it and make adjustments in color, background, font etc. as per your unique business setting.
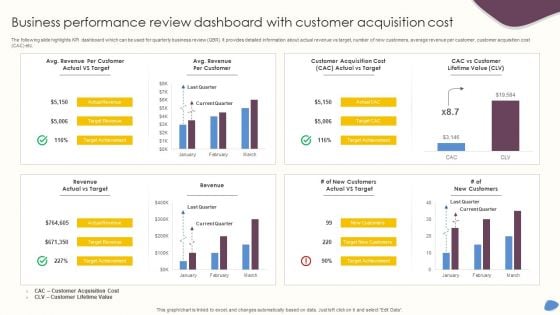
Business Performance Review Dashboard With Customer Acquisition Cost Diagrams PDF
The following slide highlights KPI dashboard which can be used for quarterly business review QBR. It provides detailed information about actual revenue vs target, number of new customers, average revenue per customer, customer acquisition cost CAC etc. Pitch your topic with ease and precision using this Business Performance Review Dashboard With Customer Acquisition Cost Diagrams PDF. This layout presents information on Revenue, Customer Acquisition Cost, Current Quarter. It is also available for immediate download and adjustment. So, changes can be made in the color, design, graphics or any other component to create a unique layout.
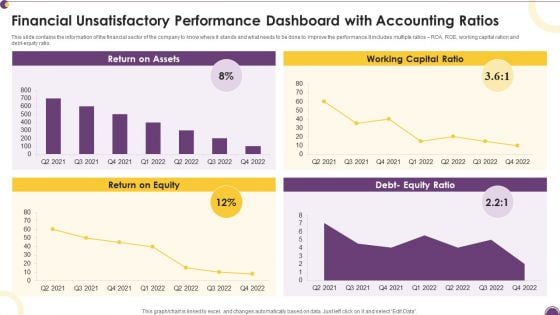
Financial Unsatisfactory Performance Dashboard With Accounting Ratios Diagrams PDF
This slide contains the information of the financial sector of the company to know where it stands and what needs to be done to improve the performance.It includes multiple ratios ROA, ROE, working capital ration and debt-equity ratio. Pitch your topic with ease and precision using this Financial Unsatisfactory Performance Dashboard With Accounting Ratios Diagrams PDF. This layout presents information on Return Assets, Working Capital, Return Equity. It is also available for immediate download and adjustment. So, changes can be made in the color, design, graphics or any other component to create a unique layout.
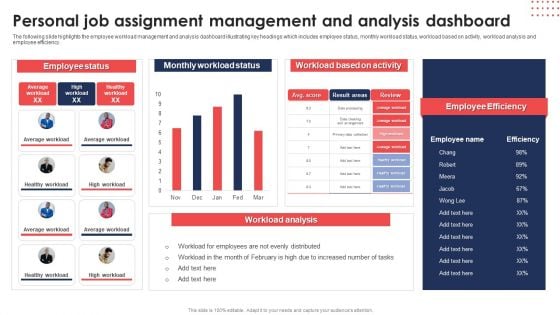
Personal Job Assignment Management And Analysis Dashboard Diagrams PDF
The following slide highlights the employee workload management and analysis dashboard illustrating key headings which includes employee status, monthly workload status, workload based on activity, workload analysis and employee efficiency. Pitch your topic with ease and precision using thisPersonal Job Assignment Management And Analysis Dashboard Diagrams PDF. This layout presents information on Employee Status, Monthly Workload Status, Workload Based Activity. It is also available for immediate download and adjustment. So, changes can be made in the color, design, graphics or any other component to create a unique layout.

Consulting Project Status Report Dashboard With Workspaces Diagrams PDF
The following slide showcases dashboard to provide an insight of active projects, their status and areas that require attention and improvement. Status included are on track, at risk and late Pitch your topic with ease and precision using this Consulting Project Status Report Dashboard With Workspaces Diagrams PDF. This layout presents information on Consulting Project Status Report, Dashboard With Workspaces. It is also available for immediate download and adjustment. So, changes can be made in the color, design, graphics or any other component to create a unique layout.
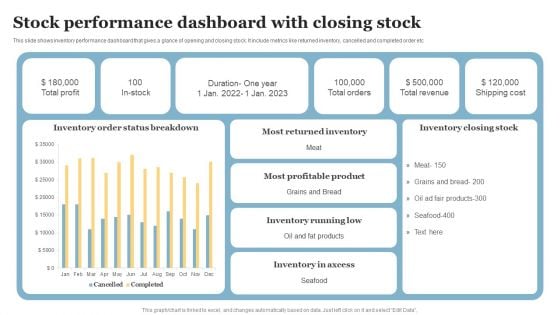
Stock Performance Dashboard With Closing Stock Diagrams PDF
This slide shows inventory performance dashboard that gives a glance of opening and closing stock. It include metrics like returned inventory, cancelled and completed order etc. Pitch your topic with ease and precision using this Stock Performance Dashboard With Closing Stock Diagrams PDF. This layout presents information on Most Returned Inventory, Most Profitable Product, Inventory Running Low. It is also available for immediate download and adjustment. So, changes can be made in the color, design, graphics or any other component to create a unique layout.
Executive Dashboards For Tracking Financial Health Of Enterprise Diagrams PDF
This slide represents the CEO dashboard to track the financial health of an organization. It includes key performance indicators such as revenue, expenses, activity ratio, gross profit margin, EBIT etc. Pitch your topic with ease and precision using this Executive Dashboards For Tracking Financial Health Of Enterprise Diagrams PDF. This layout presents information on Revenue, Expense, Activity Ratio. It is also available for immediate download and adjustment. So, changes can be made in the color, design, graphics or any other component to create a unique layout.
Plan Dashboard For Tracking Location Wise Revenue Diagrams PDF
This slide presents a dashboard which will assist managers to track the revenue of each branch having geographical presence in different corners of the world. The key performance indicators are total revenue, location wise rent, branch performance among many others.Pitch your topic with ease and precision using this Plan Dashboard For Tracking Location Wise Revenue Diagrams PDF. This layout presents information on Taxes Paid, Current Month, Branch Performance, Previous Quarter. It is also available for immediate download and adjustment. So, changes can be made in the color, design, graphics or any other component to create a unique layout.
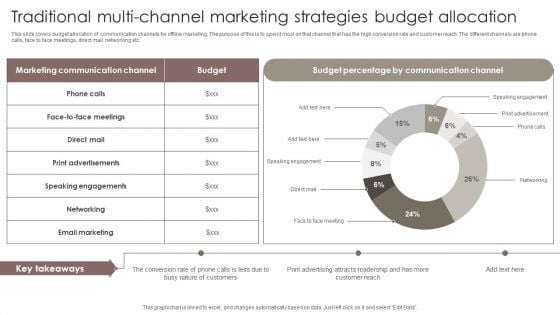
Traditional Multi Channel Marketing Strategies Budget Allocation Diagrams PDF
This slide covers budget allocation of communication channels for offline marketing. The purpose of this is to spend most on that channel that has the high conversion rate and customer reach. The different channels are phone calls, face to face meetings, direct mail, networking etc. Pitch your topic with ease and precision using this Traditional Multi Channel Marketing Strategies Budget Allocation Diagrams PDF. This layout presents information on Communication Channel, Budget Percentage, Speaking Engagements. It is also available for immediate download and adjustment. So, changes can be made in the color, design, graphics or any other component to create a unique layout.
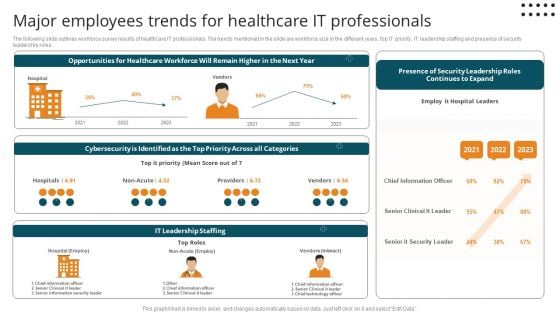
Major Employees Trends For Healthcare It Professionals Diagrams PDF
The following slide outlines workforce survey results of healthcare IT professionals. The trends mentioned in the slide are workforce size in the different years, top IT priority, IT leadership staffing and presence of security leadership roles.Pitch your topic with ease and precision using this Major Employees Trends For Healthcare It Professionals Diagrams PDF. This layout presents information on Cybersecurity Identified, Chief Information, Senior Clinical. It is also available for immediate download and adjustment. So, changes can be made in the color, design, graphics or any other component to create a unique layout.
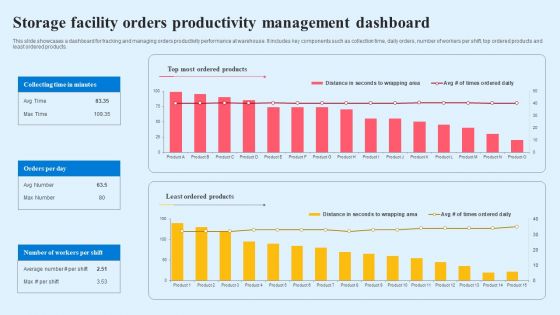
Storage Facility Orders Productivity Management Dashboard Diagrams PDF
This slide showcases a dashboard for tracking and managing orders productivity performance at warehouse. It includes key components such as collection time, daily orders, number of workers per shift, top ordered products and least ordered products. Showcasing this set of slides titled Storage Facility Orders Productivity Management Dashboard Diagrams PDF. The topics addressed in these templates are Top Most Ordered Products, Least Ordered Products, Orders Per Day. All the content presented in this PPT design is completely editable. Download it and make adjustments in color, background, font etc. as per your unique business setting.
Storage Facility Productivity Tracking And Management System Dashboard Diagrams PDF
This slide showcases a dashboard for managing and tracking warehouse productivity to optimize operational process. It includes key components such as user registered, subscribers request, orders, sales, transaction summary and top profiles. Showcasing this set of slides titled Storage Facility Productivity Tracking And Management System Dashboard Diagrams PDF. The topics addressed in these templates are Transaction Summary, Registered Users, Tracking Management. All the content presented in this PPT design is completely editable. Download it and make adjustments in color, background, font etc. as per your unique business setting.
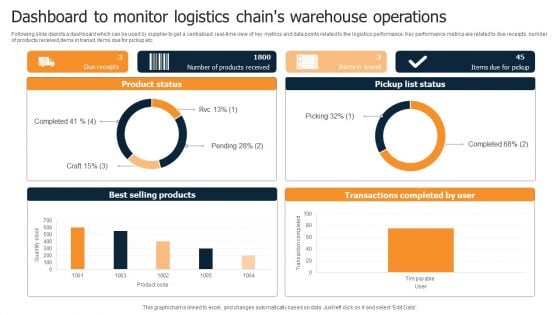
Dashboard To Monitor Logistics Chains Warehouse Operations Diagrams PDF
Following slide depicts a dashboard which can be used by supplier to get a centralized, real-time view of key metrics and data points related to the logistics performance. Key performance metrics are related to due receipts, number of products received,items in transit, items due for pickup etc. Pitch your topic with ease and precision using this Dashboard To Monitor Logistics Chains Warehouse Operations Diagrams PDF. This layout presents information on Product Status, Pickup List Status, Best Selling Products. It is also available for immediate download and adjustment. So, changes can be made in the color, design, graphics or any other component to create a unique layout.
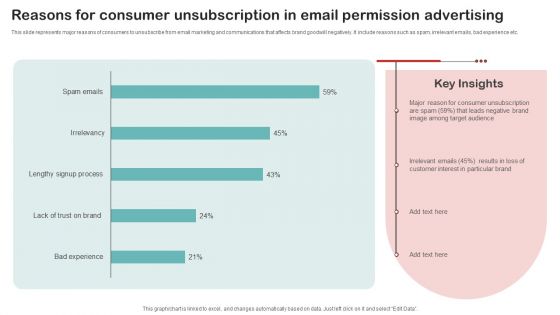
Reasons For Consumer Unsubscription In Email Permission Advertising Diagrams PDF
This slide represents major reasons of consumers to unsubscribe from email marketing and communications that affects brand goodwill negatively. It include reasons such as spam, irrelevant emails, bad experience etc. Pitch your topic with ease and precision using this Reasons For Consumer Unsubscription In Email Permission Advertising Diagrams PDF. This layout presents information on Irrelevant Emails, Customer Interest, Target Audience. It is also available for immediate download and adjustment. So, changes can be made in the color, design, graphics or any other component to create a unique layout.
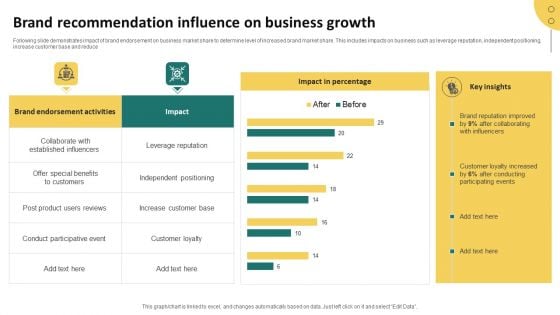
Brand Recommendation Influence On Business Growth Diagrams PDF
Following slide demonstrates impact of brand endorsement on business market share to determine level of increased brand market share. This includes impacts on business such as leverage reputation, independent positioning, increase customer base and reduce. Pitch your topic with ease and precision using this Brand Recommendation Influence On Business Growth Diagrams PDF. This layout presents information on Leverage Reputation, Independent Positioning, Increase Customer Base, Customer Loyalty. It is also available for immediate download and adjustment. So, changes can be made in the color, design, graphics or any other component to create a unique layout.
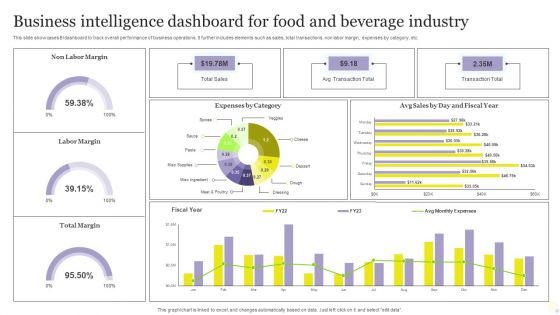
Business Intelligence Dashboard For Food And Beverage Industry Diagrams PDF
This slide showcases BI dashboard to track overall performance of business operations. It further includes elements such as sales, total transactions, non labor margin, expenses by category, etc. Pitch your topic with ease and precision using this Business Intelligence Dashboard For Food And Beverage Industry Diagrams PDF. This layout presents information on Expenses, Sales, Business Intelligence Dashboard. It is also available for immediate download and adjustment. So, changes can be made in the color, design, graphics or any other component to create a unique layout.
Monthly Sales Performance Tracking And Monitoring Dashboard Diagrams PDF
This slide showcases a dashboard presenting various metrics to measure and analyze sales performance for revenue growth. It includes key components such as number of sales, revenue, profit, cost, sales revenue, sales increment, cost analysis and cross sell. Make sure to capture your audiences attention in your business displays with our gratis customizable Monthly Sales Performance Tracking And Monitoring Dashboard Diagrams PDF. These are great for business strategies, office conferences, capital raising or task suggestions. If you desire to acquire more customers for your tech business and ensure they stay satisfied, create your own sales presentation with these plain slides.
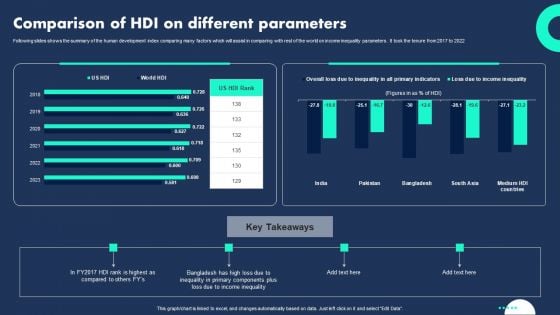
Comparison Of HDI On Different Parameters Diagrams PDF
Following slides shows the summary of the human development index comparing many factors which will assist in comparing with rest of the world on income inequality parameters . It took the tenure from 2017 to 2022. Showcasing this set of slides titled Comparison Of HDI On Different Parameters Diagrams PDF. The topics addressed in these templates are Inequality Primary Components, Plus Loss Income Inequality, Different Parameters . All the content presented in this PPT design is completely editable. Download it and make adjustments in color, background, font etc. as per your unique business setting.
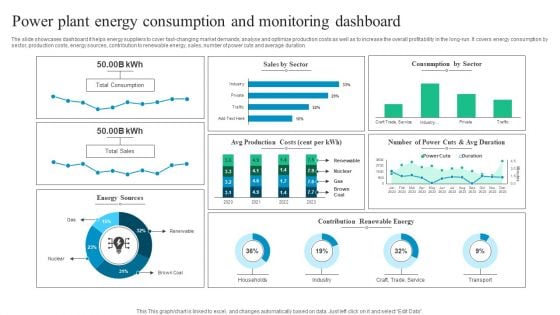
Power Plant Energy Consumption And Monitoring Dashboard Diagrams PDF
The slide showcases dashboard it helps energy suppliers to cover fast-changing market demands, analyse and optimize production costs as well as to increase the overall profitability in the long-run. It covers energy consumption by sector, production costs, energy sources, contribution to renewable energy, sales, number of power cuts and average duration. Pitch your topic with ease and precision using this Power Plant Energy Consumption And Monitoring Dashboard Diagrams PDF. This layout presents information on Power Plant Energy Consumption, Monitoring Dashboard. It is also available for immediate download and adjustment. So, changes can be made in the color, design, graphics or any other component to create a unique layout.
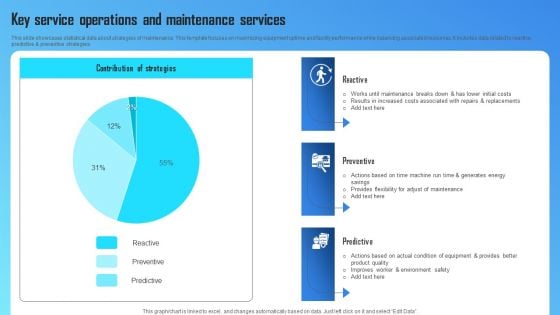
Key Service Operations And Maintenance Services Diagrams PDF
This slide showcases statistical data about strategies of maintenance. This template focuses on maximizing equipment uptime and facility performance while balancing associated resources. It includes data related to reactive, predictive and preventive strategies. Pitch your topic with ease and precision using this Key Service Operations And Maintenance Services Diagrams PDF. This layout presents information on Costs Associated, Environment Safety, Condition Of Equipment. It is also available for immediate download and adjustment. So, changes can be made in the color, design, graphics or any other component to create a unique layout.
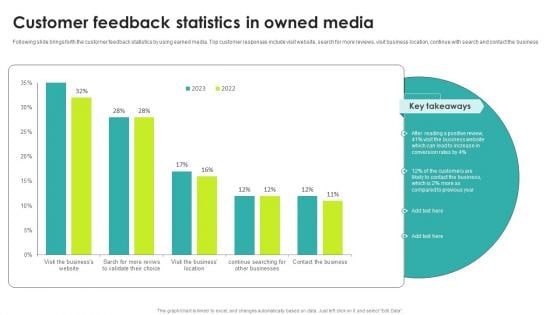
Customer Feedback Statistics In Owned Media Diagrams PDF
Following slide brings forth the customer feedback statistics by using earned media. Top customer responses include visit website, search for more reviews, visit business location, continue with search and contact the business Pitch your topic with ease and precision using this Customer Feedback Statistics In Owned Media Diagrams PDF. This layout presents information on Key Takeaways, Media, Customer. It is also available for immediate download and adjustment. So, changes can be made in the color, design, graphics or any other component to create a unique layout.
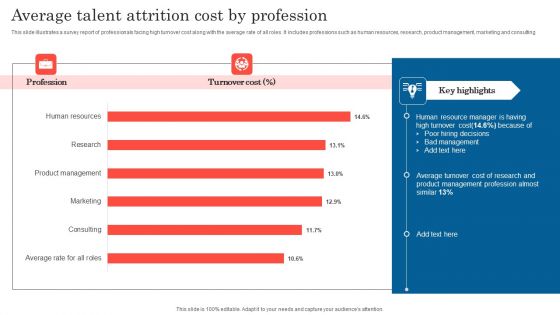
Average Talent Attrition Cost By Profession Diagrams PDF
This slide illustrates a survey report of professionals facing high turnover cost along with the average rate of all roles. It includes professions such as human resources, research, product management, marketing and consulting. Pitch your topic with ease and precision using this Average Talent Attrition Cost By Profession Diagrams PDF. This layout presents information on Human Resource Manager, Key Highlights, Bad Management. It is also available for immediate download and adjustment. So, changes can be made in the color, design, graphics or any other component to create a unique layout.
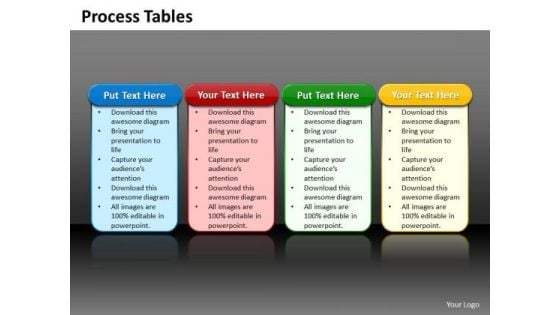
Business Charts PowerPoint Templates 4 Reasons You Should Buy From Circular Process Tables Sales
Business Charts PowerPoint templates 4 reasons you should buy from circular process tables Sales-This PowerPoint Diagram consists of four animated Process tables of Different Colors. It can be used to symbolize four different Approaches or four distinct techniques. It consists of single color slide as well. This diagram will fit for Business Presentations. Display entrepreneurial vision with our Business Charts PowerPoint Templates 4 Reasons You Should Buy From Circular Process Tables Sales. They will make you look good.
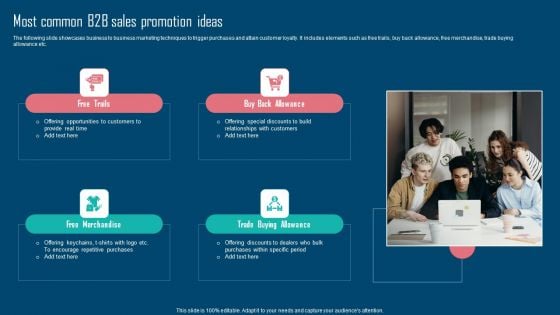
Adopting IMC Technique To Boost Brand Recognition Most Common B2b Sales Promotion Ideas Diagrams PDF
The following slide showcases business to business marketing techniques to trigger purchases and attain customer loyalty. It includes elements such as free trails, buy back allowance, free merchandise, trade buying allowance etc. Welcome to our selection of the Adopting IMC Technique To Boost Brand Recognition Most Common B2b Sales Promotion Ideas Diagrams PDF. These are designed to help you showcase your creativity and bring your sphere to life. Planning and Innovation are essential for any business that is just starting out. This collection contains the designs that you need for your everyday presentations. All of our PowerPoints are 100 percent editable, so you can customize them to suit your needs. This multi purpose template can be used in various situations. Grab these presentation templates today.
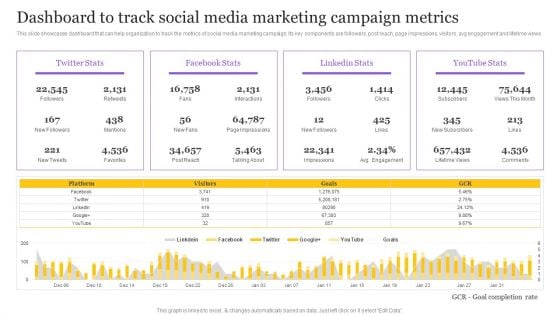
Digital Marketing Strategy Dashboard To Track Social Media Marketing Campaign Metrics Diagrams PDF
This slide showcases dashboard that can help organization to track the metrics of social media marketing campaign. Its key components are followers, post reach, page impressions, visitors, avg engagement and lifetime views. Retrieve professionally designed Digital Marketing Strategy Dashboard To Track Social Media Marketing Campaign Metrics Diagrams PDF to effectively convey your message and captivate your listeners. Save time by selecting pre-made slideshows that are appropriate for various topics, from business to educational purposes. These themes come in many different styles, from creative to corporate, and all of them are easily adjustable and can be edited quickly. Access them as PowerPoint templates or as Google Slides themes. You dont have to go on a hunt for the perfect presentation because Slidegeeks got you covered from everywhere.
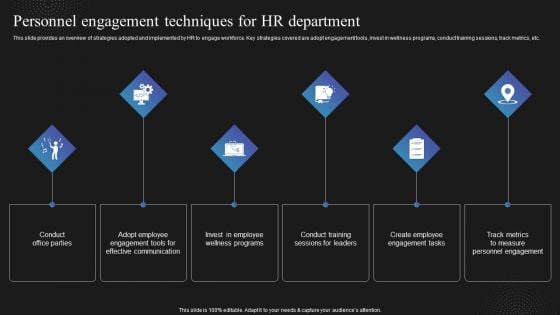
Techniques To Enhance Employee Personnel Engagement Techniques For HR Department Background PDF
This slide provides an overview of strategies adopted and implemented by HR to engage workforce. Key strategies covered are adopt engagement tools, invest in wellness programs, conduct training sessions, track metrics, etc. If you are looking for a format to display your unique thoughts, then the professionally designed Techniques To Enhance Employee Personnel Engagement Techniques For HR Department Background PDF is the one for you. You can use it as a Google Slides template or a PowerPoint template. Incorporate impressive visuals, symbols, images, and other charts. Modify or reorganize the text boxes as you desire. Experiment with shade schemes and font pairings. Alter, share or cooperate with other people on your work. Download Techniques To Enhance Employee Personnel Engagement Techniques For HR Department Background PDF and find out how to give a successful presentation. Present a perfect display to your team and make your presentation unforgettable.
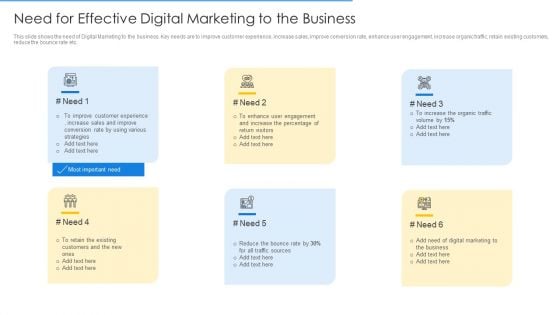
Online Merchandising Techniques Enhance Conversion Rate Need For Effective Digital Marketing To The Business Diagrams PDF
This slide shows the need of Digital Marketing to the business. Key needs are to improve customer experience, increase sales, improve conversion rate, enhance user engagement, increase organic traffic, retain existing customers, reduce the bounce rate etc. This is a online merchandising techniques enhance conversion rate need for effective digital marketing to the business diagrams pdf template with various stages. Focus and dispense information on six stages using this creative set, that comes with editable features. It contains large content boxes to add your information on topics like business, marketing, organic traffic, strategies, sales. You can also showcase facts, figures, and other relevant content using this PPT layout. Grab it now.
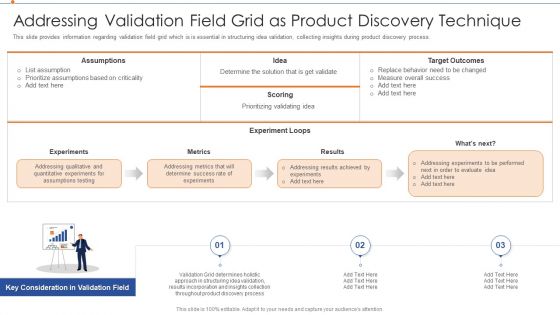
Strategies For Improving Product Discovery Addressing Validation Field Grid As Product Discovery Technique Diagrams PDF
This slide provides information regarding validation field grid which is is essential in structuring idea validation, collecting insights during product discovery process. This is a strategies for improving product discovery addressing validation field grid as product discovery technique diagrams pdf template with various stages. Focus and dispense information on three stages using this creative set, that comes with editable features. It contains large content boxes to add your information on topics like experiments, metrics, results, target outcomes, scoring, idea. You can also showcase facts, figures, and other relevant content using this PPT layout. Grab it now.
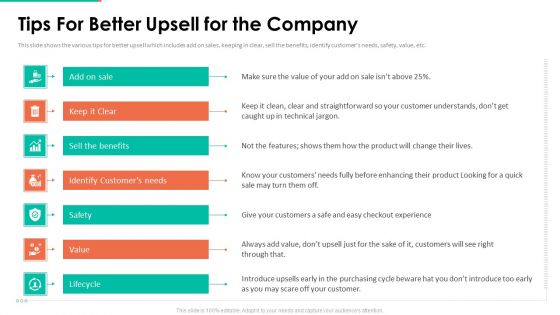
Upselling Technique Additional Product Tips For Better Upsell For The Company Diagrams PDF
This slide shows the various tips for better upsell which includes add on sales, keeping in clear, sell the benefits, identify customers needs, safety, value, etc. Presenting upselling technique additional product tips for better upsell for the company diagrams pdf to provide visual cues and insights. Share and navigate important information on eight stages that need your due attention. This template can be used to pitch topics like straightforward, customer, technical. In addtion, this PPT design contains high resolution images, graphics, etc, that are easily editable and available for immediate download.
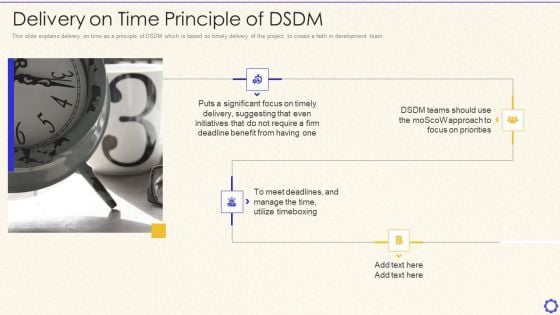
Dynamic System Development Method Tools And Techniques IT Delivery On Time Principle Of DSDM Diagrams PDF
This slide explains delivery on time as a principle of DSDM which is based on timely delivery of the project, to create a faith in development team. Presenting dynamic system development method tools and techniques it delivery on time principle of dsdm diagrams pdf to provide visual cues and insights. Share and navigate important information on four stages that need your due attention. This template can be used to pitch topics like significant, initiatives, benefit, require, suggesting. In addtion, this PPT design contains high resolution images, graphics, etc, that are easily editable and available for immediate download.

Successful Quality Assurance Transition Techniques To Enhance Product Quality Implement User Acceptance Testing Diagrams PDF
This slide shows the details about User Acceptance Testing UAT Approach for Effective QA Transformation along with types of UAT such as Alpha and Beta Testing, Contract Acceptance Testing, Regulation Acceptance Testing and Black Box Testing. Presenting successful quality assurance transition techniques to enhance product quality implement user acceptance testing diagrams pdf to provide visual cues and insights. Share and navigate important information on four stages that need your due attention. This template can be used to pitch topics like alpha and beta testing, contract acceptance testing, regulation acceptance testing, black box testing. In addtion, this PPT design contains high resolution images, graphics, etc, that are easily editable and available for immediate download.
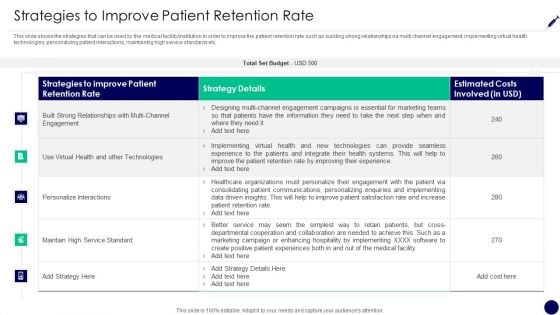
Consumer Retention Techniques Strategies To Improve Patient Retention Rate Diagrams PDF
This slide shows the strategies that can be used by the medical facility or institution in order to improve the patient retention rate such as building strong relationships via multi channel engagement, implementing virtual health technologies, personalizing patient interactions, maintaining high service standards etc. Deliver and pitch your topic in the best possible manner with this consumer retention techniques strategies to improve patient retention rate diagrams pdf. Use them to share invaluable insights on strategy details, estimated costs involved, personalize interactions and impress your audience. This template can be altered and modified as per your expectations. So, grab it now.
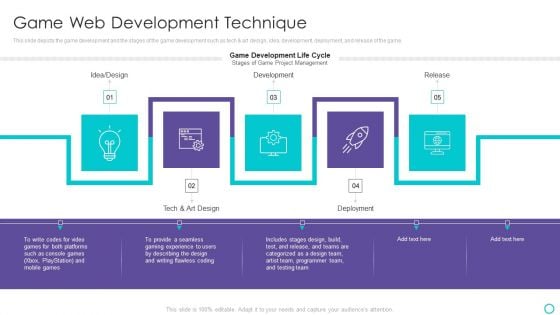
Website Designing And Development Service Game Web Development Technique Diagrams PDF
This slide depicts the game development and the stages of the game development such as tech and art design, idea, development, deployment, and release of the game.This is a Website Designing And Development Service Game Web Development Technique Diagrams PDF template with various stages. Focus and dispense information on five stages using this creative set, that comes with editable features. It contains large content boxes to add your information on topics like Development, Deployment, Tech And Art Design You can also showcase facts, figures, and other relevant content using this PPT layout. Grab it now.
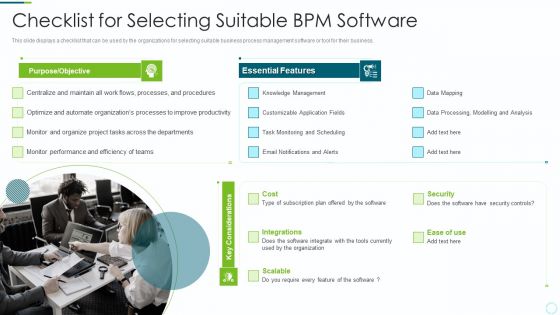
Implementing BPM Techniques Checklist For Selecting Suitable Bpm Software Diagrams PDF
This slide displays a checklist that can be used by the organizations for selecting suitable business process management software or tool for their business. Presenting Implementing BPM Techniques Checklist For Selecting Suitable Bpm Software Diagrams PDF to provide visual cues and insights. Share and navigate important information on three stages that need your due attention. This template can be used to pitch topics like Purpose Objective, Essential Features, Knowledge Management. In addtion, this PPT design contains high resolution images, graphics, etc, that are easily editable and available for immediate download.
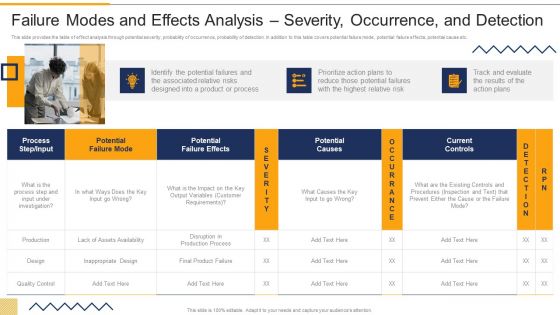
Failure Modes And Effects Analysis Severity Occurrence And Detection FMEA Techniques For Process Assessment Diagrams PDF
This slide provides the table of effect analysis through potential severity, probability of occurrence, probability of detection. In addition to this table covers potential failure mode, potential failure effects, potential cause etc.Deliver an awe inspiring pitch with this creative Failure Modes And Effects Analysis Severity Occurrence And Detection FMEA Techniques For Process Assessment Diagrams PDF bundle. Topics like Potential Failure, Customer Requirements, Potential Causes can be discussed with this completely editable template. It is available for immediate download depending on the needs and requirements of the user.
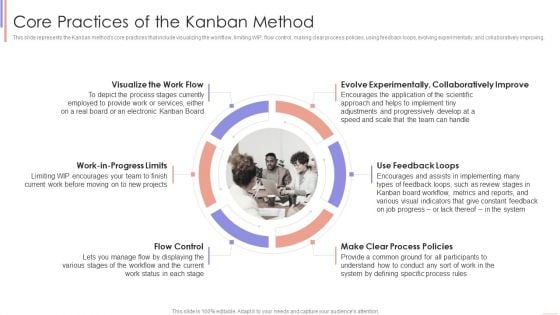
Agile Sprint Technique In Software Core Practices Of The Kanban Method Diagrams PDF
This slide represents the Kanban methods core practices that include visualizing the workflow, limiting WIP, flow control, making clear process policies, using feedback loops, evolving experimentally, and collaboratively improving.Presenting Agile Sprint Technique In Software Core Practices Of The Kanban Method Diagrams PDF to provide visual cues and insights. Share and navigate important information on one stage that need your due attention. This template can be used to pitch topics like Evolve Experimentally, Collaboratively Improve, Employed Provide. In addtion, this PPT design contains high resolution images, graphics, etc, that are easily editable and available for immediate download.
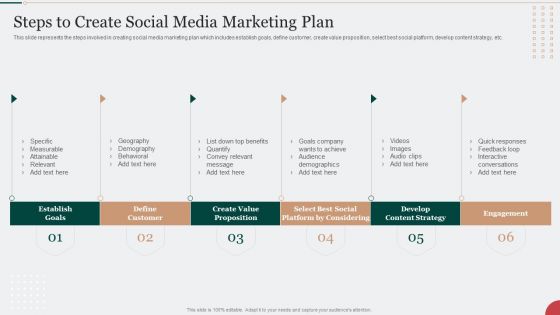
Digital Marketing Techniques To Improve Lead Steps To Create Social Media Marketing Plan Diagrams PDF
This slide represents the steps involved in creating social media marketing plan which includes establish goals, define customer, create value proposition, select best social platform, develop content strategy, etc. This is a Digital Marketing Techniques To Improve Lead Steps To Create Social Media Marketing Plan Diagrams PDF template with various stages. Focus and dispense information on six stages using this creative set, that comes with editable features. It contains large content boxes to add your information on topics like Establish Goals, Define Customer, Create Value Proposition. You can also showcase facts, figures, and other relevant content using this PPT layout. Grab it now.
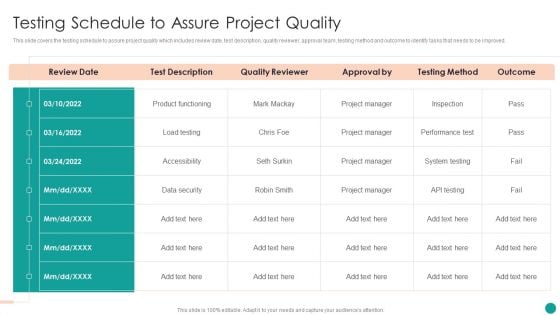
Time Management Techniques For Successful Project Testing Schedule To Assure Project Quality Diagrams PDF
This slide covers the testing schedule to assure project quality which includes review date, test description, quality reviewer, approval team, testing method and outcome to identify tasks that needs to be improved.Deliver an awe inspiring pitch with this creative Time Management Techniques For Successful Project Testing Schedule To Assure Project Quality Diagrams PDF bundle. Topics like Product Functioning, Accessibility, Project Manager can be discussed with this completely editable template. It is available for immediate download depending on the needs and requirements of the user.
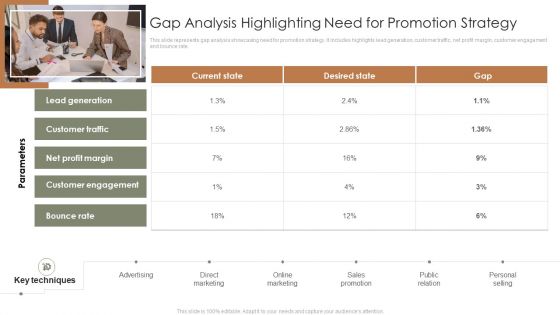
Online Promotional Techniques To Increase Gap Analysis Highlighting Need For Promotion Strategy Diagrams PDF
This slide represents gap analysis showcasing need for promotion strategy. It includes highlights lead generation, customer traffic, net profit margin, customer engagement and bounce rate.This is a Online Promotional Techniques To Increase Gap Analysis Highlighting Need For Promotion Strategy Diagrams PDF template with various stages. Focus and dispense information on one stage using this creative set, that comes with editable features. It contains large content boxes to add your information on topics like Customer Traffic, Customer Engagement, Lead Generation. You can also showcase facts, figures, and other relevant content using this PPT layout. Grab it now.
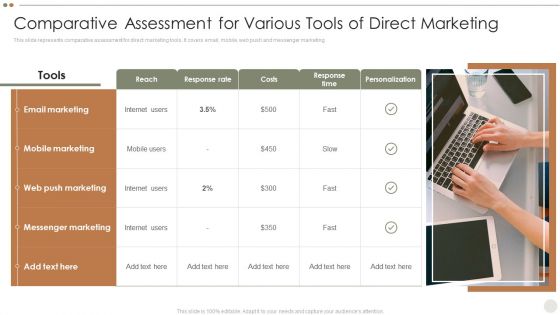
Online Promotional Techniques To Increase Comparative Assessment For Various Tools Diagrams PDF
This slide represents comparative assessment for direct marketing tools. It covers email, mobile, web push and messenger marketing.This is a Online Promotional Techniques To Increase Comparative Assessment For Various Tools Diagrams PDF template with various stages. Focus and dispense information on one stage using this creative set, that comes with editable features. It contains large content boxes to add your information on topics like Push Marketing, Messenger Marketing, Mobile Marketing. You can also showcase facts, figures, and other relevant content using this PPT layout. Grab it now.

Types Of Corporate Communication Techniques Thank You For Watching Diagrams PDF
This template provides an introduction to stakeholder communication as a tool for organization efficiency, it displays key impact such as increase in credibility, decrease in cost, better position statement, great outreach potential etc. Presenting Types Of Corporate Communication Techniques Thank You For Watching Diagrams PDF to provide visual cues and insights. Share and navigate important information on seven stages that need your due attention. This template can be used to pitch topics like Reduction In Cost, Build Stakeholder Relationship, Information. In addtion, this PPT design contains high resolution images, graphics, etc, that are easily editable and available for immediate download.
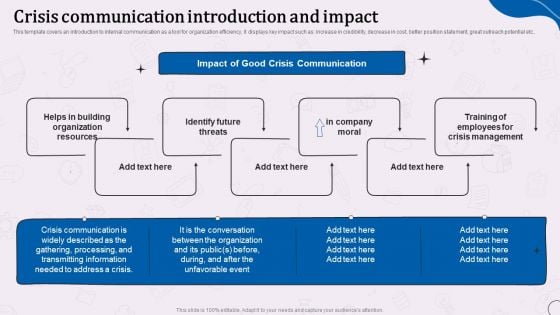
Types Of Corporate Communication Techniques Crisis Communication Introduction And Impact Diagrams PDF
This template covers an introduction to internal communication as a tool for organization efficiency, it displays key impact such as increase in credibility, decrease in cost, better position statement, great outreach potential etc. Presenting Types Of Corporate Communication Techniques Crisis Communication Introduction And Impact Diagrams PDF to provide visual cues and insights. Share and navigate important information on seven stages that need your due attention. This template can be used to pitch topics like Organization Resources, Crisis Management, Transmitting Information. In addtion, this PPT design contains high resolution images, graphics, etc, that are easily editable and available for immediate download.
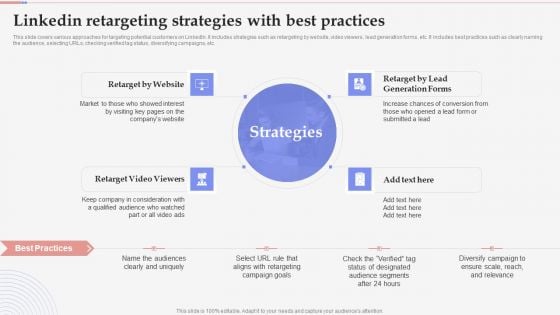
Consumer Retargeting Techniques Linkedin Retargeting Strategies With Best Practices Diagrams PDF
This slide covers various approaches for targeting potential customers on LinkedIn. It includes strategies such as retargeting by website, video viewers, lead generation forms, etc. It includes best practices such as clearly naming the audience, selecting URLs, checking verified tag status, diversifying campaigns, etc. Presenting Consumer Retargeting Techniques Linkedin Retargeting Strategies With Best Practices Diagrams PDF to provide visual cues and insights. Share and navigate important information on four stages that need your due attention. This template can be used to pitch topics like Increase Chances, Company Consideration, Status Designated. In addtion, this PPT design contains high resolution images, graphics, etc, that are easily editable and available for immediate download.
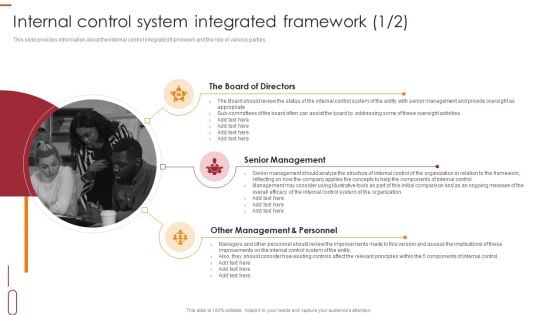
Internal Control Management Goals And Techniques Internal Control System Integrated Framework Diagrams PDF
This slide provides information about the internal control integrated framework and the role of various parties. Presenting Internal Control Management Goals And Techniques Internal Control System Integrated Framework Diagrams PDF to provide visual cues and insights. Share and navigate important information on three stages that need your due attention. This template can be used to pitch topics like The Board Of Directors, Senior Management, Other Management. In addtion, this PPT design contains high resolution images, graphics, etc, that are easily editable and available for immediate download.
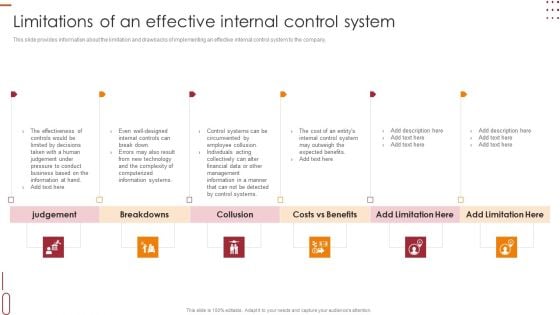
Internal Control Management Goals And Techniques Limitations Of An Effective Internal Control System Diagrams PDF
This slide provides information about the limitation and drawbacks of implementing an effective internal control system to the company. Presenting Internal Control Management Goals And Techniques Limitations Of An Effective Internal Control System Diagrams PDF to provide visual cues and insights. Share and navigate important information on six stages that need your due attention. This template can be used to pitch topics like Collusion, Judgement, Breakdowns. In addtion, this PPT design contains high resolution images, graphics, etc, that are easily editable and available for immediate download.
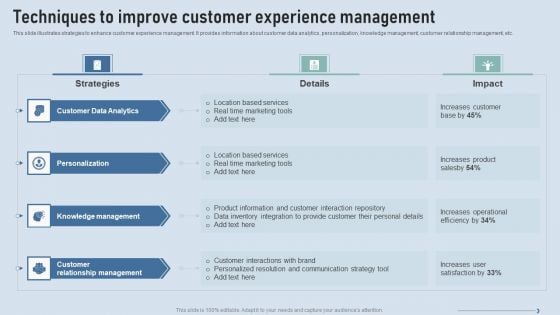
Improve IT Service Desk Techniques To Improve Customer Experience Management Diagrams PDF
This slide illustrates strategies to enhance customer experience management. It provides information about customer data analytics, personalization, knowledge management, customer relationship management, etc. This is a Improve IT Service Desk Techniques To Improve Customer Experience Management Diagrams PDF template with various stages. Focus and dispense information on four stages using this creative set, that comes with editable features. It contains large content boxes to add your information on topics like Knowledge Management, Personalization, Customer Data Analytics. You can also showcase facts, figures, and other relevant content using this PPT layout. Grab it now.
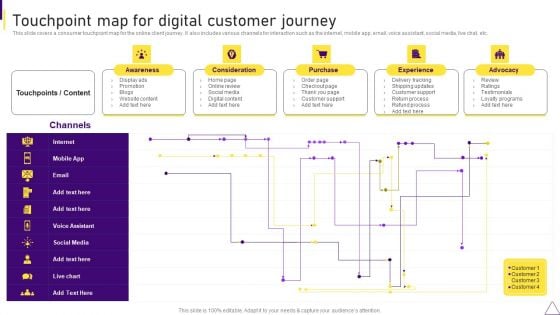
Consumer Journey Mapping Techniques Touchpoint Map For Digital Customer Journey Diagrams PDF
This slide covers a consumer touchpoint map for the online client journey. It also includes various channels for interaction such as the internet, mobile app, email, voice assistant, social media, live chat, etc. This is a Consumer Journey Mapping Techniques Touchpoint Map For Digital Customer Journey Diagrams PDF template with various stages. Focus and dispense information on five stages using this creative set, that comes with editable features. It contains large content boxes to add your information on topics like Consideration, Purchase, Advocacy, Awareness. You can also showcase facts, figures, and other relevant content using this PPT layout. Grab it now.
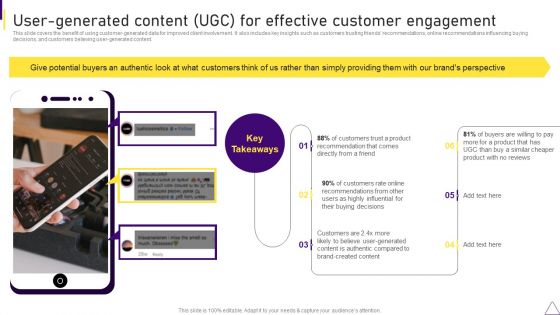
Consumer Journey Mapping Techniques User Generated Content UGC For Effective Customer Engagement Diagrams PDF
This slide covers the benefit of using customer generated data for improved client involvement. It also includes key insights such as customers trusting friends recommendations, online recommendations influencing buying decisions, and customers believing user generated content. Presenting Consumer Journey Mapping Techniques User Generated Content UGC For Effective Customer Engagement Diagrams PDF to provide visual cues and insights. Share and navigate important information on three stages that need your due attention. This template can be used to pitch topics like Customers, Product, Potential Buyers. In addtion, this PPT design contains high resolution images, graphics, etc, that are easily editable and available for immediate download.
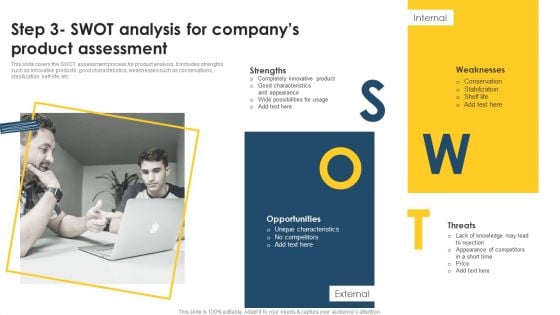
Positioning Techniques To Improve Step 3 Swot Analysis For Company Product Assessment Diagrams PDF
This slide covers the SWOT assessment process for product analysis. It includes strengths such as innovative products, good characteristics, weaknesses such as conservations, stabilization, self-life, etc. The best PPT templates are a great way to save time, energy, and resources. Slidegeeks have 100precent editable powerpoint slides making them incredibly versatile. With these quality presentation templates, you can create a captivating and memorable presentation by combining visually appealing slides and effectively communicating your message. Download Positioning Techniques To Improve Step 3 Swot Analysis For Company Product Assessment Diagrams PDF from Slidegeeks and deliver a wonderful presentation.
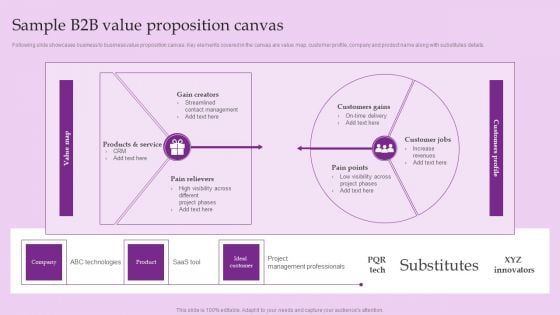
Sample B2b Value Proposition Canvas Brand And Equity Evaluation Techniques And Procedures Diagrams PDF
Following slide showcases business to business value proposition canvas. Key elements covered in the canvas are value map, customer profile, company and product name along with substitutes details.Make sure to capture your audiences attention in your business displays with our gratis customizable Sample B2b Value Proposition Canvas Brand And Equity Evaluation Techniques And Procedures Diagrams PDF. These are great for business strategies, office conferences, capital raising or task suggestions. If you desire to acquire more customers for your tech business and ensure they stay satisfied, create your own sales presentation with these plain slides.
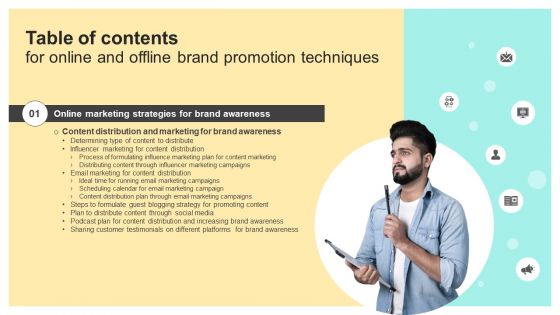
Table Of Contents For Online And Offline Brand Promotion Techniques Slide Diagrams PDF
This modern and well-arranged Table Of Contents For Online And Offline Brand Promotion Techniques Slide Diagrams PDF provides lots of creative possibilities. It is very simple to customize and edit with the Powerpoint Software. Just drag and drop your pictures into the shapes. All facets of this template can be edited with Powerpoint no extra software is necessary. Add your own material, put your images in the places assigned for them, adjust the colors, and then you can show your slides to the world, with an animated slide included.
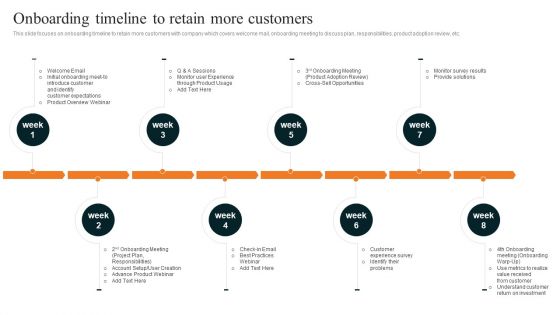
Techniques To Decrease Customer Onboarding Timeline To Retain More Customers Diagrams PDF
This slide focuses on onboarding timeline to retain more customers with company which covers welcome mail, onboarding meeting to discuss plan, responsibilities, product adoption review, etc. Make sure to capture your audiences attention in your business displays with our gratis customizable Techniques To Decrease Customer Onboarding Timeline To Retain More Customers Diagrams PDF. These are great for business strategies, office conferences, capital raising or task suggestions. If you desire to acquire more customers for your tech business and ensure they stay satisfied, create your own sales presentation with these plain slides.

 Home
Home