Organizational Icons
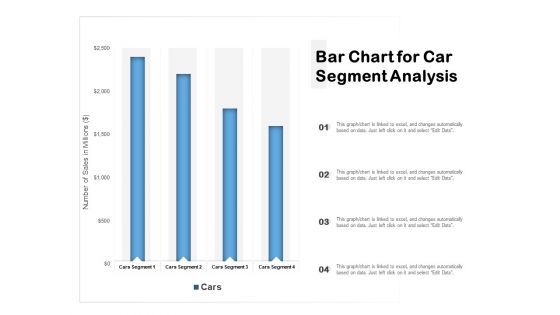
Bar Chart For Car Segment Analysis Ppt PowerPoint Presentation Show Templates PDF
Pitch your topic with ease and precision using this bar chart for car segment analysis ppt powerpoint presentation show templates pdf. This layout presents information on bar chart for car segment analysis. It is also available for immediate download and adjustment. So, changes can be made in the color, design, graphics or any other component to create a unique layout.
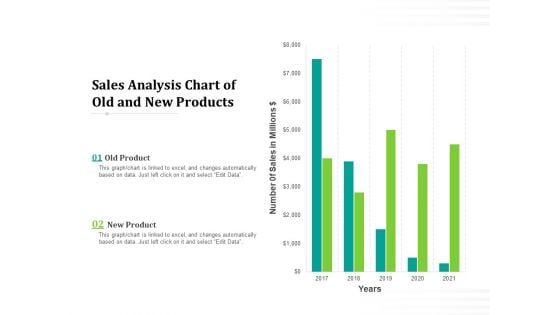
Sales Analysis Chart Of Old And New Products Ppt PowerPoint Presentation Professional Influencers PDF
Pitch your topic with ease and precision using this sales analysis chart of old and new products ppt powerpoint presentation professional influencers pdf. This layout presents information on sales analysis chart of old and new products. It is also available for immediate download and adjustment. So, changes can be made in the color, design, graphics or any other component to create a unique layout.
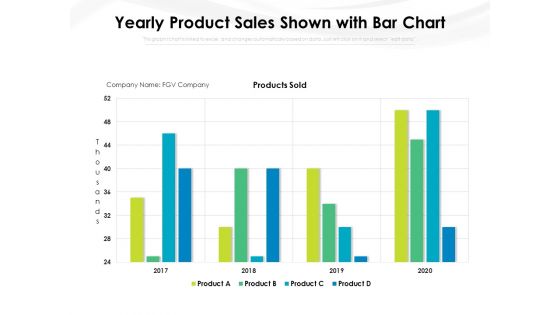
Yearly Product Sales Shown With Bar Chart Ppt PowerPoint Presentation File Gridlines PDF
Pitch your topic with ease and precision using this yearly product sales shown with bar chart ppt powerpoint presentation file gridlines pdf. This layout presents information on yearly product sales shown with bar chart. It is also available for immediate download and adjustment. So, changes can be made in the color, design, graphics or any other component to create a unique layout.
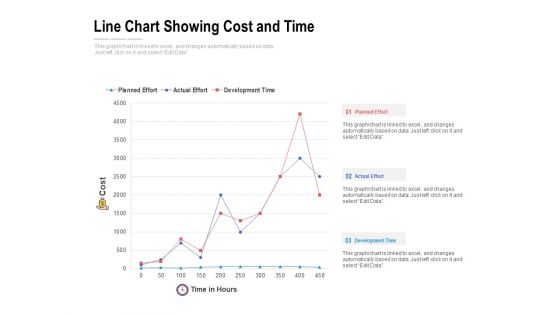
Line Chart Showing Cost And Time Ppt PowerPoint Presentation File Example Topics PDF
Pitch your topic with ease and precision using this line chart showing cost and time ppt powerpoint presentation file example topics pdf. This layout presents information on line chart showing cost and time. It is also available for immediate download and adjustment. So, changes can be made in the color, design, graphics or any other component to create a unique layout.
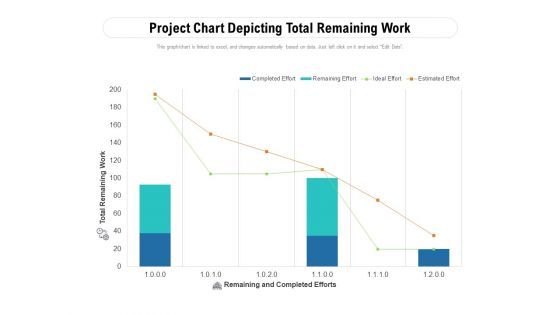
Project Chart Depicting Total Remaining Work Ppt PowerPoint Presentation File Slides PDF
Pitch your topic with ease and precision using this project chart depicting total remaining work ppt powerpoint presentation file slides pdf. This layout presents information on project chart depicting total remaining work. It is also available for immediate download and adjustment. So, changes can be made in the color, design, graphics or any other component to create a unique layout.
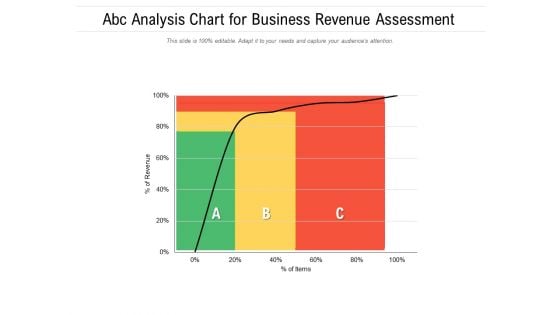
ABC Analysis Chart For Business Revenue Assessment Ppt PowerPoint Presentation Model Template PDF
Pitch your topic with ease and precision using this abc analysis chart for business revenue assessment ppt powerpoint presentation model template pdf. This layout presents information on abc analysis chart for business revenue assessment. It is also available for immediate download and adjustment. So, changes can be made in the color, design, graphics or any other component to create a unique layout.
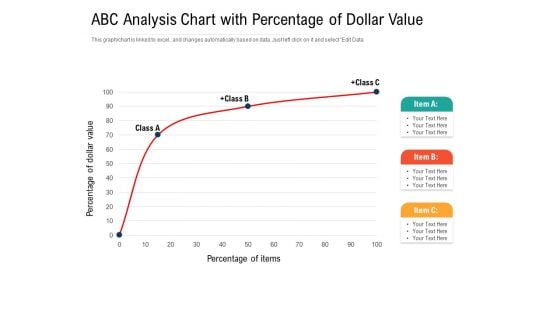
ABC Analysis Chart With Percentage Of Dollar Value Ppt PowerPoint Presentation Gallery Portfolio PDF
Pitch your topic with ease and precision using this abc analysis chart with percentage of dollar value ppt powerpoint presentation gallery portfolio pdf. This layout presents information on abc analysis chart with percentage of dollar value. It is also available for immediate download and adjustment. So, changes can be made in the color, design, graphics or any other component to create a unique layout.

Sales Monthly Trends Analysis Chart Ppt Powerpoint Presentation Gallery Objects Pdf
Pitch your topic with ease and precision using this sales monthly trends analysis chart ppt powerpoint presentation gallery objects pdf. This layout presents information on sales monthly trends analysis chart. It is also available for immediate download and adjustment. So, changes can be made in the color, design, graphics or any other component to create a unique layout.
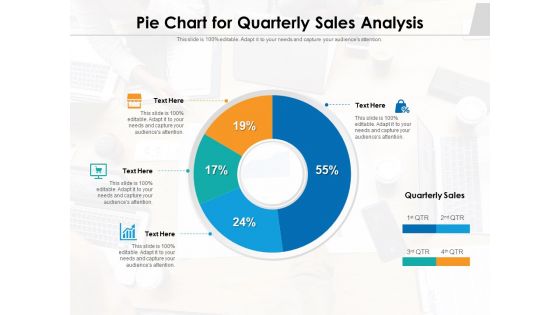
Pie Chart For Quarterly Sales Analysis Ppt PowerPoint Presentation File Outfit PDF
Pitch your topic with ease and precision using this pie chart for quarterly sales analysis ppt powerpoint presentation file outfit pdf. This layout presents information on pie chart for quarterly sales analysis. It is also available for immediate download and adjustment. So, changes can be made in the color, design, graphics or any other component to create a unique layout.

Pie Chart For Regional Analysis Ppt PowerPoint Presentation Gallery Example PDF
Pitch your topic with ease and precision using this pie chart for regional analysis ppt powerpoint presentation gallery example pdf. This layout presents information on pie chart for regional analysis. It is also available for immediate download and adjustment. So, changes can be made in the color, design, graphics or any other component to create a unique layout.
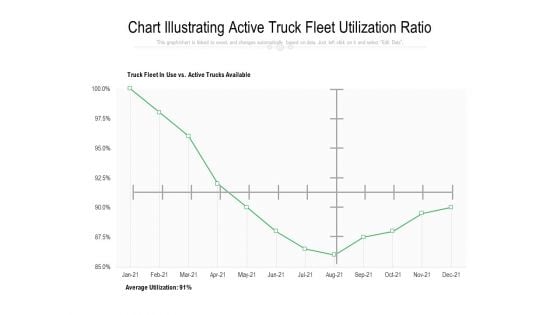
Chart Illustrating Active Truck Fleet Utilization Ratio Ppt PowerPoint Presentation Styles Graphics Pictures PDF
Pitch your topic with ease and precision using this chart illustrating active truck fleet utilization ratio ppt powerpoint presentation styles graphics pictures pdf. This layout presents information on chart illustrating active truck fleet utilization ratio. It is also available for immediate download and adjustment. So, changes can be made in the color, design, graphics or any other component to create a unique layout.
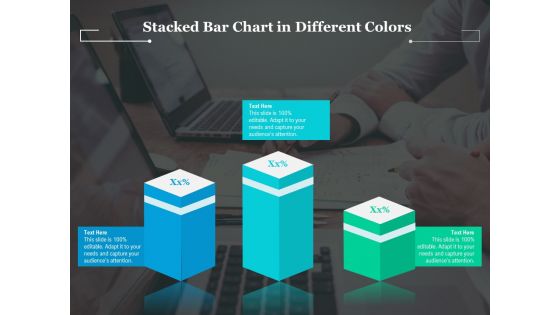
Stacked Bar Chart In Different Colors Ppt PowerPoint Presentation Gallery Maker PDF
Pitch your topic with ease and precision using this stacked bar chart in different colors ppt powerpoint presentation gallery maker pdf. This layout presents information on stacked bar chart in different colors. It is also available for immediate download and adjustment. So, changes can be made in the color, design, graphics or any other component to create a unique layout.

Two Products Comparison Stacked Chart Ppt PowerPoint Presentation Gallery Structure PDF
Pitch your topic with ease and precision using this two products comparison stacked chart ppt powerpoint presentation gallery structure pdf. This layout presents information on two products comparison stacked chart. It is also available for immediate download and adjustment. So, changes can be made in the color, design, graphics or any other component to create a unique layout.
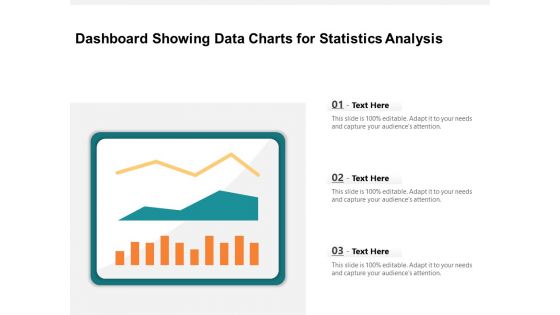
Dashboard Showing Data Charts For Statistics Analysis Ppt PowerPoint Presentation Infographic Template Grid PDF
Pitch your topic with ease and precision using this dashboard showing data charts for statistics analysis ppt powerpoint presentation infographic template grid pdf. This layout presents information on dashboard showing data charts for statistics analysis. It is also available for immediate download and adjustment. So, changes can be made in the color, design, graphics or any other component to create a unique layout.
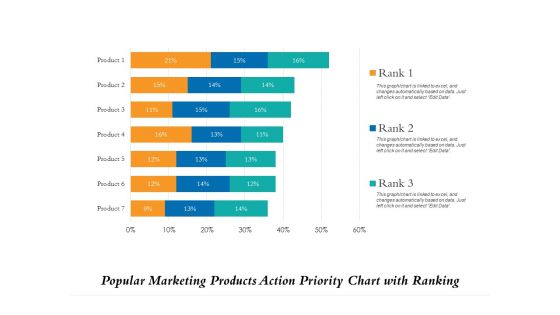
Popular Marketing Products Action Priority Chart With Ranking Ppt PowerPoint Presentation File Demonstration PDF
Pitch your topic with ease and precision using this popular marketing products action priority chart with ranking ppt powerpoint presentation file demonstration pdf. This layout presents information on popular marketing products action priority chart with ranking. It is also available for immediate download and adjustment. So, changes can be made in the color, design, graphics or any other component to create a unique layout.
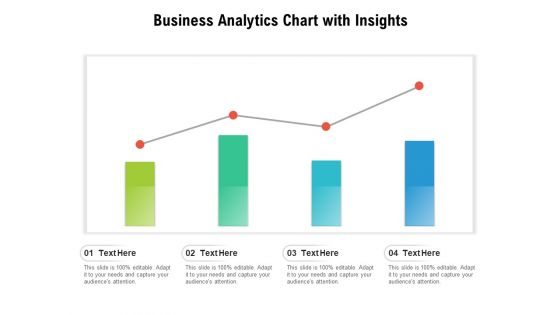
Business Analytics Chart With Insights Ppt PowerPoint Presentation Slides Guidelines PDF
Pitch your topic with ease and precision using this business analytics chart with insights ppt powerpoint presentation slides guidelines pdf. This layout presents information on business analytics chart with insights. It is also available for immediate download and adjustment. So, changes can be made in the color, design, graphics or any other component to create a unique layout.
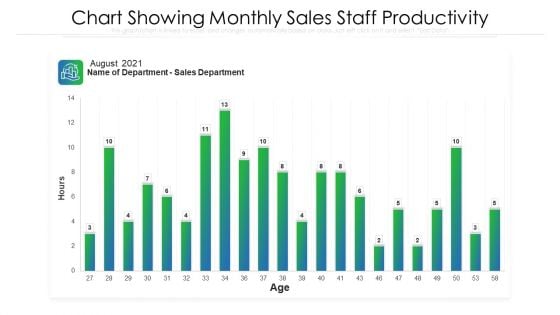
Chart Showing Monthly Sales Staff Productivity Ppt PowerPoint Presentation File Images PDF
Pitch your topic with ease and precision using this chart showing monthly sales staff productivity ppt powerpoint presentation file images pdf. This layout presents information on chart showing monthly sales staff productivity. It is also available for immediate download and adjustment. So, changes can be made in the color, design, graphics or any other component to create a unique layout.
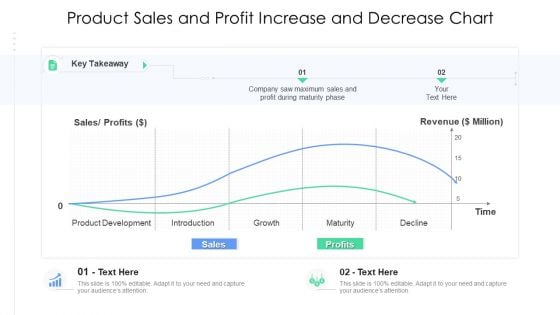
Product Sales And Profit Increase And Decrease Chart Ppt Show PDF
Pitch your topic with ease and precision using this product sales and profit increase and decrease chart ppt show pdf. This layout presents information on product sales and profit increase and decrease chart. It is also available for immediate download and adjustment. So, changes can be made in the color, design, graphics or any other component to create a unique layout.
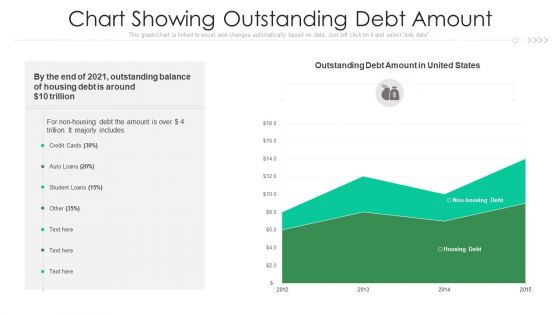
Chart Showing Outstanding Debt Amount Ppt PowerPoint Presentation Outline Background PDF
Pitch your topic with ease and precision using this chart showing outstanding debt amount ppt powerpoint presentation outline background pdf. This layout presents information on chart showing outstanding debt amount. It is also available for immediate download and adjustment. So, changes can be made in the color, design, graphics or any other component to create a unique layout.
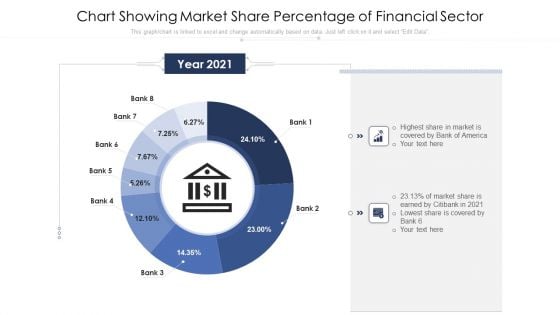
Chart Showing Market Share Percentage Of Financial Sector Ppt PowerPoint Presentation Show Guide PDF
Pitch your topic with ease and precision using this chart showing market share percentage of financial sector ppt powerpoint presentation show guide pdf. This layout presents information on chart showing market share percentage of financial sector. It is also available for immediate download and adjustment. So, changes can be made in the color, design, graphics or any other component to create a unique layout.
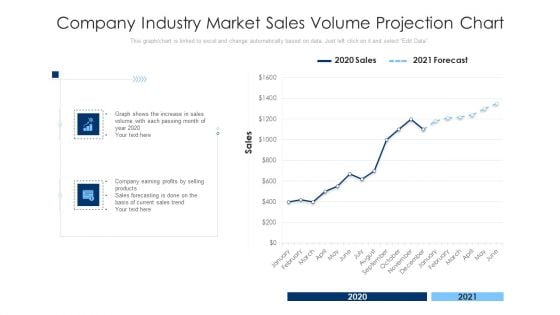
Company Industry Market Sales Volume Projection Chart Ppt PowerPoint Presentation Infographic Template Clipart PDF
Pitch your topic with ease and precision using this company industry market sales volume projection chart ppt powerpoint presentation infographic template clipart pdf. This layout presents information on company industry market sales volume projection chart. It is also available for immediate download and adjustment. So, changes can be made in the color, design, graphics or any other component to create a unique layout.
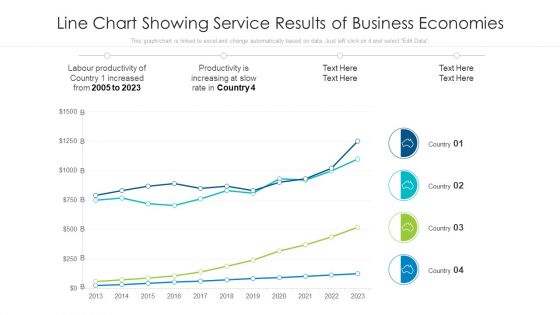
Line Chart Showing Service Results Of Business Economies Ppt PowerPoint Presentation Model Tips PDF
Pitch your topic with ease and precision using this line chart showing service results of business economies ppt powerpoint presentation model tips pdf. This layout presents information on line chart showing service results of business economies. It is also available for immediate download and adjustment. So, changes can be made in the color, design, graphics or any other component to create a unique layout.
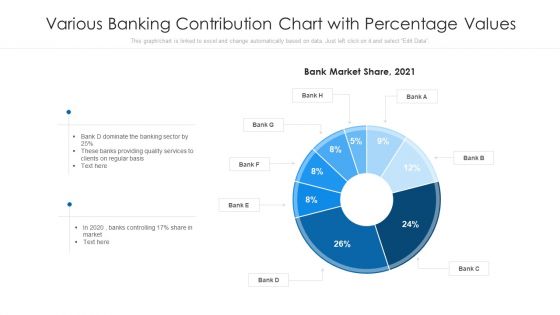
Various Banking Contribution Chart With Percentage Values Ppt PowerPoint Presentation Visual Aids Deck PDF
Pitch your topic with ease and precision using this various banking contribution chart with percentage values ppt powerpoint presentation visual aids deck pdf This layout presents information on various banking contribution chart with percentage values. It is also available for immediate download and adjustment. So, changes can be made in the color, design, graphics or any other component to create a unique layout.
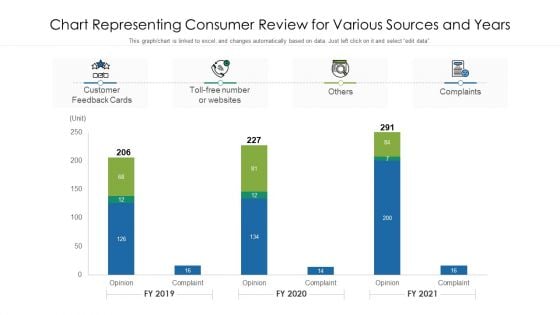
Chart Representing Consumer Review For Various Sources And Years Ppt Summary Background PDF
Pitch your topic with ease and precision using this chart representing consumer review for various sources and years ppt summary background pdf. This layout presents information on chart representing consumer review for various sources and years. It is also available for immediate download and adjustment. So, changes can be made in the color, design, graphics or any other component to create a unique layout.
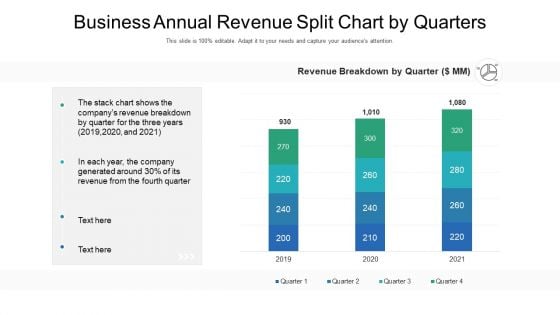
Business Annual Revenue Split Chart By Quarters Ppt PowerPoint Presentation Background Image PDF
Pitch your topic with ease and precision using this business annual revenue split chart by quarters ppt powerpoint presentation background image pdf. This layout presents information on business annual revenue split chart by quarters. It is also available for immediate download and adjustment. So, changes can be made in the color, design, graphics or any other component to create a unique layout.
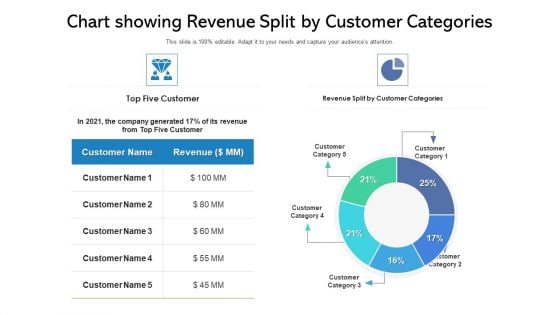
Chart Showing Revenue Split By Customer Categories Ppt PowerPoint Presentation Show Smartart PDF
Pitch your topic with ease and precision using this chart showing revenue split by customer categories ppt powerpoint presentation show smartart pdf. This layout presents information on chart showing revenue split by customer categories. It is also available for immediate download and adjustment. So, changes can be made in the color, design, graphics or any other component to create a unique layout.
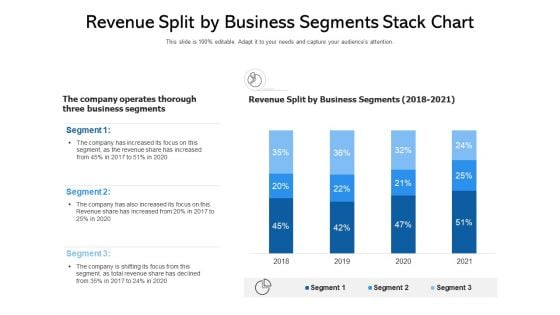
Revenue Split By Business Segments Stack Chart Ppt PowerPoint Presentation Ideas Sample PDF
Pitch your topic with ease and precision using this revenue split by business segments stack chart ppt powerpoint presentation ideas sample pdf. This layout presents information on revenue split by business segments stack chart. It is also available for immediate download and adjustment. So, changes can be made in the color, design, graphics or any other component to create a unique layout.
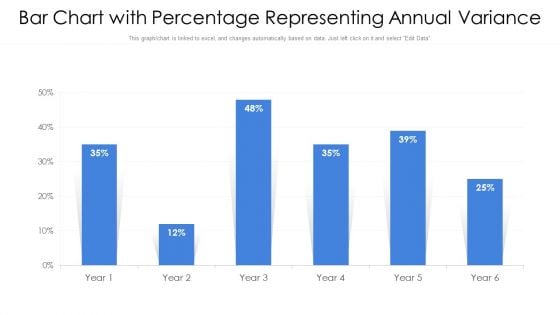
Bar Chart With Percentage Representing Annual Variance Ppt PowerPoint Presentation Gallery Portfolio PDF
Pitch your topic with ease and precision using this bar chart with percentage representing annual variance ppt powerpoint presentation gallery portfolio pdf. This layout presents information on bar chart with percentage representing annual variance. It is also available for immediate download and adjustment. So, changes can be made in the color, design, graphics or any other component to create a unique layout.

Bar Chart With Percentage Representing Inventory Ppt PowerPoint Presentation File Outfit PDF
Pitch your topic with ease and precision using this bar chart with percentage representing inventory ppt powerpoint presentation file outfit pdf. This layout presents information on bar chart with percentage representing inventory. It is also available for immediate download and adjustment. So, changes can be made in the color, design, graphics or any other component to create a unique layout.
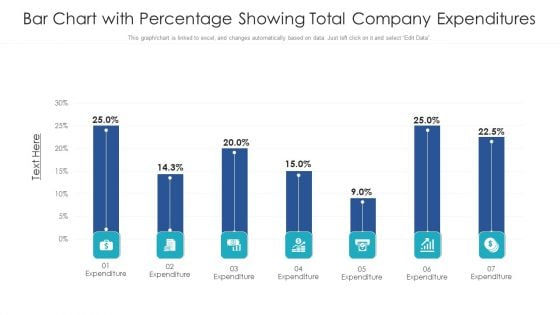
Bar Chart With Percentage Showing Total Company Expenditures Ppt PowerPoint Presentation File Background PDF
Pitch your topic with ease and precision using this bar chart with percentage showing total company expenditures ppt powerpoint presentation file background pdf. This layout presents information on bar chart with percentage showing total company expenditures. It is also available for immediate download and adjustment. So, changes can be made in the color, design, graphics or any other component to create a unique layout.
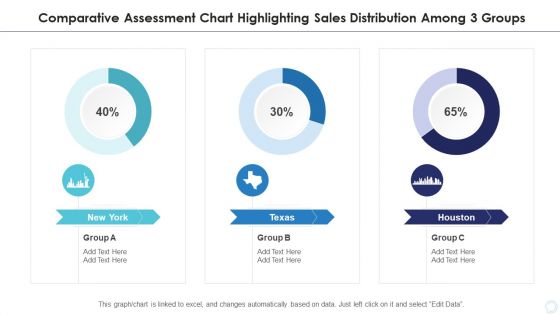
Comparative Assessment Chart Highlighting Sales Distribution Among 3 Groups Designs PDF
Pitch your topic with ease and precision using this comparative assessment chart highlighting sales distribution among 3 groups designs pdf. This layout presents information on comparative assessment chart highlighting sales distribution among 3 groups. It is also available for immediate download and adjustment. So, changes can be made in the color, design, graphics or any other component to create a unique layout.
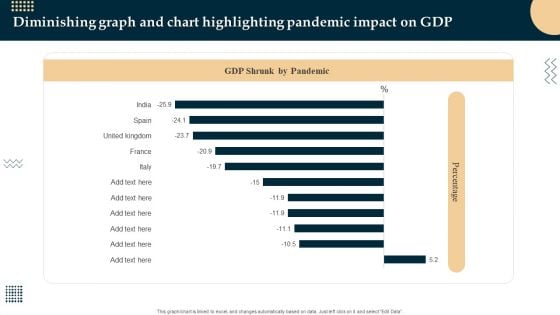
Diminishing Graph And Chart Highlighting Pandemic Impact On GDP Sample PDF
Pitch your topic with ease and precision using this Diminishing Graph And Chart Highlighting Pandemic Impact On GDP Sample PDF. This layout presents information on Diminishing Graph, Chart Highlighting Pandemic. It is also available for immediate download and adjustment. So, changes can be made in the color, design, graphics or any other component to create a unique layout.
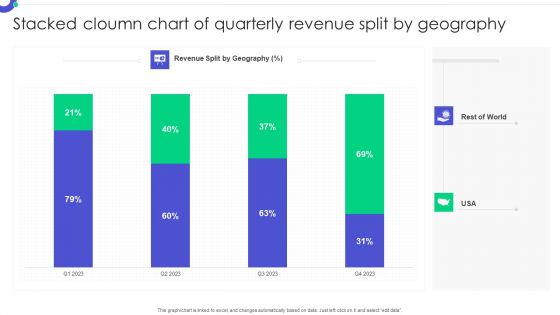
Stacked Cloumn Chart Of Quarterly Revenue Split By Geography Pictures PDF
Pitch your topic with ease and precision using this Stacked Cloumn Chart Of Quarterly Revenue Split By Geography Pictures PDF. This layout presents information on Stacked Column, Chart Quarterly, Revenue Split. It is also available for immediate download and adjustment. So, changes can be made in the color, design, graphics or any other component to create a unique layout.
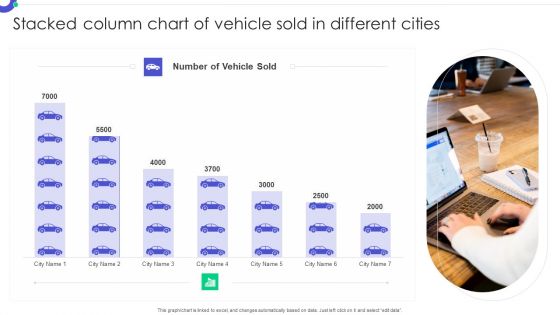
Stacked Column Chart Of Vehicle Sold In Different Cities Formats PDF
Pitch your topic with ease and precision using this Stacked Column Chart Of Vehicle Sold In Different Cities Formats PDF. This layout presents information on Stacked Column, Chart Vehicle, Sold Different Cities. It is also available for immediate download and adjustment. So, changes can be made in the color, design, graphics or any other component to create a unique layout.
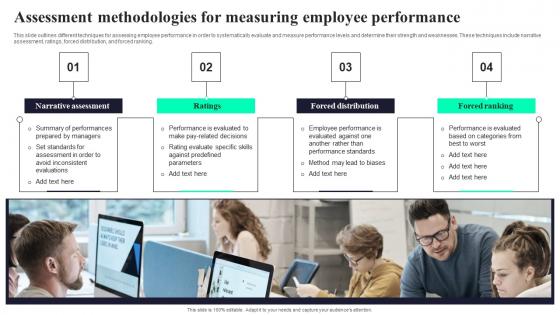
Assessment Methodologies For Measuring Employee Performance Diagrams Pdf
This slide outlines different techniques for assessing employee performance in order to systematically evaluate and measure performance levels and determine their strength and weaknesses. These techniques include narrative assessment, ratings, forced distribution, and forced ranking. Showcasing this set of slides titled Assessment Methodologies For Measuring Employee Performance Diagrams Pdf. The topics addressed in these templates are Narrative Assessment, Ratings, Forced Distribution. All the content presented in this PPT design is completely editable. Download it and make adjustments in color, background, font etc. as per your unique business setting. This slide outlines different techniques for assessing employee performance in order to systematically evaluate and measure performance levels and determine their strength and weaknesses. These techniques include narrative assessment, ratings, forced distribution, and forced ranking.
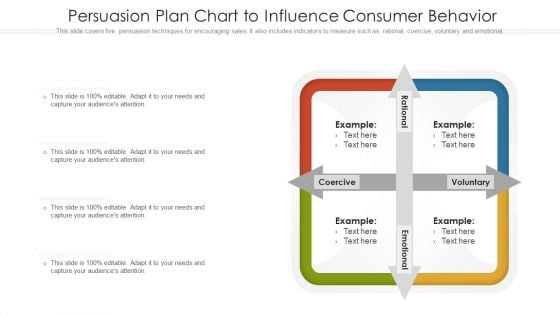
Persuasion Plan Chart To Influence Consumer Behavior Ppt PowerPoint Presentation Summary Design Templates PDF
This slide covers five persuasion techniques for encouraging sales. It also includes indicators to measure such as rational, coercive, voluntary and emotional. Persuade your audience using this persuasion plan chart to influence consumer behavior ppt powerpoint presentation summary design templates pdf. This PPT design covers four stages, thus making it a great tool to use. It also caters to a variety of topics including persuasion plan chart to influence consumer behavior. Download this PPT design now to present a convincing pitch that not only emphasizes the topic but also showcases your presentation skills.
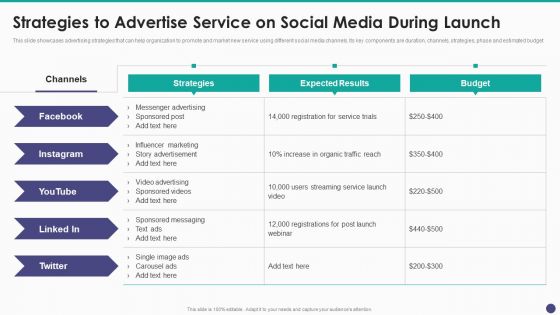
New Service Launch And Development Strategy To Gain Market Share Strategies To Advertise Service On Social Summary PDF
This slide showcases advertising strategies that can help organization to promote and market new service using different social media channels. Its key components are duration, channels, strategies, phase and estimated budget.Deliver and pitch your topic in the best possible manner with this New Service Launch And Development Strategy To Gain Market Share Strategies To Advertise Service On Social Summary PDF Use them to share invaluable insights on Influencer Marketing, Influencer Marketing, Expected Results and impress your audience. This template can be altered and modified as per your expectations. So, grab it now.
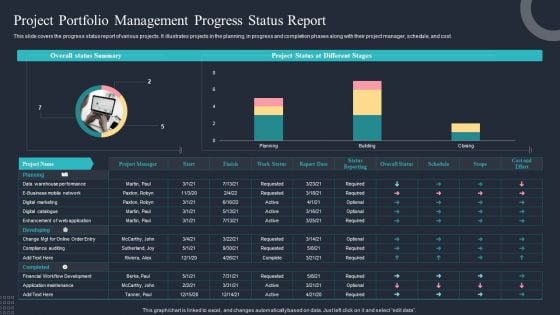
Project Portfolio Management Progress Status Report Ppt Styles Graphics PDF
This slide covers the progress status report of various projects. It illustrates projects in the planning, in progress and completion phases along with their project manager, schedule, and cost. Pitch your topic with ease and precision using this Project Portfolio Management Progress Status Report Ppt Styles Graphics PDF. This layout presents information on Developing, Planning, Financial Workflow Development. It is also available for immediate download and adjustment. So, changes can be made in the color, design, graphics or any other component to create a unique layout.
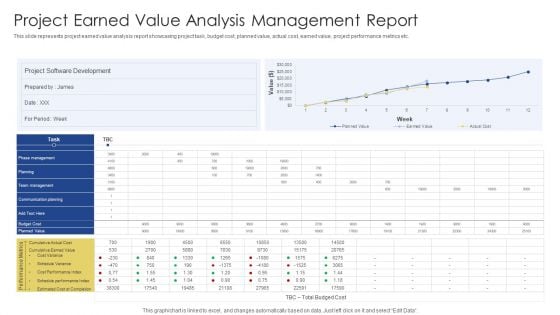
Project Earned Value Analysis Management Report Ppt PowerPoint Presentation Gallery Outline PDF
This slide represents project earned value analysis report showcasing project task, budget cost, planned value, actual cost, earned value, project performance metrics etc. Pitch your topic with ease and precision using this Project Earned Value Analysis Management Report Ppt PowerPoint Presentation Gallery Outline PDF. This layout presents information on Project Software Development, Phase Management, Communication Planning. It is also available for immediate download and adjustment. So, changes can be made in the color, design, graphics or any other component to create a unique layout.
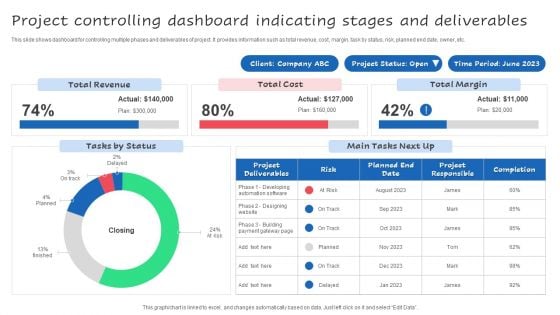
Project Controlling Dashboard Indicating Stages And Deliverables Ppt Styles Guide PDF
This slide shows dashboard for controlling multiple phases and deliverables of project. It provides information such as total revenue, cost, margin, task by status, risk, planned end date, owner, etc. Pitch your topic with ease and precision using this Project Controlling Dashboard Indicating Stages And Deliverables Ppt Styles Guide PDF. This layout presents information on Total Revenue, Total Margin, Total Cost. It is also available for immediate download and adjustment. So, changes can be made in the color, design, graphics or any other component to create a unique layout.

Weekly Performance Report Dashboard With Project Budget Download PDF
This slide contains the weekly performance report of various phases of project with the overdue tasks and their upcoming . it also includes the project budget with the tracking of workload on staff members. Pitch your topic with ease and precision using this Weekly Performance Report Dashboard With Project Budget Download PDF. This layout presents information on Planning, Design, Development, Testing. It is also available for immediate download and adjustment. So, changes can be made in the color, design, graphics or any other component to create a unique layout.
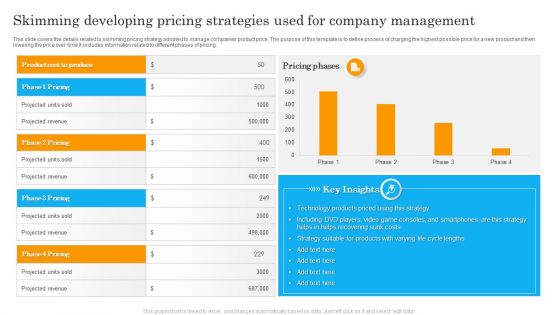
Skimming Developing Pricing Strategies Used For Company Management Sample PDF
This slide covers the details related to skimming pricing strategy adopted to manage companies product price. The purpose of this template is to define process of charging the highest possible price for a new product and then lowering the price over time It includes information related to different phases of pricing. Pitch your topic with ease and precision using this Skimming Developing Pricing Strategies Used For Company Management Sample PDF. This layout presents information on Key Insights, Technology Products, Strategy. It is also available for immediate download and adjustment. So, changes can be made in the color, design, graphics or any other component to create a unique layout.
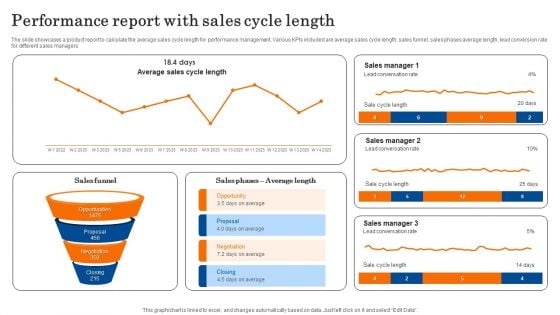
Performance Report With Sales Cycle Length Template PDF
The slide showcases a product report to calculate the average sales cycle length for performance management. Various KPIs included are average sales cycle length, sales funnel, sales phases average length, lead conversion rate for different sales managers. sPitch your topic with ease and precision using this Performance Report With Sales Cycle Length Template PDF. This layout presents information on Sales Manager, Conversation Rate, Opportunity. It is also available for immediate download and adjustment. So, changes can be made in the color, design, graphics or any other component to create a unique layout.
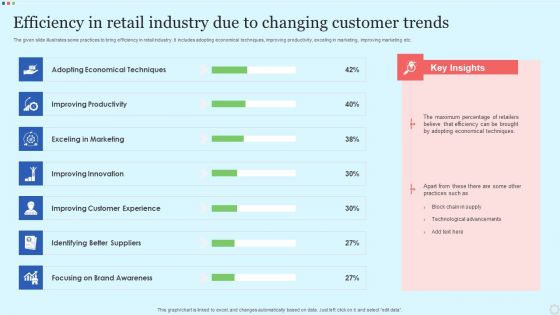
Efficiency In Retail Industry Due To Changing Customer Trends Microsoft PDF
The given slide illustrates some practices to bring efficiency in retail industry. It includes adopting economical techniques, improving productivity, exceling in marketing, improving marketing etc. Pitch your topic with ease and precision using this Efficiency In Retail Industry Due To Changing Customer Trends Microsoft PDF. This layout presents information on Adopting Techniques, Improving Productivity, Exceling Marketing. It is also available for immediate download and adjustment. So, changes can be made in the color, design, graphics or any other component to create a unique layout.
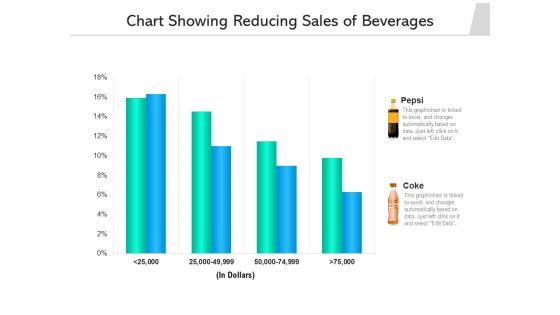
Chart Showing Reducing Sales Of Beverages Ppt PowerPoint Presentation Gallery Slide Portrait PDF
Pitch your topic with ease and precision using this chart showing reducing sales of beverages ppt powerpoint presentation gallery slide portrait pdf. This layout presents information on pepsi, coke. It is also available for immediate download and adjustment. So, changes can be made in the color, design, graphics or any other component to create a unique layout.
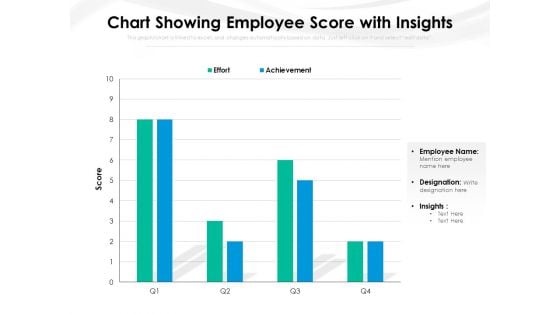
Chart Showing Employee Score With Insights Ppt PowerPoint Presentation Slides Influencers PDF
Pitch your topic with ease and precision using this chart showing employee score with insights ppt powerpoint presentation slides influencers pdf. This layout presents information on employee, effort, achievement, score. It is also available for immediate download and adjustment. So, changes can be made in the color, design, graphics or any other component to create a unique layout.
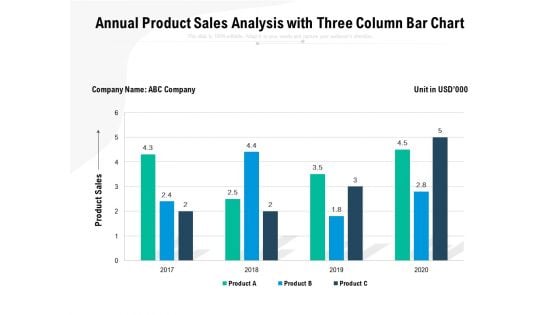
Annual Product Sales Analysis With Three Column Bar Chart Ppt PowerPoint Presentation Inspiration Layouts PDF
Pitch your topic with ease and precision using this annual product sales analysis with three column bar chart ppt powerpoint presentation inspiration layouts pdf. This layout presents information on product sales, 2017 to 2020. It is also available for immediate download and adjustment. So, changes can be made in the color, design, graphics or any other component to create a unique layout.
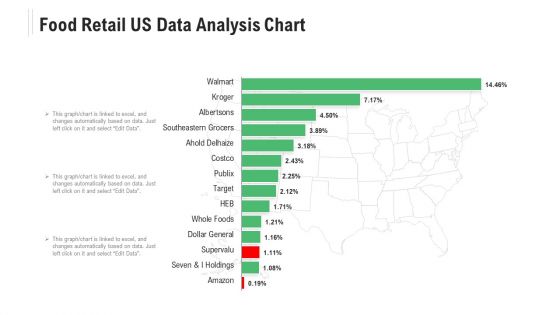
Food Retail US Data Analysis Chart Ppt Powerpoint Presentation Ideas Microsoft Pdf
Pitch your topic with ease and precision using this food retail us data analysis chart ppt powerpoint presentation ideas microsoft pdf. This layout presents information on seven and i holdings, amazon, southeastern grocers, albertsons, target. It is also available for immediate download and adjustment. So, changes can be made in the color, design, graphics or any other component to create a unique layout.
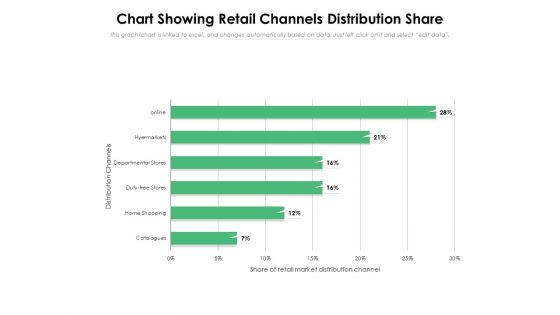
Chart Showing Retail Channels Distribution Share Ppt PowerPoint Presentation Styles Format PDF
Pitch your topic with ease and precision using this chart showing retail channels distribution share ppt powerpoint presentation styles format pdf. This layout presents information on home shopping, duty free stores, departmental stores, hyermarkets, online. It is also available for immediate download and adjustment. So, changes can be made in the color, design, graphics or any other component to create a unique layout.
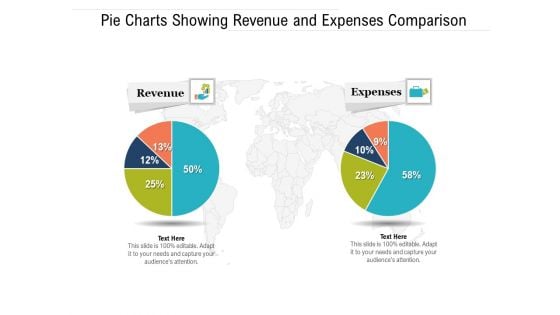
Pie Charts Showing Revenue And Expenses Comparison Ppt PowerPoint Presentation File Objects PDF
Pitch your topic with ease and precision using this pie charts showing revenue and expenses comparison ppt powerpoint presentation file objects pdf. This layout presents information on revenue, expenses. It is also available for immediate download and adjustment. So, changes can be made in the color, design, graphics or any other component to create a unique layout.
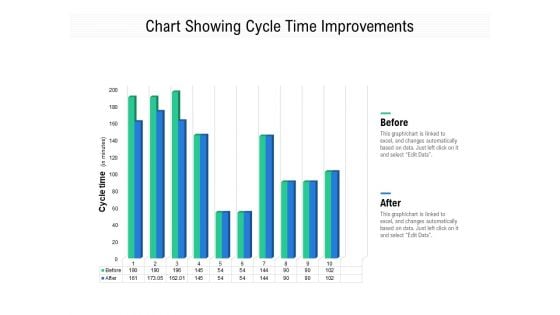
Chart Showing Cycle Time Improvements Ppt PowerPoint Presentation Infographic Template Rules PDF
Pitch your topic with ease and precision using this chart showing cycle time improvements ppt powerpoint presentation infographic template rules pdf. This layout presents information on before, after. It is also available for immediate download and adjustment. So, changes can be made in the color, design, graphics or any other component to create a unique layout.

Coronavirus Disease 19 Contagiousness Comparison Chart Ppt PowerPoint Presentation Professional Background Designs PDF
Pitch your topic with ease and precision using this coronavirus disease 19 contagiousness comparison chart ppt powerpoint presentation professional background designs pdf. This layout presents information on x values seasonal norovirus case fatality rate. It is also available for immediate download and adjustment. So, changes can be made in the color, design, graphics or any other component to create a unique layout.
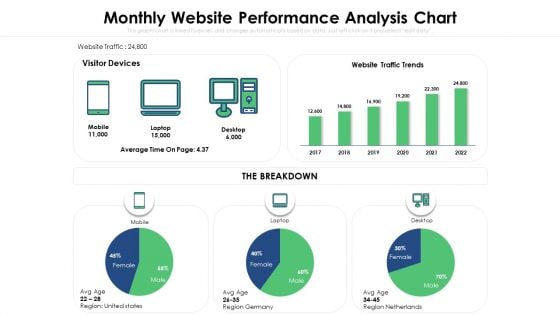
Monthly Website Performance Analysis Chart Ppt PowerPoint Presentation Model Skills PDF
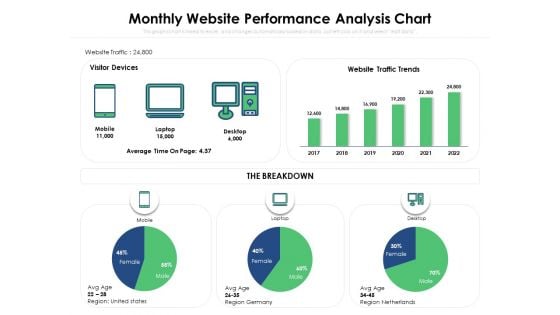
Monthly Website Performance Analysis Chart Ppt PowerPoint Presentation Ideas Master Slide PDF
Pitch your topic with ease and precision using this monthly website performance analysis chart ppt powerpoint presentation ideas master slide pdf. This layout presents information on visitor devices, website traffic trends, the breakdown, average time. It is also available for immediate download and adjustment. So, changes can be made in the color, design, graphics or any other component to create a unique layout.
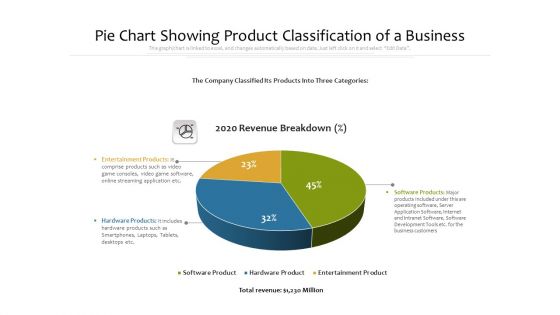
Pie Chart Showing Product Classification Of A Business Ppt PowerPoint Presentation File Guide PDF
Pitch your topic with ease and precision using this pie chart showing product classification of a business ppt powerpoint presentation file guide pdf. This layout presents information on entertainment products, hardware products, software products. It is also available for immediate download and adjustment. So, changes can be made in the color, design, graphics or any other component to create a unique layout.
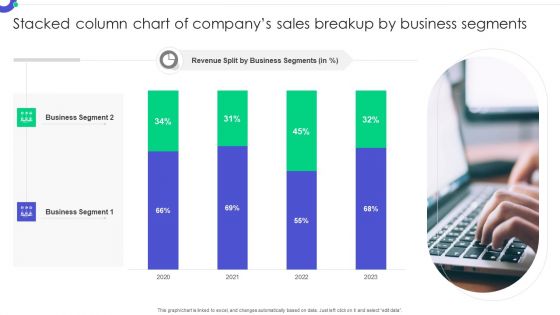
Stacked Column Chart Of Companys Sales Breakup By Business Segments Rules PDF
Pitch your topic with ease and precision using this Stacked Column Chart Of Companys Sales Breakup By Business Segments Rules PDF. This layout presents information on Business Segment, Revenue Split, Business Segments. It is also available for immediate download and adjustment. So, changes can be made in the color, design, graphics or any other component to create a unique layout.
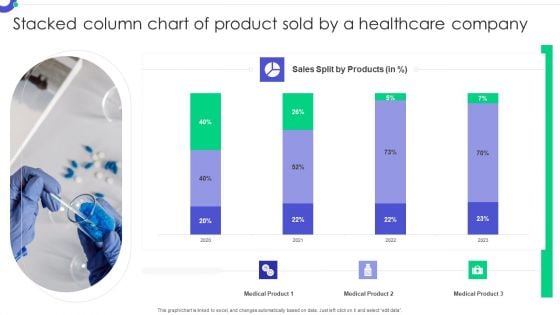
Stacked Column Chart Of Product Sold By A Healthcare Company Download PDF
Pitch your topic with ease and precision using this Stacked Column Chart Of Product Sold By A Healthcare Company Download PDF. This layout presents information on Sales Split Products, Medical Product, Healthcare Company. It is also available for immediate download and adjustment. So, changes can be made in the color, design, graphics or any other component to create a unique layout.
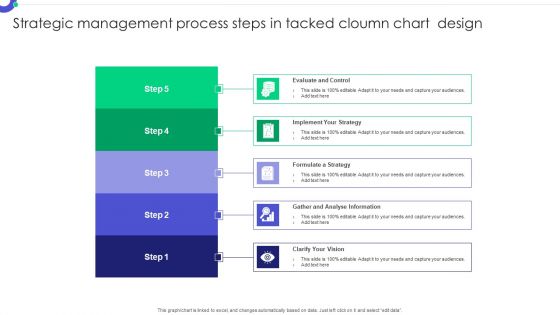
Strategic Management Process Steps In Tacked Cloumn Chart Design Pictures PDF
Pitch your topic with ease and precision using this Strategic Management Process Steps In Tacked Cloumn Chart Design Pictures PDF. This layout presents information on Evaluate Control, Implement Strategy, Formulate Strategy. It is also available for immediate download and adjustment. So, changes can be made in the color, design, graphics or any other component to create a unique layout.
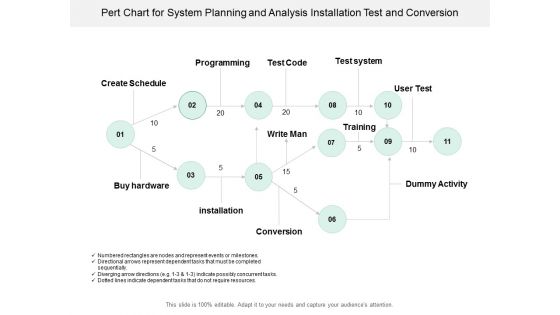
Pert Chart For System Planning And Analysis Installation Test And Conversion Ppt Powerpoint Presentation Pictures Graphics Tutorials
This is a pert chart for system planning and analysis installation test and conversion ppt powerpoint presentation pictures graphics tutorials. This is a eleven stage process. The stages in this process are pert chart, program evaluation and review technique, pert graph.
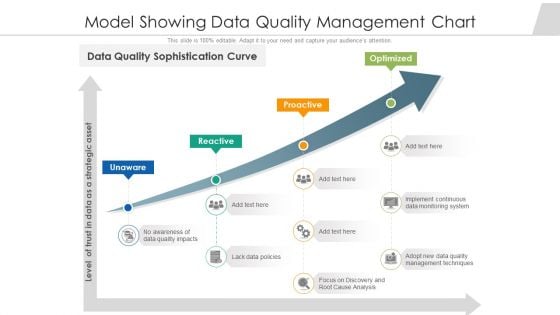
Model Showing Data Quality Management Chart Ppt PowerPoint Presentation Show Slide Download PDF
Persuade your audience using this model showing data quality management chart ppt powerpoint presentation show slide download pdf. This PPT design covers four stages, thus making it a great tool to use. It also caters to a variety of topics including implement continuous data monitoring system, management techniques, strategic asset. Download this PPT design now to present a convincing pitch that not only emphasizes the topic but also showcases your presentation skills.

 Home
Home