Organizational Icons
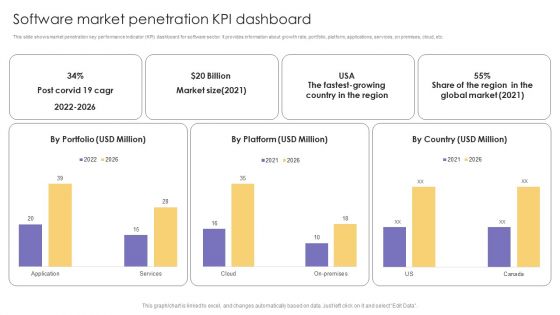
Software Market Penetration KPI Dashboard Ppt Outline Aids PDF
This slide shows market penetration key performance indicator KPI dashboard for software sector. It provides information about growth rate, portfolio, platform, applications, services, on premises, cloud, etc. Pitch your topic with ease and precision using this Software Market Penetration KPI Dashboard Ppt Outline Aids PDF. This layout presents information on Market Size, Global Market, Cloud. It is also available for immediate download and adjustment. So, changes can be made in the color, design, graphics or any other component to create a unique layout.
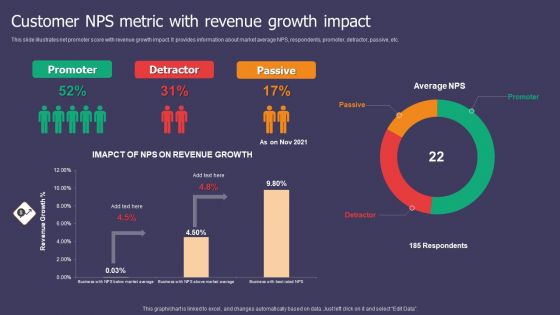
Customer NPS Metric With Revenue Growth Impact Ppt Show Portrait PDF
This slide illustrates net promoter score with revenue growth impact. It provides information about market average NPS, respondents, promoter, detractor, passive, etc. Pitch your topic with ease and precision using this Customer NPS Metric With Revenue Growth Impact Ppt Show Portrait PDF. This layout presents information on Promoter, Detractor, Passive. It is also available for immediate download and adjustment. So, changes can be made in the color, design, graphics or any other component to create a unique layout.
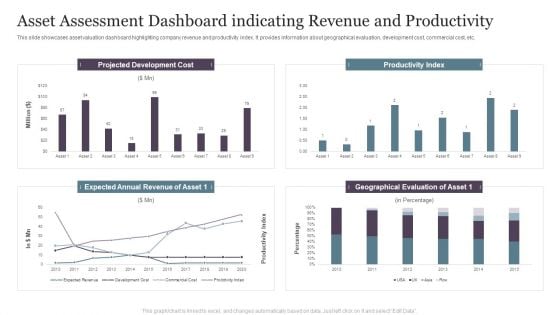
Asset Assessment Dashboard Indicating Revenue And Productivity Infographics PDF
This slide showcases asset valuation dashboard highlighting company revenue and productivity index. It provides information about geographical evaluation, development cost, commercial cost, etc.Pitch your topic with ease and precision using this Asset Assessment Dashboard Indicating Revenue And Productivity Infographics PDF. This layout presents information on Projected Development, Productivity Index, Geographical Evaluation. It is also available for immediate download and adjustment. So, changes can be made in the color, design, graphics or any other component to create a unique layout.
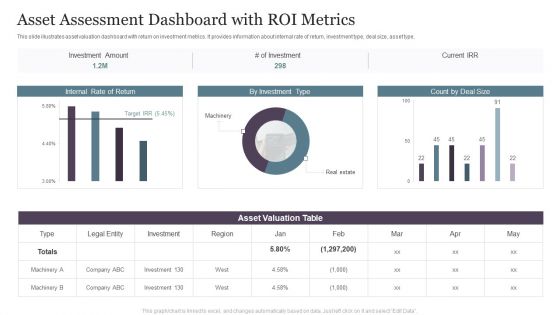
Asset Assessment Dashboard With ROI Metrics Topics PDF
This slide illustrates asset valuation dashboard with return on investment metrics. It provides information about internal rate of return, investment type, deal size, asset type, Pitch your topic with ease and precision using this Asset Assessment Dashboard With ROI Metrics Topics PDF. This layout presents information on Investment Amount, Asset Valuation, Internal Return. It is also available for immediate download and adjustment. So, changes can be made in the color, design, graphics or any other component to create a unique layout.
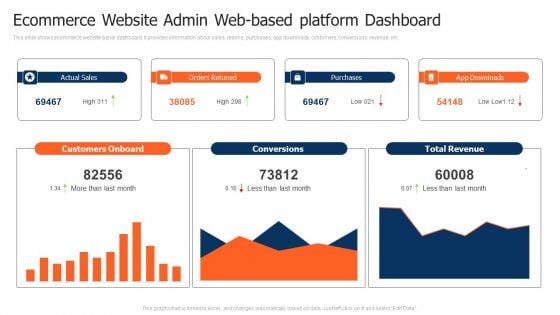
Ecommerce Website Admin Web Based Platform Dashboard Pictures PDF
This slide shows ecommerce website panel dashboard. It provides information about sales, returns, purchases, app downloads, customers, conversions, revenue, etc. Pitch your topic with ease and precision using this Ecommerce Website Admin Web Based Platform Dashboard Pictures PDF. This layout presents information on Customers Onboard, Purchases, Total Revenue. It is also available for immediate download and adjustment. So, changes can be made in the color, design, graphics or any other component to create a unique layout.
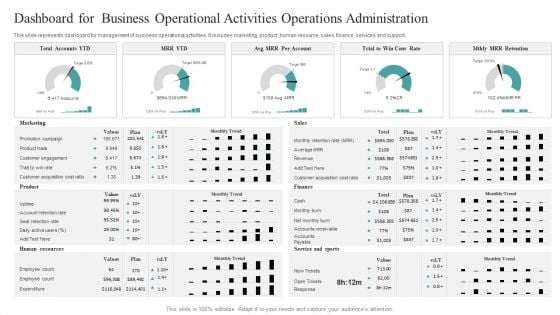
Dashboard For Business Operational Activities Operations Administration Designs PDF
This slide represents dashboard for management of business operational activities. It includes marketing, product, human resource, sales, finance, services and support. Pitch your topic with ease and precision using this Dashboard For Business Operational Activities Operations Administration Designs PDF. This layout presents information on Marketing, Product, Human Resources. It is also available for immediate download and adjustment. So, changes can be made in the color, design, graphics or any other component to create a unique layout.
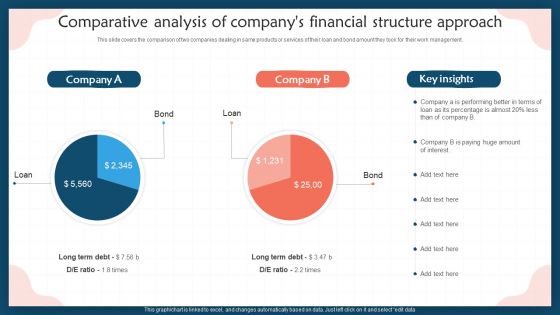
Comparative Analysis Of Companys Financial Structure Approach Inspiration PDF
This slide covers the comparison of two companies dealing in same products or services of their loan and bond amount they took for their work management. Pitch your topic with ease and precision using this Comparative Analysis Of Companys Financial Structure Approach Inspiration PDF. This layout presents information on Comparative Analysis, Companys Financial Structure Approach. It is also available for immediate download and adjustment. So, changes can be made in the color, design, graphics or any other component to create a unique layout.
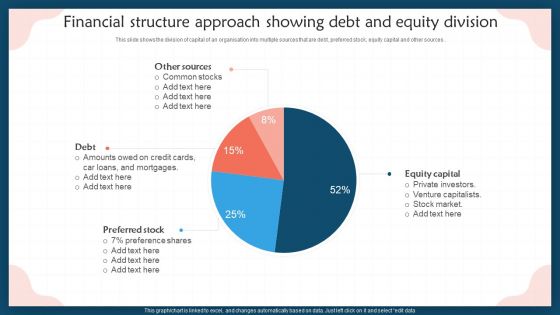
Financial Structure Approach Showing Debt And Equity Division Introduction PDF
This slide shows the division of capital of an organisation into multiple sources that are debt, preferred stock, equity capital and other sources . Pitch your topic with ease and precision using this Financial Structure Approach Showing Debt And Equity Division Introduction PDF. This layout presents information on Other Sources, Preferred Stock, Equity Capital, Debt. It is also available for immediate download and adjustment. So, changes can be made in the color, design, graphics or any other component to create a unique layout.
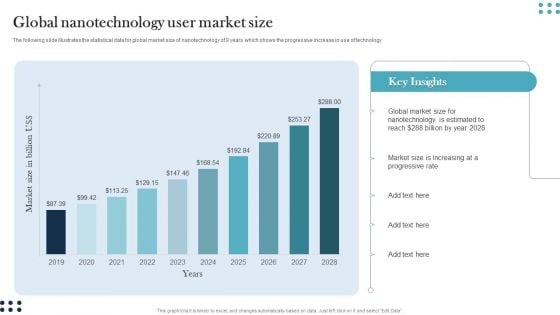
Global Nanotechnology User Market Size Guidelines PDF
The following slide illustrates the statistical data for global market size of nanotechnology of 9 years which shows the progressive increase in use of technology. Pitch your topic with ease and precision using this Global Nanotechnology User Market Size Guidelines PDF. This layout presents information on Global Market Size, Nanotechnology, Estimated To Reach. It is also available for immediate download and adjustment. So, changes can be made in the color, design, graphics or any other component to create a unique layout.
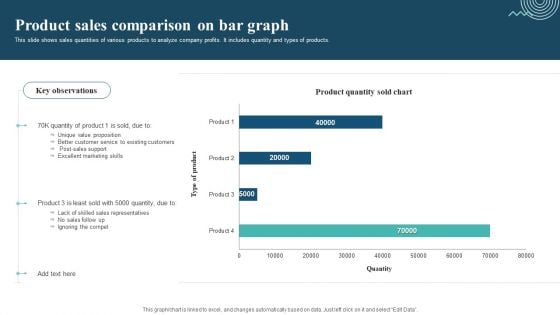
Product Sales Comparison On Bar Graph Sample PDF
This slide shows sales quantities of various products to analyze company profits. It includes quantity and types of products. Pitch your topic with ease and precision using this Product Sales Comparison On Bar Graph Sample PDF. This layout presents information on Unique Value Proposition, Excellent Marketing Skills, Ignoring The Compet. It is also available for immediate download and adjustment. So, changes can be made in the color, design, graphics or any other component to create a unique layout.
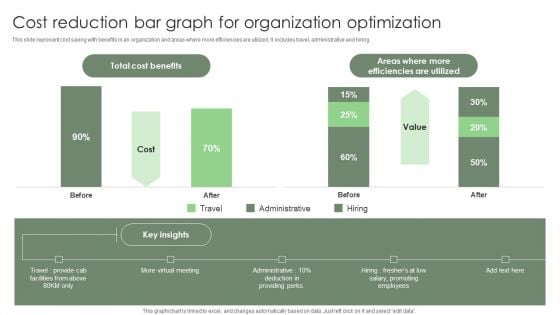
Cost Reduction Bar Graph For Organization Optimization Ppt Inspiration Vector PDF
This slide represent cost saving with benefits in an organization and areas where more efficiencies are utilized. It includes travel, administrative and hiring. Pitch your topic with ease and precision using this Cost Reduction Bar Graph For Organization Optimization Ppt Inspiration Vector PDF. This layout presents information on Total Cost Benefits, Promoting Employees, Providing Perks. It is also available for immediate download and adjustment. So, changes can be made in the color, design, graphics or any other component to create a unique layout.
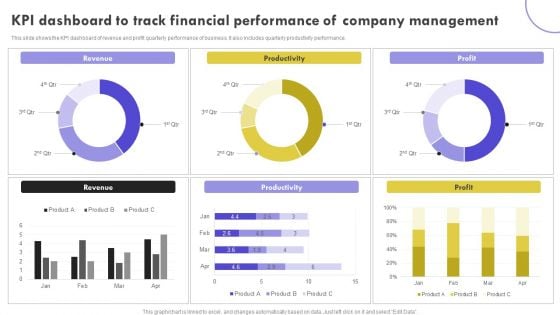
KPI Dashboard To Track Financial Performance Of Company Management Clipart PDF
This slide shows the KPI dashboard of revenue and profit quarterly performance of business. It also includes quarterly productivity performance. Pitch your topic with ease and precision using this KPI Dashboard To Track Financial Performance Of Company Management Clipart PDF. This layout presents information on Revenue, Productivity, Profit. It is also available for immediate download and adjustment. So, changes can be made in the color, design, graphics or any other component to create a unique layout.

KPI Dashboard Of Customer And Product Sales Performance Comparison Information PDF
This slide shows the KPI dashboard of client and product sales comparison. It also includes sales by location and total sales. Pitch your topic with ease and precision using this KPI Dashboard Of Customer And Product Sales Performance Comparison Information PDF. This layout presents information on Product Sales, Client Sales, Tim Santana. It is also available for immediate download and adjustment. So, changes can be made in the color, design, graphics or any other component to create a unique layout.
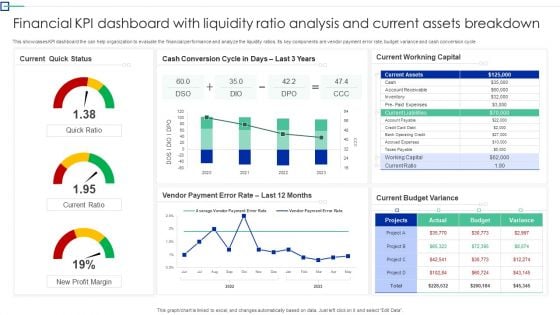
Financial KPI Dashboard With Liquidity Ratio Analysis And Current Assets Breakdown Ideas PDF
This showcases KPI dashboard the can help organization to evaluate the financial performance and analyze the liquidity ratios. Its key components are vendor payment error rate, budget variance and cash conversion cycle. Showcasing this set of slides titled. The topics addressed in these templates are Quick Status, Workning Capital, Budget Variance. All the content presented in this PPT design is completely editable. Download it and make adjustments in color, background, font etc. as per your unique business setting.
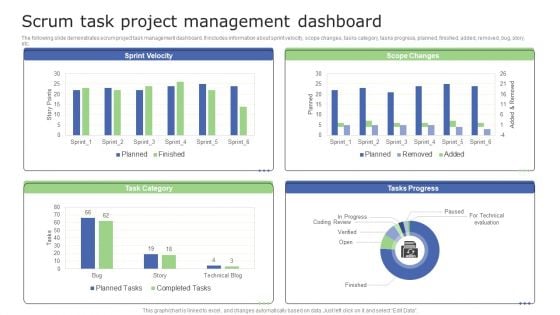
Scrum Task Project Management Dashboard Information PDF
The following slide demonstrates scrum project task management dashboard. It includes information about sprint velocity, scope changes, tasks category, tasks progress, planned, finished, added, removed, bug, story, etc. Pitch your topic with ease and precision using this Scrum Task Project Management Dashboard Information PDF. This layout presents information on Scrum Task Project, Management Dashboard. It is also available for immediate download and adjustment. So, changes can be made in the color, design, graphics or any other component to create a unique layout.
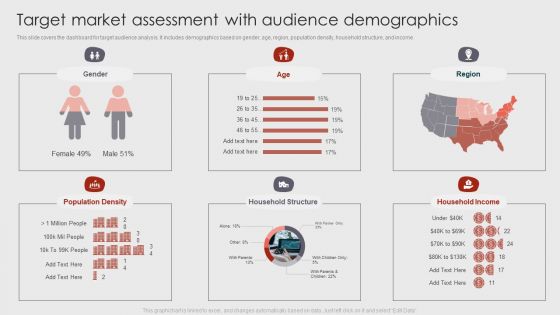
Target Market Assessment With Audience Demographics Inspiration PDF
This slide covers the dashboard for target audience analysis. It includes demographics based on gender, age, region, population density, household structure, and income. Pitch your topic with ease and precision using this Target Market Assessment With Audience Demographics Inspiration PDF. This layout presents information on Target Market Assessment, Audience Demographics . It is also available for immediate download and adjustment. So, changes can be made in the color, design, graphics or any other component to create a unique layout.
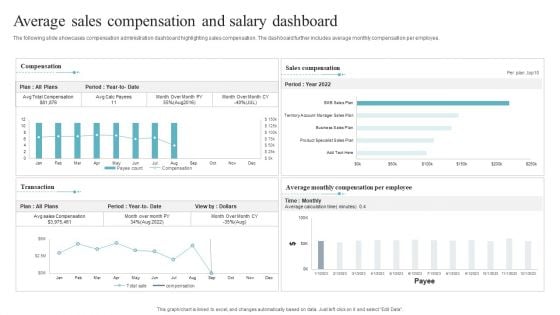
Average Sales Compensation And Salary Dashboard Introduction PDF
The following slide showcases compensation administration dashboard highlighting sales compensation. The dashboard further includes average monthly compensation per employee. Pitch your topic with ease and precision using this Average Sales Compensation And Salary Dashboard Introduction PDF. This layout presents information on Salary Dashboard, Average Sales Compensation. It is also available for immediate download and adjustment. So, changes can be made in the color, design, graphics or any other component to create a unique layout.
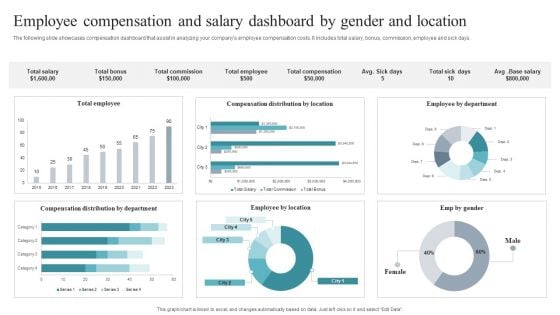
Employee Compensation And Salary Dashboard By Gender And Location Download PDF
The following slide showcases compensation dashboard that assist in analyzing your companys employee compensation costs. It includes total salary, bonus, commission, employee and sick days. Pitch your topic with ease and precision using this Employee Compensation And Salary Dashboard By Gender And Location Download PDF. This layout presents information on Employee By Location, Location, Employee. It is also available for immediate download and adjustment. So, changes can be made in the color, design, graphics or any other component to create a unique layout.
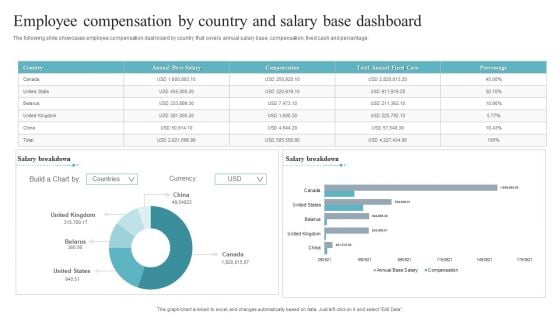
Employee Compensation By Country And Salary Base Dashboard Mockup PDF
The following slide showcases employee compensation dashboard by country that covers annual salary base, compensation, fixed cash and percentage. Pitch your topic with ease and precision using this Employee Compensation By Country And Salary Base Dashboard Mockup PDF. This layout presents information on Employee Compensation, Country Salary Base Dashboard. It is also available for immediate download and adjustment. So, changes can be made in the color, design, graphics or any other component to create a unique layout.
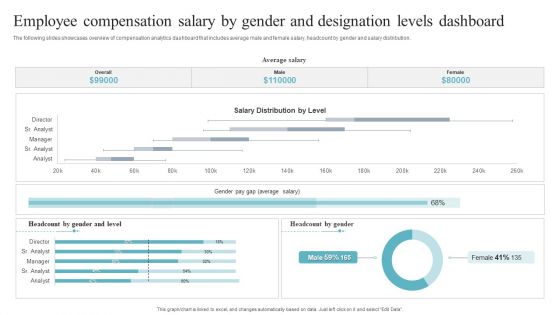
Employee Compensation Salary By Gender And Designation Levels Dashboard Portrait PDF
The following slides showcases overview of compensation analytics dashboard that includes average male and female salary, headcount by gender and salary distribution. Pitch your topic with ease and precision using this Employee Compensation Salary By Gender And Designation Levels Dashboard Portrait PDF. This layout presents information on Employee Compensation Salary, Designation Levels Dashboard. It is also available for immediate download and adjustment. So, changes can be made in the color, design, graphics or any other component to create a unique layout.
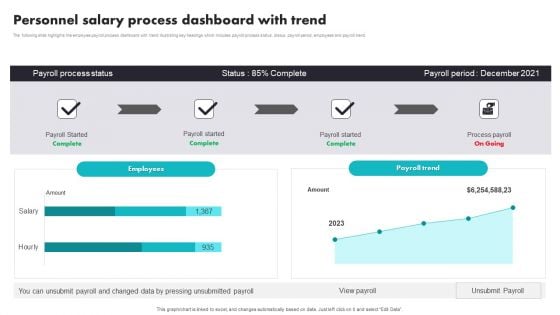
Personnel Salary Process Dashboard With Trend Brochure PDF
The following slide highlights the employee payroll process dashboard with trend illustrating key headings which includes payroll process status, status, payroll period, employees and payroll trend. Pitch your topic with ease and precision using this Personnel Salary Process Dashboard With Trend Brochure PDF. This layout presents information on Personnel Salary Process, Dashboard With Trend. It is also available for immediate download and adjustment. So, changes can be made in the color, design, graphics or any other component to create a unique layout.
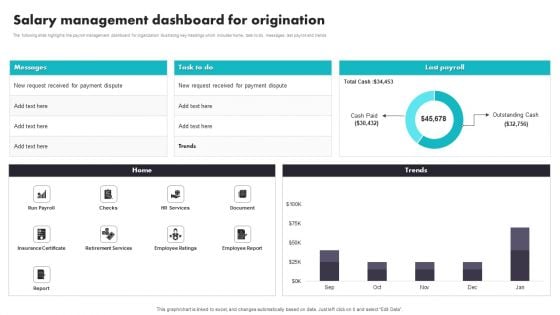
Salary Management Dashboard For Origination Graphics PDF
The following slide highlights the payroll management dashboard for organization illustrating key headings which includes home, task to do, messages, last payroll and trends Pitch your topic with ease and precision using this Salary Management Dashboard For Origination Graphics PDF. This layout presents information on Salary Management Dashboard, Origination. It is also available for immediate download and adjustment. So, changes can be made in the color, design, graphics or any other component to create a unique layout.
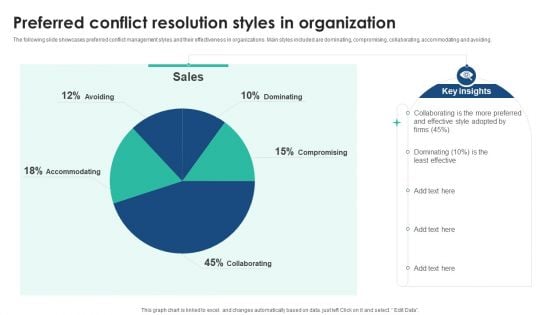
Preferred Conflict Resolution Styles In Organization Demonstration PDF
The following slide showcases preferred conflict management styles and their effectiveness in organizations. Main styles included are dominating, compromising, collaborating, accommodating and avoiding. Pitch your topic with ease and precision using this Preferred Conflict Resolution Styles In Organization Demonstration PDF. This layout presents information on Preferred Conflict, Resolution Styles, Organization. It is also available for immediate download and adjustment. So, changes can be made in the color, design, graphics or any other component to create a unique layout.
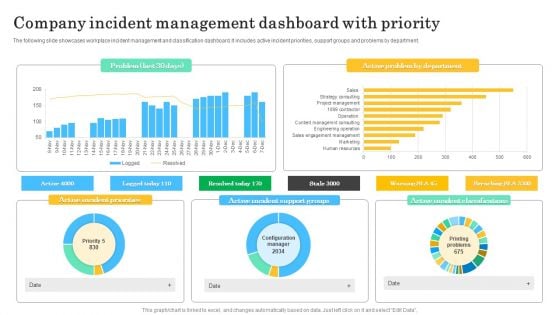
Company Incident Management Dashboard With Priority Microsoft PDF
The following slide showcases workplace incident management and classification dashboard. It includes active incident priorities, support groups and problems by department. Pitch your topic with ease and precision using this Company Incident Management Dashboard With Priority Microsoft PDF. This layout presents information on Active Incident Classifications, Active Incident Support, Active Incident Priorities . It is also available for immediate download and adjustment. So, changes can be made in the color, design, graphics or any other component to create a unique layout.
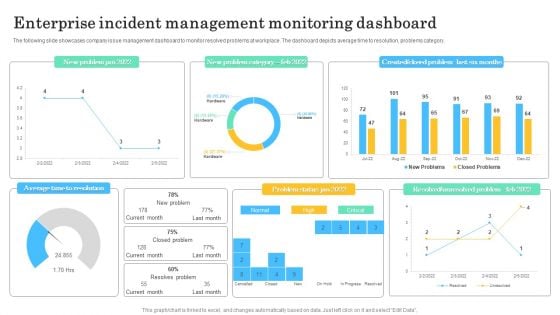
Enterprise Incident Management Monitoring Dashboard Graphics PDF
The following slide showcases company issue management dashboard to monitor resolved problems at workplace. The dashboard depicts average time to resolution, problems category. Pitch your topic with ease and precision using this Enterprise Incident Management Monitoring Dashboard Graphics PDF. This layout presents information on Average Time Resolution, New Problem Category. It is also available for immediate download and adjustment. So, changes can be made in the color, design, graphics or any other component to create a unique layout.
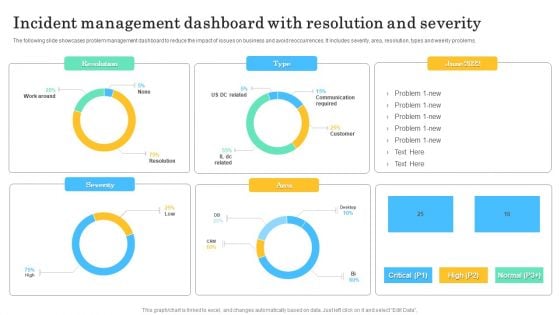
Incident Management Dashboard With Resolution And Severity Guidelines PDF
The following slide showcases problem management dashboard to reduce the impact of issues on business and avoid reoccurrences. It includes severity, area, resolution, types and weekly problems. Pitch your topic with ease and precision using this Incident Management Dashboard With Resolution And Severity Guidelines PDF. This layout presents information on Resolution, Severity, Area. It is also available for immediate download and adjustment. So, changes can be made in the color, design, graphics or any other component to create a unique layout.
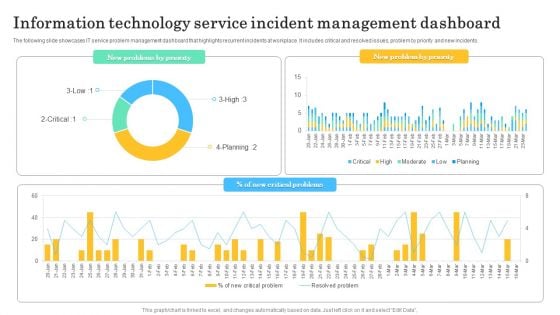
Information Technology Service Incident Management Dashboard Graphics PDF
The following slide showcases IT service problem management dashboard that highlights recurrent incidents at workplace. It includes critical and resolved issues, problem by priority and new incidents. Pitch your topic with ease and precision using this Information Technology Service Incident Management Dashboard Graphics PDF. This layout presents information onInformation Technology, Service Incident, Management Dashboard. It is also available for immediate download and adjustment. So, changes can be made in the color, design, graphics or any other component to create a unique layout.
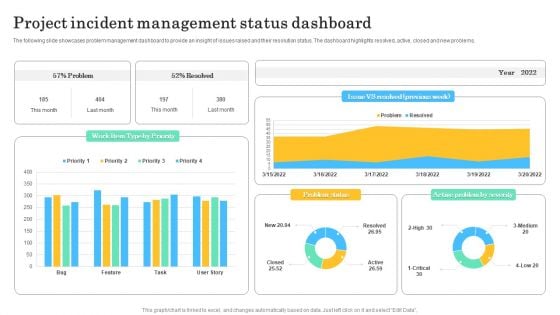
Project Incident Management Status Dashboard Sample PDF
The following slide showcases problem management dashboard to provide an insight of issues raised and their resolution status. The dashboard highlights resolved, active, closed and new problems. Pitch your topic with ease and precision using this Project Incident Management Status Dashboard Sample PDF. This layout presents information on Project Incident, Management Status Dashboard. It is also available for immediate download and adjustment. So, changes can be made in the color, design, graphics or any other component to create a unique layout.
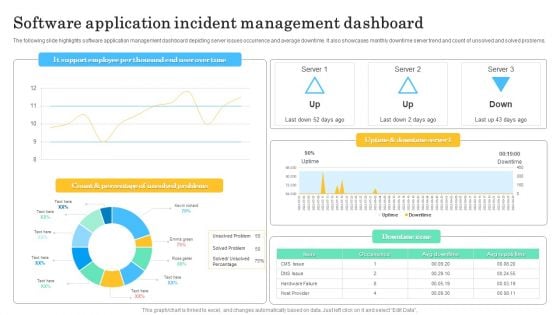
Software Application Incident Management Dashboard Template PDF
The following slide highlights software application management dashboard depicting server issues occurrence and average downtime. It also showcases monthly downtime server trend and count of unsolved and solved problems. Pitch your topic with ease and precision using this Software Application Incident Management Dashboard Template PDF. This layout presents information on Count And Percentage, Unsolved Problems. It is also available for immediate download and adjustment. So, changes can be made in the color, design, graphics or any other component to create a unique layout.
Email Marketing Campaign Kpis Tracking Dashboard Graphics PDF
This slide shows key performance indicators KPI dashboard for measuring effectiveness of email campaigns. It provides information about sent, delivered, opens, clicks, unsubscribed, bounces, complaints, etc. Pitch your topic with ease and precision using this Email Marketing Campaign Kpis Tracking Dashboard Graphics PDF. This layout presents information on Email Marketing Campaign, Tracking Dashboard. It is also available for immediate download and adjustment. So, changes can be made in the color, design, graphics or any other component to create a unique layout.
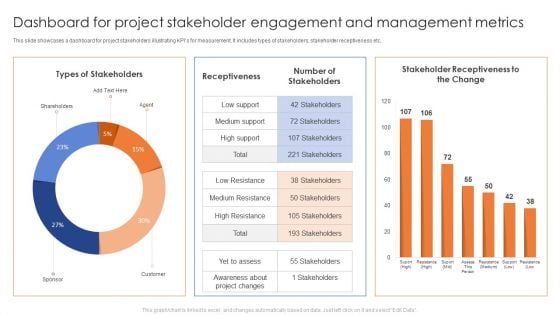
Dashboard For Project Stakeholder Engagement And Management Metrics Brochure PDF
This slide showcases a dashboard for project stakeholders illustrating KPIs for measurement. It includes types of stakeholders, stakeholder receptiveness etc. Pitch your topic with ease and precision using this Dashboard For Project Stakeholder Engagement And Management Metrics Brochure PDF. This layout presents information on Types Of Stakeholders, Receptiveness, Number Of Stakeholders. It is also available for immediate download and adjustment. So, changes can be made in the color, design, graphics or any other component to create a unique layout.
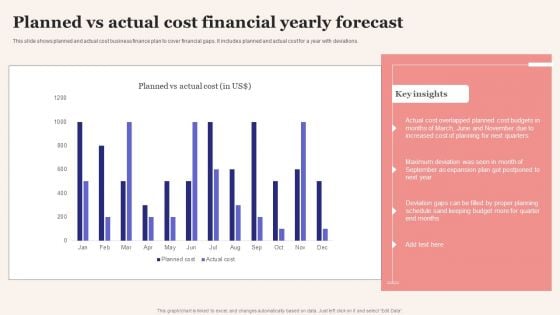
Planned Vs Actual Cost Financial Yearly Forecast Portrait PDF
This slide shows planned and actual cost business finance plan to cover financial gaps. It includes planned and actual cost for a year with deviations. Pitch your topic with ease and precision using this Planned Vs Actual Cost Financial Yearly Forecast Portrait PDF. This layout presents information on Planned Vs Actual Cost, Financial Yearly Forecast. It is also available for immediate download and adjustment. So, changes can be made in the color, design, graphics or any other component to create a unique layout.
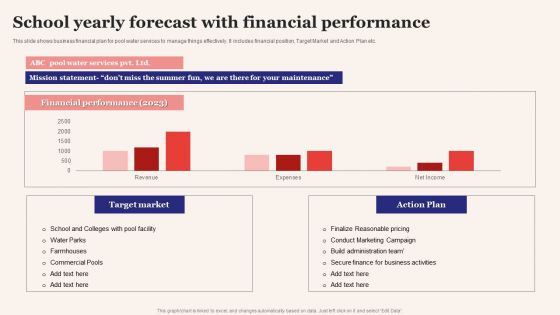
School Yearly Forecast With Financial Performance Information PDF
This slide shows business financial plan for pool water services to manage things effectively. It includes financial position, Target Market and Action Plan etc. Pitch your topic with ease and precision using this School Yearly Forecast With Financial Performance Information PDF. This layout presents information on Target Market, Action Plan. It is also available for immediate download and adjustment. So, changes can be made in the color, design, graphics or any other component to create a unique layout.
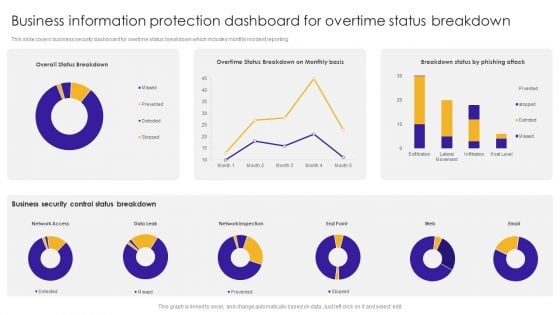
Business Information Protection Dashboard For Overtime Status Breakdown Introduction PDF
This slide covers business security dashboard for overtime status breakdown which includes monthly incident reporting.Pitch your topic with ease and precision using this Business Information Protection Dashboard For Overtime Status Breakdown Introduction PDF. This layout presents information on Business Security, Control Status Breakdown, Network Inspection. It is also available for immediate download and adjustment. So, changes can be made in the color, design, graphics or any other component to create a unique layout.
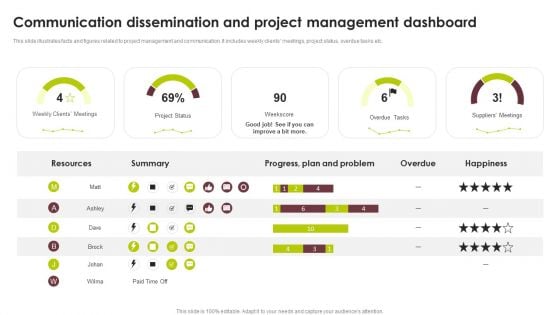
Communication Dissemination And Project Management Dashboard Inspiration PDF
This slide illustrates facts and figures related to project management and communication. It includes weekly clients meetings, project status, overdue tasks etc.Pitch your topic with ease and precision using this Communication Dissemination And Project Management Dashboard Inspiration PDF. This layout presents information on Progress Plan, Overdue Tasks, Project Status. It is also available for immediate download and adjustment. So, changes can be made in the color, design, graphics or any other component to create a unique layout.
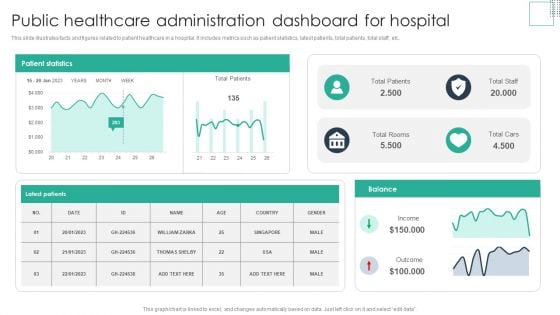
Public Healthcare Administration Dashboard For Hospital Guidelines PDF
This slide illustrates facts and figures related to patient healthcare in a hospital. It includes metrics such as patient statistics, latest patients, total patients, total staff, etc.Pitch your topic with ease and precision using this Public Healthcare Administration Dashboard For Hospital Guidelines PDF. This layout presents information on Total Patients, Total Rooms, Patient Statistics. It is also available for immediate download and adjustment. So, changes can be made in the color, design, graphics or any other component to create a unique layout.
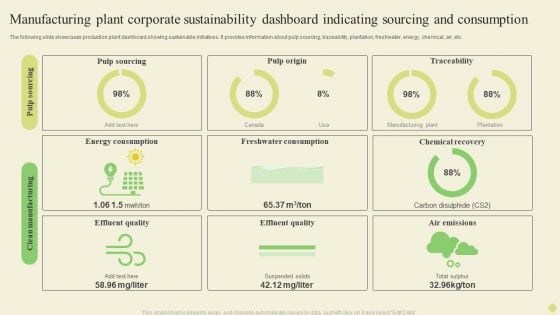
Manufacturing Plant Corporate Sustainability Dashboard Indicating Sourcing And Consumption Infographics PDF
The following slide showcases business sustainability dashboard highlighting multiple sources of technology. It provides information about renewable energy, plant age, solar, wind, biomass, regionality, etc.Pitch your topic with ease and precision using this Manufacturing Plant Corporate Sustainability Dashboard Indicating Sourcing And Consumption Infographics PDF. This layout presents information on Energy Consumption, Freshwater Consumption, Chemical Recovery. It is also available for immediate download and adjustment. So, changes can be made in the color, design, graphics or any other component to create a unique layout.

ITIL Incident Regulation Kpi Dashboard Background PDF
This slide covers ITIL problem management KPI dashboard to track status of problems. It involves KPI such as total number of incidents, problems, requests, average time to solve incidents.Pitch your topic with ease and precision using this ITIL Incident Regulation Kpi Dashboard Background PDF. This layout presents information on Active Problems, Average Incidents, Opened Problems. It is also available for immediate download and adjustment. So, changes can be made in the color, design, graphics or any other component to create a unique layout.
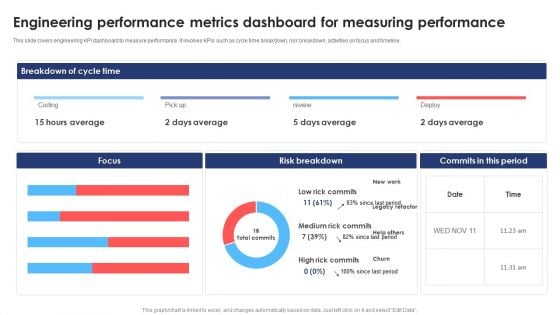
Engineering Performance Metrics Dashboard For Measuring Performance Download PDF
This slide covers engineering KPI dashboard to measure performance. It involves KPIs such as cycle time breakdown, risk breakdown, activities on focus and timeline. Pitch your topic with ease and precision using this Engineering Performance Metrics Dashboard For Measuring Performance Download PDF. This layout presents information on Average, Risk Breakdown, Measuring Performance. It is also available for immediate download and adjustment. So, changes can be made in the color, design, graphics or any other component to create a unique layout.
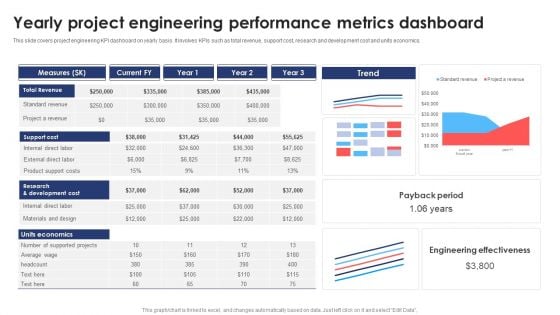
Yearly Project Engineering Performance Metrics Dashboard Information PDF
This slide covers project engineering KPI dashboard on yearly basis. It involves KPIs such as total revenue, support cost, research and development cost and units economics. Pitch your topic with ease and precision using this Yearly Project Engineering Performance Metrics Dashboard Information PDF. This layout presents information on Support Cost, Revenue, Measures. It is also available for immediate download and adjustment. So, changes can be made in the color, design, graphics or any other component to create a unique layout.
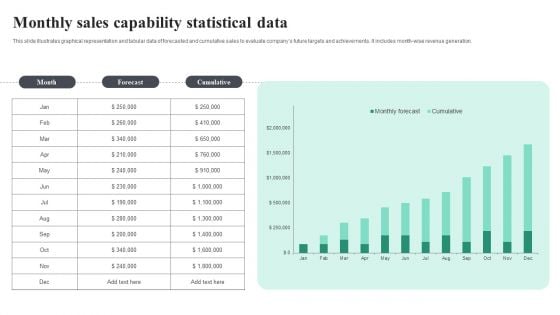
Monthly Sales Capability Statistical Data Background PDF
This slide illustrates graphical representation and tabular data of forecasted and cumulative sales to evaluate companys future targets and achievements. It includes month wise revenue generation. Pitch your topic with ease and precision using this Monthly Sales Capability Statistical Data Background PDF. This layout presents information on Monthly Sales, Capability Statistical Data. It is also available for immediate download and adjustment. So, changes can be made in the color, design, graphics or any other component to create a unique layout.

Quarterly Comparison Of Security For Cloud Based Systems Threats Infographics PDF
This slide shows the various types of cloud security threats occurred during four quarters. It includes phishing, malware, IoT and password attacks. Pitch your topic with ease and precision using this Quarterly Comparison Of Security For Cloud Based Systems Threats Infographics PDF. This layout presents information on Quarterly Comparison Of Security, Cloud Based Systems Threats. It is also available for immediate download and adjustment. So, changes can be made in the color, design, graphics or any other component to create a unique layout.
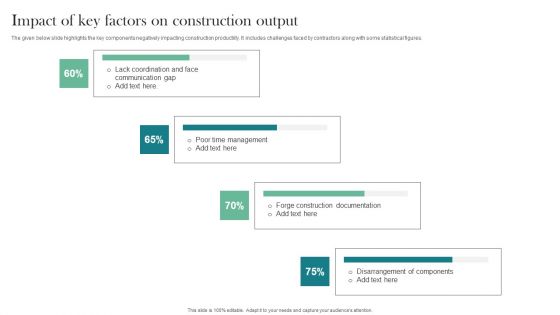
Impact Of Key Factors On Construction Output Download PDF
The given below slide highlights the key components negatively impacting construction productiity. It includes challenges faced by contractors along with some statistical figures. Showcasing this set of slides titled Impact Of Key Factors On Construction Output Download PDF. The topics addressed in these templates are Introduce Right Technology, Source Of Data, Integrate Team. All the content presented in this PPT design is completely editable. Download it and make adjustments in color, background, font etc. as per your unique business setting.
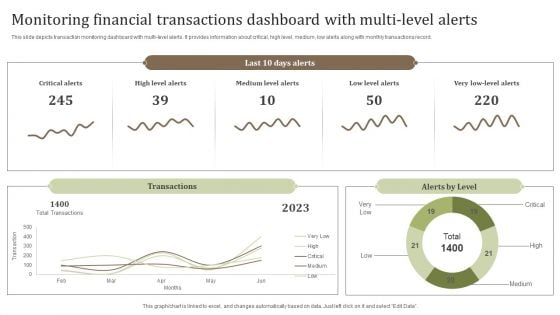
Monitoring Financial Transactions Dashboard With Multi Level Alerts Background PDF
This slide depicts transaction monitoring dashboard with multi-level alerts. It provides information about critical, high level, medium, low alerts along with monthly transactions record. Pitch your topic with ease and precision using this Monitoring Financial Transactions Dashboard With Multi Level Alerts Background PDF. This layout presents information on Critical Alerts, Medium Level Alerts, Total Transactions. It is also available for immediate download and adjustment. So, changes can be made in the color, design, graphics or any other component to create a unique layout.
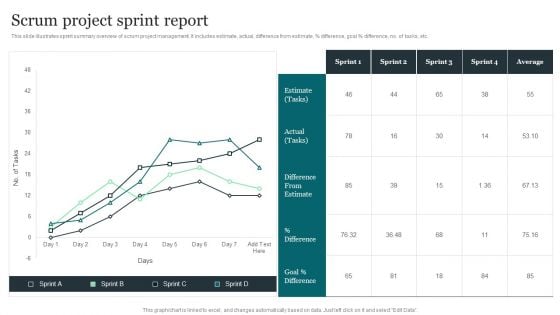
Scrum Project Sprint Report Guidelines PDF
This slide illustrates sprint summary overview of scrum project management. It includes estimate, actual, difference from estimate, percent difference, goal percent difference, no. of tasks, etc. Pitch your topic with ease and precision using this Scrum Project Sprint Report Guidelines PDF. This layout presents information on Scrum Project, Sprint Report. It is also available for immediate download and adjustment. So, changes can be made in the color, design, graphics or any other component to create a unique layout.
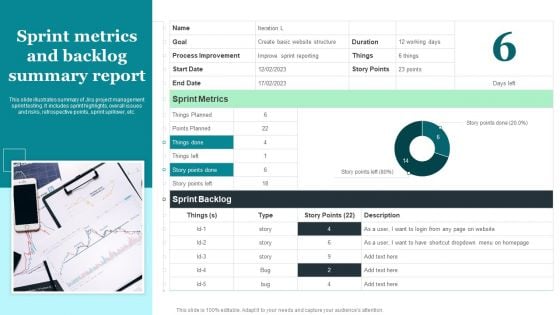
Sprint Metrics And Backlog Summary Report Brochure PDF
This slide illustrates summary of Jira project management sprint testing. It includes sprint highlights, overall issues and risks, retrospective points, sprint spillover, etc. Pitch your topic with ease and precision using this Sprint Metrics And Backlog Summary Report Brochure PDF. This layout presents information on Sprint Metrics And Backlog, Summary Report. It is also available for immediate download and adjustment. So, changes can be made in the color, design, graphics or any other component to create a unique layout.
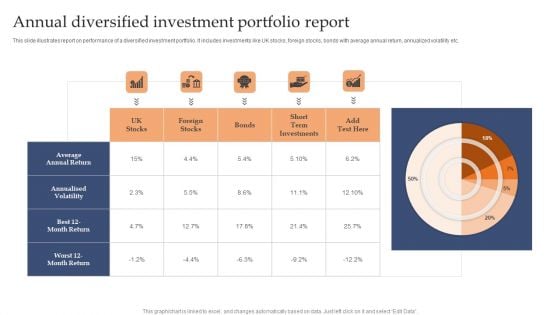
Annual Diversified Investment Portfolio Report Introduction PDF
This slide illustrates report on performance of a diversified investment portfolio. It includes investments like UK stocks, foreign stocks, bonds with average annual return, annualized volatility etc.Pitch your topic with ease and precision using this Annual Diversified Investment Portfolio Report Introduction PDF. This layout presents information on Foreign Stocks, Month Return, Term Investments. It is also available for immediate download and adjustment. So, changes can be made in the color, design, graphics or any other component to create a unique layout.
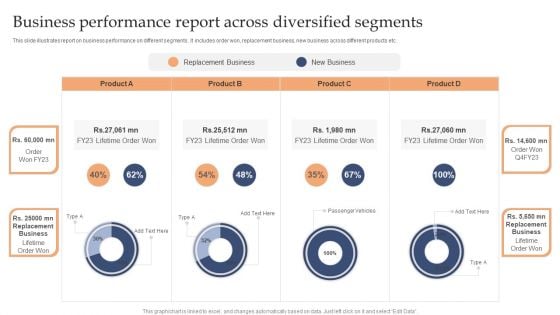
Business Performance Report Across Diversified Segments Microsoft PDF
This slide illustrates report on business performance on different segments . It includes order won, replacement business, new business across different products etc.Pitch your topic with ease and precision using this Business Performance Report Across Diversified Segments Microsoft PDF. This layout presents information on Replacement Business, New Business, Replacement Business. It is also available for immediate download and adjustment. So, changes can be made in the color, design, graphics or any other component to create a unique layout.
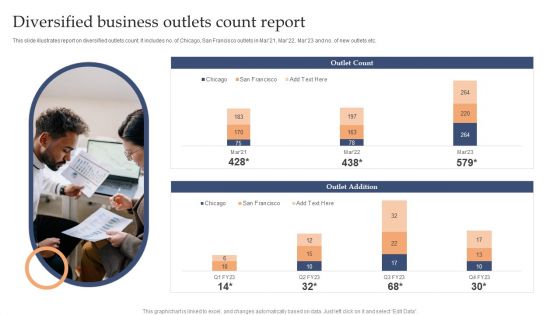
Diversified Business Outlets Count Report Background PDF
This slide illustrates report on diversified outlets count. It includes no. of Chicago, San Francisco outlets in Mar21, Mar22, Mar23 and no. of new outlets etc.Pitch your topic with ease and precision using this Diversified Business Outlets Count Report Background PDF. This layout presents information on Outlet Count, Outlet Addition, Chicago. It is also available for immediate download and adjustment. So, changes can be made in the color, design, graphics or any other component to create a unique layout.
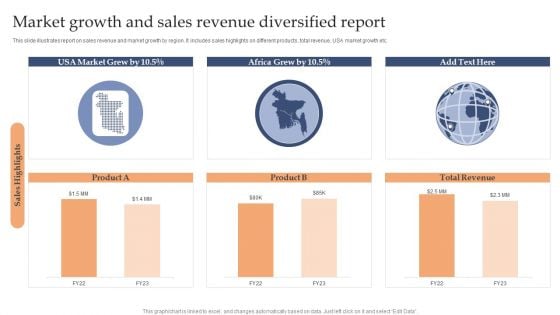
Market Growth And Sales Revenue Diversified Report Sample PDF
This slide illustrates report on sales revenue and market growth by region. It includes sales highlights on different products, total revenue, USA market growth etc.Pitch your topic with ease and precision using this Market Growth And Sales Revenue Diversified Report Sample PDF. This layout presents information on Market Grew, Africa Grew, Total Revenue. It is also available for immediate download and adjustment. So, changes can be made in the color, design, graphics or any other component to create a unique layout.
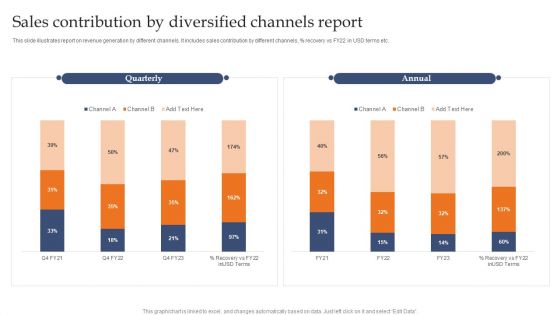
Sales Contribution By Diversified Channels Report Demonstration PDF
This slide illustrates report on revenue generation by different channels. It includes sales contribution by different channels, precent recovery vs FY22 in USD terms etc.Pitch your topic with ease and precision using this Sales Contribution By Diversified Channels Report Demonstration PDF. This layout presents information on Quarterly, Annual, Channel. It is also available for immediate download and adjustment. So, changes can be made in the color, design, graphics or any other component to create a unique layout.
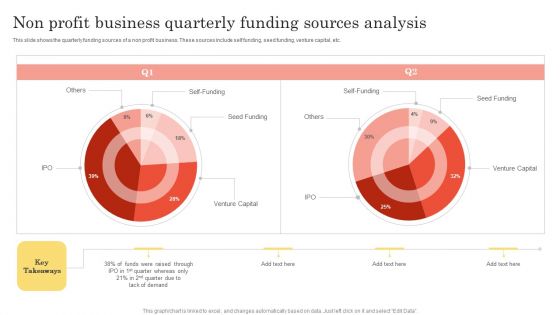
Non Profit Business Quarterly Funding Sources Analysis Infographics PDF
This slide shows the quarterly funding sources of a non profit business. These sources include self funding, seed funding, venture capital, etc. Pitch your topic with ease and precision using this Non Profit Business Quarterly Funding Sources Analysis Infographics PDF. This layout presents information on Venture Capital, Seed Funding, Quarter Whereas. It is also available for immediate download and adjustment. So, changes can be made in the color, design, graphics or any other component to create a unique layout.
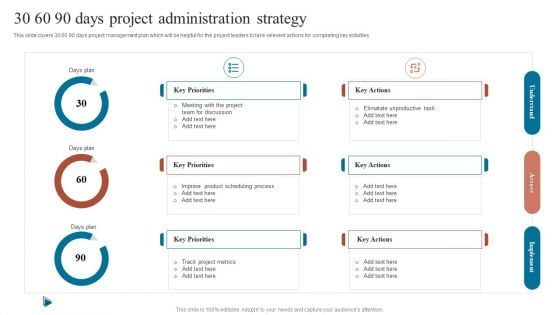
30 60 90 Days Project Administration Strategy Infographics PDF
This slide covers 30 60 90 days project management plan which will be helpful for the project leaders to take relevent actions for completing key activities.Pitch your topic with ease and precision using this 30 60 90 Days Project Administration Strategy Infographics PDF. This layout presents information on Team Discussion, Improve Product, Scheduling Process. It is also available for immediate download and adjustment. So, changes can be made in the color, design, graphics or any other component to create a unique layout.
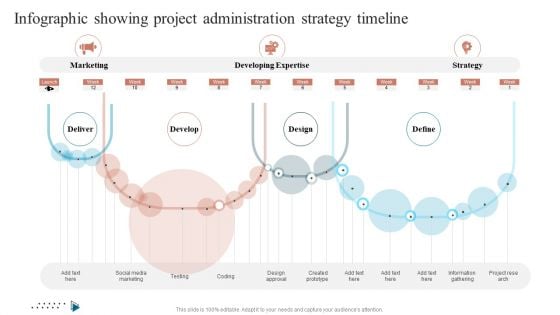
Infographic Showing Project Administration Strategy Timeline Background PDF
This slide covers a dashboard which includes 4 steps in IT process. It also includes project budget, workload, upcoming deadlines and overdue tasks.Pitch your topic with ease and precision using this Infographic Showing Project Administration Strategy Timeline Background PDF. This layout presents information on Developing Expertise, Design Approval, Created Prototype . It is also available for immediate download and adjustment. So, changes can be made in the color, design, graphics or any other component to create a unique layout.
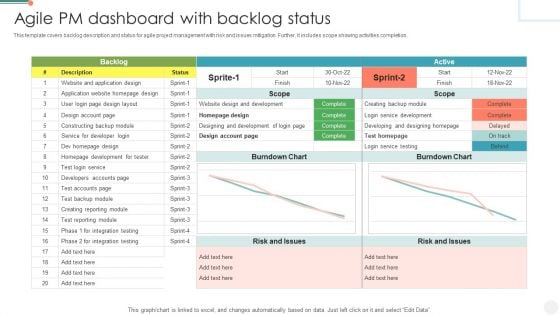
Agile PM Dashboard With Backlog Status Summary PDF
This template covers backlog description and status for agile project management with risk and issues mitigation. Further, it includes scope showing activities completion. Pitch your topic with ease and precision using this Agile PM Dashboard With Backlog Status Summary PDF. This layout presents information on Service For Developer Login, Risk And Issues, Service Development. It is also available for immediate download and adjustment. So, changes can be made in the color, design, graphics or any other component to create a unique layout.
Project Tracking Dashboard With Multiple Metrics Pictures PDF
The following slide highlights the KPI of project management to avoid deviations. It includes elements such as schedule, tasks, issue assessment, budget and risk analysis etc. Pitch your topic with ease and precision using this Project Tracking Dashboard With Multiple Metrics Pictures PDF. This layout presents information on Projected Budget Analysis, Risk Analysis, Quality Affirmation. It is also available for immediate download and adjustment. So, changes can be made in the color, design, graphics or any other component to create a unique layout.
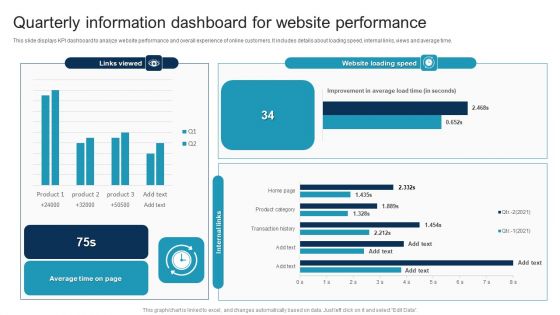
Quarterly Information Dashboard For Website Performance Portrait PDF
This slide displays KPI dashboard to analyze website performance and overall experience of online customers. It includes details about loading speed, internal links, views and average time. Pitch your topic with ease and precision using this Quarterly Information Dashboard For Website Performance Portrait PDF. This layout presents information on Quarterly Information, Dashboard For Website Performance. It is also available for immediate download and adjustment. So, changes can be made in the color, design, graphics or any other component to create a unique layout.
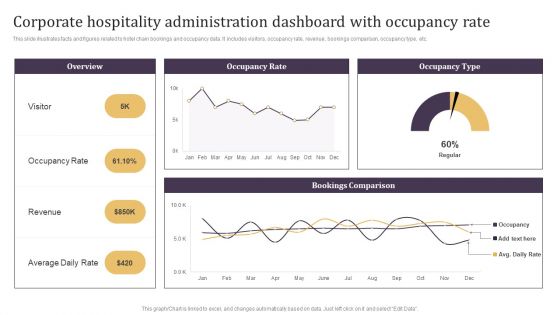
Corporate Hospitality Administration Dashboard With Occupancy Rate Guidelines PDF
This slide illustrates facts and figures related to hotel chain bookings and occupancy data. It includes visitors, occupancy rate, revenue, bookings comparison, occupancy type, etc.Pitch your topic with ease and precision using this Corporate Hospitality Administration Dashboard With Occupancy Rate Guidelines PDF. This layout presents information on Occupancy Rate, Average Daily Rate, Bookings Comparison. It is also available for immediate download and adjustment. So, changes can be made in the color, design, graphics or any other component to create a unique layout.
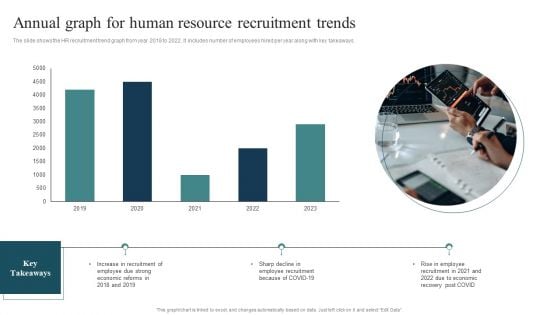
Annual Graph For Human Resource Recruitment Trends Summary PDF
The slide shows the HR recruitment trend graph from year 2018 to 2022. It includes number of employees hired per year along with key takeaways. Pitch your topic with ease and precision using this Annual Graph For Human Resource Recruitment Trends Summary PDF. This layout presents information on Employee Recruitment, Rise Employee, Economic Reforms. It is also available for immediate download and adjustment. So, changes can be made in the color, design, graphics or any other component to create a unique layout.
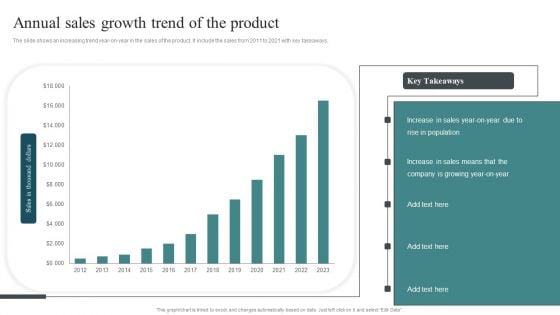
Annual Sales Growth Trend Of The Product Summary PDF
The slide shows an increasing trend year-on-year in the sales of the product. It include the sales from 2011 to 2021 with key takeaways.Pitch your topic with ease and precision using this Annual Sales Growth Trend Of The Product Summary PDF. This layout presents information on Increase Sales, Company Growing, Rise Population. It is also available for immediate download and adjustment. So, changes can be made in the color, design, graphics or any other component to create a unique layout.
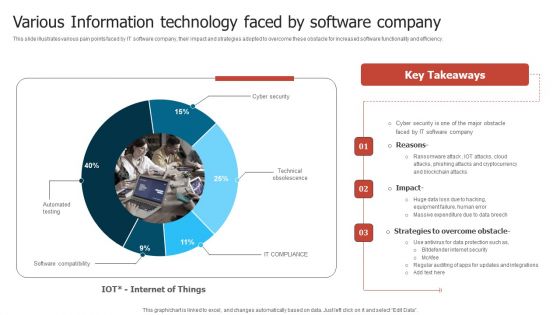
Various Information Technology Faced By Software Company Slides PDF
This slide illustrates various pain points faced by IT software company, their impact and strategies adopted to overcome these obstacle for increased software functionality and efficiency. Pitch your topic with ease and precision using this Various Information Technology Faced By Software Company Slides PDF. This layout presents information on Software Company, Phishing Attacks, Massive Expenditure. It is also available for immediate download and adjustment. So, changes can be made in the color, design, graphics or any other component to create a unique layout.
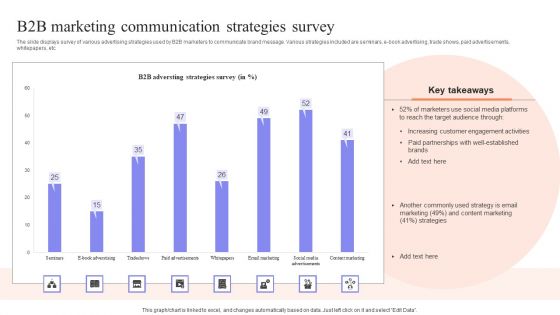
B2b Marketing Communication Strategies Survey Introduction PDF
The slide displays survey of various advertising strategies used by B2B marketers to communicate brand message. Various strategies included are seminars, e-book advertising, trade shows, paid advertisements, whitepapers, etc.Pitch your topic with ease and precision using this B2b Marketing Communication Strategies Survey Introduction PDF. This layout presents information on Increasing Customer, Engagement Activities, Adversting Strategies. It is also available for immediate download and adjustment. So, changes can be made in the color, design, graphics or any other component to create a unique layout.
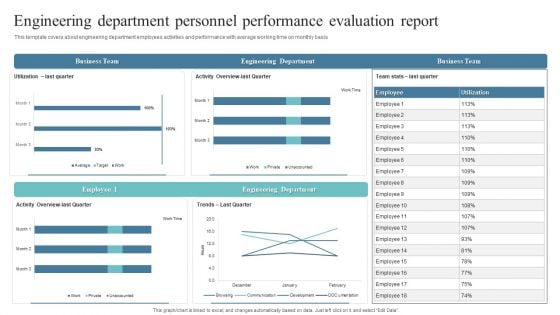
Engineering Department Personnel Performance Evaluation Report Formats PDF
This template covers about engineering department employees activities and performance with average working time on monthly basis. Pitch your topic with ease and precision using this Engineering Department Personnel Performance Evaluation Report Formats PDF. This layout presents information on Business Team, Engineering Department, Business Team. It is also available for immediate download and adjustment. So, changes can be made in the color, design, graphics or any other component to create a unique layout.

Personnel Performance Evaluation Report With Overall Labor Effectiveness Guidelines PDF
This template covers about employee performance report with absenteeism rate of workforce on yearly basis and department wise details.Pitch your topic with ease and precision using this Personnel Performance Evaluation Report With Overall Labor Effectiveness Guidelines PDF. This layout presents information on Average Absenteeism, Absenteeism Rate, Overall Labor Effectiveness. It is also available for immediate download and adjustment. So, changes can be made in the color, design, graphics or any other component to create a unique layout.
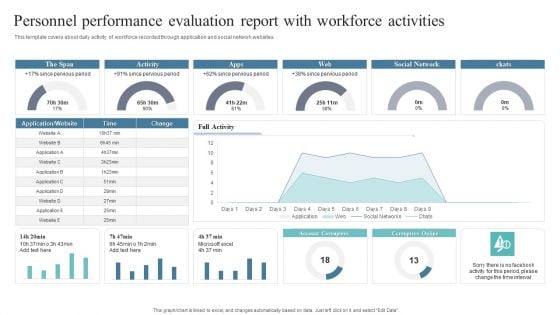
Personnel Performance Evaluation Report With Workforce Activities Designs PDF
This template covers about daily activity of workforce recorded through application and social network websites. Pitch your topic with ease and precision using this Personnel Performance Evaluation Report With Workforce Activities Designs PDF. This layout presents information on Pervious Period, Social Network, Account Corrupters. It is also available for immediate download and adjustment. So, changes can be made in the color, design, graphics or any other component to create a unique layout.
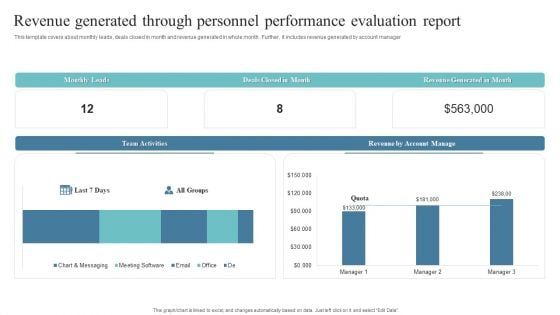
Revenue Generated Through Personnel Performance Evaluation Report Mockup PDF
This template covers about monthly leads, deals closed in month and revenue generated in whole month . Further, it includes revenue generated by account manager.Pitch your topic with ease and precision using this Revenue Generated Through Personnel Performance Evaluation Report Mockup PDF. This layout presents information on Monthly Lead, Team Activities, Account Manage. It is also available for immediate download and adjustment. So, changes can be made in the color, design, graphics or any other component to create a unique layout.
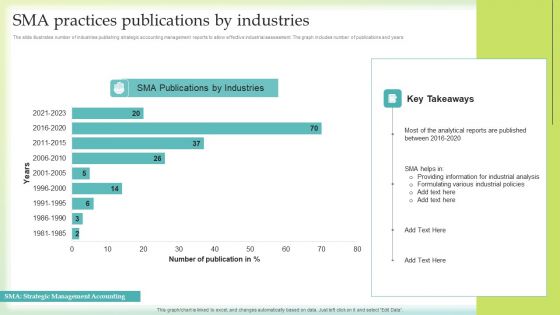
SMA Practices Publications By Industries Microsoft PDF
The slide illustrates number of industries publishing strategic accounting management reports to allow effective industrial assessment. The graph includes number of publications and years . Pitch your topic with ease and precision using this SMA Practices Publications By Industries Microsoft PDF. This layout presents information on Providing Information, Industrial Analysis, Publications Industries. It is also available for immediate download and adjustment. So, changes can be made in the color, design, graphics or any other component to create a unique layout.
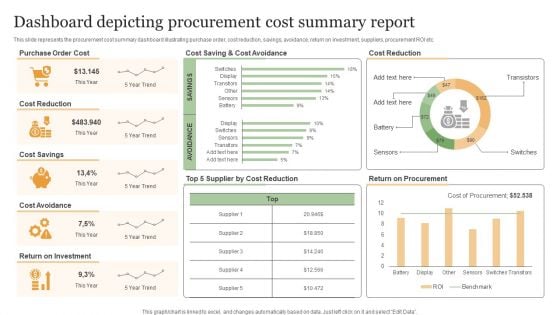
Dashboard Depicting Procurement Cost Summary Report Microsoft PDF
This slide represents the procurement cost summary dashboard illustrating purchase order, cost reduction, savings, avoidance, return on investment, suppliers, procurement ROI etc. Pitch your topic with ease and precision using this Dashboard Depicting Procurement Cost Summary Report Microsoft PDF. This layout presents information on Purchase Order Cost, Cost Reduction, Cost Savings. It is also available for immediate download and adjustment. So, changes can be made in the color, design, graphics or any other component to create a unique layout.
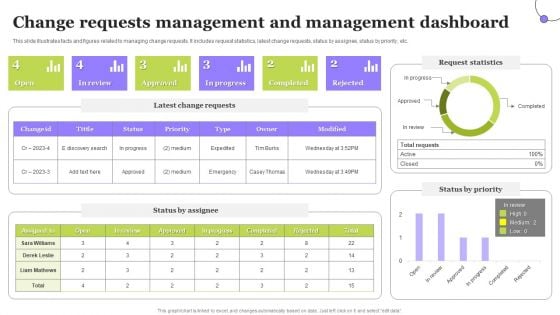
Change Requests Management And Management Dashboard Clipart PDF
This slide illustrates facts and figures related to managing change requests. It includes request statistics, latest change requests, status by assignee, status by priority, etc. Pitch your topic with ease and precision using this Change Requests Management And Management Dashboard Clipart PDF. This layout presents information on Status By Assignee, Status By Priority, Request Statistics. It is also available for immediate download and adjustment. So, changes can be made in the color, design, graphics or any other component to create a unique layout.
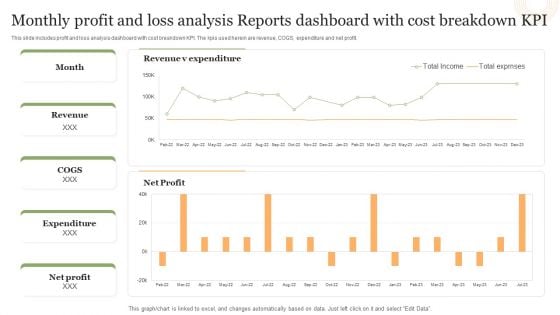
Monthly Profit And Loss Analysis Reports Dashboard With Cost Breakdown Kpi Structure PDF
This slide includes profit and loss analysis dashboard with cost breakdown KPI. The kpis used herein are revenue, COGS, expenditure and net profit.Pitch your topic with ease and precision using this Monthly Profit And Loss Analysis Reports Dashboard With Cost Breakdown Kpi Structure PDF. This layout presents information on Revenue Expenditure, Net Profit, Total Exprnses. It is also available for immediate download and adjustment. So, changes can be made in the color, design, graphics or any other component to create a unique layout.

Monthly Profit And Loss Statement Reports Analysis Dashboard Brochure PDF
This slide shows a monthly profit and loss statement dashboard. The constituting elements herein are total net revenue, cost of goods sold and gross profit.Pitch your topic with ease and precision using this Monthly Profit And Loss Statement Reports Analysis Dashboard Brochure PDF. This layout presents information on Costs Good Sold, Earnings Before, Interest Expense. It is also available for immediate download and adjustment. So, changes can be made in the color, design, graphics or any other component to create a unique layout.
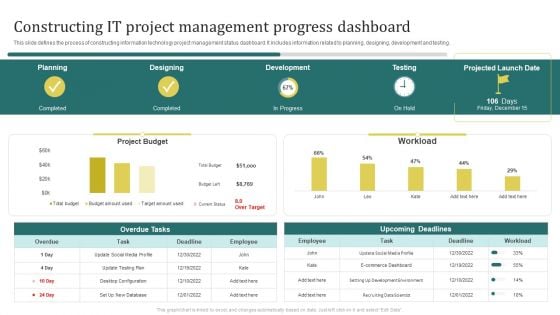
Constructing It Project Management Progress Dashboard Brochure PDF
This slide defines the process of constructing information technology project management status dashboard. It includes information related to planning, designing, development and testing.Pitch your topic with ease and precision using this Constructing It Project Management Progress Dashboard Brochure PDF. This layout presents information on E Commerce Dashboard, Development Environment, Recruiting Data Scientist. It is also available for immediate download and adjustment. So, changes can be made in the color, design, graphics or any other component to create a unique layout.
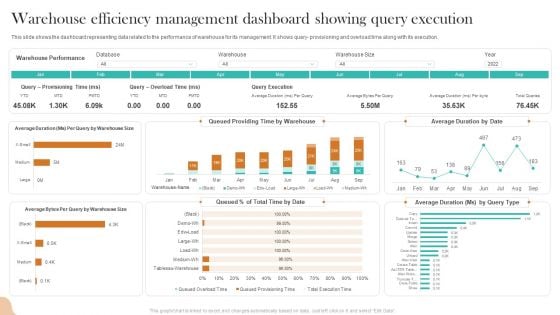
Warehouse Efficiency Management Dashboard Showing Query Execution Rules PDF
This slide shows the dashboard representing data related to the performance of warehouse for its management. It shows query- provisioning and overload time along with its execution. Pitch your topic with ease and precision using this Warehouse Efficiency Management Dashboard Showing Query Execution Rules PDF. This layout presents information on Warehouse Performance, Warehouse Size, Database. It is also available for immediate download and adjustment. So, changes can be made in the color, design, graphics or any other component to create a unique layout.
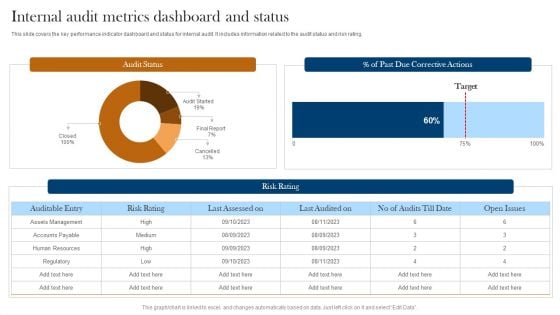
Internal Audit Metrics Dashboard And Status Ppt Layouts Graphic Images PDF
This slide covers the key performance indicator dashboard and status for internal audit. It includes information related to the audit status and risk rating. Pitch your topic with ease and precision using this Internal Audit Metrics Dashboard And Status Ppt Layouts Graphic Images PDF. This layout presents information on Audit Status, Risk Rating, Auditable Entry. It is also available for immediate download and adjustment. So, changes can be made in the color, design, graphics or any other component to create a unique layout.
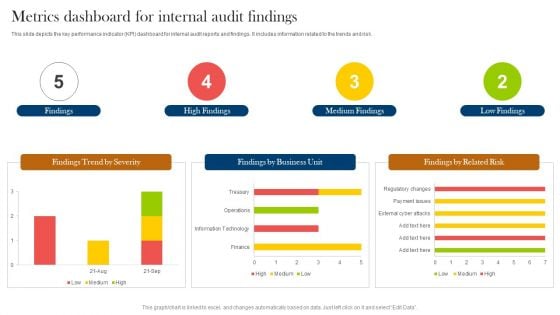
Metrics Dashboard For Internal Audit Findings Ppt Styles Gallery PDF
This slide depicts the key performance indicator KPI dashboard for internal audit reports and findings. It includes information related to the trends and risk. Pitch your topic with ease and precision using this Metrics Dashboard For Internal Audit Findings Ppt Styles Gallery PDF. This layout presents information on Findings, High Findings, Medium Findings, Low Findings. It is also available for immediate download and adjustment. So, changes can be made in the color, design, graphics or any other component to create a unique layout.
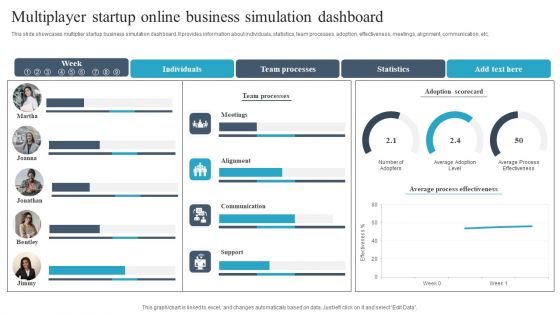
Multiplayer Startup Online Business Simulation Dashboard Demonstration PDF
This slide showcases multiplier startup business simulation dashboard. It provides information about individuals, statistics, team processes, adoption, effectiveness, meetings, alignment, communication, etc. Pitch your topic with ease and precision using this Multiplayer Startup Online Business Simulation Dashboard Demonstration PDF. This layout presents information on Individuals, Team Processes, Statistics. It is also available for immediate download and adjustment. So, changes can be made in the color, design, graphics or any other component to create a unique layout.
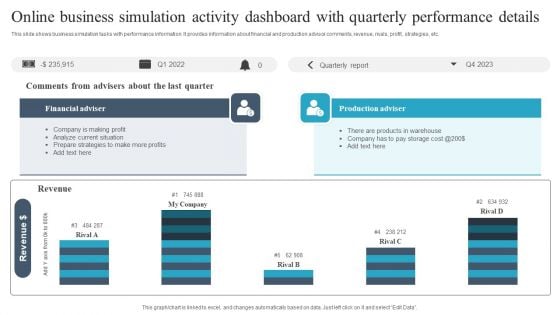
Online Business Simulation Activity Dashboard With Quarterly Performance Details Guidelines PDF
This slide shows business simulation tasks with performance information. It provides information about financial and production advisor comments, revenue, rivals, profit, strategies, etc. Pitch your topic with ease and precision using this Online Business Simulation Activity Dashboard With Quarterly Performance Details Guidelines PDF. This layout presents information on Financial Adviser, Production Adviser, Revenue. It is also available for immediate download and adjustment. So, changes can be made in the color, design, graphics or any other component to create a unique layout.

Weekly Sales Performance KPI Dashboard For Revenue Generation Brochure PDF
The following slide exhibits dashboard to maintain revenue and management under control. It presents information related to profits, cross selling, costs, etc. Pitch your topic with ease and precision using this Weekly Sales Performance KPI Dashboard For Revenue Generation Brochure PDF. This layout presents information on Total Sales, Revenue, Profit, Cost. It is also available for immediate download and adjustment. So, changes can be made in the color, design, graphics or any other component to create a unique layout.
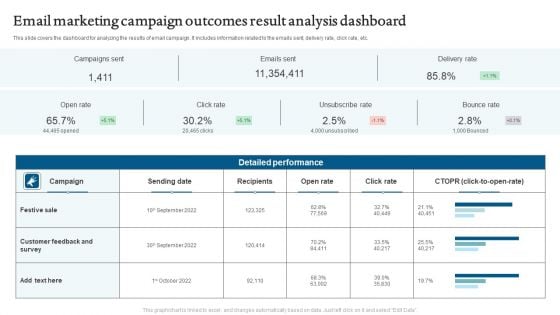
Email Marketing Campaign Outcomes Result Analysis Dashboard Mockup PDF
This slide covers the dashboard for analyzing the email campaign metrics. It includes information related to engagement a key performance indicator KPIs. Pitch your topic with ease and precision using this Email Marketing Campaign Outcomes Result Analysis Dashboard Mockup PDF. This layout presents information on Campaigns Sent, Emails Sent, Delivery Rate. It is also available for immediate download and adjustment. So, changes can be made in the color, design, graphics or any other component to create a unique layout.
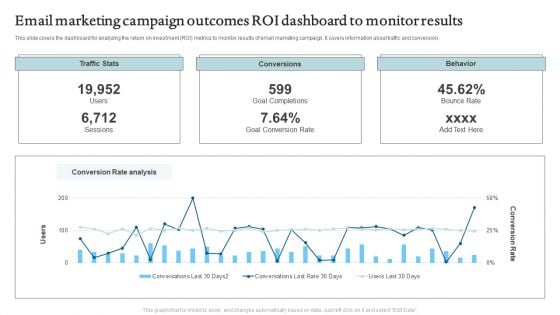
Email Marketing Campaign Outcomes ROI Dashboard To Monitor Results Formats PDF
This slide depicts the dashboard for analyzing the marketing results and campaign performance. It includes information related email sent, delivered, conversions, etc. Pitch your topic with ease and precision using this Email Marketing Campaign Outcomes ROI Dashboard To Monitor Results Formats PDF. This layout presents information on Traffic Stats, Conversions, Behavior. It is also available for immediate download and adjustment. So, changes can be made in the color, design, graphics or any other component to create a unique layout.
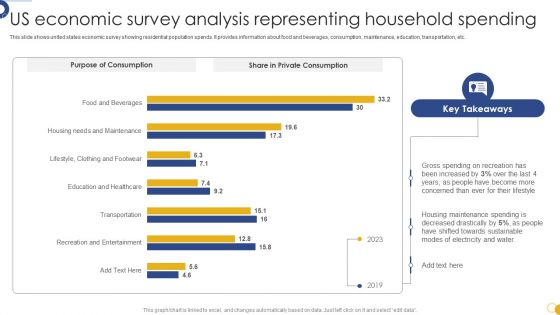
US Economic Survey Analysis Representing Household Spending Slides PDF
This slide shows united states economic survey showing residential population spends. It provides information about food and beverages, consumption, maintenance, education, transportation, etc. Pitch your topic with ease and precision using this US Economic Survey Analysis Representing Household Spending Slides PDF. This layout presents information on US Economic Survey, Analysis Representing Household. It is also available for immediate download and adjustment. So, changes can be made in the color, design, graphics or any other component to create a unique layout.
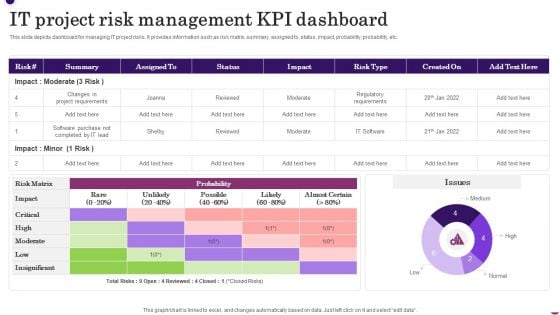
IT Project Risk Management KPI Dashboard Clipart PDF
This slide depicts dashboard for managing IT project risks. It provides information such as risk matrix, summary, assigned to, status, impact, probability, probability, etc. Pitch your topic with ease and precision using this IT Project Risk Management KPI Dashboard Clipart PDF. This layout presents information on Regulatory Requirements, Changes In Project Requirements. It is also available for immediate download and adjustment. So, changes can be made in the color, design, graphics or any other component to create a unique layout.
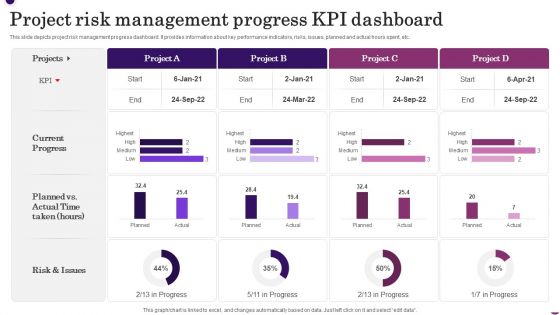
Project Risk Management Progress KPI Dashboard Template PDF
This slide depicts project risk management progress dashboard. It provides information about key performance indicators, risks, issues, planned and actual hours spent, etc. Pitch your topic with ease and precision using this Project Risk Management Progress KPI Dashboard Template PDF. This layout presents information on Current Progress, Risk And Issues. It is also available for immediate download and adjustment. So, changes can be made in the color, design, graphics or any other component to create a unique layout.
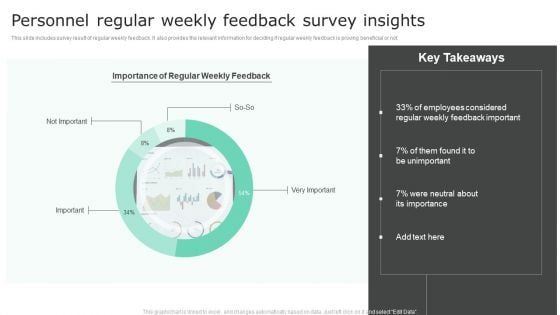
Personnel Regular Weekly Feedback Survey Insights Structure PDF
This slide includes survey result of regular weekly feedback. It also provides the relevant information for deciding if regular weekly feedback is proving beneficial or not. Pitch your topic with ease and precision using this Personnel Regular Weekly Feedback Survey Insights Structure PDF. This layout presents information on Feedback Important, Survey Insights. It is also available for immediate download and adjustment. So, changes can be made in the color, design, graphics or any other component to create a unique layout.
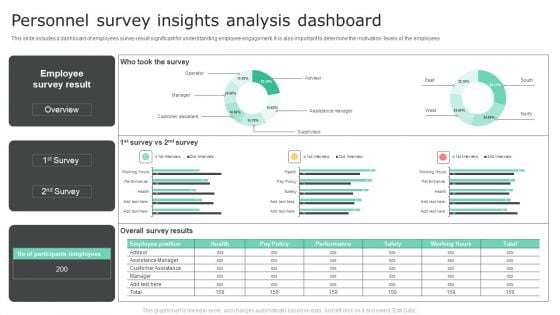
Personnel Survey Insights Analysis Dashboard Inspiration PDF
This slide includes a dashboard of employees survey result significant for understanding employee engagement. It is also important to determine the motivation levels of the employees. Pitch your topic with ease and precision using this Personnel Survey Insights Analysis Dashboard Inspiration PDF. This layout presents information on Employee Survey Result, Overall Survey Results. It is also available for immediate download and adjustment. So, changes can be made in the color, design, graphics or any other component to create a unique layout.
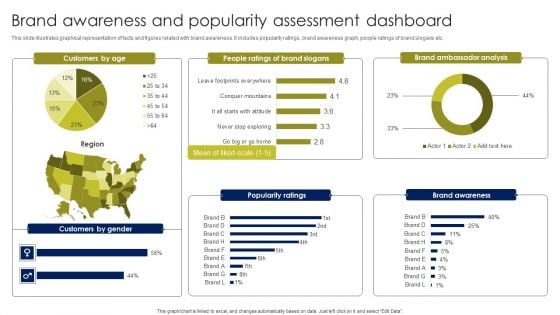
Brand Awareness And Popularity Assessment Dashboard Topics PDF
This slide illustrates graphical representation of facts and figures related with brand awareness. It includes popularity ratings, brand awareness graph, people ratings of brand slogans etc. Pitch your topic with ease and precision using thisBrand Awareness And Popularity Assessment Dashboard Topics PDF. This layout presents information on Customers By Age, Brand Ambassador Analysis, Brand Awareness. It is also available for immediate download and adjustment. So, changes can be made in the color, design, graphics or any other component to create a unique layout.
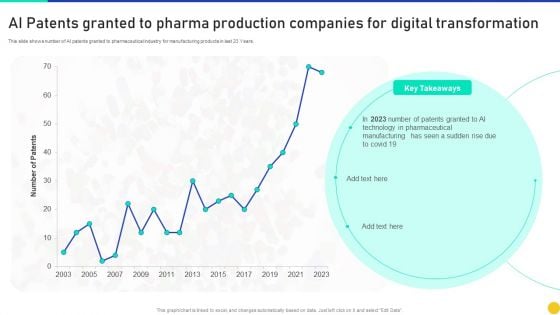
AI Patents Granted To Pharma Production Companies For Digital Transformation Download PDF
This slide shows number of AI patents granted to pharmaceutical industry for manufacturing products in last 23 Years. Pitch your topic with ease and precision using this AI Patents Granted To Pharma Production Companies For Digital Transformation Download PDF. This layout presents information on Patents Granted Pharma, Production Companies, Digital Transformation. It is also available for immediate download and adjustment. So, changes can be made in the color, design, graphics or any other component to create a unique layout.
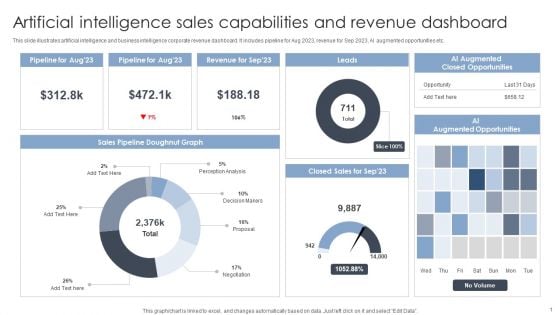
Artificial Intelligence Sales Capabilities And Revenue Dashboard Portrait PDF
This slide illustrates artificial intelligence and business intelligence corporate revenue dashboard. It includes pipeline for Aug 2023, revenue for Sep 2023, AI augmented opportunities etc. Pitch your topic with ease and precision using this Artificial Intelligence Sales Capabilities And Revenue Dashboard Portrait PDF. This layout presents information on Sales Capabilities, Revenue Dashboard. It is also available for immediate download and adjustment. So, changes can be made in the color, design, graphics or any other component to create a unique layout.
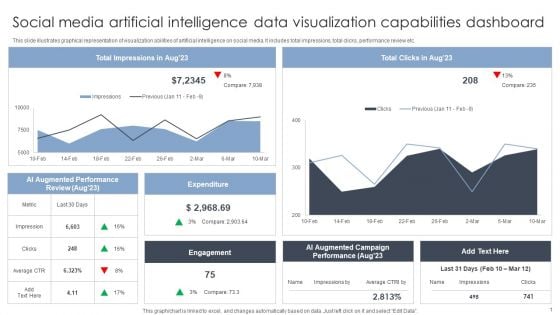
Social Media Artificial Intelligence Data Visualization Capabilities Dashboard Inspiration PDF
This slide illustrates graphical representation of visualization abilities of artificial intelligence on social media. It includes total impressions, total clicks, performance review etc. Pitch your topic with ease and precision using this Social Media Artificial Intelligence Data Visualization Capabilities Dashboard Inspiration PDF. This layout presents information on Artificial Intelligence, Data Visualization Capabilities. It is also available for immediate download and adjustment. So, changes can be made in the color, design, graphics or any other component to create a unique layout.
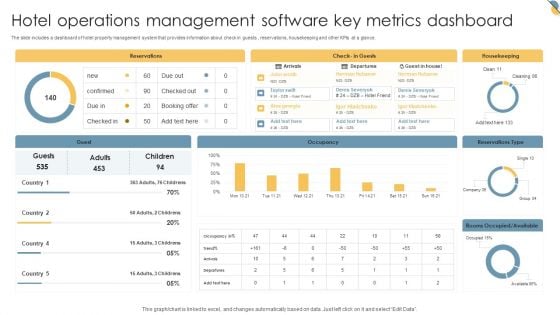
Hotel Operations Management Software Key Metrics Dashboard Inspiration PDF
The slide includes a dashboard of hotel property management system that provides information about check in guests , reservations, housekeeping and other KPIs at a glance. Pitch your topic with ease and precision using this Hotel Operations Management Software Key Metrics Dashboard Inspiration PDF. This layout presents information on Reservations, Housekeeping, Occupancy. It is also available for immediate download and adjustment. So, changes can be made in the color, design, graphics or any other component to create a unique layout.
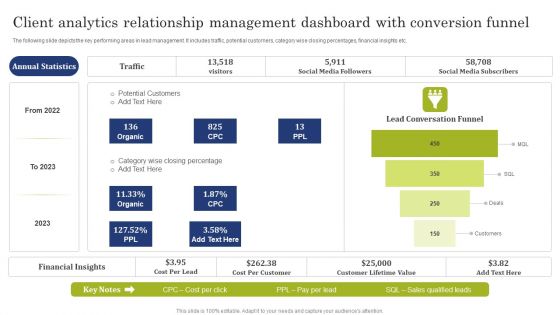
Client Analytics Relationship Management Dashboard With Conversion Funnel Demonstration PDF
The following slide depicts the key performing areas in lead management. It includes traffic, potential customers, category wise closing percentages, financial insights etc. Pitch your topic with ease and precision using this Client Analytics Relationship Management Dashboard With Conversion Funnel Demonstration PDF. This layout presents information on Potential Customers, Social Media Followers, Social Media Subscribers. It is also available for immediate download and adjustment. So, changes can be made in the color, design, graphics or any other component to create a unique layout.
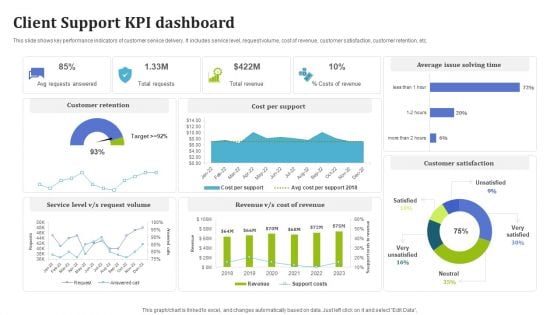
Client Support KPI Dashboard Rules PDF
This slide shows key performance indicators of customer service delivery. It includes service level, request volume, cost of revenue, customer satisfaction, customer retention, etc. Pitch your topic with ease and precision using this Client Support KPI Dashboard Rules PDF. This layout presents information on Customer Retention, Cost Per Support, Average Issue Solving Time. It is also available for immediate download and adjustment. So, changes can be made in the color, design, graphics or any other component to create a unique layout.
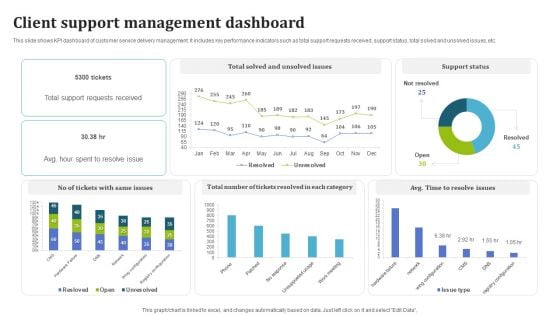
Client Support Management Dashboard Designs PDF
This slide shows KPI dashboard of customer service delivery management. It includes key performance indicators such as total support requests received, support status, total solved and unsolved issues, etc. Pitch your topic with ease and precision using this Client Support Management Dashboard Designs PDF. This layout presents information on Client Support, Management Dashboard. It is also available for immediate download and adjustment. So, changes can be made in the color, design, graphics or any other component to create a unique layout.
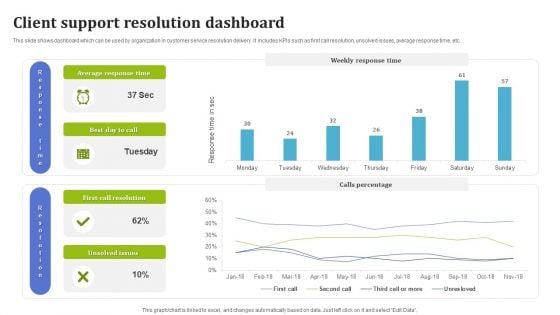
Client Support Resolution Dashboard Graphics PDF
This slide shows dashboard which can be used by organization in customer service resolution delivery. It includes KPIs such as first call resolution, unsolved issues, average response time, etc. Pitch your topic with ease and precision using this Client Support Resolution Dashboard Graphics PDF. This layout presents information on Client Support, Resolution Dashboard. It is also available for immediate download and adjustment. So, changes can be made in the color, design, graphics or any other component to create a unique layout.
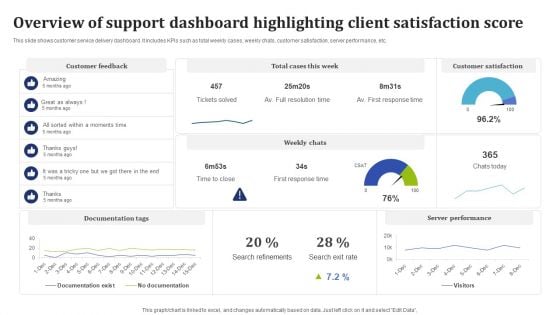
Overview Of Support Dashboard Highlighting Client Satisfaction Score Guidelines PDF
This slide shows customer service delivery dashboard. It includes KPIs such as total weekly cases, weekly chats, customer satisfaction, server performance, etc. Pitch your topic with ease and precision using this Overview Of Support Dashboard Highlighting Client Satisfaction Score Guidelines PDF. This layout presents information on Documentation Tags, Server Performance, Customer Satisfaction. It is also available for immediate download and adjustment. So, changes can be made in the color, design, graphics or any other component to create a unique layout.
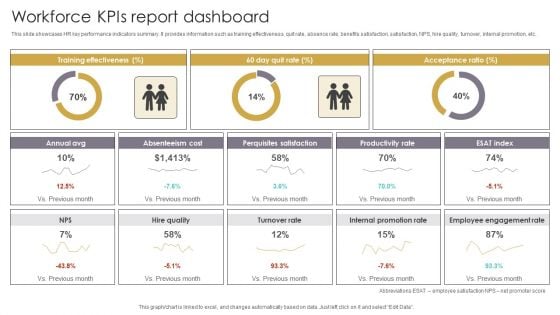
Workforce Kpis Report Dashboard Slides PDF
This slide showcases HR key performance indicators summary. It provides information such as training effectiveness, quit rate, absence rate, benefits satisfaction, satisfaction, NPS, hire quality, turnover, internal promotion, etc. Pitch your topic with ease and precision using this Workforce Kpis Report Dashboard Slides PDF. This layout presents information on Acceptance Ratio, Absenteeism Cost, Perquisites Satisfaction. It is also available for immediate download and adjustment. So, changes can be made in the color, design, graphics or any other component to create a unique layout.
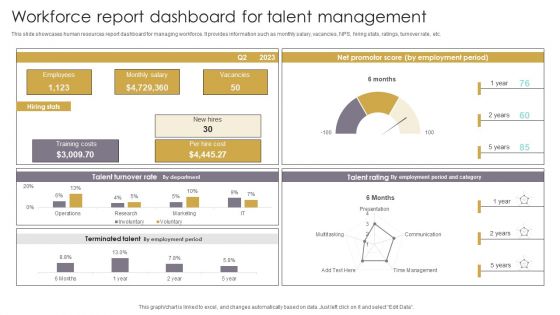
Workforce Report Dashboard For Talent Management Template PDF
This slide showcases human resources report dashboard for managing workforce. It provides information such as monthly salary, vacancies, NPS, hiring stats, ratings, turnover rate, etc. Pitch your topic with ease and precision using this Workforce Report Dashboard For Talent Management Template PDF. This layout presents information on Employees, Training Costs, Talent Turnover Rate. It is also available for immediate download and adjustment. So, changes can be made in the color, design, graphics or any other component to create a unique layout.
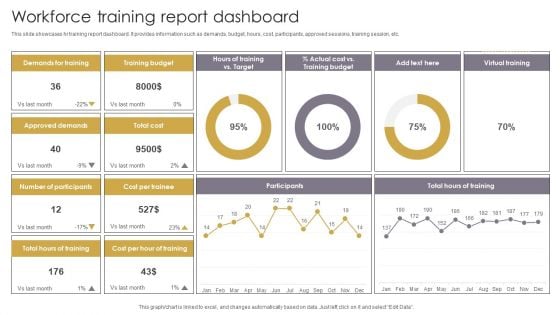
Workforce Training Report Dashboard Elements PDF
This slide showcases hr training report dashboard. It provides information such as demands, budget, hours, cost, participants, approved sessions, training session, etc. Pitch your topic with ease and precision using this Workforce Training Report Dashboard Elements PDF. This layout presents information on Training Budget, Demands For Training, Approved Demands. It is also available for immediate download and adjustment. So, changes can be made in the color, design, graphics or any other component to create a unique layout.
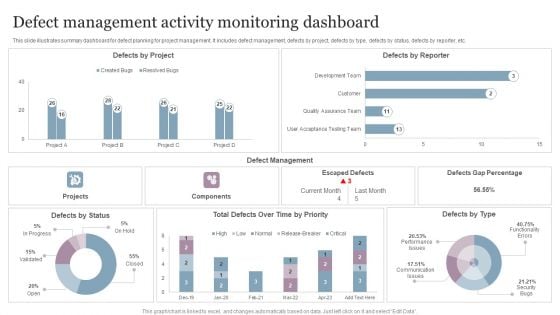
Defect Management Activity Monitoring Dashboard Information PDF
This slide illustrates summary dashboard for defect planning for project management. It includes defect management, defects by project, defects by type, defects by status, defects by reporter, etc. Pitch your topic with ease and precision using this Defect Management Activity Monitoring Dashboard Information PDF. This layout presents information on Defect Management, Activity Monitoring Dashboard. It is also available for immediate download and adjustment. So, changes can be made in the color, design, graphics or any other component to create a unique layout.
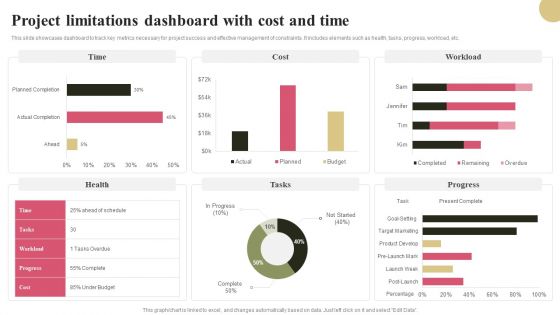
Project Limitations Dashboard With Cost And Time Graphics PDF
This slide showcases dashboard to track key metrics necessary for project success and effective management of constraints. It includes elements such as health, tasks, progress, workload, etc. Pitch your topic with ease and precision using this Project Limitations Dashboard With Cost And Time Graphics PDF. This layout presents information on Time, Workload, Tasks, Progress. It is also available for immediate download and adjustment. So, changes can be made in the color, design, graphics or any other component to create a unique layout.
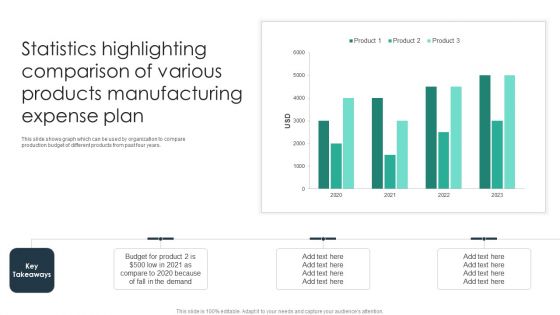
Statistics Highlighting Comparison Of Various Products Manufacturing Expense Plan Formats PDF
This slide shows graph which can be used by organization to compare production budget of different products from past four years. Pitch your topic with ease and precision using this Statistics Highlighting Comparison Of Various Products Manufacturing Expense Plan Formats PDF. This layout presents information on Budget For Product, Demand, Organization. It is also available for immediate download and adjustment. So, changes can be made in the color, design, graphics or any other component to create a unique layout.

KPI Dashboard Showcasing Product Management Guidelines PDF
This slide showcases dashboard providing product development team performance status with determined KPIs. It provides details such as product development team score, average result scores and result KPIs. Pitch your topic with ease and precision using this KPI Dashboard Showcasing Product Management Guidelines PDF. This layout presents information on Average Rating, Innovation, Design. It is also available for immediate download and adjustment. So, changes can be made in the color, design, graphics or any other component to create a unique layout.
Service Desk Tracker Sheet To Monitor Status Of Ticket Professional PDF
This slide showcases tracker sheet that includes ticket details. It includes ticket number, priority, description, reported date and responsible person. Pitch your topic with ease and precision using this Service Desk Tracker Sheet To Monitor Status Of Ticket Professional PDF. This layout presents information on Ticket Number, Description, Responsible Person. It is also available for immediate download and adjustment. So, changes can be made in the color, design, graphics or any other component to create a unique layout.
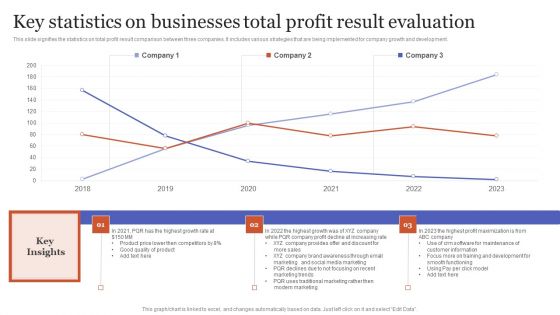
Key Statistics On Businesses Total Profit Result Evaluation Rules PDF
This slide signifies the statistics on total profit result comparison between three companies. It includes various strategies that are being implemented for company growth and development.Pitch your topic with ease and precision using this Key Statistics On Businesses Total Profit Result Evaluation Rules PDF. This layout presents information on Traditional Marketing, Modern Marketing, Training Development. It is also available for immediate download and adjustment. So, changes can be made in the color, design, graphics or any other component to create a unique layout.
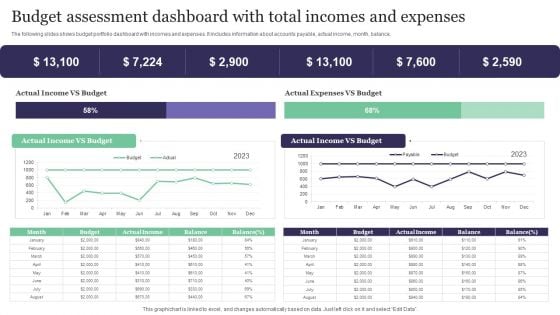
Budget Assessment Dashboard With Total Incomes And Expenses Information PDF
The following slides shows budget portfolio dashboard with incomes and expenses. It includes information about accounts payable, actual income, month, balance, Pitch your topic with ease and precision using this Budget Assessment Dashboard With Total Incomes And Expenses Information PDF. This layout presents information on Actual Income, Actual Expenses. It is also available for immediate download and adjustment. So, changes can be made in the color, design, graphics or any other component to create a unique layout.
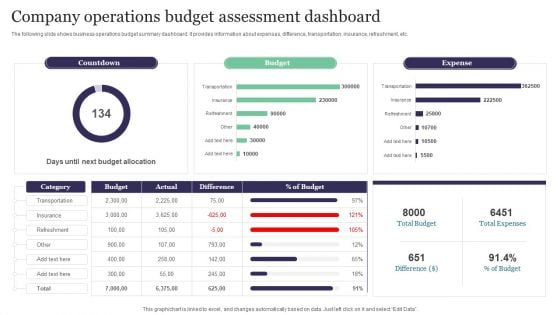
Company Operations Budget Assessment Dashboard Template PDF
The following slide shows business operations budget summary dashboard. It provides information about expenses, difference, transportation, insurance, refreshment, etc. Pitch your topic with ease and precision using this Company Operations Budget Assessment Dashboard Template PDF. This layout presents information on Countdown, Budget, Expense. It is also available for immediate download and adjustment. So, changes can be made in the color, design, graphics or any other component to create a unique layout.
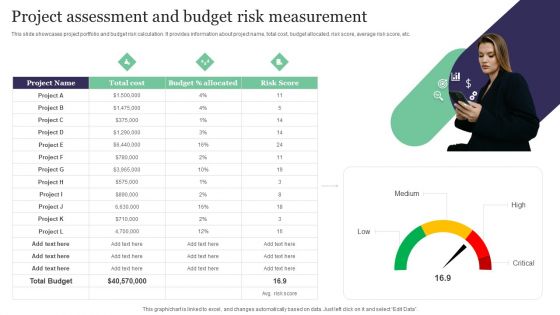
Project Assessment And Budget Risk Measurement Pictures PDF
This slide showcases project portfolio and budget risk calculation. It provides information about project name, total cost, budget allocated, risk score, average risk score, etc. Pitch your topic with ease and precision using this Project Assessment And Budget Risk Measurement Pictures PDF. This layout presents information on Project Assessment, Budget Risk, Measurement. It is also available for immediate download and adjustment. So, changes can be made in the color, design, graphics or any other component to create a unique layout.
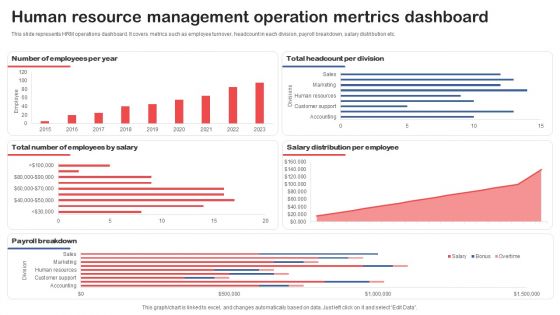
Human Resource Management Operation Mertrics Dashboard Background PDF
This slide represents HRM operations dashboard. It covers metrics such as employee turnover, headcount in each division, payroll breakdown, salary distribution etc. Pitch your topic with ease and precision using thisHuman Resource Management Operation Mertrics Dashboard Background PDF. This layout presents information on Number Of Employees, Headcount Per Division, Employees By Salary. It is also available for immediate download and adjustment. So, changes can be made in the color, design, graphics or any other component to create a unique layout.
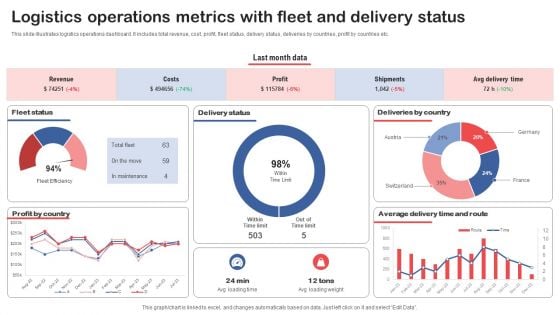
Logistics Operations Metrics With Fleet And Delivery Status Slides PDF
This slide illustrates logistics operations dashboard. It includes total revenue, cost, profit, fleet status, delivery status, deliveries by countries, profit by countries etc. Pitch your topic with ease and precision using this Logistics Operations Metrics With Fleet And Delivery Status Slides PDF. This layout presents information on Fleet Status, Delivery Status, Deliveries By Country. It is also available for immediate download and adjustment. So, changes can be made in the color, design, graphics or any other component to create a unique layout.
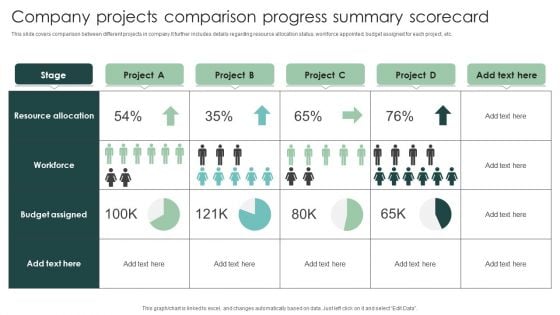
Company Projects Comparison Progress Summary Scorecard Portrait PDF
This slide covers comparison between different projects in company.It further includes details regarding resource allocation status, workforce appointed, budget assigned for each project, etc. Pitch your topic with ease and precision using this Company Projects Comparison Progress Summary Scorecard Portrait PDF. This layout presents information on Resource Allocation, Budget Assigned, Workforce. It is also available for immediate download and adjustment. So, changes can be made in the color, design, graphics or any other component to create a unique layout.
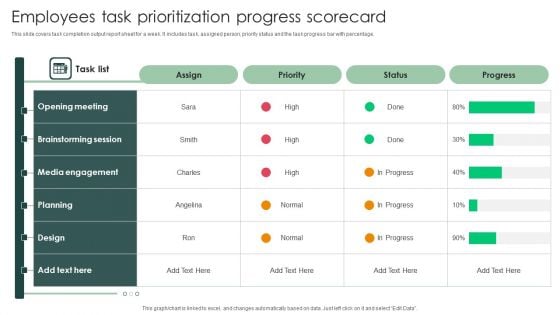
Employees Task Prioritization Progress Scorecard Download PDF
This slide covers task completion output report sheet for a week. It includes task, assigned person, priority status and the task progress bar with percentage.Pitch your topic with ease and precision using this Employees Task Prioritization Progress Scorecard Download PDF. This layout presents information on Communication Skills Development, Manager Training, Area Sales . It is also available for immediate download and adjustment. So, changes can be made in the color, design, graphics or any other component to create a unique layout.

HR Monthly Headcount Report Sample PDF
This slide represents the monthly headcount report of the human resources department of the organization. It includes details related to headcount, ARC by grade, leavers, joiners, promotions etc. Pitch your topic with ease and precision using this HR Monthly Headcount Report Sample PDF. This layout presents information on Global, Reduction, Cost. It is also available for immediate download and adjustment. So, changes can be made in the color, design, graphics or any other component to create a unique layout.
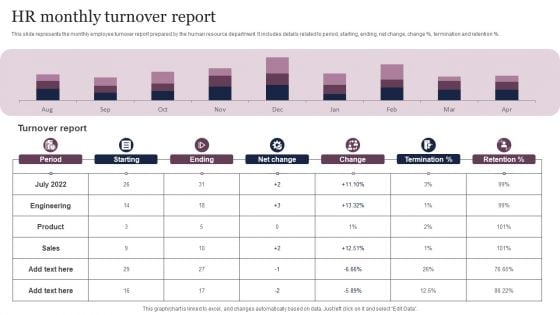
HR Monthly Turnover Report Template PDF
This slide represents the monthly employee turnover report prepared by the human resource department. It includes details related to period, starting, ending, net change, change percent, termination and retention percent. Pitch your topic with ease and precision using this HR Monthly Turnover Report Template PDF. This layout presents information on Product, Sales, Turnover Report. It is also available for immediate download and adjustment. So, changes can be made in the color, design, graphics or any other component to create a unique layout.
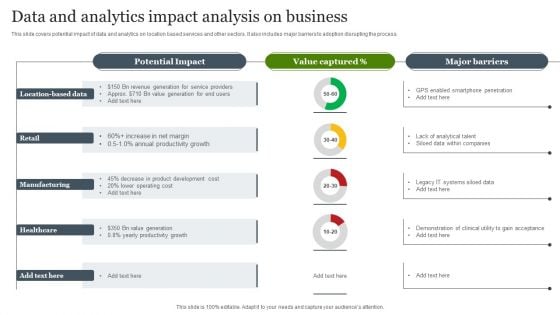
Data And Analytics Impact Analysis On Business Slides PDF
This slide covers potential impact of data and analytics on location based services and other sectors. It also includes major barriers to adoption disrupting the process. Pitch your topic with ease and precision using this Data And Analytics Impact Analysis On Business Slides PDF. This layout presents information on Retail, Manufacturing, Location Based Data. It is also available for immediate download and adjustment. So, changes can be made in the color, design, graphics or any other component to create a unique layout.
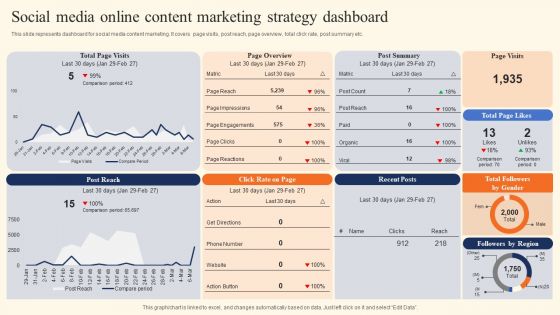
Social Media Online Content Marketing Strategy Dashboard Clipart PDF
This slide represents dashboard for social media content marketing. It covers page visits, post reach, page overview, total click rate, post summary etc. Pitch your topic with ease and precision using this Social Media Online Content Marketing Strategy Dashboard Clipart PDF. This layout presents information on Social Media, Online Content Marketing, Strategy Dashboard. It is also available for immediate download and adjustment. So, changes can be made in the color, design, graphics or any other component to create a unique layout.
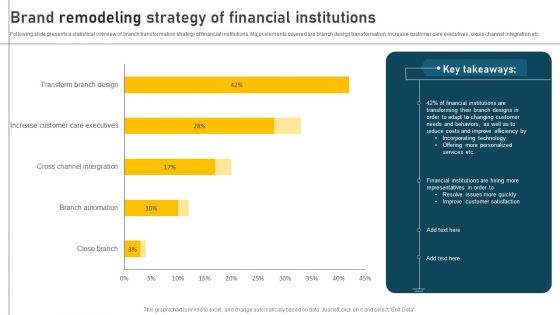
Brand Remodeling Strategy Of Financial Institutions Professional PDF
Following slide presents a statistical overview of branch transformation strategy of financial institutions. Major elements covered are branch design transformation, increase customer care executives, cross channel integration etc. Pitch your topic with ease and precision using this Brand Remodeling Strategy Of Financial Institutions Professional PDF. This layout presents information on Brand Remodeling Strategy, Financial Institutions. It is also available for immediate download and adjustment. So, changes can be made in the color, design, graphics or any other component to create a unique layout.
Pareto Analysis Shipping Tracking Metrics Dashboard Guidelines PDF
This slide showcases dashboard for analyzing on-time delivery trends. It also includes KPIs such as Pareto analysis and on-time deliveries by shipping organizations. Pitch your topic with ease and precision using this Pareto Analysis Shipping Tracking Metrics Dashboard Guidelines PDF. This layout presents information on Pareto Analysis, Deliveries Trends, Shipping Organization. It is also available for immediate download and adjustment. So, changes can be made in the color, design, graphics or any other component to create a unique layout.
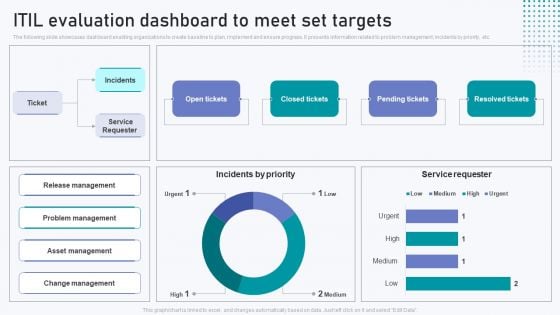
ITIL Evaluation Dashboard To Meet Set Targets Summary PDF
The following slide showcases dashboard enabling organizations to create baseline to plan, implement and ensure progress. It presents information related to problem management, incidents by priority, etc. Pitch your topic with ease and precision using this ITIL Evaluation Dashboard To Meet Set Targets Summary PDF. This layout presents information on Incidents By Priority, Service Requester. It is also available for immediate download and adjustment. So, changes can be made in the color, design, graphics or any other component to create a unique layout.
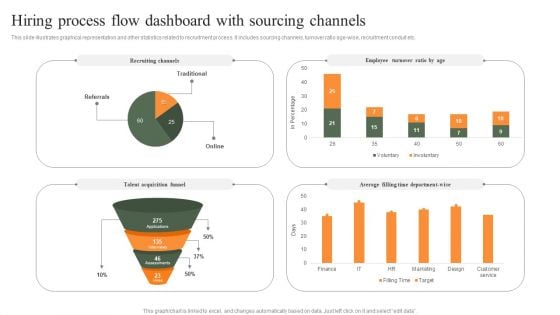
Hiring Process Flow Dashboard With Sourcing Channels Professional PDF
This slide illustrates graphical representation and other statistics related to recruitment process. It includes sourcing channels, turnover ratio age-wise, recruitment conduit etc. Pitch your topic with ease and precision using this Hiring Process Flow Dashboard With Sourcing Channels Professional PDF. This layout presents information on Employee Turnover Ratio, Recruiting Channels, Average. It is also available for immediate download and adjustment. So, changes can be made in the color, design, graphics or any other component to create a unique layout.
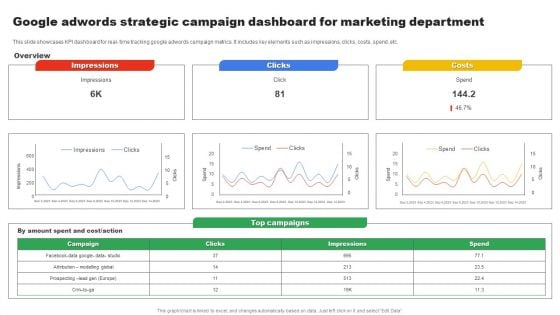
Google Adwords Strategic Campaign Dashboard For Marketing Department Download PDF
This slide showcases KPI dashboard for real time tracking google adwords campaign metrics. It includes key elements such as impressions, clicks, costs, spend, etc. Pitch your topic with ease and precision using this Google Adwords Strategic Campaign Dashboard For Marketing Department Download PDF. This layout presents information on Impressions, Clicks, Costs. It is also available for immediate download and adjustment. So, changes can be made in the color, design, graphics or any other component to create a unique layout.
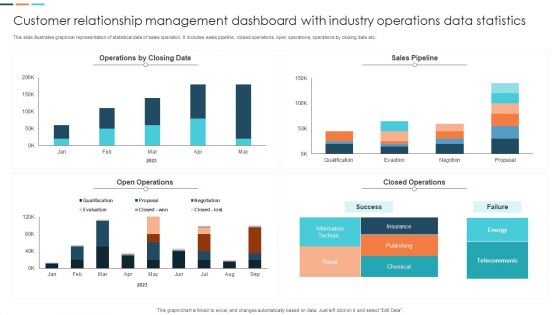
Customer Relationship Management Dashboard With Industry Operations Data Statistics Pictures PDF
This slide illustrates graphical representation of statistical data of sales operation. It includes sales pipeline, closed operations, open operations, operations by closing date etc. Pitch your topic with ease and precision using this Customer Relationship Management Dashboard With Industry Operations Data Statistics Pictures PDF. This layout presents information on Sales Pipeline, Insurance, Telecommunic. It is also available for immediate download and adjustment. So, changes can be made in the color, design, graphics or any other component to create a unique layout.

Strategic Sales Distribution Executive Summary Demonstration PDF
The given slide depicts the strategic overview to increase sales distribution. It Includes elements such as channel mix, promotion mix, pricing mix, product wise gross margin etc. Pitch your topic with ease and precision using this Strategic Sales Distribution Executive Summary Demonstration PDF. This layout presents information on E Commerce Websites, Sales Promotion, Advertising. It is also available for immediate download and adjustment. So, changes can be made in the color, design, graphics or any other component to create a unique layout.
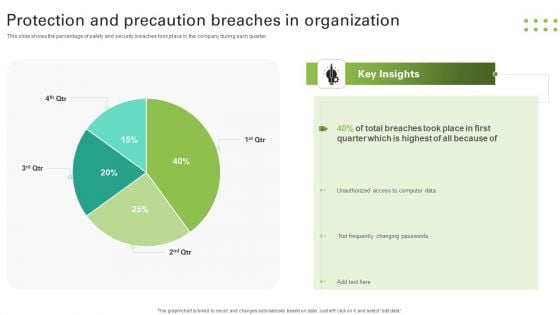
Protection And Precaution Breaches In Organization Slides PDF
This slide shows the percentage of safety and security breaches took place in the company during each quarter. Pitch your topic with ease and precision using this Protection And Precaution Breaches In Organization Slides PDF. This layout presents information on Breaches Took, Quarter, Unauthorized, Changing Passwords. It is also available for immediate download and adjustment. So, changes can be made in the color, design, graphics or any other component to create a unique layout.
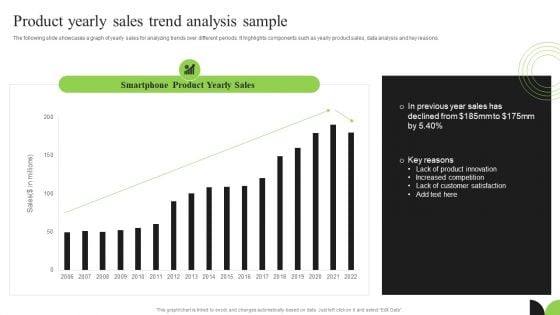
Guidebook For Executing Business Market Intelligence Product Yearly Sales Trend Analysis Sample Pictures PDF
The following slide showcases a graph of yearly sales for analyzing trends over different periods. It highlights components such as yearly product sales, data analysis and key reasons. There are so many reasons you need a Guidebook For Executing Business Market Intelligence Product Yearly Sales Trend Analysis Sample Pictures PDF. The first reason is you can not spend time making everything from scratch, Thus, Slidegeeks has made presentation templates for you too. You can easily download these templates from our website easily.
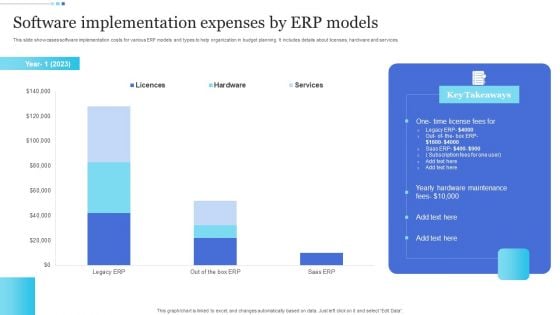
Software Implementation Expenses By ERP Models Topics PDF
This slide showcases software implementation costs for various ERP models and types to help organization in budget planning. It includes details about licenses, hardware and services. Pitch your topic with ease and precision using this Software Implementation Expenses By ERP Models Topics PDF. This layout presents information on Licenses, Hardware, Services. It is also available for immediate download and adjustment. So, changes can be made in the color, design, graphics or any other component to create a unique layout.
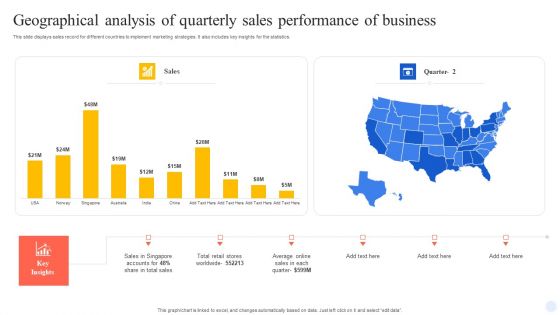
Geographical Analysis Of Quarterly Sales Performance Of Business Portrait PDF
This slide displays sales record for different countries to implement marketing strategies. It also includes key insights for the statistics. Pitch your topic with ease and precision using this Geographical Analysis Of Quarterly Sales Performance Of Business Portrait PDF. This layout presents information on Geographical Analysis, Quarterly Sales, Performance Of Business. It is also available for immediate download and adjustment. So, changes can be made in the color, design, graphics or any other component to create a unique layout.
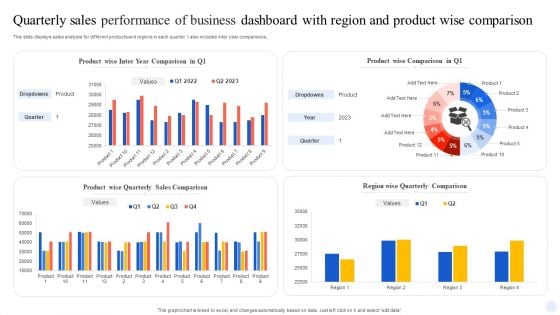
Quarterly Sales Performance Of Business Dashboard With Region And Product Wise Comparison Guidelines PDF
This slide displays sales analysis for different products and regions in each quarter. t also includes inter year comparisons. Pitch your topic with ease and precision using this Quarterly Sales Performance Of Business Dashboard With Region And Product Wise Comparison Guidelines PDF. This layout presents information on Product Wise Quarterly Sales, Comparison. It is also available for immediate download and adjustment. So, changes can be made in the color, design, graphics or any other component to create a unique layout.
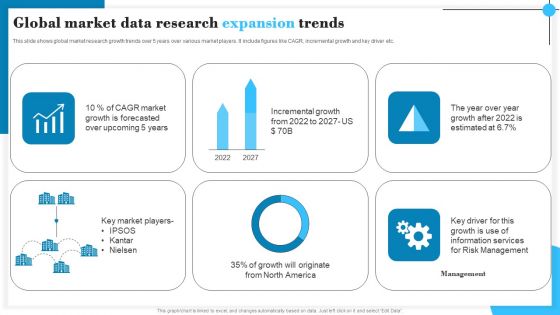
Global Market Data Research Expansion Trends Graphics PDF
This slide shows global market research growth trends over 5 years over various market players. It include figures like CAGR, incremental growth and key driver etc. Pitch your topic with ease and precision using this Global Market Data Research Expansion Trends Graphics PDF. This layout presents information on CAGR Market, Incremental Growth, Management. It is also available for immediate download and adjustment. So, changes can be made in the color, design, graphics or any other component to create a unique layout.
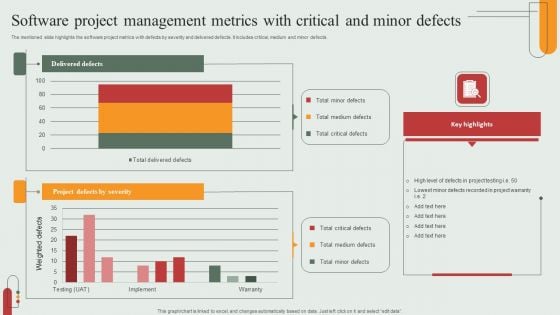
Software Project Management Metrics With Critical And Minor Defects Rules PDF
The mentioned slide highlights the software project metrics with defects by severity and delivered defects. It includes critical, medium and minor defects. Pitch your topic with ease and precision using this Software Project Management Metrics With Critical And Minor Defects Rules PDF. This layout presents information on Delivered Defects, Project Defects Severity, Critical Defects. It is also available for immediate download and adjustment. So, changes can be made in the color, design, graphics or any other component to create a unique layout.
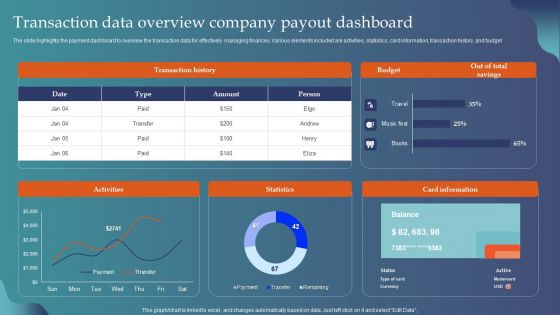
Transaction Data Overview Company Payout Dashboard Guidelines PDF
The slide highlights the payment dashboard to overview the transaction data for effectively managing finances. Various elements included are activities, statistics, card information, transaction history, and budget. Pitch your topic with ease and precision using this Transaction Data Overview Company Payout Dashboard Guidelines PDF. This layout presents information on Transaction History, Budget, Card Information, Statistics. It is also available for immediate download and adjustment. So, changes can be made in the color, design, graphics or any other component to create a unique layout.
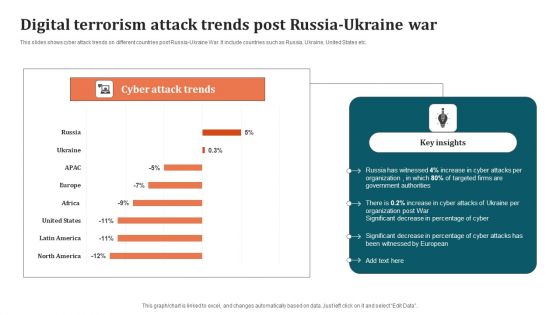
Digital Terrorism Attack Trends Post Russia Ukraine War Graphics PDF
This slides shows cyber attack trends on different countries post Russia-Ukraine War. It include countries such as Russia, Ukraine, United States etc. Pitch your topic with ease and precision using this Digital Terrorism Attack Trends Post Russia Ukraine War Graphics PDF. This layout presents information on Organization, Digital Terrorism Attack Trends. It is also available for immediate download and adjustment. So, changes can be made in the color, design, graphics or any other component to create a unique layout.

Private Wealth Administration Business In Different Countries Mockup PDF
The following slide showcases statistical data about different countries for managing wealth based on investor. It presents information related to north America, Europe, etc. Pitch your topic with ease and precision using this Private Wealth Administration Business In Different Countries Mockup PDF. This layout presents information on Private Wealth Administration Business, Wealth Management. It is also available for immediate download and adjustment. So, changes can be made in the color, design, graphics or any other component to create a unique layout.
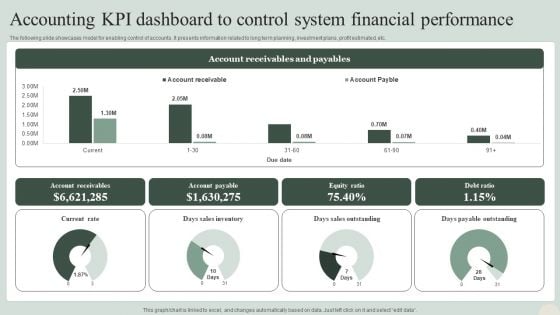
Accounting KPI Dashboard To Control System Financial Performance Formats PDF
The following slide showcases model for enabling control of accounts. It presents information related to long term planning, investment plans, profit estimated, etc. Pitch your topic with ease and precision using this Accounting KPI Dashboard To Control System Financial Performance Formats PDF. This layout presents information on Sales Outstanding, Payable Outstanding, Sales Inventory. It is also available for immediate download and adjustment. So, changes can be made in the color, design, graphics or any other component to create a unique layout.
Change Requests Tracking Metrics For Company Microsoft PDF
This slide displays dashboard to monitor change requests count assigned and completed for the organization. It includes key components such as models, owners, over time progress, etc Showcasing this set of slides titled Change Requests Tracking Metrics For Company Microsoft PDF The topics addressed in these templates are Departments, Model Owners, Requests. All the content presented in this PPT design is completely editable. Download it and make adjustments in color, background, font etc. as per your unique business setting.
Project Management Tracking Dashboard To Review Decision Download PDF
The below slide depicts the key performing indicators in project decision making. It includes elements such as overall status, progress, progress, time, cost and work volume. Pitch your topic with ease and precision using this Project Management Tracking Dashboard To Review Decision Download PDF. This layout presents information on Progress, Activity Status, Overall Status. It is also available for immediate download and adjustment. So, changes can be made in the color, design, graphics or any other component to create a unique layout.
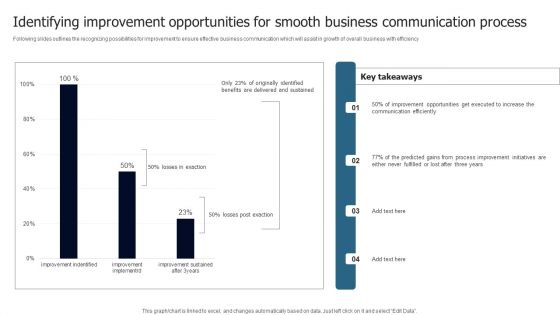
Identifying Improvement Opportunities For Smooth Business Communication Process Introduction PDF
Following slides outlines the recognizing possibilities for improvement to ensure effective business communication which will assist in growth of overall business with efficiency Pitch your topic with ease and precision using this Identifying Improvement Opportunities For Smooth Business Communication Process Introduction PDF. This layout presents information on Key Takeaways, Three Years, Efficiently. It is also available for immediate download and adjustment. So, changes can be made in the color, design, graphics or any other component to create a unique layout.
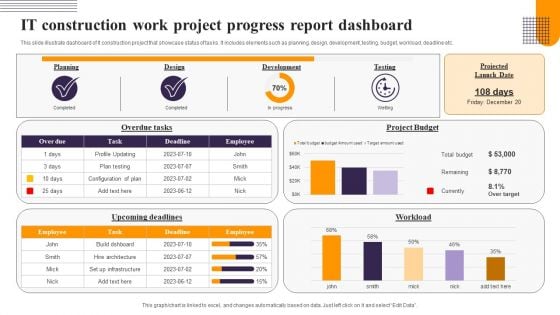
IT Construction Work Project Progress Report Dashboard Topics PDF
This slide illustrate dashboard of It construction project that showcase status of tasks. It includes elements such as planning, design, development, testing, budget, workload, deadline etc. Pitch your topic with ease and precision using this IT Construction Work Project Progress Report Dashboard Topics PDF. This layout presents information on Overdue tasks, Project Budget, Workload. It is also available for immediate download and adjustment. So, changes can be made in the color, design, graphics or any other component to create a unique layout.
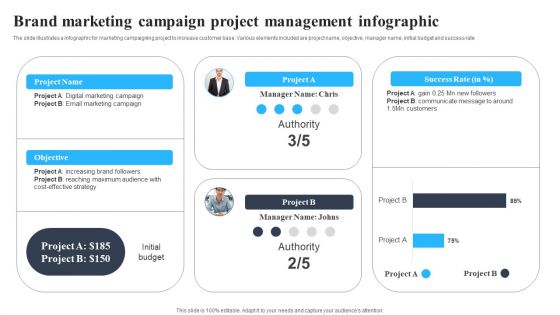
Brand Marketing Campaign Project Management Infographic Demonstration PDF
The slide illustrates a infographic for marketing campaigning project to increase customer base. Various elements included are project name, objective, manager name, initial budget and success rate Pitch your topic with ease and precision using this Brand Marketing Campaign Project Management Infographic Demonstration PDF. This layout presents information on Project Name, Objective, Infographic. It is also available for immediate download and adjustment. So, changes can be made in the color, design, graphics or any other component to create a unique layout.
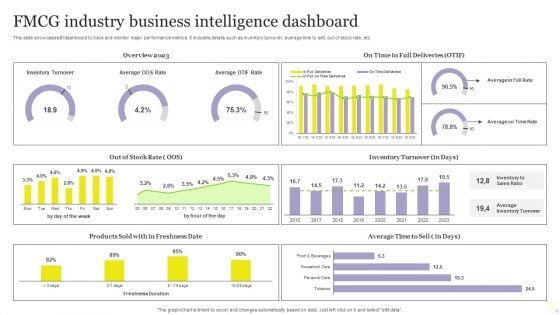
FMCG Industry Business Intelligence Dashboard Mockup PDF
This slide showcases BI dashboard to track and monitor major performance metrics. It includes details such as inventory turnover, average time to sell, out of stock rate, etc. Pitch your topic with ease and precision using this FMCG Industry Business Intelligence Dashboard Mockup PDF. This layout presents information on Average, Inventory Turnover, Business Intelligence Dashboard. It is also available for immediate download and adjustment. So, changes can be made in the color, design, graphics or any other component to create a unique layout.
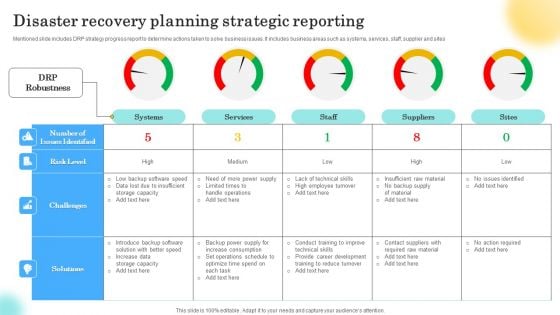
Disaster Recovery Planning Strategic Reporting Inspiration PDF
Mentioned slide includes DRP strategy progress report to determine actions taken to solve business issues. It includes business areas such as systems, services, staff, supplier and sites Pitch your topic with ease and precision using this Disaster Recovery Planning Strategic Reporting Inspiration PDF. This layout presents information on Systems, Services, Staff. It is also available for immediate download and adjustment. So, changes can be made in the color, design, graphics or any other component to create a unique layout.
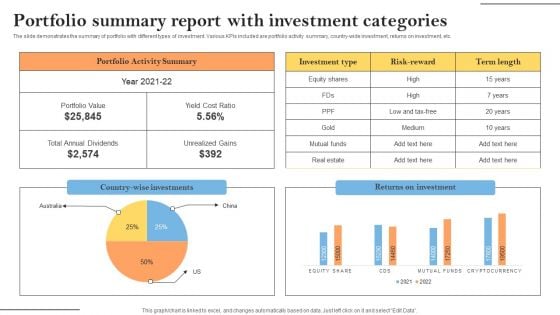
Portfolio Summary Report With Investment Categories Elements PDF
The slide demonstrates the summary of portfolio with different types of investment. Various KPIs included are portfolio activity summary, country-wide investment, returns on investment, etc. Pitch your topic with ease and precision using this Portfolio Summary Report With Investment Categories Elements PDF. This layout presents information on Portfolio Activity Summary, Investment, Risk Reward. It is also available for immediate download and adjustment. So, changes can be made in the color, design, graphics or any other component to create a unique layout.
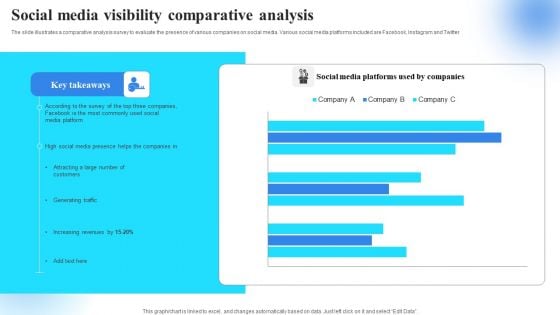
Social Media Visibility Comparative Analysis Brochure PDF
The slide illustrates a comparative analysis survey to evaluate the presence of various companies on social media. Various social media platforms included are Facebook, Instagram and Twitter Pitch your topic with ease and precision using this Social Media Visibility Comparative Analysis Brochure PDF. This layout presents information on YYYYYYYYYYYYYYYYYYYYYYYYYYYYYYYYYYYYYYYYY. It is also available for immediate download and adjustment. So, changes can be made in the color, design, graphics or any other component to create a unique layout.
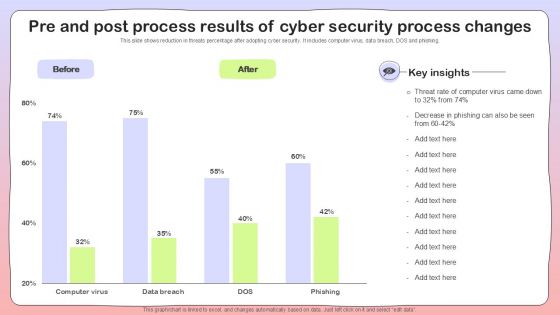
Pre And Post Process Results Of Cyber Security Process Changes Sample PDF
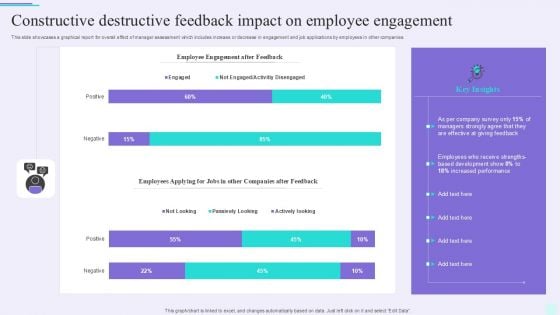
Constructive Destructive Feedback Impact On Employee Engagement Pictures PDF
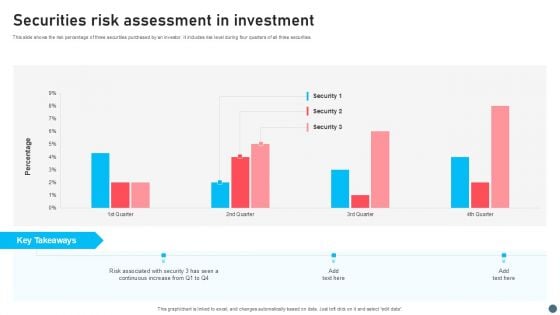
Securities Risk Assessment In Investment Topics PDF
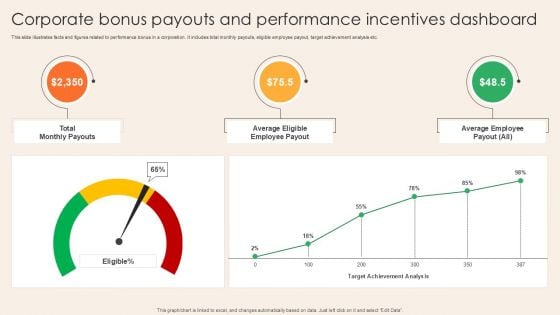
Corporate Bonus Payouts And Performance Incentives Dashboard Mockup PDF
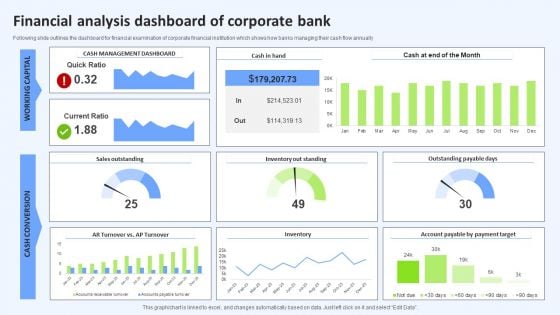
Financial Analysis Dashboard Of Corporate Bank Mockup PDF
Following slide outlines the dashboard for financial examination of corporate financial institution which shows how banks managing their cash flow annually Pitch your topic with ease and precision using this Financial Analysis Dashboard Of Corporate Bank Mockup PDF. This layout presents information on Month, Current Ratio, Inventory. It is also available for immediate download and adjustment. So, changes can be made in the color, design, graphics or any other component to create a unique layout.
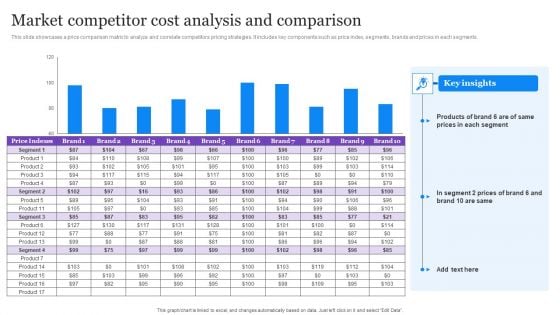
Market Competitor Cost Analysis And Comparison Demonstration PDF
This slide showcases a price comparison matrix to analyze and correlate competitors pricing strategies. It includes key components such as price index, segments, brands and prices in each segments. Showcasing this set of slides titled Market Competitor Cost Analysis And Comparison Demonstration PDF. The topics addressed in these templates are Market Competitor, Cost Analysis And Comparison. All the content presented in this PPT design is completely editable. Download it and make adjustments in color, background, font etc. as per your unique business setting.
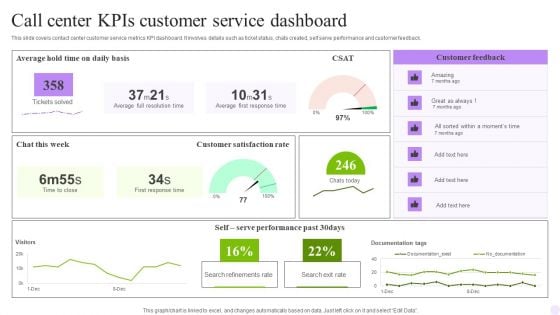
Call Center Kpis Customer Service Dashboard Pictures PDF
This slide covers contact center customer service metrics KPI dashboard. It involves details such as ticket status, chats created, self serve performance and customer feedback. Pitch your topic with ease and precision using this Call Center Kpis Customer Service Dashboard Pictures PDF. This layout presents information on Response Time, Customer, Dashboard. It is also available for immediate download and adjustment. So, changes can be made in the color, design, graphics or any other component to create a unique layout.
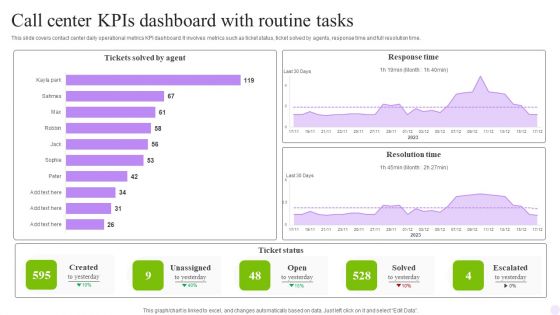
Call Center Kpis Dashboard With Routine Tasks Structure PDF
This slide covers contact center daily operational metrics KPI dashboard. It involves metrics such as ticket status, ticket solved by agents, response time and full resolution time. Pitch your topic with ease and precision using this Call Center Kpis Dashboard With Routine Tasks Structure PDF. This layout presents information on Agent, Response Time, Routine Tasks. It is also available for immediate download and adjustment. So, changes can be made in the color, design, graphics or any other component to create a unique layout.
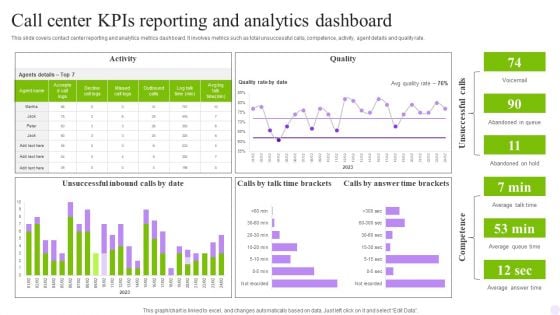
Call Center Kpis Reporting And Analytics Dashboard Download PDF
This slide covers contact center reporting and analytics metrics dashboard. It involves metrics such as total unsuccessful calls, competence, activity, agent details and quality rate. Pitch your topic with ease and precision using this Call Center Kpis Reporting And Analytics Dashboard Download PDF. This layout presents information on Activity, Quality, Dashboard. It is also available for immediate download and adjustment. So, changes can be made in the color, design, graphics or any other component to create a unique layout.
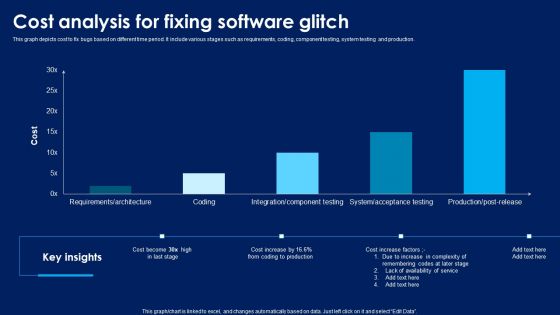
Cost Analysis For Fixing Software Glitch Inspiration PDF
This graph depicts cost to fix bugs based on different time period. It include various stages such as requirements, coding, component testing, system testing and production. Showcasing this set of slides titled Cost Analysis For Fixing Software Glitch Inspiration PDF. The topics addressed in these templates are Increase Complexity, Remembering Codes, Lack Availability Service . All the content presented in this PPT design is completely editable. Download it and make adjustments in color, background, font etc. as per your unique business setting.
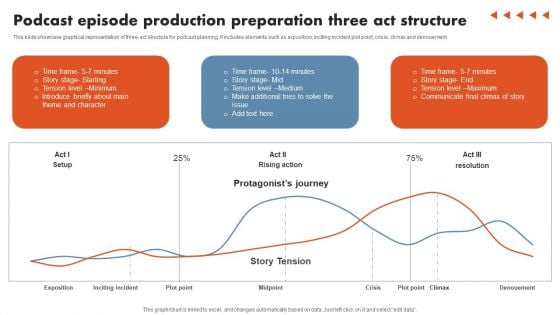
Podcast Episode Production Preparation Three Act Structure Elements PDF
This slide showcase graphical representation of three-act structure for podcast planning. It includes elements such as exposition, inciting incident plot point, crisis, climax and denouement. Pitch your topic with ease and precision using this Podcast Episode Production Preparation Three Act Structure Elements PDF. This layout presents information on Podcast Episode Production, Preparation Three Act Structure. It is also available for immediate download and adjustment. So, changes can be made in the color, design, graphics or any other component to create a unique layout.
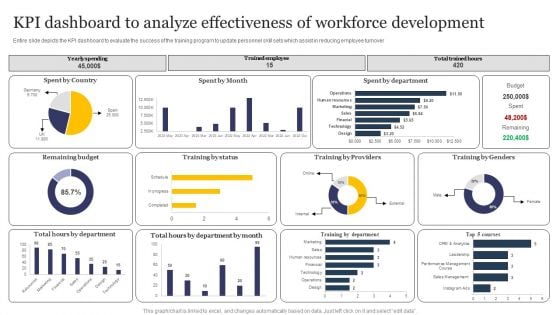
KPI Dashboard To Analyze Effectiveness Of Workforce Development Formats PDF
Entire slide depicts the KPI dashboard to evaluate the success of the training program to update personnel skill sets which assist in reducing employee turnover. Pitch your topic with ease and precision using this KPI Dashboard To Analyze Effectiveness Of Workforce Development Formats PDF. This layout presents information on Kpi Dashboard, Analyze Effectiveness, Workforce Development. It is also available for immediate download and adjustment. So, changes can be made in the color, design, graphics or any other component to create a unique layout.
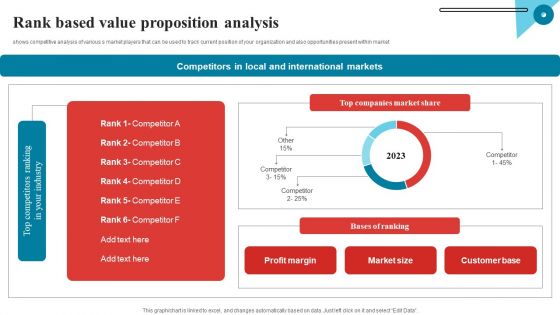
Rank Based Value Proposition Analysis Mockup PDF
shows competitive analysis of various s market players that can be used to track current position of your organization and also opportunities present within market Pitch your topic with ease and precision using this Rank Based Value Proposition Analysis Mockup PDF. This layout presents information on Analysis, Rank, Markets. It is also available for immediate download and adjustment. So, changes can be made in the color, design, graphics or any other component to create a unique layout.
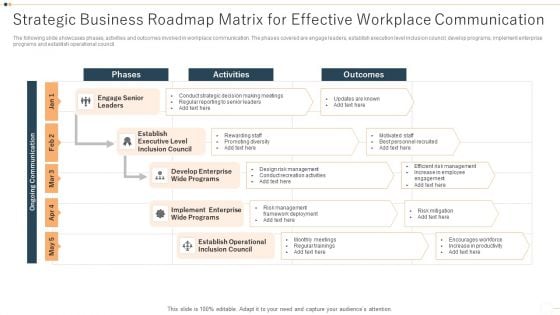
Strategic Business Roadmap Matrix For Effective Workplace Communication Elements PDF
The following slide showcases phases, activities and outcomes involved in workplace communication. The phases covered are engage leaders, establish execution level inclusion council, develop programs, implement enterprise programs and establish operational council. Pitch your topic with ease and precision using this Strategic Business Roadmap Matrix For Effective Workplace Communication Elements PDF. This layout presents information on Develop Enterprise Wide Programs, Implement Enterprise Wide Programs, Establish Operational Inclusion Council. It is also available for immediate download and adjustment. So, changes can be made in the color, design, graphics or any other component to create a unique layout.
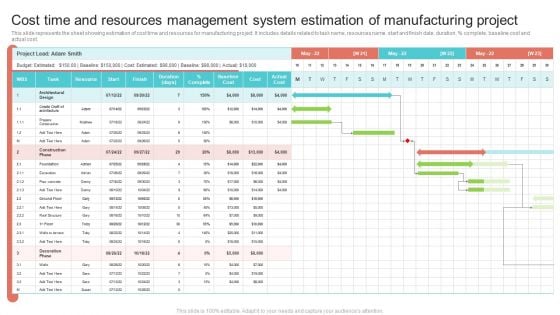
Cost Time And Resources Management System Estimation Of Manufacturing Project Clipart PDF
This slide represents the sheet showing estimation of cost time and resources for manufacturing project. It includes details related to task name, resources name, start and finish date, duration, percent complete, baseline cost and actual cost. Pitch your topic with ease and precision using this Cost Time And Resources Management System Estimation Of Manufacturing Project Clipart PDF. This layout presents information on Decoration Phase, Construction Phase, Architectural Design. It is also available for immediate download and adjustment. So, changes can be made in the color, design, graphics or any other component to create a unique layout.
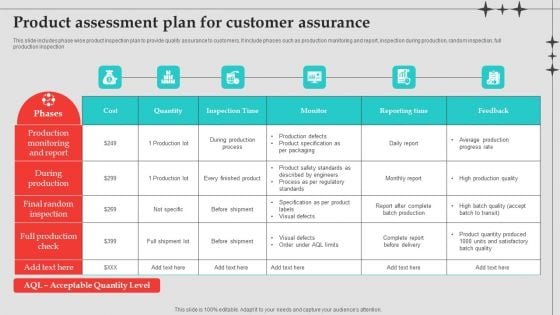
Product Assessment Plan For Customer Assurance Infographics PDF
This slide includes phase wise product inspection plan to provide quality assurance to customers. It include phases such as production monitoring and report, inspection during production, random inspection, full production inspection. Pitch your topic with ease and precision using this Product Assessment Plan For Customer Assurance Infographics PDF. This layout presents information on Quantity, Cost, Product. It is also available for immediate download and adjustment. So, changes can be made in the color, design, graphics or any other component to create a unique layout.
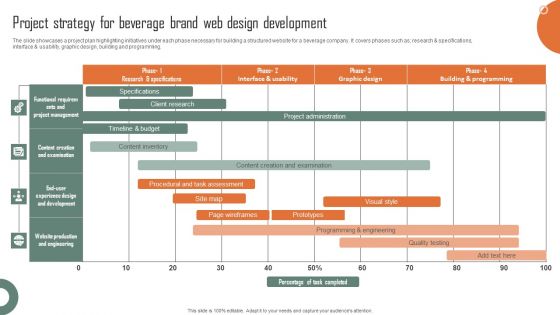
Project Strategy For Beverage Brand Web Design Development Microsoft PDF
The slide showcases a project plan highlighting initiatives under each phase necessary for building a structured website for a beverage company. It covers phases such as research and specifications, interface and usability, graphic design, building and programming. Pitch your topic with ease and precision using this Project Strategy For Beverage Brand Web Design Development Microsoft PDF. This layout presents information on Budget, Content Inventory, Quality Testing. It is also available for immediate download and adjustment. So, changes can be made in the color, design, graphics or any other component to create a unique layout.
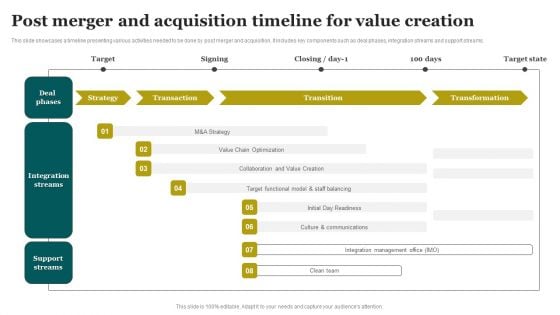
Post Merger And Acquisition Timeline For Value Creation Introduction PDF
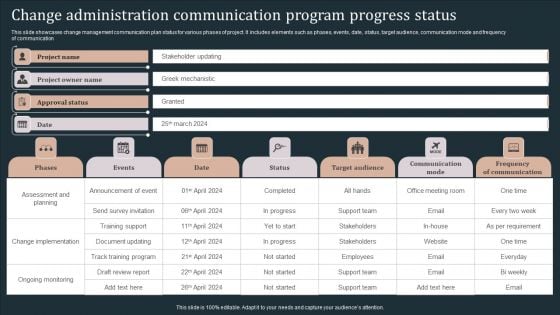
Change Administration Communication Program Progress Status Rules PDF
This slide showcases change management communication plan status for various phases of project. It includes elements such as phases, events, date, status, target audience, communication mode and frequency of communication. Pitch your topic with ease and precision using this Change Administration Communication Program Progress Status Rules PDF. This layout presents information on Status, Target Audience, Communication Mode. It is also available for immediate download and adjustment. So, changes can be made in the color, design, graphics or any other component to create a unique layout.
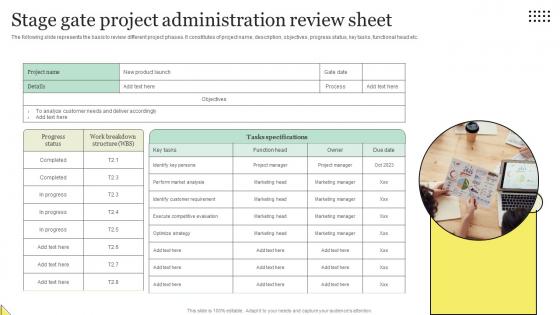
Stage Gate Project Administration Review Sheet Portrait Pdf
The following slide represents the basis to review different project phases. It constitutes of project name, description, objectives, progress status, key tasks, functional head etc. Pitch your topic with ease and precision using this Stage Gate Project Administration Review Sheet Portrait Pdf. This layout presents information on Identify Key Persons, Perform Market Analysis, Identify Customer Requirement. It is also available for immediate download and adjustment. So, changes can be made in the color, design, graphics or any other component to create a unique layout. The following slide represents the basis to review different project phases. It constitutes of project name, description, objectives, progress status, key tasks, functional head etc.
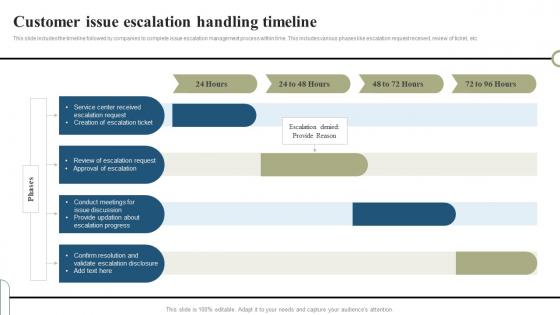
Customer Issue Escalation Handling Timeline Structure Pdf
This slide includes the timeline followed by companies to complete issue escalation management process within time. This includes various phases like escalation request received, review of ticket, etc. Pitch your topic with ease and precision using this Customer Issue Escalation Handling Timeline Structure Pdf This layout presents information on Service Center, Escalation Progress, Customer Issue It is also available for immediate download and adjustment. So, changes can be made in the color, design, graphics or any other component to create a unique layout. This slide includes the timeline followed by companies to complete issue escalation management process within time. This includes various phases like escalation request received, review of ticket, etc.
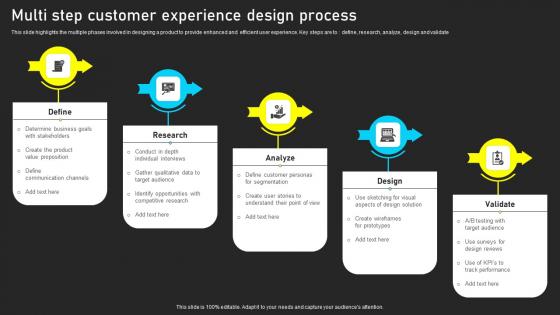
Multi Step Customer Experience Design Process Infographics Pdf
This slide highlights the multiple phases involved in designing a product to provide enhanced and efficient user experience. Key steps are to define, research, analyze, design and validate Pitch your topic with ease and precision using this Multi Step Customer Experience Design Process Infographics Pdf. This layout presents information on Define, Research, Analyze. It is also available for immediate download and adjustment. So, changes can be made in the color, design, graphics or any other component to create a unique layout. This slide highlights the multiple phases involved in designing a product to provide enhanced and efficient user experience. Key steps are to define, research, analyze, design and validate
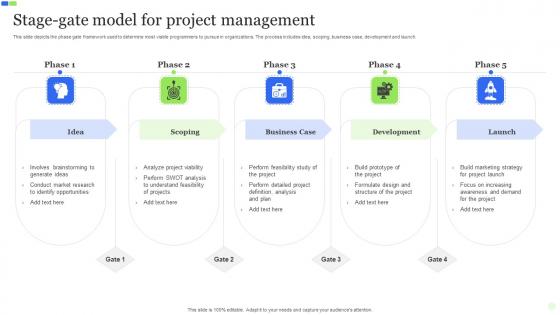
Stage Gate Model For Project Management Professional Pdf
This slide depicts the phase gate framework used to determine most viable programmers to pursue in organizations. The process includes idea, scoping, business case, development and launch. Pitch your topic with ease and precision using this Stage Gate Model For Project Management Professional Pdf. This layout presents information on Business Case, Development, Stage Gate Model, Project Management. It is also available for immediate download and adjustment. So, changes can be made in the color, design, graphics or any other component to create a unique layout. This slide depicts the phase gate framework used to determine most viable programmers to pursue in organizations. The process includes idea, scoping, business case, development and launch.
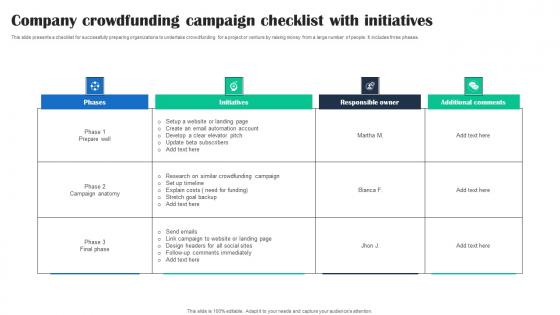
Company Crowdfunding Campaign Checklist With Initiatives Structure Pdf
This slide presents a checklist for successfully preparing organizations to undertake crowdfunding for a project or venture by raising money from a large number of people. It includes three phases. Pitch your topic with ease and precision using this Company Crowdfunding Campaign Checklist With Initiatives Structure Pdf. This layout presents information on Initiatives. Company, Campaign. It is also available for immediate download and adjustment. So, changes can be made in the color, design, graphics or any other component to create a unique layout. This slide presents a checklist for successfully preparing organizations to undertake crowdfunding for a project or venture by raising money from a large number of people. It includes three phases.
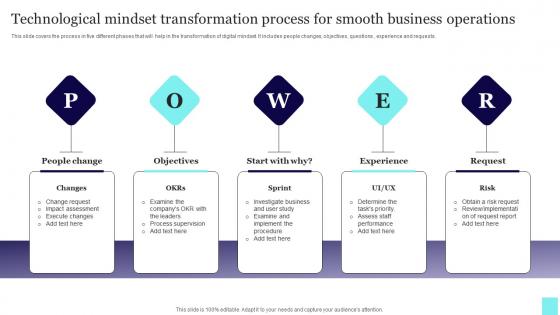
Technological Mindset Transformation Process For Smooth Business Operations Mockup Pdf
This slide covers the process in five different phases that will help in the transformation of digital mindset. It includes people changes, objectives, questions , experience and requests. Pitch your topic with ease and precision using this Technological Mindset Transformation Process For Smooth Business Operations Mockup Pdf. This layout presents information on People Change, Objectives, Experience. It is also available for immediate download and adjustment. So, changes can be made in the color, design, graphics or any other component to create a unique layout. This slide covers the process in five different phases that will help in the transformation of digital mindset. It includes people changes, objectives, questions , experience and requests.
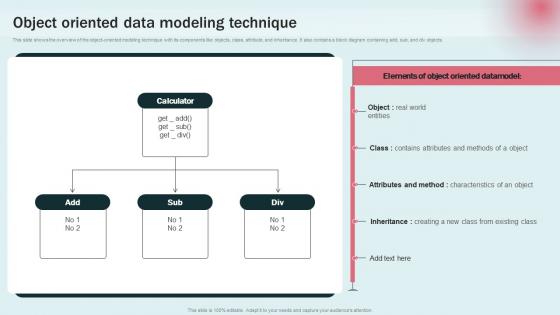
Object Oriented Data Modeling Data Modeling Approaches For Modern Analytics Infographics Pdf
This slide shows the overview of the object oriented modeling technique with its components like objects, class, attribute, and inheritance. It also contains a block diagram containing add, sub, and div objects. This modern and well arranged Object Oriented Data Modeling Data Modeling Approaches For Modern Analytics Infographics Pdf provides lots of creative possibilities. It is very simple to customize and edit with the Powerpoint Software. Just drag and drop your pictures into the shapes. All facets of this template can be edited with Powerpoint, no extra software is necessary. Add your own material, put your images in the places assigned for them, adjust the colors, and then you can show your slides to the world, with an animated slide included. This slide shows the overview of the object oriented modeling technique with its components like objects, class, attribute, and inheritance. It also contains a block diagram containing add, sub, and div objects.
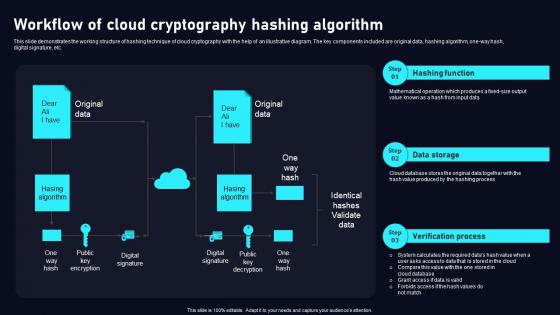
Workflow Of Cloud Cryptography Cloud Data Security Using Cryptography Clipart Pdf
This slide demonstrates the working structure of hashing technique of cloud cryptography with the help of an illustrative diagram. The key components included are original data, hashing algorithm, one way hash, digital signature, etc. Find a pre designed and impeccableWorkflow Of Cloud Cryptography Cloud Data Security Using Cryptography Clipart Pdf. The templates can ace your presentation without additional effort. You can download these easy to edit presentation templates to make your presentation stand out from others. So, what are you waiting for Download the template from Slidegeeks today and give a unique touch to your presentation. This slide demonstrates the working structure of hashing technique of cloud cryptography with the help of an illustrative diagram. The key components included are original data, hashing algorithm, one way hash, digital signature, etc.
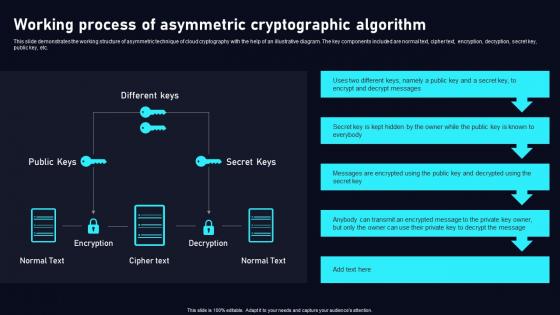
Working Process Of Asymmetric Cloud Data Security Using Cryptography Demonstration Pdf
This slide demonstrates the working structure of asymmetric technique of cloud cryptography with the help of an illustrative diagram. The key components included are normal text, cipher text, encryption, decryption, secret key, public key, etc. Slidegeeks is one of the best resources for PowerPoint templates. You can download easily and regulateWorking Process Of Asymmetric Cloud Data Security Using Cryptography Demonstration Pdf for your personal presentations from our wonderful collection. A few clicks is all it takes to discover and get the most relevant and appropriate templates. Use our Templates to add a unique zing and appeal to your presentation and meetings. All the slides are easy to edit and you can use them even for advertisement purposes. This slide demonstrates the working structure of asymmetric technique of cloud cryptography with the help of an illustrative diagram. The key components included are normal text, cipher text, encryption, decryption, secret key, public key, etc.
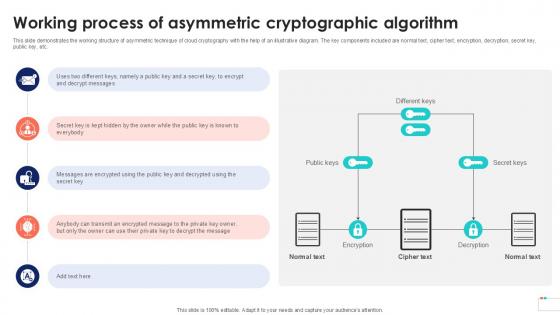
Working Process Of Asymmetric Data Security In Cloud Computing Ppt Powerpoint
This slide demonstrates the working structure of asymmetric technique of cloud cryptography with the help of an illustrative diagram. The key components included are normal text, cipher text, encryption, decryption, secret key, public key, etc. Make sure to capture your audiences attention in your business displays with our gratis customizable Working Process Of Asymmetric Data Security In Cloud Computing Ppt Powerpoint. These are great for business strategies, office conferences, capital raising or task suggestions. If you desire to acquire more customers for your tech business and ensure they stay satisfied, create your own sales presentation with these plain slides. This slide demonstrates the working structure of asymmetric technique of cloud cryptography with the help of an illustrative diagram. The key components included are normal text, cipher text, encryption, decryption, secret key, public key, etc.
Business And Marketing Concept Mind Map Ppt Subway Plan PowerPoint Slides
We present our business and marketing concept mind map ppt subway plan PowerPoint Slides.Download our Circle Charts PowerPoint Templates because Our PowerPoint Templates and Slides are innately eco-friendly. Their high recall value negate the need for paper handouts. Present our Process and Flows PowerPoint Templates because Our PowerPoint Templates and Slides help you pinpoint your timelines. Highlight the reasons for your deadlines with their use. Use our Arrows PowerPoint Templates because Our PowerPoint Templates and Slides will bullet point your ideas. See them fall into place one by one. Use our Business PowerPoint Templates because Our PowerPoint Templates and Slides offer you the widest possible range of options. Present our Marketing PowerPoint Templates because Our PowerPoint Templates and Slides will let your words and thoughts hit bullseye everytime.Use these PowerPoint slides for presentations relating to Business, process, leadership, components, concept, presentation, teamwork, internet, template, diagram,change, scheme, report, marketing, technology, connection, chart, system, strategy, project, direction, growth, levels, banner, progress, background, structure . The prominent colors used in the PowerPoint template are Yellow, Green, Blue. Stay calm and collected with our Business And Marketing Concept Mind Map Ppt Subway Plan PowerPoint Slides. The audience will admire your cool.
Angle With 3 Stages For Business Srategy Ppt Consignment Plan PowerPoint Templates
We present our angle with 3 stages for business srategy ppt consignment plan PowerPoint templates.Present our Business PowerPoint Templates because Our PowerPoint Templates and Slides will let Your superior ideas hit the target always and everytime. Download our Arrows PowerPoint Templates because It will let you Set new benchmarks with our PowerPoint Templates and Slides. They will keep your prospects well above par. Use our Flow Charts PowerPoint Templates because You can Connect the dots. Fan expectations as the whole picture emerges. Download our Shapes PowerPoint Templates because You are well armed with penetrative ideas. Our PowerPoint Templates and Slides will provide the gunpowder you need. Download and present our Marketing PowerPoint Templates because you can Add colour to your speech with our PowerPoint Templates and Slides. Your presentation will leave your audience speechless.Use these PowerPoint slides for presentations relating to Business, process, leadership, components, concept, presentation, teamwork, internet, template, diagram,change, scheme, report, marketing, technology, connection, chart, system, strategy, project, direction, growth, levels, banner, progress, background, structure . The prominent colors used in the PowerPoint template are White, Blue light, Black. People everywhere are attracted to beauty. They will discover that our Angle With 3 Stages For Business Srategy Ppt Consignment Plan PowerPoint Templates are enticing.
Stacked Angle With 2 Stages For Business Cycle Ppt Plan Assistance PowerPoint Slides
We present our stacked angle with 2 stages for business cycle ppt plan assistance PowerPoint Slides.Use our Business PowerPoint Templates because Our PowerPoint Templates and Slides will let your team Walk through your plans. See their energy levels rise as you show them the way. Download our Arrows PowerPoint Templates because You can Bask in the warmth of our PowerPoint Templates and Slides. Enjoy the heartfelt glowing response of your listeners. Download our Flow Charts PowerPoint Templates because It will Raise the bar of your Thoughts. They are programmed to take you to the next level. Use our Shapes PowerPoint Templates because Our PowerPoint Templates and Slides are specially created by a professional team with vast experience. They diligently strive to come up with the right vehicle for your brilliant Ideas. Use our Marketing PowerPoint Templates because You can Raise a toast with our PowerPoint Templates and Slides. Spread good cheer amongst your audience.Use these PowerPoint slides for presentations relating to Business, process, leadership, components, concept, presentation, teamwork, internet, template, diagram,change, scheme, report, marketing, technology, connection, chart, system, strategy, project, direction, growth, levels, banner, progress, background, structure . The prominent colors used in the PowerPoint template are White, Blue light, Black. Cruise along with our Stacked Angle With 2 Stages For Business Cycle Ppt Plan Assistance PowerPoint Slides. Your thoughts will pick up the flow.
Multiple Elements Stacked Marketing Process 6 Stages Ppt Best Business Plan PowerPoint Templates
We present our multiple elements stacked marketing process 6 stages ppt best business plan PowerPoint templates.Download and present our Circle Charts PowerPoint Templates because you should Whip up a frenzy with our PowerPoint Templates and Slides. They will fuel the excitement of your team. Download and present our Arrows PowerPoint Templates because Timeline crunches are a fact of life. Meet all deadlines using our PowerPoint Templates and Slides. Present our Business PowerPoint Templates because Our PowerPoint Templates and Slides will help you be quick off the draw. Just enter your specific text and see your points hit home. Use our Process and Flows PowerPoint Templates because You should Kick up a storm with our PowerPoint Templates and Slides. The heads of your listeners will swirl with your ideas. Present our Marketing PowerPoint Templates because You are working at that stage with an air of royalty. Let our PowerPoint Templates and Slides be the jewels in your crown.Use these PowerPoint slides for presentations relating to Business, circle, process, leadership, components, concept, presentation, teamwork, internet, template, diagram,change, scheme, report, marketing, technology, connection, chart, system, strategy, project, direction, growth, levels, banner, progress, background, structure . The prominent colors used in the PowerPoint template are Gray, White, Blue light. Our Multiple Elements Stacked Marketing Process 6 Stages Ppt Best Business Plan PowerPoint Templates willexhibit your ability. Demonstrate your talent to one and all.
Multiple Elements Stacked Marketing Process 6 Stages Ppt Business Plan Model PowerPoint Slides
We present our multiple elements stacked marketing process 6 stages ppt business plan model PowerPoint Slides.Download our Circle Charts PowerPoint Templates because It will Strengthen your hand with your thoughts. They have all the aces you need to win the day. Download and present our Arrows PowerPoint Templates because Our PowerPoint Templates and Slides are topically designed to provide an attractive backdrop to any subject. Present our Business PowerPoint Templates because Our PowerPoint Templates and Slides will embellish your thoughts. See them provide the desired motivation to your team. Download our Process and Flows PowerPoint Templates because Our PowerPoint Templates and Slides are innately eco-friendly. Their high recall value negate the need for paper handouts. Download our Marketing PowerPoint Templates because You can Score a slam dunk with our PowerPoint Templates and Slides. Watch your audience hang onto your every word.Use these PowerPoint slides for presentations relating to Business, circle, process, leadership, components, concept, presentation, teamwork, internet, template, diagram,change, scheme, report, marketing, technology, connection, chart, system, strategy, project, direction, growth, levels, banner, progress, background, structure . The prominent colors used in the PowerPoint template are Blue, Gray, White. Become a genius with our Multiple Elements Stacked Marketing Process 6 Stages Ppt Business Plan Model PowerPoint Slides. You will come out on top.
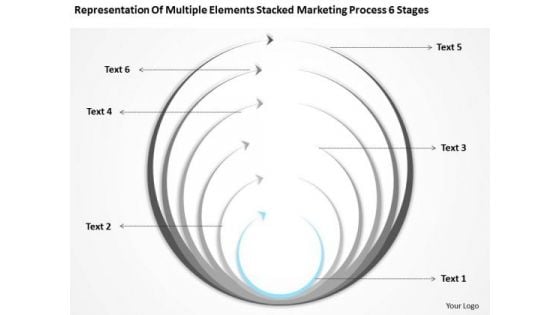
Stacked Marketing Process 6 Stages Ppt Real Estate Business Plan Examples PowerPoint Templates
We present our stacked marketing process 6 stages ppt real estate business plan examples PowerPoint templates.Present our Circle Charts PowerPoint Templates because You are an avid believer in ethical practices. Highlight the benefits that accrue with our PowerPoint Templates and Slides. Use our Arrows PowerPoint Templates because These PowerPoint Templates and Slides will give the updraft to your ideas. See them soar to great heights with ease. Present our Business PowerPoint Templates because Our PowerPoint Templates and Slides help you meet the demand of the Market. Just browse and pick the slides that appeal to your intuitive senses. Use our Process and Flows PowerPoint Templates because Our PowerPoint Templates and Slides are effectively colour coded to prioritise your plans They automatically highlight the sequence of events you desire. Download our Marketing PowerPoint Templates because Our PowerPoint Templates and Slides are created with admirable insight. Use them and give your group a sense of your logical mind.Use these PowerPoint slides for presentations relating to Business, circle, process, leadership, components, concept, presentation, teamwork, internet, template, diagram,change, scheme, report, marketing, technology, connection, chart, system, strategy, project, direction, growth, levels, banner, progress, background, structure . The prominent colors used in the PowerPoint template are Gray, White, Blue light. Our Stacked Marketing Process 6 Stages Ppt Real Estate Business Plan Examples PowerPoint Templates team are a multi-faceted lot. They address issues from different angles.
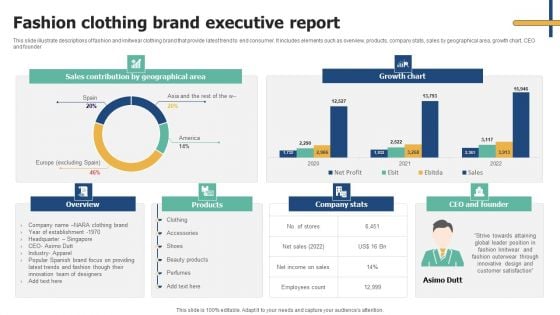
Fashion Clothing Brand Executive Report Download PDF
This slide illustrate descriptions of fashion and knitwear clothing brand that provide latest trend to end consumer. It includes elements such as overview, products, company stats, sales by geographical area, growth chart, CEO and founder. Pitch your topic with ease and precision using this Fashion Clothing Brand Executive Report Download PDF. This layout presents information on Sales Contribution, Geographical Area, Growth Chart. It is also available for immediate download and adjustment. So, changes can be made in the color, design, graphics or any other component to create a unique layout.
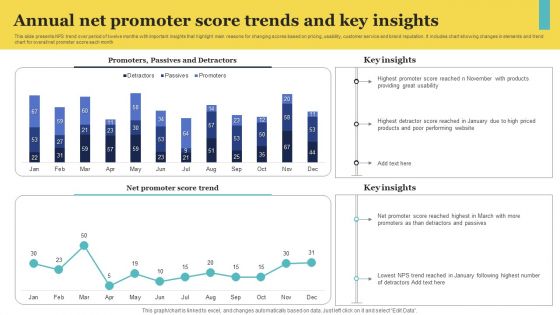
Annual Net Promoter Score Trends And Key Insights Professional PDF
This slide presents NPS trend over period of twelve months with important insights that highlight main reasons for changing scores based on pricing, usability, customer service and brand reputation. It includes chart showing changes in elements and trend chart for overall net promoter score each month Pitch your topic with ease and precision using this Annual Net Promoter Score Trends And Key Insights Professional PDF. This layout presents information on Key Insights, Score Trend, Detractors. It is also available for immediate download and adjustment. So, changes can be made in the color, design, graphics or any other component to create a unique layout.
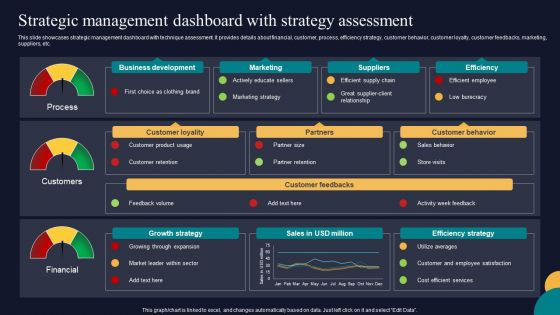
Strategic Management Dashboard With Strategy Assessment Tactics To Gain Sustainable Competitive Edge Pictures PDF
This slide showcases strategic management dashboard with technique assessment. It provides details about financial, customer, process, efficiency strategy, customer behavior, customer loyalty, customer feedbacks, marketing, suppliers, etc. Formulating a presentation can take up a lot of effort and time, so the content and message should always be the primary focus. The visuals of the PowerPoint can enhance the presenters message, so our Strategic Management Dashboard With Strategy Assessment Tactics To Gain Sustainable Competitive Edge Pictures PDF was created to help save time. Instead of worrying about the design, the presenter can concentrate on the message while our designers work on creating the ideal templates for whatever situation is needed. Slidegeeks has experts for everything from amazing designs to valuable content, we have put everything into Strategic Management Dashboard With Strategy Assessment Tactics To Gain Sustainable Competitive Edge Pictures PDF.

 Home
Home