Organizational Icons
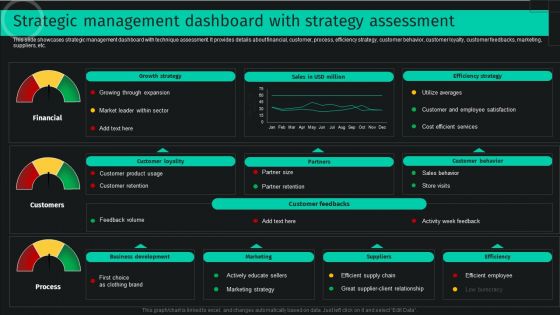
Strategic Management Dashboard With Strategy Assessment Sample PDF
This slide showcases strategic management dashboard with technique assessment. It provides details about financial, customer, process, efficiency strategy, customer behavior, customer loyalty, customer feedbacks, marketing, suppliers, etc. Do you have to make sure that everyone on your team knows about any specific topic I yes, then you should give Strategic Management Dashboard With Strategy Assessment Sample PDF a try. Our experts have put a lot of knowledge and effort into creating this impeccable Strategic Management Dashboard With Strategy Assessment Sample PDF. You can use this template for your upcoming presentations, as the slides are perfect to represent even the tiniest detail. You can download these templates from the Slidegeeks website and these are easy to edit. So grab these today.
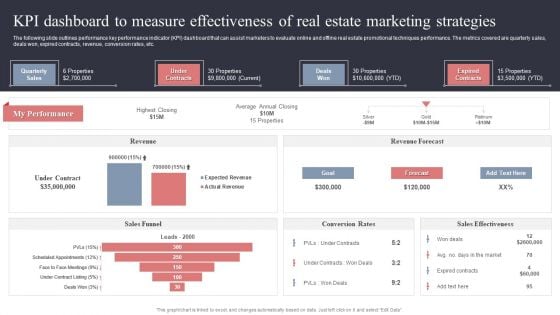
KPI Dashboard To Measure Effectiveness Of Real Estate Marketing Strategies Inspiration PDF
The following slide outlines performance key performance indicator KPI dashboard that can assist marketers to evaluate online and offline real estate promotional techniques performance. The metrics covered are quarterly sales, deals won, expired contracts, revenue, conversion rates, etc. Coming up with a presentation necessitates that the majority of the effort goes into the content and the message you intend to convey. The visuals of a PowerPoint presentation can only be effective if it supplements and supports the story that is being told. Keeping this in mind our experts created KPI Dashboard To Measure Effectiveness Of Real Estate Marketing Strategies Inspiration PDF to reduce the time that goes into designing the presentation. This way, you can concentrate on the message while our designers take care of providing you with the right template for the situation.
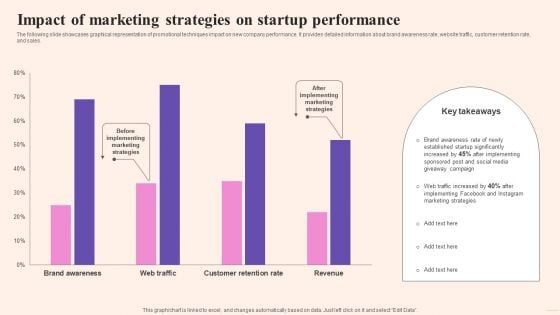
Comprehensive Guide To Build Marketing Impact Of Marketing Strategies On Startup Slides PDF
The following slide showcases graphical representation of promotional techniques impact on new company performance. It provides detailed information about brand awareness rate, website traffic, customer retention rate, and sales. Crafting an eye-catching presentation has never been more straightforward. Let your presentation shine with this tasteful yet straightforward Comprehensive Guide To Build Marketing Impact Of Marketing Strategies On Startup Slides PDF template. It offers a minimalistic and classy look that is great for making a statement. The colors have been employed intelligently to add a bit of playfulness while still remaining professional. Construct the ideal Comprehensive Guide To Build Marketing Impact Of Marketing Strategies On Startup Slides PDF that effortlessly grabs the attention of your audience Begin now and be certain to wow your customers
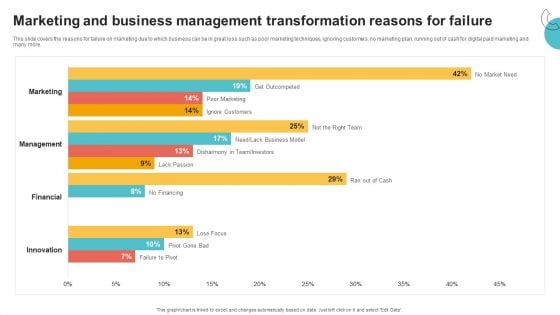
Digital Marketing Toolkit Marketing And Business Management Transformation Reasons For Failure Template PDF
This slide covers the reasons for failure on marketing due to which business can be in great loss such as poor marketing techniques, ignoring customers, no marketing plan, running out of cash for digital paid marketing and many more. Crafting an eye-catching presentation has never been more straightforward. Let your presentation shine with this tasteful yet straightforward Digital Marketing Toolkit Marketing And Business Management Transformation Reasons For Failure Template PDF template. It offers a minimalistic and classy look that is great for making a statement. The colors have been employed intelligently to add a bit of playfulness while still remaining professional. Construct the ideal Digital Marketing Toolkit Marketing And Business Management Transformation Reasons For Failure Template PDF that effortlessly grabs the attention of your audience Begin now and be certain to wow your customers
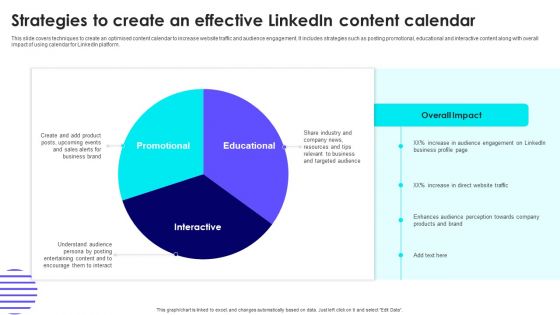
Strategies To Create An Effective Linkedin Content Calendar Information PDF
This slide covers techniques to create an optimised content calendar to increase website traffic and audience engagement. It includes strategies such as posting promotional, educational and interactive content along with overall impact of using calendar for LinkedIn platform. Do you have to make sure that everyone on your team knows about any specific topic I yes, then you should give Strategies To Create An Effective Linkedin Content Calendar Information PDF a try. Our experts have put a lot of knowledge and effort into creating this impeccable Strategies To Create An Effective Linkedin Content Calendar Information PDF. You can use this template for your upcoming presentations, as the slides are perfect to represent even the tiniest detail. You can download these templates from the Slidegeeks website and these are easy to edit. So grab these today.
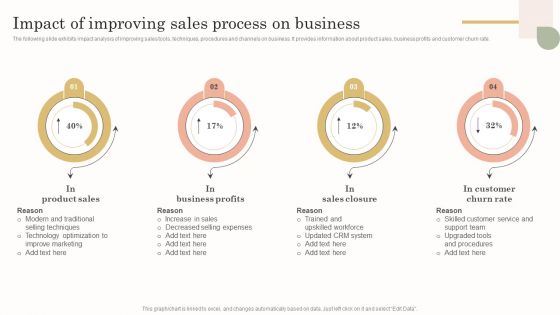
Impact Of Improving Sales Process On Business Microsoft PDF
The following slide exhibits impact analysis of improving sales tools, techniques, procedures and channels on business. It provides information about product sales, business profits and customer churn rate. Crafting an eye catching presentation has never been more straightforward. Let your presentation shine with this tasteful yet straightforward Impact Of Improving Sales Process On Business Microsoft PDF template. It offers a minimalistic and classy look that is great for making a statement. The colors have been employed intelligently to add a bit of playfulness while still remaining professional. Construct the ideal Impact Of Improving Sales Process On Business Microsoft PDF that effortlessly grabs the attention of your audience Begin now and be certain to wow your customers.
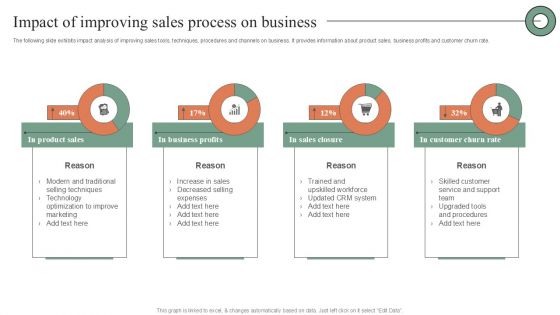
Impact Of Improving Sales Process On Business Topics PDF
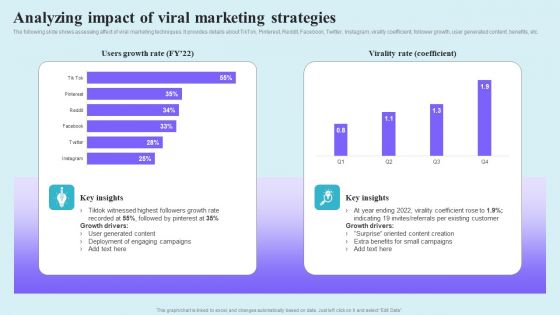
Go Viral Campaign Strategies To Increase Engagement Analyzing Impact Of Viral Marketing Strategies Structure PDF
The following slide shows assessing affect of viral marketing techniques. It provides details about TikTok, Pinterest, Reddit, Facebook, Twitter, Instagram, virality coefficient, follower growth, user generated content, benefits, etc. Create an editable Go Viral Campaign Strategies To Increase Engagement Analyzing Impact Of Viral Marketing Strategies Structure PDF that communicates your idea and engages your audience. Whether youre presenting a business or an educational presentation, pre designed presentation templates help save time. Go Viral Campaign Strategies To Increase Engagement Analyzing Impact Of Viral Marketing Strategies Structure PDF is highly customizable and very easy to edit, covering many different styles from creative to business presentations. Slidegeeks has creative team members who have crafted amazing templates. So, go and get them without any delay.
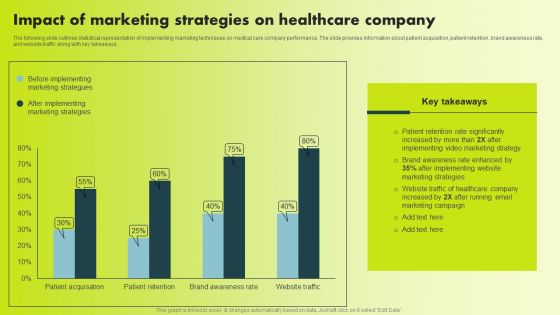
Impact Of Marketing Strategies On Healthcare Company Information PDF
The following slide outlines statistical representation of implementing marketing techniques on medical care company performance. The slide provides information about patient acquisition, patient retention, brand awareness rate, and website traffic along with key takeaways. Do you have to make sure that everyone on your team knows about any specific topic I yes, then you should give Impact Of Marketing Strategies On Healthcare Company Information PDF a try. Our experts have put a lot of knowledge and effort into creating this impeccable Impact Of Marketing Strategies On Healthcare Company Information PDF. You can use this template for your upcoming presentations, as the slides are perfect to represent even the tiniest detail. You can download these templates from the Slidegeeks website and these are easy to edit. So grab these today
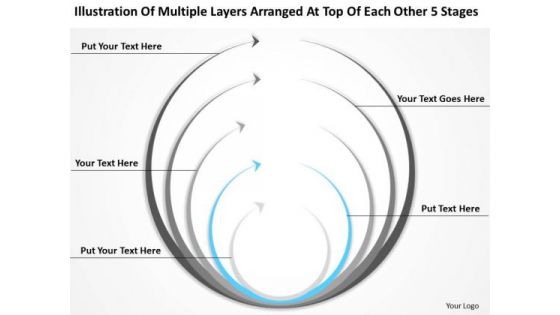
Layers Arranged At Top Each Other 5 Stages Ppt Business Plan Online PowerPoint Slides
We present our layers arranged at top each other 5 stages ppt business plan online PowerPoint Slides.Download and present our Circle Charts PowerPoint Templates because You can Raise a toast with our PowerPoint Templates and Slides. Spread good cheer amongst your audience. Download and present our Arrows PowerPoint Templates because Our PowerPoint Templates and Slides ensures Effective communication. They help you put across your views with precision and clarity. Download and present our Business PowerPoint Templates because Our PowerPoint Templates and Slides will bullet point your ideas. See them fall into place one by one. Download our Process and Flows PowerPoint Templates because It will Strengthen your hand with your thoughts. They have all the aces you need to win the day. Download and present our Marketing PowerPoint Templates because Our PowerPoint Templates and Slides will let you Illuminate the road ahead to Pinpoint the important landmarks along the way.Use these PowerPoint slides for presentations relating to Business, circle, process, leadership, components, concept, presentation, teamwork, internet, template, diagram, scheme, report, marketing, technology, strategy, project, growth, progress, background. The prominent colors used in the PowerPoint template are Gray, White, Blue light. Convey your message in an exact manner. Enable accuracy with our Layers Arranged At Top Each Other 5 Stages Ppt Business Plan Online PowerPoint Slides.
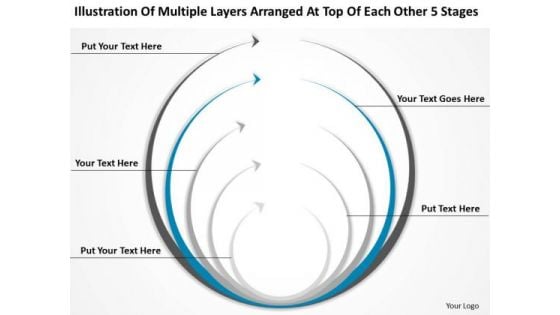
Layers Arranged At Top Each Other 5 Stages Ppt Business Plan PowerPoint Slides
We present our layers arranged at top each other 5 stages ppt business plan PowerPoint Slides.Download our Circle Charts PowerPoint Templates because Our PowerPoint Templates and Slides are Clear and concise. Use them and dispel any doubts your team may have. Present our Arrows PowerPoint Templates because Our PowerPoint Templates and Slides provide you with a vast range of viable options. Select the appropriate ones and just fill in your text. Download our Business PowerPoint Templates because It is Aesthetically crafted by artistic young minds. Our PowerPoint Templates and Slides are designed to display your dexterity. Download our Process and Flows PowerPoint Templates because Our PowerPoint Templates and Slides will provide you the cutting edge. Slice through the doubts in the minds of your listeners. Download our Marketing PowerPoint Templates because You have gained great respect for your brilliant ideas. Use our PowerPoint Templates and Slides to strengthen and enhance your reputation.Use these PowerPoint slides for presentations relating to Business, circle, process, leadership, components, concept, presentation, teamwork, internet, template, diagram, scheme, report, marketing, technology, strategy, project, growth, progress, background. The prominent colors used in the PowerPoint template are Blue, Gray, White. List your core competencies with our Layers Arranged At Top Each Other 5 Stages Ppt Business Plan PowerPoint Slides. They will make you look good.
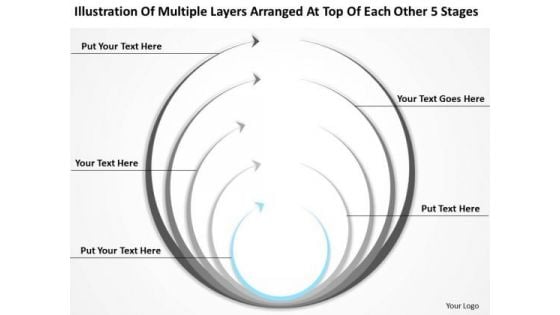
Layers Arranged At Top Each Other 5 Stages Ppt Formulating Business Plan PowerPoint Slides
We present our layers arranged at top each other 5 stages ppt formulating business plan PowerPoint Slides.Use our Circle Charts PowerPoint Templates because Our PowerPoint Templates and Slides will let you Leave a lasting impression to your audiences. They possess an inherent longstanding recall factor. Present our Arrows PowerPoint Templates because Our PowerPoint Templates and Slides will let you Leave a lasting impression to your audiences. They possess an inherent longstanding recall factor. Use our Business PowerPoint Templates because Timeline crunches are a fact of life. Meet all deadlines using our PowerPoint Templates and Slides. Download our Process and Flows PowerPoint Templates because Our PowerPoint Templates and Slides will help you be quick off the draw. Just enter your specific text and see your points hit home. Use our Marketing PowerPoint Templates because Our PowerPoint Templates and Slides will embellish your thoughts. See them provide the desired motivation to your team.Use these PowerPoint slides for presentations relating to Business, circle, process, leadership, components, concept, presentation, teamwork, internet, template, diagram, scheme, report, marketing, technology, strategy, project, growth, progress, background. The prominent colors used in the PowerPoint template are Gray, White, Blue light. Creat an attractive presentation with our Layers Arranged At Top Each Other 5 Stages Ppt Formulating Business Plan PowerPoint Slides. Dont pass up this opportunity to shine.
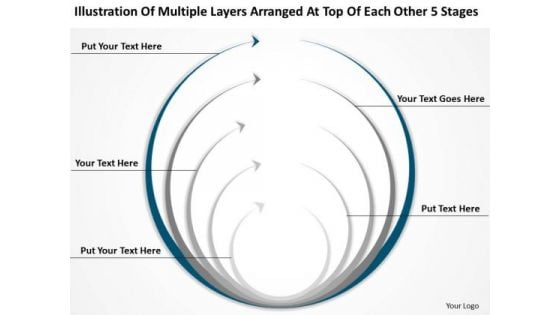
Layers Arranged At Top Each Other 5 Stages Ppt Free Business Plans Template PowerPoint Templates
We present our layers arranged at top each other 5 stages ppt free business plans template PowerPoint templates.Download and present our Circle Charts PowerPoint Templates because you should Experience excellence with our PowerPoint Templates and Slides. They will take your breath away. Present our Arrows PowerPoint Templates because our PowerPoint Templates and Slides are a looking glass. Train them on the magnificent future you have in mind. Download our Business PowerPoint Templates because It will Strengthen your hand with your thoughts. They have all the aces you need to win the day. Present our Process and Flows PowerPoint Templates because Our PowerPoint Templates and Slides will provide weight to your words. They will bring out the depth of your thought process. Download and present our Marketing PowerPoint Templates because you can Break through with our PowerPoint Templates and Slides. Bring down the mental barriers of your audience.Use these PowerPoint slides for presentations relating to Business, circle, process, leadership, components, concept, presentation, teamwork, internet, template, diagram, scheme, report, marketing, technology, strategy, project, growth, progress, background. The prominent colors used in the PowerPoint template are Gray, White, Blue navy. There are no mixed feelings about our Layers Arranged At Top Each Other 5 Stages Ppt Free Business Plans Template PowerPoint Templates. They are a definite asset for all.
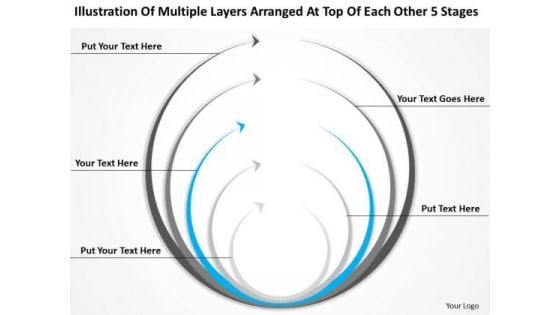
Layers Arranged At Top Each Other 5 Stages Ppt What Is In Business Plan PowerPoint Templates
We present our layers arranged at top each other 5 stages ppt what is in business plan PowerPoint templates.Download and present our Circle Charts PowerPoint Templates because You will get more than you ever bargained for. Present our Arrows PowerPoint Templates because You can Stir your ideas in the cauldron of our PowerPoint Templates and Slides. Cast a magic spell on your audience. Use our Business PowerPoint Templates because Our PowerPoint Templates and Slides will let Your superior ideas hit the target always and everytime. Present our Process and Flows PowerPoint Templates because Your audience will believe you are the cats whiskers. Download and present our Marketing PowerPoint Templates because Our PowerPoint Templates and Slides are truly out of this world. Even the MIB duo has been keeping tabs on our team.Use these PowerPoint slides for presentations relating to Business, circle, process, leadership, components, concept, presentation, teamwork, internet, template, diagram, scheme, report, marketing, technology, strategy, project, growth, progress, background. The prominent colors used in the PowerPoint template are Gray, White, Blue light. Make remarkable presentations with our Layers Arranged At Top Each Other 5 Stages Ppt What Is In Business Plan PowerPoint Templates. You'll always stay ahead of the game.
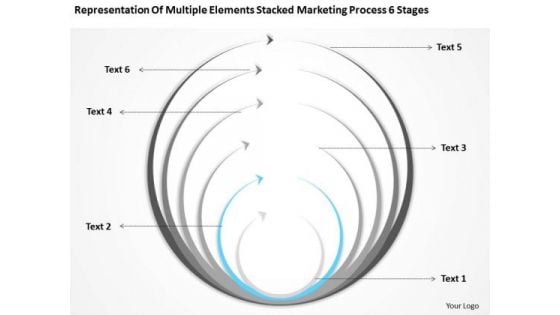
Stacked Marketing Process 6 Stages Ppt Business Plan PowerPoint Templates
We present our stacked marketing process 6 stages ppt business plan PowerPoint templates.Download and present our Circle Charts PowerPoint Templates because Our PowerPoint Templates and Slides team portray an attitude of elegance. Personify this quality by using them regularly. Use our Arrows PowerPoint Templates because Our PowerPoint Templates and Slides will provide you a launch platform. Give a lift off to your ideas and send them into orbit. Download our Business PowerPoint Templates because It will Strengthen your hand with your thoughts. They have all the aces you need to win the day. Download and present our Process and Flows PowerPoint Templates because You should Bet on your luck with our PowerPoint Templates and Slides. Be assured that you will hit the jackpot. Use our Marketing PowerPoint Templates because Our PowerPoint Templates and Slides will bullet point your ideas. See them fall into place one by one.Use these PowerPoint slides for presentations relating to Business, circle, process, leadership, components, concept, presentation, teamwork, internet, template, diagram, scheme, report, marketing, technology, strategy, project, growth, progress, background. The prominent colors used in the PowerPoint template are Gray, White, Blue light. Our Stacked Marketing Process 6 Stages Ppt Business Plan PowerPoint Templates cater for different factions. They assist in finding common ground.

Client Support Process Flowchart Ppt PowerPoint Presentation Complete Deck With Slides
This Client Support Process Flowchart Ppt PowerPoint Presentation Complete Deck With Slides acts as backup support for your ideas, vision, thoughts, etc. Use it to present a thorough understanding of the topic. This PPT slideshow can be utilized for both in-house and outside presentations depending upon your needs and business demands. Entailing tweleve slides with a consistent design and theme, this template will make a solid use case. As it is intuitively designed, it suits every business vertical and industry. All you have to do is make a few tweaks in the content or any other component to design unique presentations. The biggest advantage of this complete deck is that it can be personalized multiple times once downloaded. The color, design, shapes, and other elements are free to modify to add personal touches. You can also insert your logo design in this PPT layout. Therefore a well-thought and crafted presentation can be delivered with ease and precision by downloading this Client Support Process Flowchart Ppt PowerPoint Presentation Complete Deck With Slides PPT slideshow.
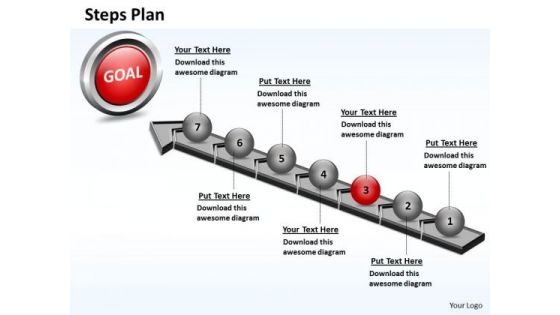
PowerPoint Slides Diagram Steps Plan 7 Stages Style 4 Ppt Design
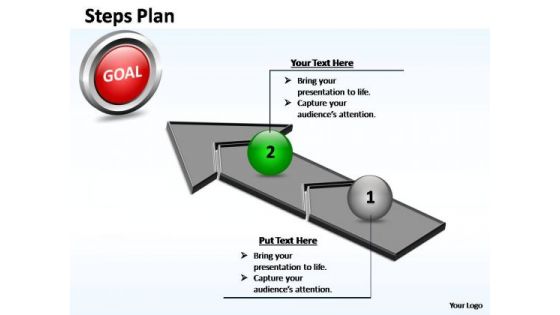
PowerPoint Slides Diagram Steps Plan 7 Stages Style 4 PPT Design-This Business Powerpoint Template Shows the one step which consists of seven stages to achieve the goal by using numbers. Use this another graphic design to represent a continuing sequence of stages, tasks, or events and emphasize the connection between all components.-PowerPoint Slides Diagram Steps Plan 7 Stages Style 4 PPT Design Calculate your growing success with our PowerPoint Slides Diagram Steps Plan 7 Stages Style 4 Ppt Design. You will come out on top.
PowerPoint Layout Diagram Steps Plan 2 Stages Style 4 Ppt Slide Designs
PowerPoint Layout Diagram Steps Plan 2 Stages Style 4 PPT Slide Designs-This Business Powerpoint Template Shows the one step which consists of two stages to achieve the goal by using numbers. Use this another graphic design to represent a continuing sequence of stages, tasks, or events and emphasize the connection between all components.-PowerPoint Layout Diagram Steps Plan 2 Stages Style 4 PPT Slide Designs Exhilirate your audience with our PowerPoint Layout Diagram Steps Plan 2 Stages Style 4 Ppt Slide Designs. Entertain them in your characteristic way.
Business Growth In New Year Globe Success PowerPoint Templates Ppt Backgrounds For Slides 1112
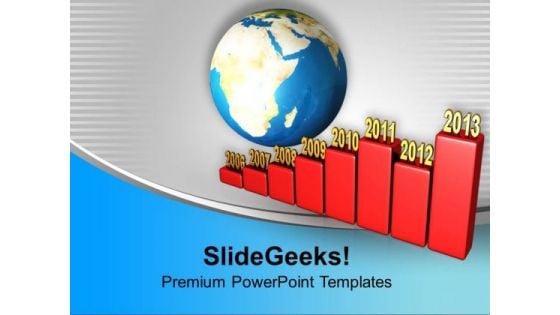
We present our Business Growth In New Year Globe Success PowerPoint Templates PPT Backgrounds For Slides 1112.Use our Business PowerPoint Templates because,The NASA Space programme took mankind to the moon and so much more. Like them you too can look far beyond normal boundaries. Show them that in your mind the sky is certainly not the limit Use our Future PowerPoint Templates because, Let this slide illustrates others piggyback on you to see well over the horizon Use our Holidays PowerPoint Templates because,Individual components well researched and understood in their place. Use our Global PowerPoint Templates because,So that you can Lead the way to spread good cheer to one and all. Use our Success PowerPoint Templates because,The choices you make today will determine the future growth of your enterprise. Use these PowerPoint slides for presentations relating to Growth in new year globe, success, future, business, holidays, global. The prominent colors used in the PowerPoint template are Red, White, Blue. Customers tell us our Business Growth In New Year Globe Success PowerPoint Templates PPT Backgrounds For Slides 1112 are Nostalgic. Professionals tell us our future PowerPoint templates and PPT Slides will generate and maintain the level of interest you desire. They will create the impression you want to imprint on your audience. PowerPoint presentation experts tell us our Business Growth In New Year Globe Success PowerPoint Templates PPT Backgrounds For Slides 1112 will get their audience's attention. PowerPoint presentation experts tell us our holidays PowerPoint templates and PPT Slides are Dazzling. Presenters tell us our Business Growth In New Year Globe Success PowerPoint Templates PPT Backgrounds For Slides 1112 are Dazzling. Professionals tell us our success PowerPoint templates and PPT Slides are Zippy. Aim at your target with our Business Growth In New Year Globe Success PowerPoint Templates Ppt Backgrounds For Slides 1112. You will come out on top.
Workflow Of Cloud Cryptography Data Security In Cloud Computing Ppt Example
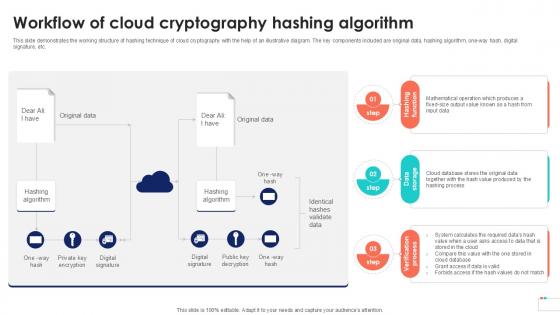
This slide demonstrates the working structure of hashing technique of cloud cryptography with the help of an illustrative diagram. The key components included are original data, hashing algorithm, one-way hash, digital signature, etc. If you are looking for a format to display your unique thoughts, then the professionally designed Workflow Of Cloud Cryptography Data Security In Cloud Computing Ppt Example is the one for you. You can use it as a Google Slides template or a PowerPoint template. Incorporate impressive visuals, symbols, images, and other charts. Modify or reorganize the text boxes as you desire. Experiment with shade schemes and font pairings. Alter, share or cooperate with other people on your work. Download Workflow Of Cloud Cryptography Data Security In Cloud Computing Ppt Example and find out how to give a successful presentation. Present a perfect display to your team and make your presentation unforgettable. This slide demonstrates the working structure of hashing technique of cloud cryptography with the help of an illustrative diagram. The key components included are original data, hashing algorithm, one-way hash, digital signature, etc.
Digital Category Marketing Strategy Dashboard With Leads Conversation Ppt PowerPoint Presentation Slides Information PDF
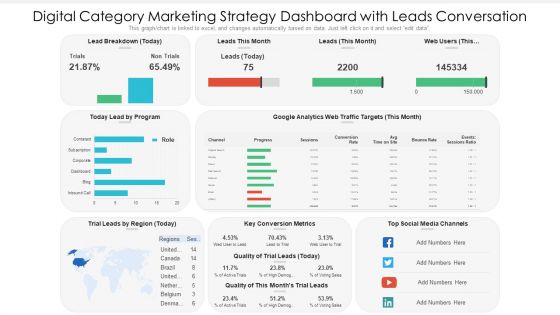
This graph chart is linked to excel, and changes automatically based on data. Just left click on it and select edit data. Pitch your topic with ease and precision using this digital category marketing strategy dashboard with leads conversation ppt powerpoint presentation slides information pdf. This layout presents information on key conversion metrics, social media channels, lead by program. It is also available for immediate download and adjustment. So, changes can be made in the color, design, graphics or any other component to create a unique layout.
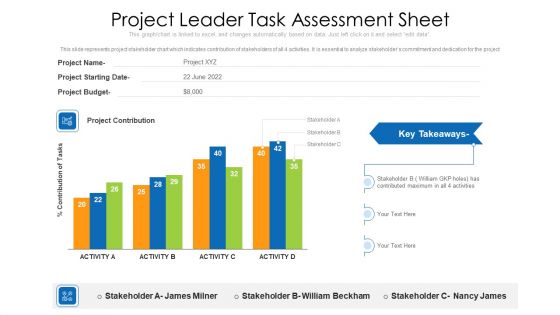
Project Leader Task Assessment Sheet Ppt PowerPoint Presentation Gallery Outline PDF
This slide represents project stakeholder chart which indicates contribution of stakeholders of all 4 activities. It is essential to analyze stakeholders commitment and dedication for the project. Pitch your topic with ease and precision using this project leader task assessment sheet ppt powerpoint presentation gallery outline pdf. This layout presents information on project leader task assessment sheet. It is also available for immediate download and adjustment. So, changes can be made in the color, design, graphics or any other component to create a unique layout.
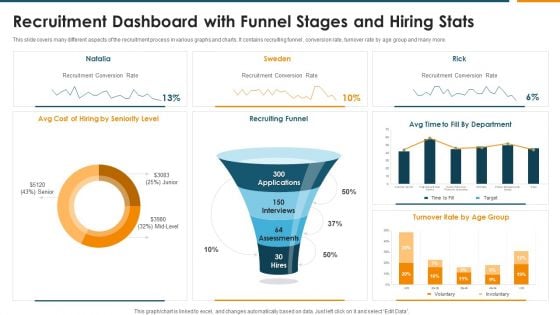
Recruitment Dashboard With Funnel Stages And Hiring Stats Rules PDF
This slide covers many different aspects of the recruitment process in various graphs and charts. It contains recruiting funnel , conversion rate, turnover rate by age group and many more. Pitch your topic with ease and precision using this Recruitment Dashboard With Funnel Stages And Hiring Stats Rules PDF. This layout presents information on Recruiting Funnel, Recruitment Conversion Rate, Seniority Level. It is also available for immediate download and adjustment. So, changes can be made in the color, design, graphics or any other component to create a unique layout.
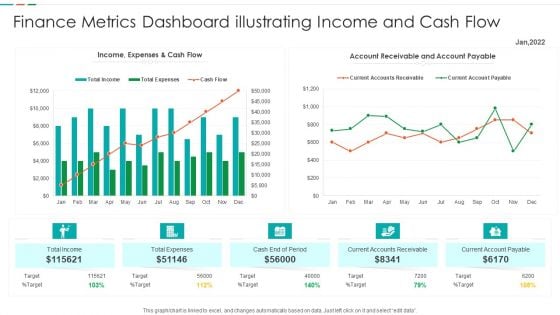
Finance Metrics Dashboard Illustrating Income And Cash Flow Template PDF
This graph or chart is linked to excel, and changes automatically based on data. Just left click on it and select edit data. Pitch your topic with ease and precision using this Finance Metrics Dashboard Illustrating Income And Cash Flow Template PDF. This layout presents information on Current Accounts Receivable, Current Account Payable, Cash End Period, Account Receivable Account. It is also available for immediate download and adjustment. So, changes can be made in the color, design, graphics or any other component to create a unique layout.
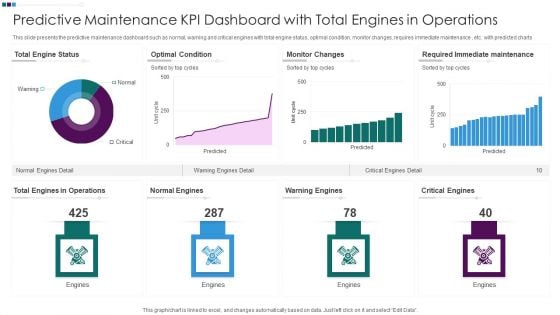
Predictive Maintenance KPI Dashboard With Total Engines In Operations Ppt Professional Inspiration PDF
This slide presents the predictive maintenance dashboard such as normal, warning and critical engines with total engine status, optimal condition, monitor changes, requires immediate maintenance , etc. with predicted charts. Pitch your topic with ease and precision using this Predictive Maintenance KPI Dashboard With Total Engines In Operations Ppt Professional Inspiration PDF. This layout presents information on Total Engine Status, Optimal Condition Monitor, Changes Warning Engines, Required Immediate Maintenance. It is also available for immediate download and adjustment. So, changes can be made in the color, design, graphics or any other component to create a unique layout.
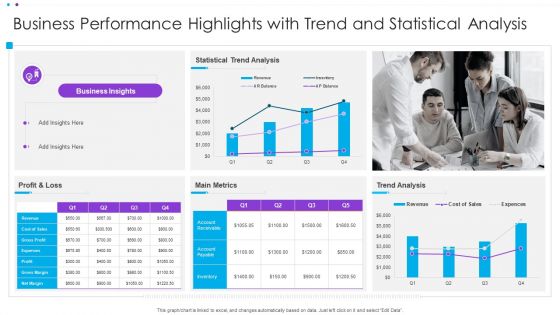
Business Performance Highlights With Trend And Statistical Analysis Ppt Infographic Template Display PDF
This graph or chart is linked to excel, and changes automatically based on data. Just left click on it and select Edit Data. Pitch your topic with ease and precision using this Business Performance Highlights With Trend And Statistical Analysis Ppt Infographic Template Display PDF. This layout presents information on Statistical Trend Analysis, Main Metrics, Profit And Loss. It is also available for immediate download and adjustment. So, changes can be made in the color, design, graphics or any other component to create a unique layout.
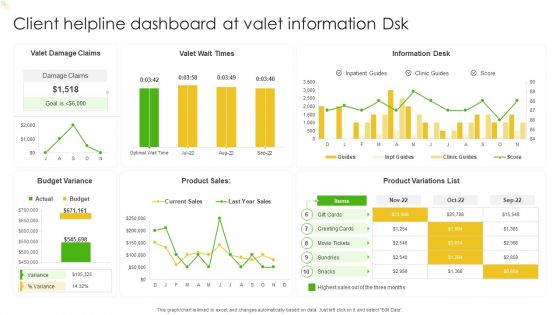
Client Helpline Dashboard At Valet Information Dsk Ppt Gallery Slide Portrait PDF
This graph or chart is linked to excel, and changes automatically based on data. Just left click on it and select Edit Data. Pitch your topic with ease and precision using this Client Helpline Dashboard At Valet Information Dsk Ppt Gallery Slide Portrait PDF. This layout presents information on Valet Damage Claims, Valet Wait Times, Information Desk. It is also available for immediate download and adjustment. So, changes can be made in the color, design, graphics or any other component to create a unique layout.
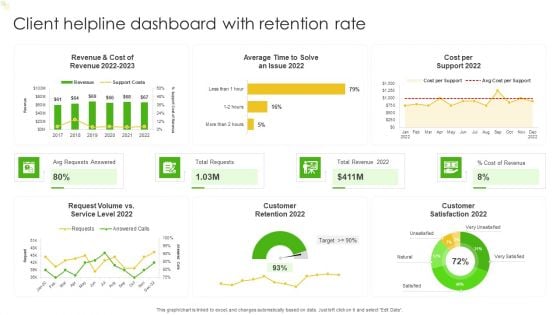
Client Helpline Dashboard With Retention Rate Ppt Gallery Ideas PDF
This graph or chart is linked to excel, and changes automatically based on data. Just left click on it and select Edit Data. Pitch your topic with ease and precision using this Client Helpline Dashboard With Retention Rate Ppt Gallery Ideas PDF. This layout presents information on Cost per Support 2022, Total Requests, Total Revenue 2022, Avg Requests Answered. It is also available for immediate download and adjustment. So, changes can be made in the color, design, graphics or any other component to create a unique layout.
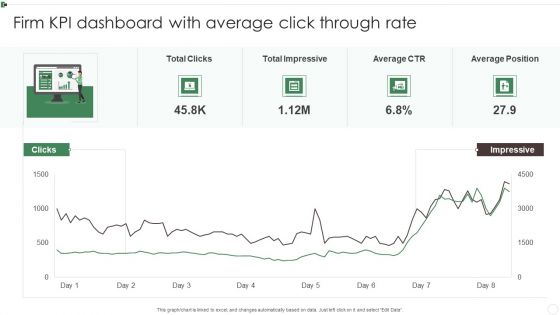
Firm KPI Dashboard With Average Click Through Rate Ppt Inspiration Sample PDF
This graph or chart is linked to excel, and changes automatically based on data. Just left click on it and select Edit Data. Pitch your topic with ease and precision using this Firm KPI Dashboard With Average Click Through Rate Ppt Inspiration Sample PDF. This layout presents information on Total Clicks, Total Impressive, Average CTR, Average Position. It is also available for immediate download and adjustment. So, changes can be made in the color, design, graphics or any other component to create a unique layout.

Firm KPI Dashboard With Schedule Performance Index Ppt Visual Aids PDF
This graph or chart is linked to excel, and changes automatically based on data. Just left click on it and select Edit Data. Pitch your topic with ease and precision using this Firm KPI Dashboard With Schedule Performance Index Ppt Visual Aids PDF. This layout presents information on Project Cost Performance, Project Planning Stage, Monitor And Control. It is also available for immediate download and adjustment. So, changes can be made in the color, design, graphics or any other component to create a unique layout.
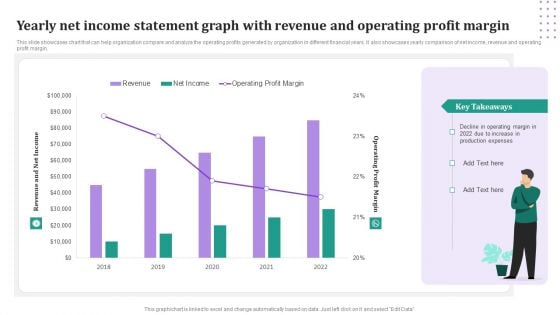
Yearly Net Income Statement Graph With Revenue And Operating Profit Margin Download PDF
This slide showcases chart that can help organization compare and analyze the operating profits generated by organization in different financial years. It also showcases yearly comparison of net income, revenue and operating profit margin. Pitch your topic with ease and precision using this Yearly Net Income Statement Graph With Revenue And Operating Profit Margin Download PDF. This layout presents information on Revenue, Net Income, Operating Profit Margin. It is also available for immediate download and adjustment. So, changes can be made in the color, design, graphics or any other component to create a unique layout.
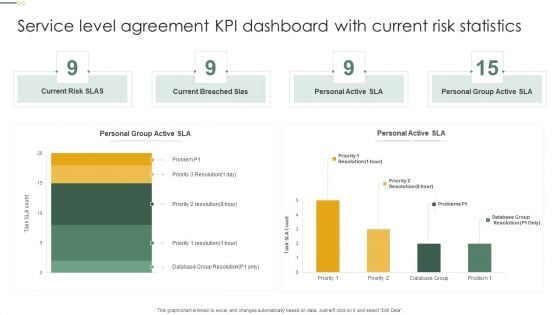
Service Level Agreement KPI Dashboard With Current Risk Statistics Topics PDF
This graph or chart is linked to excel, and changes automatically based on data. Just left click on it and select Edit Data. Pitch your topic with ease and precision using this Service Level Agreement KPI Dashboard With Current Risk Statistics Topics PDF. This layout presents information on Current Risk SLAS, Current Breached Slas, Personal Active SLA It is also available for immediate download and adjustment. So, changes can be made in the color, design, graphics or any other component to create a unique layout.
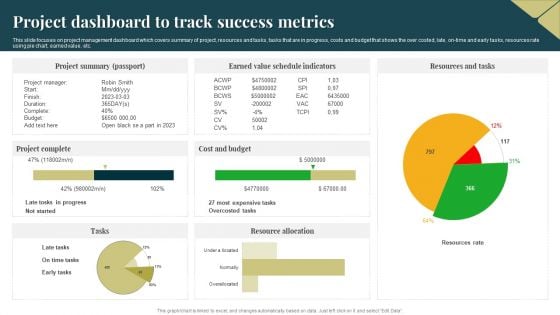
Project Dashboard To Track Success Metrics Background PDF
This slide focuses on project management dashboard which covers summary of project, resources and tasks, tasks that are in progress, costs and budget that shows the over costed, late, on time and early tasks, resources rate using pie chart, earned value, etc. Pitch your topic with ease and precision using this Project Dashboard To Track Success Metrics Background PDF. This layout presents information on Cost And Budget, Project Summary, Resource Allocation. It is also available for immediate download and adjustment. So, changes can be made in the color, design, graphics or any other component to create a unique layout.
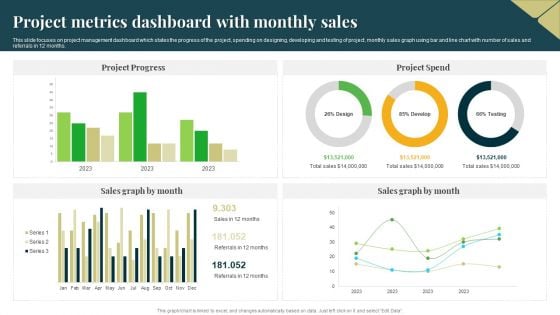
Project Metrics Dashboard With Monthly Sales Professional PDF
This slide focuses on project management dashboard which states the progress of the project, spending on designing, developing and testing of project, monthly sales graph using bar and line chart with number of sales and referrals in 12 months. Pitch your topic with ease and precision using this Project Metrics Dashboard With Monthly Sales Professional PDF. This layout presents information on Project Progress, Project Spend, Sales Graph. It is also available for immediate download and adjustment. So, changes can be made in the color, design, graphics or any other component to create a unique layout.
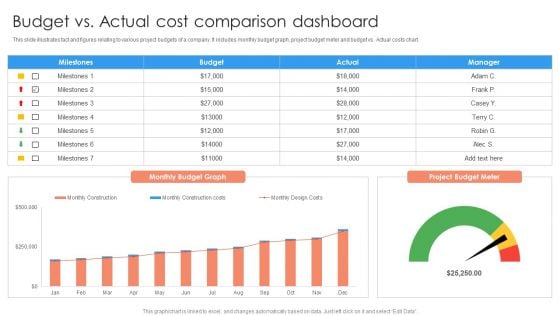
Budget Vs Actual Cost Comparison Dashboard Ppt PowerPoint Presentation Professional Format Ideas PDF
This slide illustrates fact and figures relating to various project budgets of a company. It includes monthly budget graph, project budget meter and budget vs. Actual costs chart.Pitch your topic with ease and precision using this Budget Vs Actual Cost Comparison Dashboard Ppt PowerPoint Presentation Professional Format Ideas PDF. This layout presents information on Milestones, Budget Graph, Manager. It is also available for immediate download and adjustment. So, changes can be made in the color, design, graphics or any other component to create a unique layout.
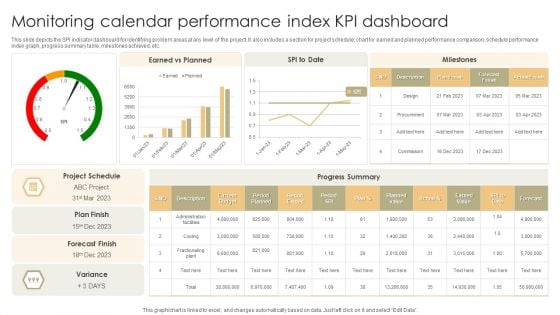
Monitoring Calendar Performance Index KPI Dashboard Slides PDF
This slide depicts the SPI indicator dashboard for identifying problem areas at any level of the project. It also includes a section for project schedule, chart for earned and planned performance comparison, schedule performance index graph, progress summary table, milestones achieved, etc. Pitch your topic with ease and precision using this Monitoring Calendar Performance Index KPI Dashboard Slides PDF. This layout presents information on Current Budget, Planned Value, Earned Value. It is also available for immediate download and adjustment. So, changes can be made in the color, design, graphics or any other component to create a unique layout.
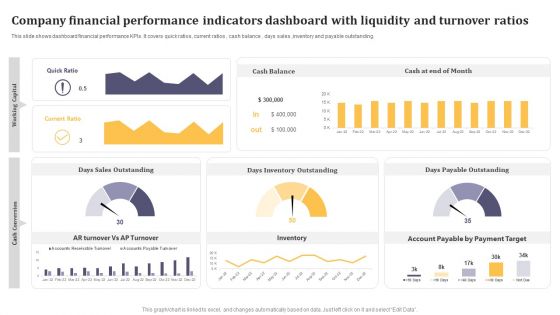
Company Financial Performance Indicators Dashboard With Liquidity And Turnover Ratios Formats PDF
This graph or chart is linked to excel, and changes automatically based on data. Just left click on it and select Edit Data. Pitch your topic with ease and precision using this Company Financial Performance Indicators Dashboard With Liquidity And Turnover Ratios Formats PDF. This layout presents information on Cash Balance, Days Inventory Outstanding, Days Payable Outstanding. It is also available for immediate download and adjustment. So, changes can be made in the color, design, graphics or any other component to create a unique layout.
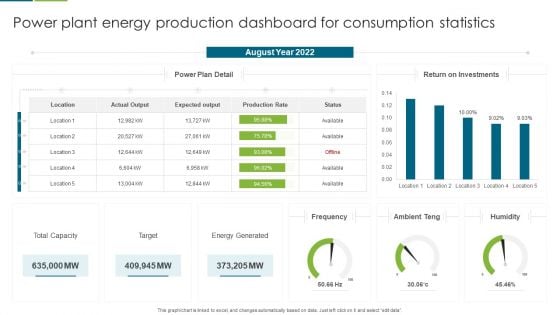
Power Plant Energy Production Dashboard For Consumption Statistics Download PDF
This graph or chart is linked to excel, and changes automatically based on data. Just left click on it and select edit data. Pitch your topic with ease and precision using this Multiple Country Energy Consumption Statistics Comparison Dashboard Formats PDF. This layout presents information on August Year 2022, Return on Investments, Power Plan Detail . It is also available for immediate download and adjustment. So, changes can be made in the color, design, graphics or any other component to create a unique layout.
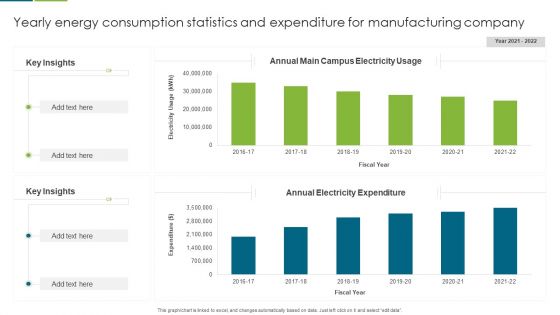
Yearly Energy Consumption Statistics And Expenditure For Manufacturing Company Guidelines PDF
This graph or chart is linked to excel, and changes automatically based on data. Just left click on it and select edit data. Pitch your topic with ease and precision using this Yearly Energy Consumption Statistics And Expenditure For Manufacturing Company Guidelines PDF. This layout presents information on Key Insights, Annual Electricity Expenditure, Annual Main Campus, Electricity Usage. It is also available for immediate download and adjustment. So, changes can be made in the color, design, graphics or any other component to create a unique layout.
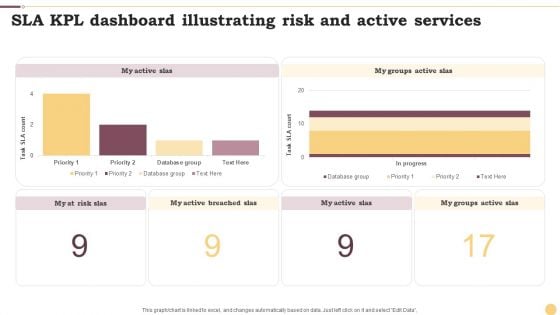
SLA KPL Dashboard Illustrating Risk And Active Services Ppt Portfolio Design Inspiration PDF
This graph or chart is linked to excel, and changes automatically based on data. Just left click on it and select Edit Data. Pitch your topic with ease and precision using this SLA KPL Dashboard Illustrating Risk And Active Services Ppt Portfolio Design Inspiration PDF. This layout presents information on My Active SLAs, Database Group, Priority. It is also available for immediate download and adjustment. So, changes can be made in the color, design, graphics or any other component to create a unique layout.
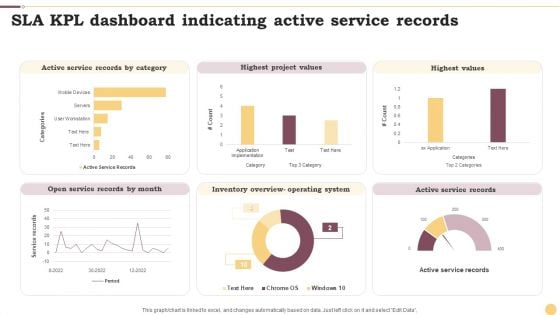
SLA KPL Dashboard Indicating Active Service Records Ppt Professional Graphics Example PDF
This graph or chart is linked to excel, and changes automatically based on data. Just left click on it and select Edit Data. Pitch your topic with ease and precision using this SLA KPL Dashboard Indicating Active Service Records Ppt Professional Graphics Example PDF. This layout presents information on Active Service Records, Highest Project Values, Highest Values. It is also available for immediate download and adjustment. So, changes can be made in the color, design, graphics or any other component to create a unique layout.
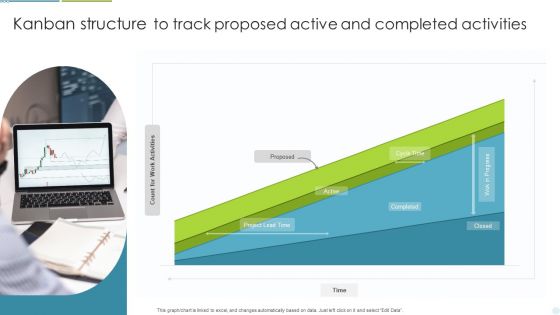
Kanban Structure To Track Proposed Active And Completed Activities Ppt Outline Slide Portrait PDF
This graph or chart is linked to excel, and changes automatically based on data. Just left click on it and select Edit Data. Pitch your topic with ease and precision using this Kanban Structure To Track Proposed Active And Completed Activities Ppt Outline Slide Portrait PDF. This layout presents information on Project Lead Time, Cycle Time, Completed. It is also available for immediate download and adjustment. So, changes can be made in the color, design, graphics or any other component to create a unique layout.
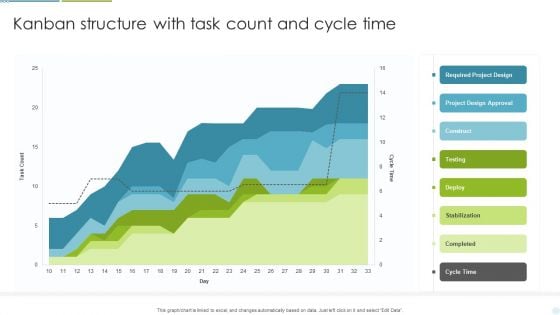
Kanban Structure With Task Count And Cycle Time Ppt Layouts Background Designs PDF
This graph or chart is linked to excel, and changes automatically based on data. Just left click on it and select Edit Data. Pitch your topic with ease and precision using this Kanban Structure With Task Count And Cycle Time Ppt Layouts Background Designs PDF. This layout presents information on Required Project Design, Project Design Approval, Construct. It is also available for immediate download and adjustment. So, changes can be made in the color, design, graphics or any other component to create a unique layout.
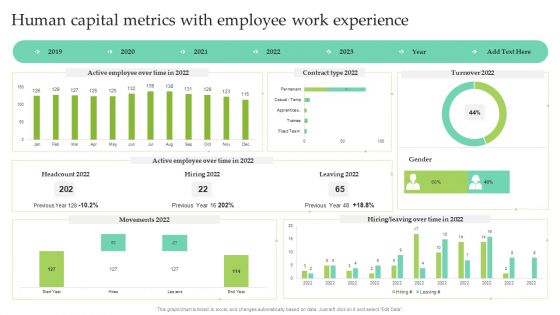
Human Capital Metrics With Employee Work Experience Ppt Show Images PDF
This graph or chart is linked to excel, and changes automatically based on data. Just left click on it and select Edit Data. Pitch your topic with ease and precision using this Human Capital Metrics With Employee Work Experience Ppt Show Images PDF. This layout presents information on Active Employee, Over Time, Contract Type 2022, Leaving 2022. It is also available for immediate download and adjustment. So, changes can be made in the color, design, graphics or any other component to create a unique layout.
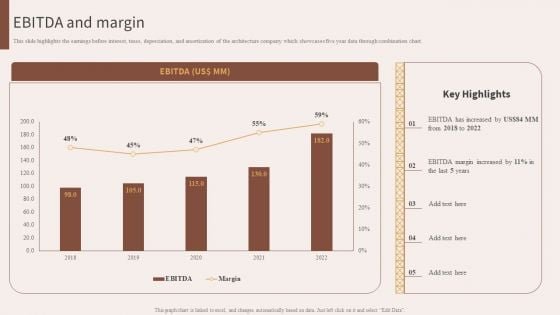
Architecture Engineering Planning Services Company EBITDA And Margin Guidelines PDF
This slide highlights the earnings before interest, taxes, depreciation, and amortization of the architecture company which showcases five year data through combination chart. This Architecture Engineering Planning Services Company EBITDA And Margin Guidelines PDF from Slidegeeks makes it easy to present information on your topic with precision. It provides customization options, so you can make changes to the colors, design, graphics, or any other component to create a unique layout. It is also available for immediate download, so you can begin using it right away. Slidegeeks has done good research to ensure that you have everything you need to make your presentation stand out. Make a name out there for a brilliant performance.
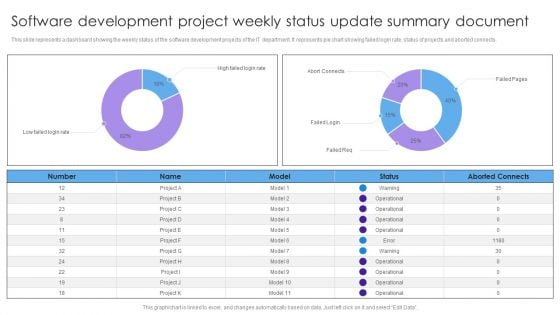
Software Development Project Weekly Status Update Summary Document Inspiration PDF
This slide represents a dashboard showing the weekly status of the software development projects of the IT department. It represents pie chart showing failed login rate, status of projects and aborted connects. Pitch your topic with ease and precision using this Software Development Project Weekly Status Update Summary Document Inspiration PDF. This layout presents information on High Failed, Login Rate, Abort Connects, Failed Login. It is also available for immediate download and adjustment. So, changes can be made in the color, design, graphics or any other component to create a unique layout.
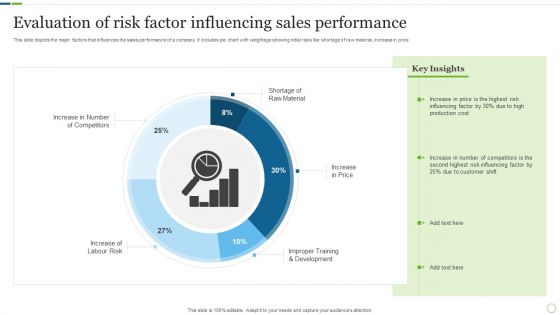
Evaluation Of Risk Factor Influencing Sales Performance Inspiration PDF
This slide depicts the major factors that influences the sales performance of a company. It includes pie chart with weightage showing initial risks like shortage of raw material, increase in price. Pitch your topic with ease and precision using this Evaluation Of Risk Factor Influencing Sales Performance Inspiration PDF. This layout presents information on Production Cost, Customer Shift, Risk Influencing. It is also available for immediate download and adjustment. So, changes can be made in the color, design, graphics or any other component to create a unique layout.
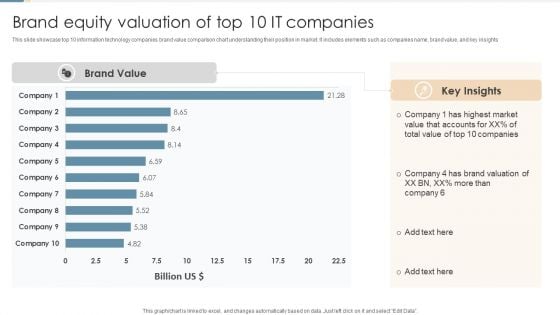
Brand Equity Valuation Of Top 10 IT Companies Ppt Portfolio Rules PDF
This slide showcase top 10 information technology companies brand value comparison chart understanding their position in market. It includes elements such as companies name, brand value, and key insights. Pitch your topic with ease and precision using this Brand Equity Valuation Of Top 10 IT Companies Ppt Portfolio Rules PDF. This layout presents information on Highest Market Value, Total Value, Brand Valuation. It is also available for immediate download and adjustment. So, changes can be made in the color, design, graphics or any other component to create a unique layout.
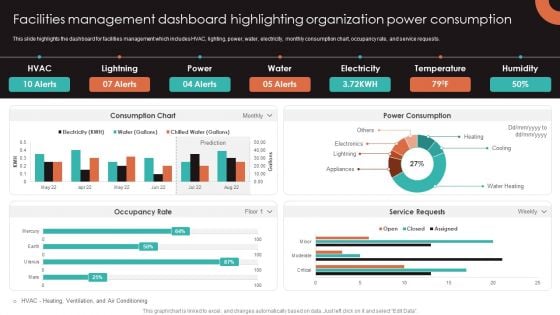
Facilities Management Dashboard Highlighting Organization Power Consumption Background PDF
This slide highlights the dashboard for facilities management which includes HVAC, lighting, power, water, electricity, monthly consumption chart, occupancy rate, and service requests. This Facilities Management Dashboard Highlighting Organization Power Consumption Background PDF from Slidegeeks makes it easy to present information on your topic with precision. It provides customization options, so you can make changes to the colors, design, graphics, or any other component to create a unique layout. It is also available for immediate download, so you can begin using it right away. Slidegeeks has done good research to ensure that you have everything you need to make your presentation stand out. Make a name out there for a brilliant performance.
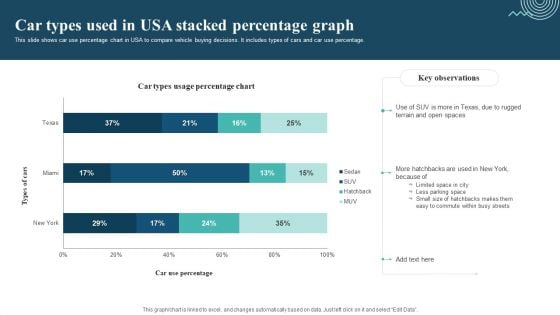
Car Types Used In Usa Stacked Percentage Graph Sample PDF
This slide shows car use percentage chart in USA to compare vehicle buying decisions. It includes types of cars and car use percentage. Pitch your topic with ease and precision using this Car Types Used In Usa Stacked Percentage Graph Sample PDF. This layout presents information on Limited Space In City, Less Parking Space, Easy To Commute. It is also available for immediate download and adjustment. So, changes can be made in the color, design, graphics or any other component to create a unique layout.
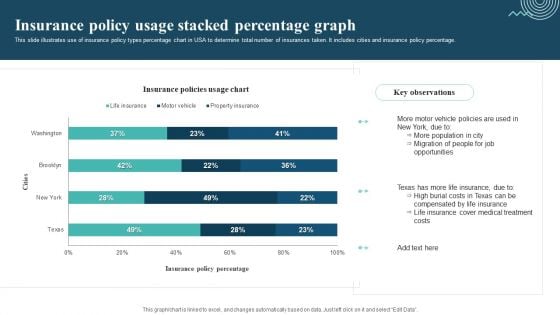
Insurance Policy Usage Stacked Percentage Graph Template PDF
This slide illustrates use of insurance policy types percentage chart in USA to determine total number of insurances taken. It includes cities and insurance policy percentage. Pitch your topic with ease and precision using this Insurance Policy Usage Stacked Percentage Graph Template PDF. This layout presents information on Motor Vehicle Policies, More Population, Migration Of People. It is also available for immediate download and adjustment. So, changes can be made in the color, design, graphics or any other component to create a unique layout.
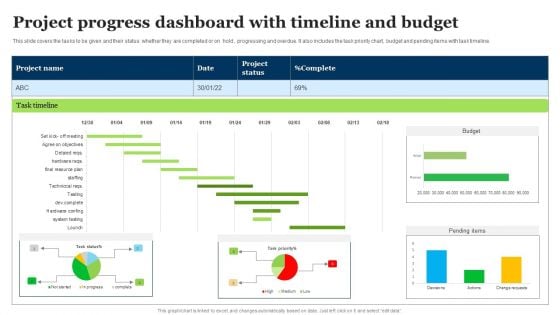
Project Progress Dashboard With Timeline And Budget Mockup PDF
This slide covers the tasks to be given and their status whether they are completed or on hold , progressing and overdue. It also includes the task priority chart, budget and pending items with task timeline. Pitch your topic with ease and precision using this Project Progress Dashboard With Timeline And Budget Mockup PDF. This layout presents information on Task Timeline, Project Status, Pending Items. It is also available for immediate download and adjustment. So, changes can be made in the color, design, graphics or any other component to create a unique layout.

Term Life Insurance Plan Claims Management Dashboard Portrait PDF
This slide illustrates facts and figures related to status of total claims and closed claims made in an insurance company. It includes yearly claim status pie-chart, total claims quarter-wise and total closed claims quarter-wise. Pitch your topic with ease and precision using this Term Life Insurance Plan Claims Management Dashboard Portrait PDF. This layout presents information on Yearly Claim Status, Total Claims, Quarter Wise. It is also available for immediate download and adjustment. So, changes can be made in the color, design, graphics or any other component to create a unique layout.
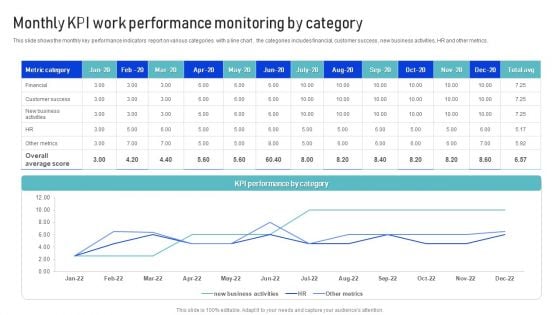
Monthly KPI Work Performance Monitoring By Category Microsoft PDF
This slide shows the monthly key performance indicators report on various categories with a line chart . the categories includes financial, customer success , new business activities, HR and other metrics. Pitch your topic with ease and precision using this Monthly KPI Work Performance Monitoring By Category Microsoft PDF. This layout presents information on Metrics, Financial, Customer Success. It is also available for immediate download and adjustment. So, changes can be made in the color, design, graphics or any other component to create a unique layout.
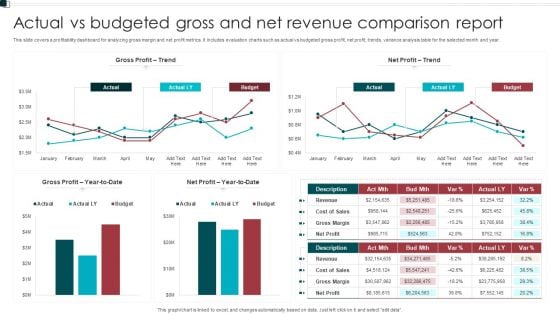
Actual Vs Budgeted Gross And Net Revenue Comparison Report Sample PDF
This slide covers a profitability dashboard for analyzing gross margin and net profit metrics. It includes evaluation charts such as actual vs budgeted gross profit, net profit, trends, variance analysis table for the selected month and year. Pitch your topic with ease and precision using this Actual Vs Budgeted Gross And Net Revenue Comparison Report Sample PDF. This layout presents information on Gross Profit, Net Profit, Budget. It is also available for immediate download and adjustment. So, changes can be made in the color, design, graphics or any other component to create a unique layout.
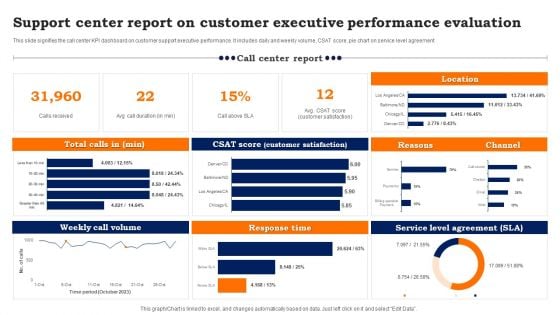
Support Center Report On Customer Executive Performance Evaluation Background PDF
This slide signifies the call center KPI dashboard on customer support executive performance. It includes daily and weekly volume, CSAT score, pie chart on service level agreement. Pitch your topic with ease and precision using this Support Center Report On Customer Executive Performance Evaluation Background PDF. This layout presents information on Weekly Call Volume, Response Time, Service Level Agreement. It is also available for immediate download and adjustment. So, changes can be made in the color, design, graphics or any other component to create a unique layout.
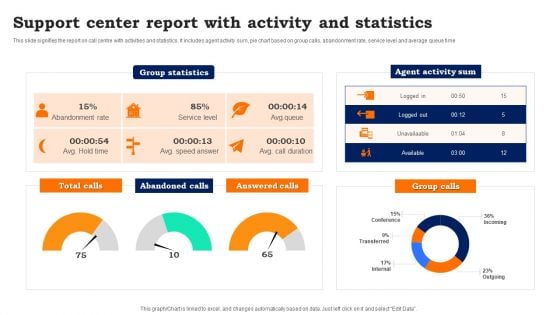
Support Center Report With Activity And Statistics Guidelines PDF
This slide signifies the report on call centre with activities and statistics. It includes agent activity sum, pie chart based on group calls, abandonment rate, service level and average queue time. Pitch your topic with ease and precision using this Support Center Report With Activity And Statistics Guidelines PDF. This layout presents information on Support Center Report, Activity And Statistics. It is also available for immediate download and adjustment. So, changes can be made in the color, design, graphics or any other component to create a unique layout.
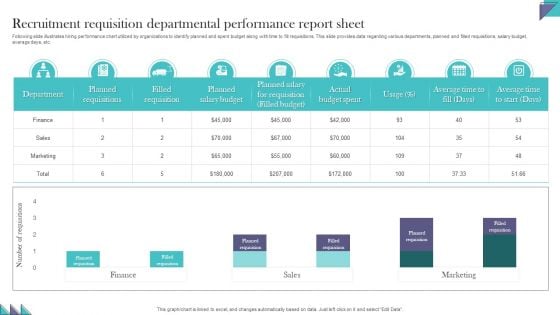
Recruitment Requisition Departmental Performance Report Sheet Demonstration PDF
Following slide illustrates hiring performance chart utilized by organizations to identify planned and spent budget along with time to fill requisitions. This slide provides data regarding various departments, planned and filled requisitions, salary budget, average days, etc. Pitch your topic with ease and precision using this Recruitment Requisition Departmental Performance Report Sheet Demonstration PDF. This layout presents information on Recruitment Requisition, Departmental Performance, Report Sheet. It is also available for immediate download and adjustment. So, changes can be made in the color, design, graphics or any other component to create a unique layout.
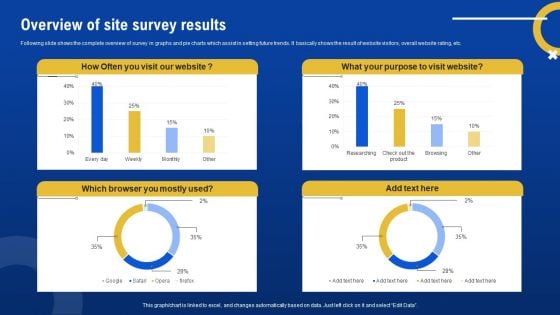
Overview Of Site Survey Results Survey SS
Following slide shows the complete overview of survey in graphs and pie charts which assist in setting future trends. It basically shows the result of website visitors, overall website rating, etc. Pitch your topic with ease and precision using this Overview Of Site Survey Results Survey SS. This layout presents information on Overview, Site Survey Results. It is also available for immediate download and adjustment. So, changes can be made in the color, design, graphics or any other component to create a unique layout.
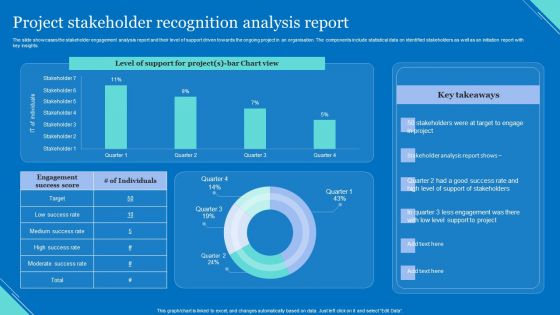
Project Stakeholder Recognition Analysis Report Elements PDF
The slide showcases the stakeholder engagement analysis report and their level of support driven towards the ongoing project in an organisation. The components include statistical data on identified stakeholders as well as an initiation report with key insights. Showcasing this set of slides titled Project Stakeholder Recognition Analysis Report Elements PDF. The topics addressed in these templates are Level Support, Chart View, Support Stakeholders. All the content presented in this PPT design is completely editable. Download it and make adjustments in color, background, font etc. as per your unique business setting.

 Home
Home