Organizational Icons
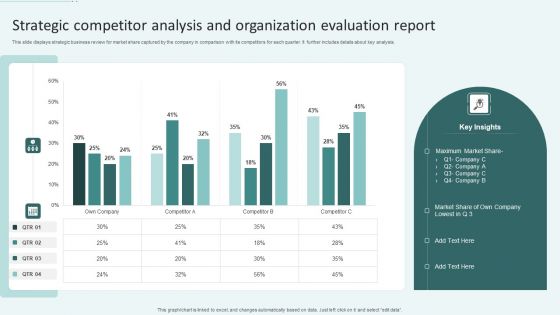
Strategic Competitor Analysis And Organization Evaluation Report Ppt Ideas Clipart Images PDF
This slide displays strategic business review for market share captured by the company in comparison with its competitors for each quarter. It further includes details about key analysis. Pitch your topic with ease and precision using this Strategic Competitor Analysis And Organization Evaluation Report Ppt Ideas Clipart Images PDF. This layout presents information on Maximum Market Share, Key Insights. It is also available for immediate download and adjustment. So, changes can be made in the color, design, graphics or any other component to create a unique layout.

Actual Time Marketing Advantages For Companies And Agencies Ppt PowerPoint Presentation File Information PDF
The slide illustrates a company report highlighting the benefits from investing in a real-time marketing program for responding quickly to the trends. Various advantages included are increases customer experience, boosts customer retention rate, better conversion rates, etc. Pitch your topic with ease and precision using this Actual Time Marketing Advantages For Companies And Agencies Ppt PowerPoint Presentation File Information PDF. This layout presents information on Increases Customer Experience, Better Conversion Rates, Improved Brand Perception, Facilitates Personalization. It is also available for immediate download and adjustment. So, changes can be made in the color, design, graphics or any other component to create a unique layout.

KPI Dashboard Of Managing Innovative Business Project Ppt Pictures Show PDF
This slide shows the KPI dashboard of innovation project management. It covers the following KPIs such as innovation success rate, value in project, total revenue, active projects, etc. Pitch your topic with ease and precision using this KPI Dashboard Of Managing Innovative Business Project Ppt Pictures Show PDF. This layout presents information on Innovation Success Rate, Total Active Projects, Amount Mission. It is also available for immediate download and adjustment. So, changes can be made in the color, design, graphics or any other component to create a unique layout.
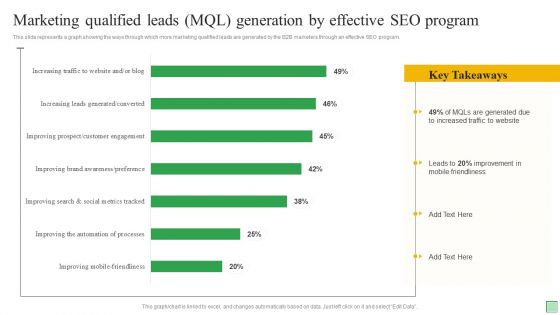
Marketing Qualified Leads MQL Generation By Effective SEO Program Ppt Slides Example Topics PDF
This slide represents a graph showing the ways through which more marketing qualified leads are generated by the B2B marketers through an effective SEO program. Pitch your topic with ease and precision using this Marketing Qualified Leads MQL Generation By Effective SEO Program Ppt Slides Example Topics PDF. This layout presents information on Mobile Friendliness, Due To Increased, Traffic To Website. It is also available for immediate download and adjustment. So, changes can be made in the color, design, graphics or any other component to create a unique layout.
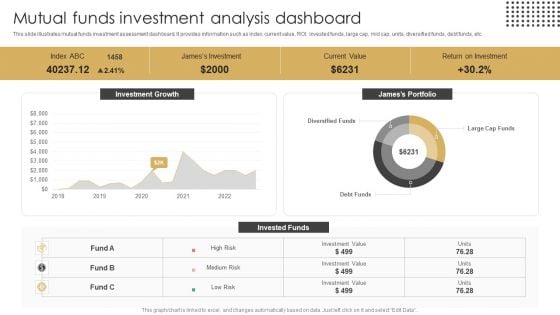
Mutual Funds Investment Analysis Dashboard Ppt Outline Background Images PDF
This slide illustrates mutual funds investment assessment dashboard. It provides information such as index, current value, ROI, invested funds, large cap, mid cap, units, diversified funds, debt funds, etc. Pitch your topic with ease and precision using this Mutual Funds Investment Analysis Dashboard Ppt Outline Background Images PDF. This layout presents information on Current Value, Return On Investment, Jamess Portfolio. It is also available for immediate download and adjustment. So, changes can be made in the color, design, graphics or any other component to create a unique layout.
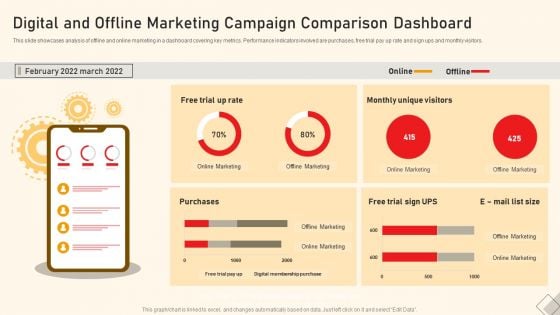
Digital And Offline Marketing Campaign Comparison Dashboard Ppt Inspiration Microsoft PDF
This slide showcases analysis of offline and online marketing in a dashboard covering key metrics. Performance indicators involved are purchases, free trial pay up rate and sign ups and monthly visitors. Pitch your topic with ease and precision using this Digital And Offline Marketing Campaign Comparison Dashboard Ppt Inspiration Microsoft PDF. This layout presents information on Online Marketing, Offline Marketing, Free Trial Sign, UPS. It is also available for immediate download and adjustment. So, changes can be made in the color, design, graphics or any other component to create a unique layout.
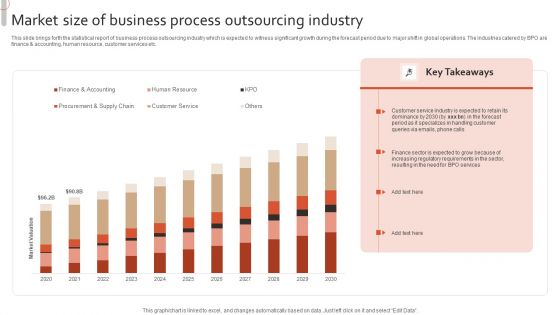
Market Size Of Business Process Outsourcing Industry Structure PDF
This slide brings forth the statistical report of business process outsourcing industry which is expected to witness significant growth during the forecast period due to major shift in global operations. The industries catered by BPO are finance and accounting, human resource, customer services etc. Pitch your topic with ease and precision using this Market Size Of Business Process Outsourcing Industry Structure PDF. This layout presents information on Customer Service, Phone Calls, Queries Via Emails. It is also available for immediate download and adjustment. So, changes can be made in the color, design, graphics or any other component to create a unique layout.
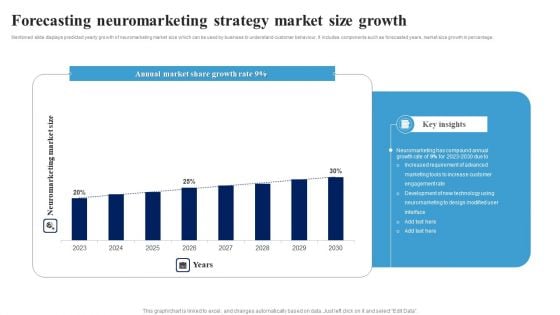
Forecasting Neuromarketing Strategy Market Size Growth Ppt Ideas Slideshow PDF
Mentioned slide displays predicted yearly growth of neuromarketing market size which can be used by business to understand customer behaviour. It includes components such as forecasted years, market size growth in percentage. Showcasing this set of slides titled Forecasting Neuromarketing Strategy Market Size Growth Ppt Ideas Slideshow PDF. The topics addressed in these templates are Annual Market Share, Growth Rate, Neuromarketing Compound, Annual Growth Rate. All the content presented in this PPT design is completely editable. Download it and make adjustments in color, background, font etc. as per your unique business setting.
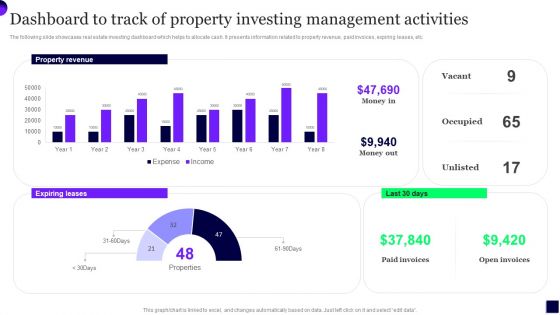
Dashboard To Track Of Property Investing Management Activities Sample PDF
The following slide showcases real estate investing dashboard which helps to allocate cash. It presents information related to property revenue, paid invoices, expiring leases, etc. Pitch your topic with ease and precision using this Dashboard To Track Of Property Investing Management Activities Sample PDF. This layout presents information on Dashboard To Track, Property Investing, Management Activities. It is also available for immediate download and adjustment. So, changes can be made in the color, design, graphics or any other component to create a unique layout.
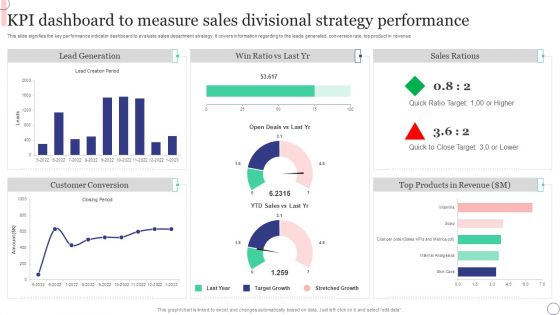
KPI Dashboard To Measure Sales Divisional Strategy Performance Microsoft PDF
This slide signifies the key performance indicator dashboard to evaluate sales department strategy. It covers information regarding to the leads generated, conversion rate, top product in revenue. Pitch your topic with ease and precision using this KPI Dashboard To Measure Sales Divisional Strategy Performance Microsoft PDF. This layout presents information on Sales Rations, Lead Generation, Customer Conversion. It is also available for immediate download and adjustment. So, changes can be made in the color, design, graphics or any other component to create a unique layout.
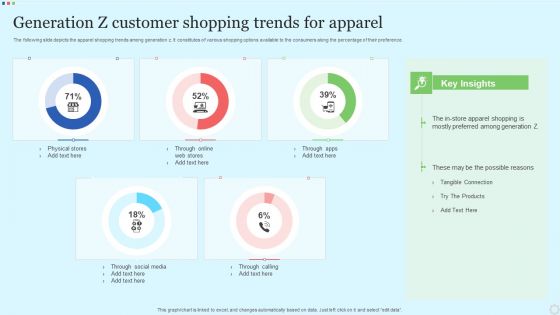
Generation Z Customer Shopping Trends For Apparel Designs PDF
The following slide depicts the apparel shopping trends among generation z. It constitutes of various shopping options available to the consumers along the percentage of their preference. Pitch your topic with ease and precision using this Generation Z Customer Shopping Trends For Apparel Designs PDF. This layout presents information on Physical Stores, Through Social Media, Through Calling. It is also available for immediate download and adjustment. So, changes can be made in the color, design, graphics or any other component to create a unique layout.
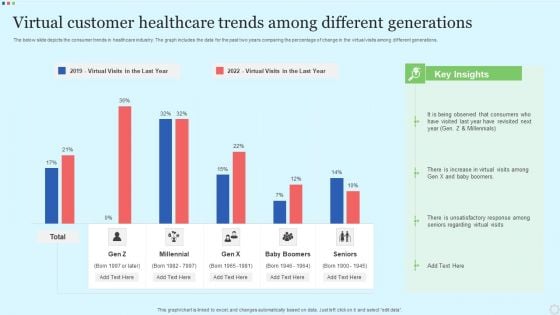
Virtual Customer Healthcare Trends Among Different Generations Professional PDF
The below slide depicts the consumer trends in healthcare industry. The graph includes the data for the past two years comparing the percentage of change in the virtual visits among different generations. Pitch your topic with ease and precision using this Virtual Customer Healthcare Trends Among Different Generations Professional PDF. This layout presents information on Millennial, Baby Boomers, Seniors. It is also available for immediate download and adjustment. So, changes can be made in the color, design, graphics or any other component to create a unique layout.
Digital Marketing Dashboard For Tracking Lead Generation Guidelines PDF
This slide showcases dashboard for digital marketing that can help organization track the monthly leads generated and performance of online marketing campaigns. Its key components are lead breakdown, total lead by program, web traffic targets, key conversion metrics, trial leads by region, total social media channels and key conversion metrics. Showcasing this set of slides titled Digital Marketing Dashboard For Tracking Lead Generation Guidelines PDF. The topics addressed in these templates are Lead By Program, Lead Breakdown, Key Conversion Metrics. All the content presented in this PPT design is completely editable. Download it and make adjustments in color, background, font etc. as per your unique business setting.
Lead Tracking Dashboard With Metric Comparison Brochure PDF
This slide showcases dashboard of lead pipeline that can help to identify total number of leads generated and expenses incurred to acquire the audience. It also showcases other key performance metrics like lead breakdown by status and number of leads per month. Pitch your topic with ease and precision using this Lead Tracking Dashboard With Metric Comparison Brochure PDF. This layout presents information on Metric Comparison, Lead Pipeline, Lead Breakdown Status. It is also available for immediate download and adjustment. So, changes can be made in the color, design, graphics or any other component to create a unique layout.
Leads Tracking Dashboard With Conversion Funnel Ideas PDF
This slide showcases dashboard that can help organization to identify the total number of customers acquired from the sales and marketing qualified lead. It also showcases financial KPIs that are cost per lead, cost per customer, customer lifetine value and return on marketing investment. Pitch your topic with ease and precision using this Leads Tracking Dashboard With Conversion Funnel Ideas PDF. This layout presents information on Audience, Prospects, Conversion Funnel. It is also available for immediate download and adjustment. So, changes can be made in the color, design, graphics or any other component to create a unique layout.
Monthly Comparison Dashboard For Lead Tracking Sample PDF
This slide showcases dashboard that can help organization to compare the leads converted in different months and make changes in sales and marketing campaigns . Its key components lead generated by country, by industry type and lead sources by month. Showcasing this set of slides titled Monthly Comparison Dashboard For Lead Tracking Sample PDF. The topics addressed in these templates are Leads Received, Industry Type, Lead Generated. All the content presented in this PPT design is completely editable. Download it and make adjustments in color, background, font etc. as per your unique business setting.
Sales Performance Dashboard With Average Lead Tracking Time Background PDF
This slide showcases dashboard for sales performance that can help organization to analyze the effectiveness of sales campaigns and average response time of lead. Its key components are average contract value, average sales cycle length, follow up contract rate and sales activity. Showcasing this set of slides titled Sales Performance Dashboard With Average Lead Tracking Time Background PDF. The topics addressed in these templates are Avg Contract Value, Sales Activity, Contract Rate. All the content presented in this PPT design is completely editable. Download it and make adjustments in color, background, font etc. as per your unique business setting.
Website Leads Tracking Dashboard With Traffic Sources Infographics PDF
This slide showcases dashboard for lead generation that can help organziation to identify the traffic sources plus visitors and make changes in SEO of website. It also showcases key metrics that are bounce rate by week, visitors by user type, top channels by conversion, top campaign by conversion and top pages by conversion. Pitch your topic with ease and precision using this Website Leads Tracking Dashboard With Traffic Sources Infographics PDF. This layout presents information on Visitors User Type, Traffic Sources, Bounce Rate Week. It is also available for immediate download and adjustment. So, changes can be made in the color, design, graphics or any other component to create a unique layout.
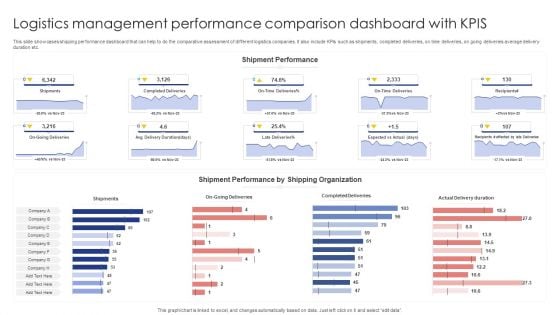
Logistics Management Performance Comparison Dashboard With Kpis Sample PDF
This slide showcases shipping performance dashboard that can help to do the comparative assessment of different logistics companies. It also include KPIs such as shipments, completed deliveries, on time deliveries, on going deliveries average delivery duration etc. Pitch your topic with ease and precision using this Logistics Management Performance Comparison Dashboard With Kpis Sample PDF. This layout presents information on Shipments, Completed Deliveries, Actual Delivery Duration. It is also available for immediate download and adjustment. So, changes can be made in the color, design, graphics or any other component to create a unique layout.
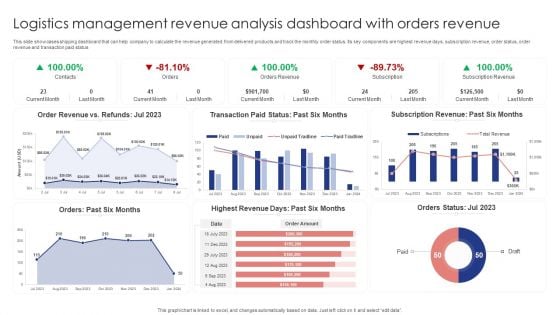
Logistics Management Revenue Analysis Dashboard With Orders Revenue Brochure PDF
This slide showcases shipping dashboard that can help company to calculate the revenue generated from delivered products and track the monthly order status. Its key components are highest revenue days, subscription revenue, order status, order revenue and transaction paid status. Showcasing this set of slides titled Logistics Management Revenue Analysis Dashboard With Orders Revenue Brochure PDF. The topics addressed in these templates are Order Revenue, Transaction Paid, Subscription Revenue. All the content presented in this PPT design is completely editable. Download it and make adjustments in color, background, font etc. as per your unique business setting.
Logistics Management Time Tracking Dashboard With Warehousing Costs Template PDF
This slide showcases shipping dashboard that can help company to deliver the products in stipulated time and keep warehousing operating expenses within pre decided budget. Its also displays perfect order rate and total shipments by country. Pitch your topic with ease and precision using this Logistics Management Time Tracking Dashboard With Warehousing Costs Template PDF. This layout presents information on Warehouse Operating Costs, Perfect Order Rate, On Time Shipments. It is also available for immediate download and adjustment. So, changes can be made in the color, design, graphics or any other component to create a unique layout.
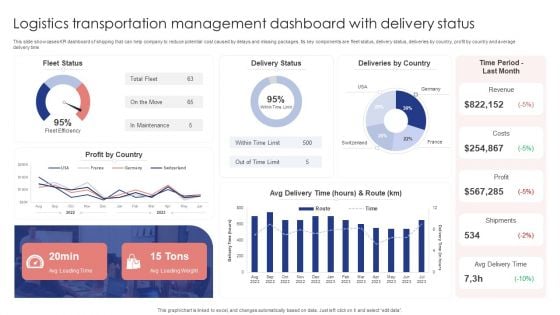
Logistics Transportation Management Dashboard With Delivery Status Portrait PDF
This slide showcases KPI dashboard of shipping that can help company to reduce potential cost caused by delays and missing packages. Its key components are fleet status, delivery status, deliveries by country, profit by country and average delivery time. Showcasing this set of slides titled Logistics Transportation Management Dashboard With Delivery Status Portrait PDF. The topics addressed in these templates are Fleet Status, Delivery Status, Deliveries By Country. All the content presented in this PPT design is completely editable. Download it and make adjustments in color, background, font etc. as per your unique business setting.
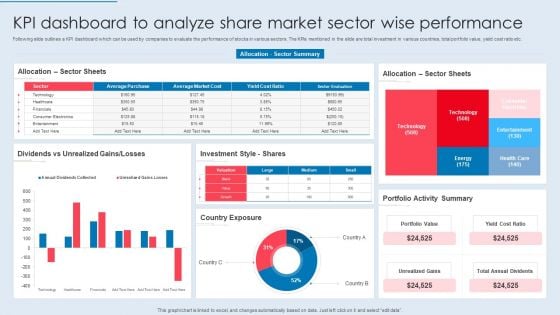
KPI Dashboard To Analyze Share Market Sector Wise Performance Summary PDF
Following slide outlines a KPI dashboard which can be used by companies to evaluate the performance of stocks in various sectors. The KPIs mentioned in the slide are total investment in various countries, total portfolio value, yield cost ratio etc. Pitch your topic with ease and precision using this KPI Dashboard To Analyze Share Market Sector Wise Performance Summary PDF. This layout presents information on Sector Sheets, Dividends Vs Unrealized, Investment Style. It is also available for immediate download and adjustment. So, changes can be made in the color, design, graphics or any other component to create a unique layout.
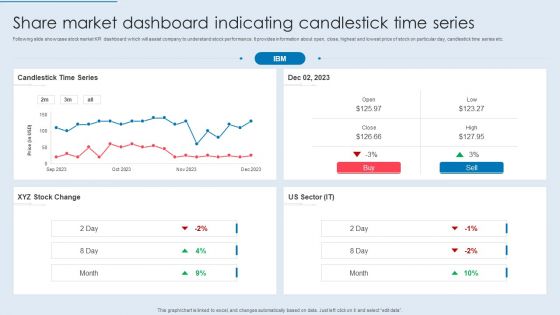
Share Market Dashboard Indicating Candlestick Time Series Formats PDF
Following slide showcase stock market KPI dashboard which will assist company to understand stock performance. It provides information about open, close, highest and lowest price of stock on particular day, candlestick time series etc. Pitch your topic with ease and precision using this Share Market Dashboard Indicating Candlestick Time Series Formats PDF. This layout presents information on Candlestick Time Series, Stock Change, US Sector. It is also available for immediate download and adjustment. So, changes can be made in the color, design, graphics or any other component to create a unique layout.
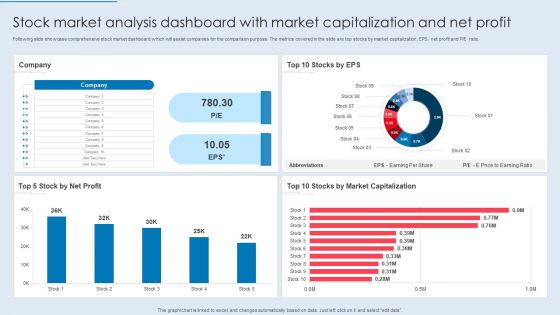
Stock Market Analysis Dashboard With Market Capitalization And Net Profit Elements PDF
Following slide showcase comprehensive stock market dashboard which will assist companies for the comparison purpose. The metrics covered in the slide are top stocks by market capitalization, EPS, net profit and PE ratio. Pitch your topic with ease and precision using this Stock Market Analysis Dashboard With Market Capitalization And Net Profit Elements PDF. This layout presents information on Company, Net Profit, Market Capitalization. It is also available for immediate download and adjustment. So, changes can be made in the color, design, graphics or any other component to create a unique layout.
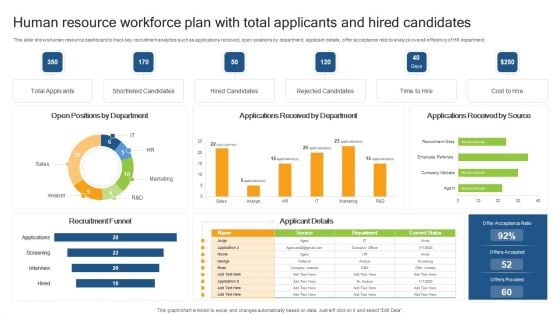
Human Resource Workforce Plan With Total Applicants And Hired Candidates Clipart PDF
This slide shows human resource dashboard to track key recruitment analytics such as applications received, open positions by department, applicant details, offer acceptance ratio to analyze overall efficiency of HR department. Pitch your topic with ease and precision using this Human Resource Workforce Plan With Total Applicants And Hired Candidates Clipart PDF. This layout presents information on Total Applicants, Shortlisted Candidates, Recruitment Funnel. It is also available for immediate download and adjustment. So, changes can be made in the color, design, graphics or any other component to create a unique layout.

Virtual Performance Management And Monitoring Dashboard Pictures PDF
Following slide illustrates remote performance dashboard utilized by organizations to monitor active issues and stay ahead of problems. This slide provides data regarding issues, problematic servers, unmonitored devices, server status, reboot time, etc. Pitch your topic with ease and precision using this Virtual Performance Management And Monitoring Dashboard Pictures PDF. This layout presents information on Total Devices, Devices With Problem, Regular Safety Check Problems. It is also available for immediate download and adjustment. So, changes can be made in the color, design, graphics or any other component to create a unique layout.
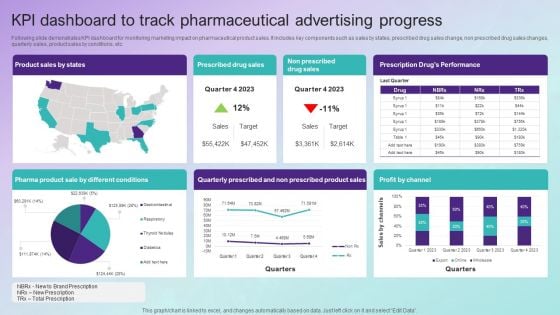
KPI Dashboard To Track Pharmaceutical Advertising Progress Topics PDF
Following slide demonstrates KPI dashboard for monitoring marketing impact on pharmaceutical product sales. It includes key components such as sales by states, prescribed drug sales change, non prescribed drug sales changes, quarterly sales, product sales by conditions, etc. Showcasing this set of slides titled KPI Dashboard To Track Pharmaceutical Advertising Progress Topics PDF. The topics addressed in these templates are Product Sales By States, Prescribed Drug Sales, Non Prescribed Drug Sales, Profit By Channel. All the content presented in this PPT design is completely editable. Download it and make adjustments in color, background, font etc. as per your unique business setting.
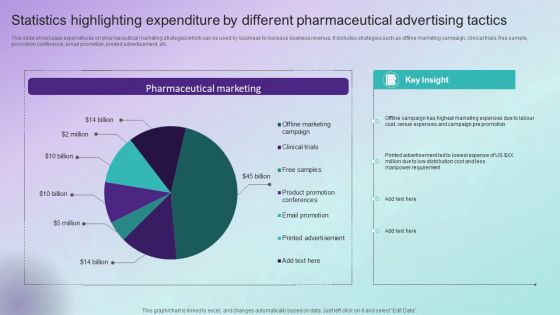
Statistics Highlighting Expenditure By Different Pharmaceutical Advertising Tactics Mockup PDF
This slide showcases expenditures on pharmaceutical marketing strategies which can be used by business to increase business revenue. It includes strategies such as offline marketing campaign, clinical trials, free sample, promotion conference, email promotion, printed advertisement, etc. Pitch your topic with ease and precision using this Statistics Highlighting Expenditure By Different Pharmaceutical Advertising Tactics Mockup PDF. This layout presents information on Offline Marketing Campaign, Clinical Trials, Free Sample, Promotion Conference, Email Promotion, Printed Advertisement. It is also available for immediate download and adjustment. So, changes can be made in the color, design, graphics or any other component to create a unique layout.
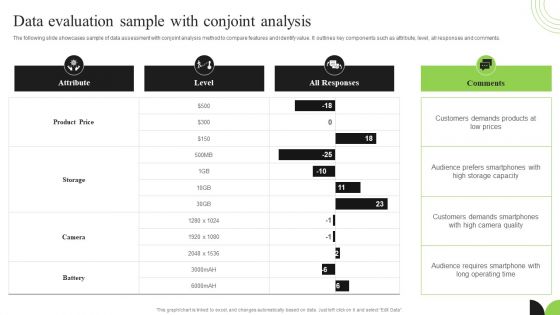
Guidebook For Executing Business Market Intelligence Data Evaluation Sample With Conjoint Analysis Ideas PDF
The following slide showcases sample of data assessment with conjoint analysis method to compare features and identify value. It outlines key components such as attribute, level, all responses and comments. Boost your pitch with our creative Guidebook For Executing Business Market Intelligence Data Evaluation Sample With Conjoint Analysis Ideas PDF. Deliver an awe inspiring pitch that will mesmerize everyone. Using these presentation templates you will surely catch everyones attention. You can browse the ppts collection on our website. We have researchers who are experts at creating the right content for the templates. So you do not have to invest time in any additional work. Just grab the template now and use them.
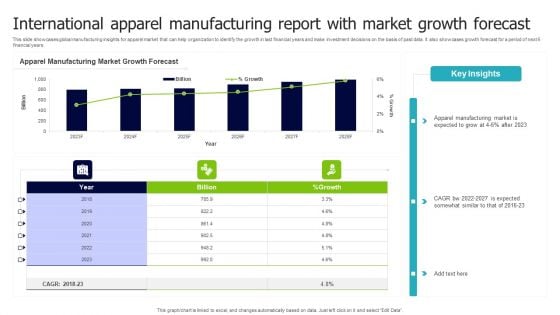
International Apparel Manufacturing Report With Market Growth Forecast Inspiration PDF
This slide showcases global manufacturing insights for apparel market that can help organization to identify the growth in last financial years and make investment decisions on the basis of past data. It also showcases growth forecast for a period of next 6 financial years. Pitch your topic with ease and precision using this International Apparel Manufacturing Report With Market Growth Forecast Inspiration PDF. This layout presents information on Apparel Manufacturing, Market Growth Forecast, Billion. It is also available for immediate download and adjustment. So, changes can be made in the color, design, graphics or any other component to create a unique layout.
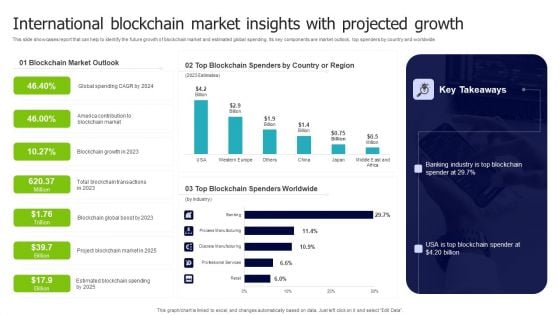
International Blockchain Market Insights With Projected Growth Microsoft PDF
This slide showcases report that can help to identify the future growth of blockchain market and estimated global spending. Its key components are market outlook, top spenders by country and worldwide. Showcasing this set of slides titled International Blockchain Market Insights With Projected Growth Microsoft PDF. The topics addressed in these templates are Blockchain Market Outlook, Blockchain Spenders, Country Region. All the content presented in this PPT design is completely editable. Download it and make adjustments in color, background, font etc. as per your unique business setting.
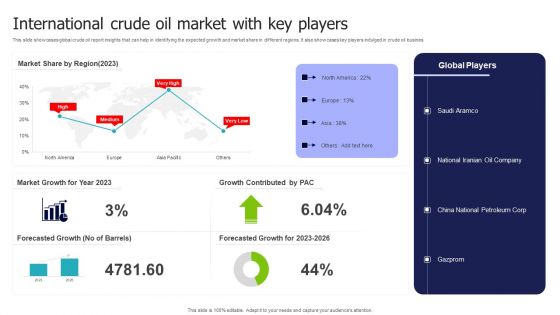
International Crude Oil Market With Key Players Demonstration PDF
This slide showcases global crude oil report insights that can help in identifying the expected growth and market share in different regions. It also showcases key players indulged in crude oil busines. Pitch your topic with ease and precision using this International Crude Oil Market With Key Players Demonstration PDF. This layout presents information on Market Share, Market Growth, Growth Contributed . It is also available for immediate download and adjustment. So, changes can be made in the color, design, graphics or any other component to create a unique layout.
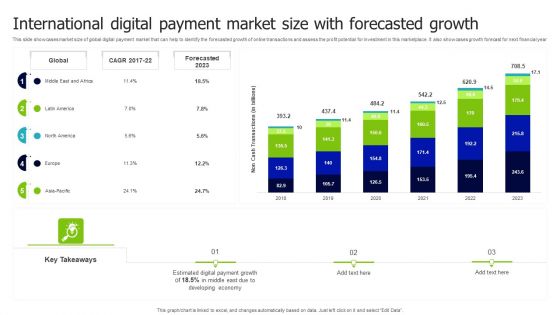
International Digital Payment Market Size With Forecasted Growth Inspiration PDF
This slide showcases market size of global digital payment market that can help to identify the forecasted growth of online transactions and assess the profit potential for investment in this marketplace. It also showcases growth forecast for next financial year. Pitch your topic with ease and precision using this International Digital Payment Market Size With Forecasted Growth Inspiration PDF. This layout presents information on Global, Forecasted, Growth. It is also available for immediate download and adjustment. So, changes can be made in the color, design, graphics or any other component to create a unique layout.

International Housing Market Trends With Key Drivers Inspiration PDF
This slide showcases global statistics that can help organizations to estimate the forecasted growth of housing market and identify stock by region. It also showcases key drivers contributing in new housing developments. Pitch your topic with ease and precision using this International Housing Market Trends With Key Drivers Inspiration PDF. This layout presents information on Key Drivers, Housing Market, Forecasted. It is also available for immediate download and adjustment. So, changes can be made in the color, design, graphics or any other component to create a unique layout.
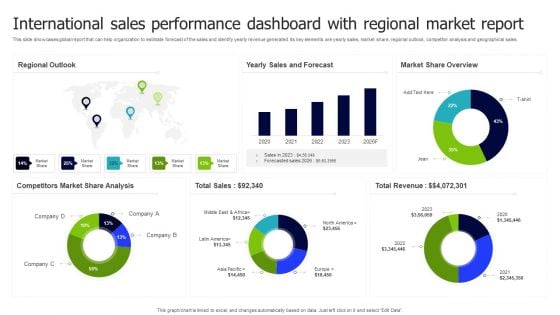
International Sales Performance Dashboard With Regional Market Report Inspiration PDF
This slide showcases global report that can help organization to estimate forecast of the sales and identify yearly revenue generated. Its key elements are yearly sales, market share, regional outlook, competitor analysis and geographical sales. Pitch your topic with ease and precision using this International Sales Performance Dashboard With Regional Market Report Inspiration PDF. This layout presents information on Regional Outlook, Sales And Forecast, Market Share Overview. It is also available for immediate download and adjustment. So, changes can be made in the color, design, graphics or any other component to create a unique layout.
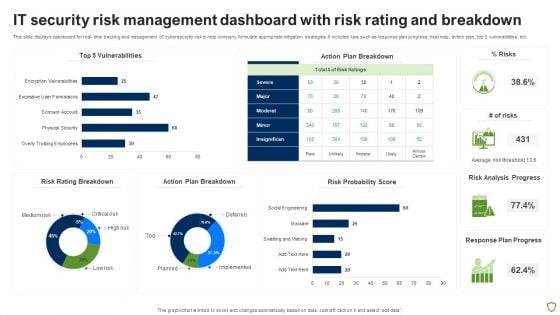
IT Security Risk Management Dashboard With Risk Rating And Breakdown Pictures PDF
This slide displays dashboard for real- time tracking and management of cybersecurity risk to help company formulate appropriate mitigation strategies. It includes kpis such as response plan progress, heat map, action plan, top 5 vulnerabilities, etc. Pitch your topic with ease and precision using this IT Security Risk Management Dashboard With Risk Rating And Breakdown Pictures PDF. This layout presents information on Risk Rating Breakdown, Action Plan Breakdown, Risk Probability Score, Risk Analysis Progress. It is also available for immediate download and adjustment. So, changes can be made in the color, design, graphics or any other component to create a unique layout.
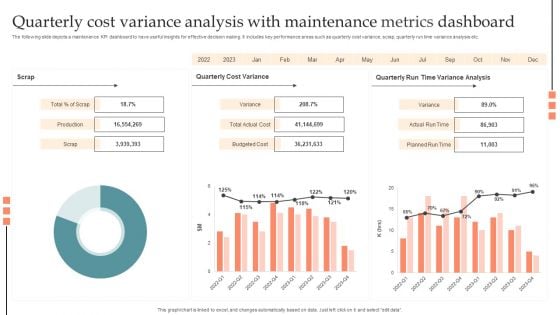
Quarterly Cost Variance Analysis With Maintenance Metrics Dashboard Information PDF
The following slide depicts a maintenance KPI dashboard to have useful insights for effective decision making. It includes key performance areas such as quarterly cost variance, scrap, quarterly run time variance analysis etc. Pitch your topic with ease and precision using this Quarterly Cost Variance Analysis With Maintenance Metrics Dashboard Information PDF. This layout presents information on Production, Budgeted Cost, Planned Run Time, Actual Run Time. It is also available for immediate download and adjustment. So, changes can be made in the color, design, graphics or any other component to create a unique layout.
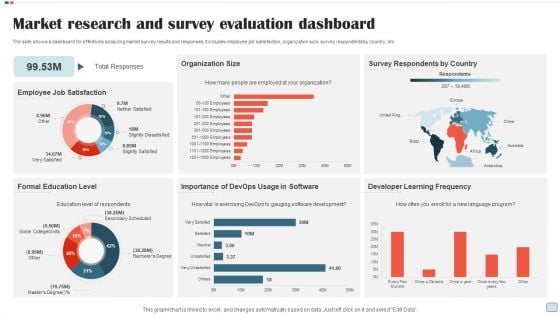
Market Research And Survey Evaluation Dashboard Rules PDF
The slide shows a dashboard for effectively analyzing market survey results and responses. It includes employee job satisfaction, organization size, survey respondents by country, etc. Pitch your topic with ease and precision using this Market Research And Survey Evaluation Dashboard Rules PDF. This layout presents information on Employee Job Satisfaction, Organization Size, Survey Respondents By Country. It is also available for immediate download and adjustment. So, changes can be made in the color, design, graphics or any other component to create a unique layout.
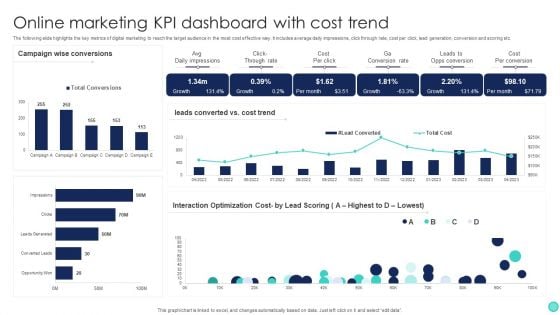
Online Marketing KPI Dashboard With Cost Trend Slides PDF
The following slide highlights the key metrics of digital marketing to reach the target audience in the most cost effective way. It includes average daily impressions, click through rate, cost per click, lead generation, conversion and scoring etc. Pitch your topic with ease and precision using this Online Marketing KPI Dashboard With Cost Trend Slides PDF. This layout presents information on Average Daily Impressions, Click Through Rate, Cost Per Click, Lead Generation, Conversion And Scoring. It is also available for immediate download and adjustment. So, changes can be made in the color, design, graphics or any other component to create a unique layout.
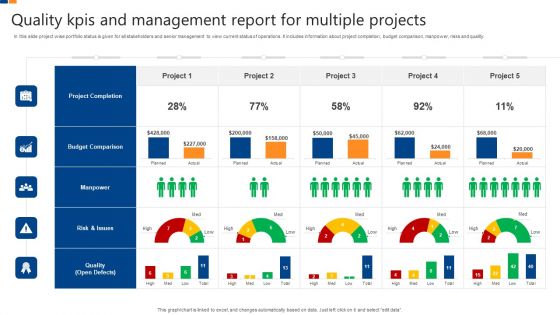
Quality Kpis And Management Report For Multiple Projects Elements PDF
In this slide project wise portfolio status is given for all stakeholders and senior management to view current status of operations. It includes information about project completion, budget comparison, manpower, risks and quality. Pitch your topic with ease and precision using this Quality Kpis And Management Report For Multiple Projects Elements PDF. This layout presents information on Project Completion, Budget Comparison, Manpower, Risks And Quality. It is also available for immediate download and adjustment. So, changes can be made in the color, design, graphics or any other component to create a unique layout.
Tracker For Time Based Quality Kpis In Project Management Ideas PDF
This slide displays project wise comparative analysis on the basis of planned and actual time it takes for completion. It includes details such as number of tasks and work completed, average number of hours, start and end dates, etc. Pitch your topic with ease and precision using this Tracker For Time Based Quality Kpis In Project Management Ideas PDF. This layout presents information on Time, Work Completed, Avg Number, Hours Per Task. It is also available for immediate download and adjustment. So, changes can be made in the color, design, graphics or any other component to create a unique layout.

Quarterly Sales Performance Of Business Analysis With Key Insights Information PDF
In this slide sales performance of each product is recorded as their percentage share in total sales first quarter of company. The goods include headphones, joystick, mouse pad, bluetooth speaker, etc. Pitch your topic with ease and precision using this Quarterly Sales Performance Of Business Analysis With Key Insights Information PDF. This layout presents information on Wireless Mouse, Keyboard, Mouse Pad, Joystick, Headsets. It is also available for immediate download and adjustment. So, changes can be made in the color, design, graphics or any other component to create a unique layout.
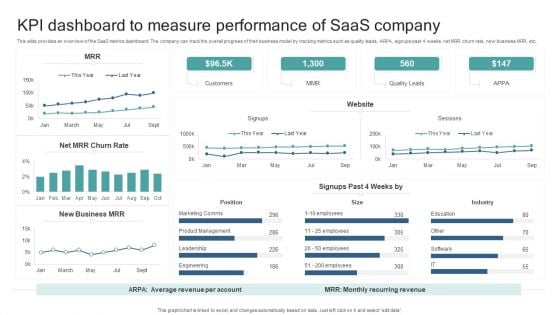
KPI Dashboard To Measure Performance Of Saas Company Introduction PDF
This slide provides an overview of the SaaS metrics dashboard. The company can track the overall progress of their business model by tracking metrics such as quality leads, ARPA, signups past 4 weeks, net MRR churn rate, new business MRR, etc. Pitch your topic with ease and precision using this KPI Dashboard To Measure Performance Of Saas Company Introduction PDF. This layout presents information on Industry, Position, Customers, Quality Leads. It is also available for immediate download and adjustment. So, changes can be made in the color, design, graphics or any other component to create a unique layout.
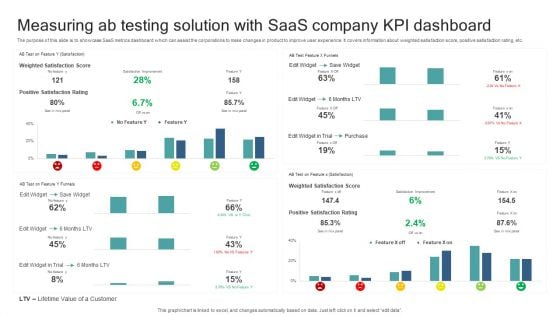
Measuring Ab Testing Solution With Saas Company KPI Dashboard Guidelines PDF
The purpose of this slide is to showcase SaaS metrics dashboard which can assist the corporations to make changes in product to improve user experience. It covers information about weighted satisfaction score, positive satisfaction rating, etc. Pitch your topic with ease and precision using this Measuring Ab Testing Solution With Saas Company KPI Dashboard Guidelines PDF. This layout presents information on Lifetime Value Customer, Positive Satisfaction Rating, Save Widget, Weighted Satisfaction Score. It is also available for immediate download and adjustment. So, changes can be made in the color, design, graphics or any other component to create a unique layout.
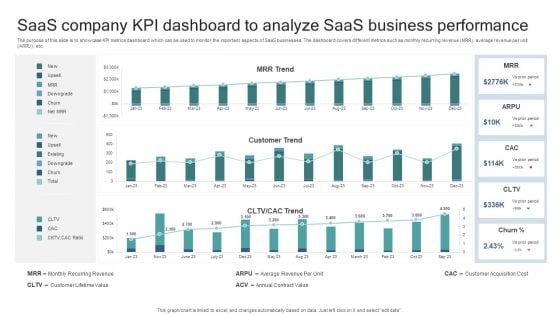
Saas Company KPI Dashboard To Analyze Saas Business Performance Elements PDF
The purpose of this slide is to showcase KPI metrics dashboard which can be used to monitor the important aspects of SaaS businesses. The dashboard covers different metrics such as monthly recurring revenue MRR, average revenue per unit ARPU, etc. Pitch your topic with ease and precision using this Saas Company KPI Dashboard To Analyze Saas Business Performance Elements PDF. This layout presents information on Monthly Recurring Revenue, Customer Lifetime Value, Average Revenue Per Unit, Annual Contract Value, Customer Acquisition Cost. It is also available for immediate download and adjustment. So, changes can be made in the color, design, graphics or any other component to create a unique layout.
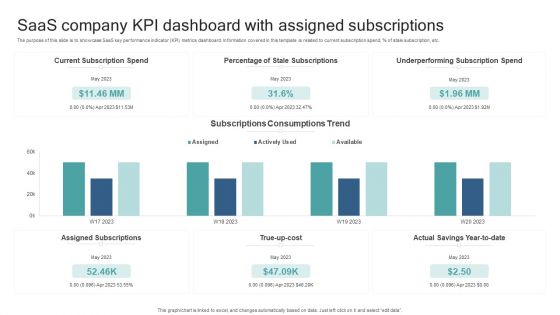
Saas Company KPI Dashboard With Assigned Subscriptions Formats PDF
The purpose of this slide is to showcase SaaS key performance indicator KPI metrics dashboard. Information covered in this template is related to current subscription spend, percent of stale subscription, etc. Pitch your topic with ease and precision using this Saas Company KPI Dashboard With Assigned Subscriptions Formats PDF. This layout presents information on Current Subscription Spend, Percentage Of Stale Subscriptions, True Up Cost, Underperforming Subscription Spend. It is also available for immediate download and adjustment. So, changes can be made in the color, design, graphics or any other component to create a unique layout.
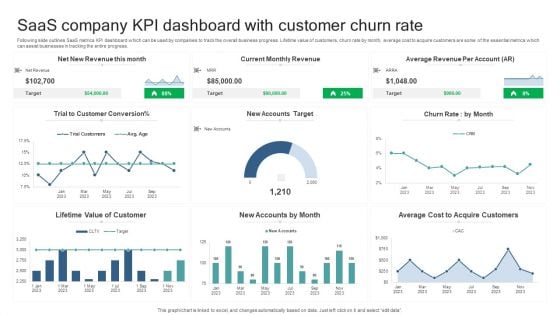
Saas Company KPI Dashboard With Customer Churn Rate Microsoft PDF
Following slide outlines SaaS metrics KPI dashboard which can be used by companies to track the overall business progress. Lifetime value of customers, churn rate by month, average cost to acquire customers are some of the essential metrics which can assist businesses in tracking the entire progress. Pitch your topic with ease and precision using this Saas Company KPI Dashboard With Customer Churn Rate Microsoft PDF. This layout presents information on Lifetime Value Of Customer, New Accounts By Month, Average Cost Acquire Customers. It is also available for immediate download and adjustment. So, changes can be made in the color, design, graphics or any other component to create a unique layout.
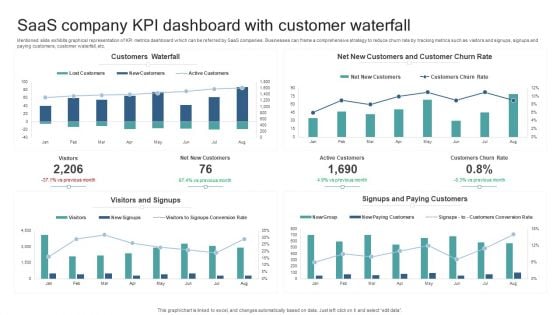
Saas Company KPI Dashboard With Customer Waterfall Slides PDF
Mentioned slide exhibits graphical representation of KPI metrics dashboard which can be referred by SaaS companies. Businesses can frame a comprehensive strategy to reduce churn rate by tracking metrics such as visitors and signups, signups and paying customers, customer waterfall, etc. Pitch your topic with ease and precision using this Saas Company KPI Dashboard With Customer Waterfall Slides PDF. This layout presents information on Customers Waterfall, Visitors And Signups, Signups And Paying Customers. It is also available for immediate download and adjustment. So, changes can be made in the color, design, graphics or any other component to create a unique layout.
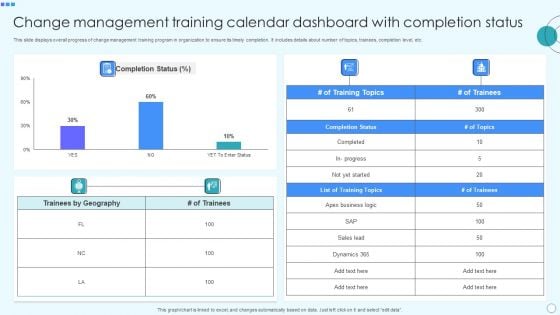
Change Management Training Calendar Dashboard With Completion Status Portrait PDF
This slide displays overall progress of change management training program in organization to ensure its timely completion. It includes details about number of topics, trainees, completion level, etc. Pitch your topic with ease and precision using this Change Management Training Calendar Dashboard With Completion Status Portrait PDF. This layout presents information on Business Logic, Geography, Completion Status, Sales Lead, Dynamics. It is also available for immediate download and adjustment. So, changes can be made in the color, design, graphics or any other component to create a unique layout.
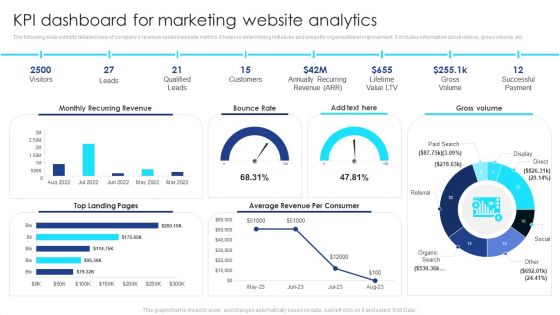
KPI Dashboard For Marketing Website Analytics Summary PDF
The following slide exhibits detailed view of companys revenue-related website metrics. It helps in determining initiatives and areas for organisational improvement. It includes information about visitors, gross volume, etc. Pitch your topic with ease and precision using this KPI Dashboard For Marketing Website Analytics Summary PDF. This layout presents information on Visitors, Leads, Qualified Leads, Customers, Gross Volume, Successful Payment. It is also available for immediate download and adjustment. So, changes can be made in the color, design, graphics or any other component to create a unique layout.
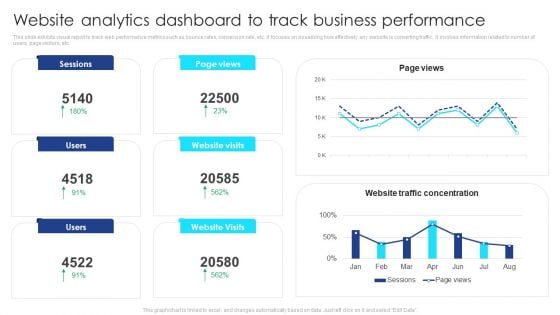
Website Analytics Dashboard To Track Business Performance Guidelines PDF
This slide exhibits visual report to track web performance metrics such as bounce rates, conversion rate, etc. It focuses on visualizing how effectively any website is converting traffic. It involves information related to number of users, page visitors, etc. Pitch your topic with ease and precision using this Website Analytics Dashboard To Track Business Performance Guidelines PDF. This layout presents information on Website Analytics, Dashboard To Track, Business Performance. It is also available for immediate download and adjustment. So, changes can be made in the color, design, graphics or any other component to create a unique layout.
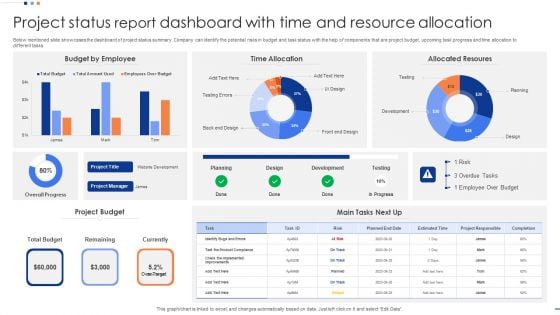
Project Status Report Dashboard With Time And Resource Allocation Inspiration PDF
Below mentioned slide showcases the dashboard of project status summary. Company can identify the potential risks in budget and task status with the help of components that are project budget, upcoming task progress and time allocation to different tasks. Showcasing this set of slides titled Project Status Report Dashboard With Time And Resource Allocation Inspiration PDF. The topics addressed in these templates are Budget By Employee, Time Allocation, Allocated Resoures. All the content presented in this PPT design is completely editable. Download it and make adjustments in color, background, font etc. as per your unique business setting.
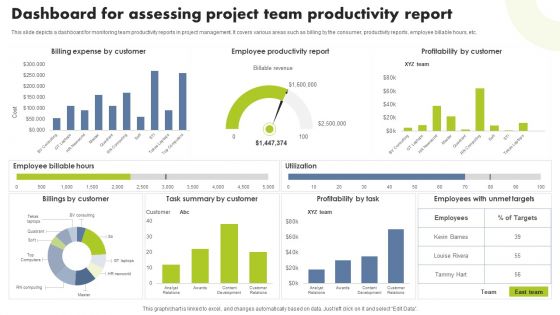
Dashboard For Assessing Project Team Productivity Report Mockup PDF
This slide depicts a dashboard for monitoring team productivity reports in project management. It covers various areas such as billing by the consumer, productivity reports, employee billable hours, etc. Pitch your topic with ease and precision using this Dashboard For Assessing Project Team Productivity Report Mockup PDF. This layout presents information on Billing Expense Customer, Employee Productivity Report, Profitability Customer. It is also available for immediate download and adjustment. So, changes can be made in the color, design, graphics or any other component to create a unique layout.
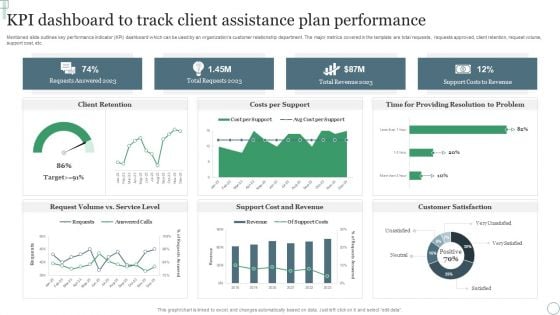
KPI Dashboard To Track Client Assistance Plan Performance Ppt Professional Outfit PDF
Mentioned slide outlines key performance indicator KPI dashboard which can be used by an organizations customer relationship department. The major metrics covered in the template are total requests, requests approved, client retention, request volume, support cost, etc. Pitch your topic with ease and precision using this KPI Dashboard To Track Client Assistance Plan Performance Ppt Professional Outfit PDF. This layout presents information on Requests Answered 2023, Total Requests 2023, Total Revenue 2023. It is also available for immediate download and adjustment. So, changes can be made in the color, design, graphics or any other component to create a unique layout.
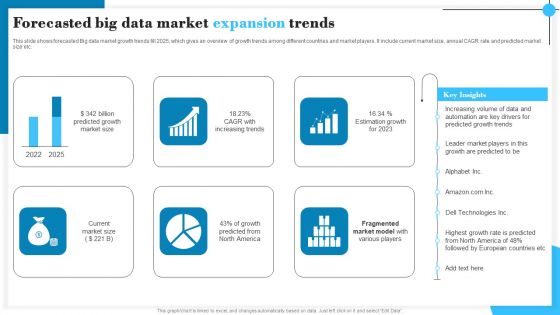
Forecasted Big Data Market Expansion Trends Download PDF
This slide shows forecasted Big data market growth trends till 2025, which gives an overview of growth trends among different countries and market players. It include current market size, annual CAGR rate and predicted market size etc. Pitch your topic with ease and precision using this Forecasted Big Data Market Expansion Trends Download PDF. This layout presents information on Billion Predicted Growth, Increasing Trends, Estimation Growth. It is also available for immediate download and adjustment. So, changes can be made in the color, design, graphics or any other component to create a unique layout.
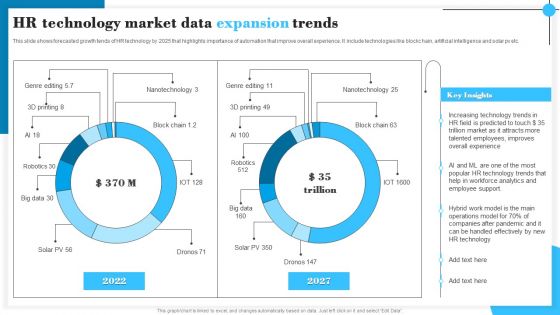
HR Technology Market Data Expansion Trends Information PDF
This slide shows forecasted growth tends of HR technology by 2025 that highlights importance of automation that improve overall experience. It include technologies like blockc hain, artificial intelligence and solar pv etc. Pitch your topic with ease and precision using this HR Technology Market Data Expansion Trends Information PDF. This layout presents information on Increasing Technology, Talented Employees, Employee Support. It is also available for immediate download and adjustment. So, changes can be made in the color, design, graphics or any other component to create a unique layout.
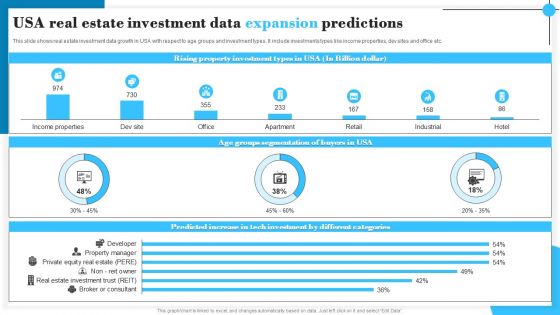
USA Real Estate Investment Data Expansion Predictions Graphics PDF
This slide shows real estate investment data growth in USA with respect to age groups and investment types. It include investments types like income properties, dev sites and office etc. Pitch your topic with ease and precision using this USA Real Estate Investment Data Expansion Predictions Graphics PDF. This layout presents information on Rising Property, Age Groups Segmentation, Investment Types. It is also available for immediate download and adjustment. So, changes can be made in the color, design, graphics or any other component to create a unique layout.
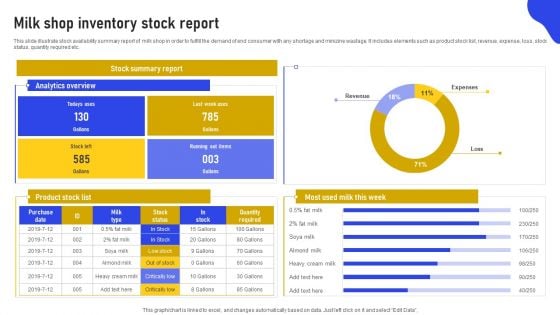
Milk Shop Inventory Stock Report Structure PDF
This slide illustrate stock availability summary report of milk shop in order to fulfill the demand of end consumer with any shortage and minizine wastage. It includes elements such as product stock list, revenue, expense, loss, stock status, quantity required etc. Pitch your topic with ease and precision using this Milk Shop Inventory Stock Report Structure PDF. This layout presents information on Stock Summary Report, Analytics Overview, Product Stock List. It is also available for immediate download and adjustment. So, changes can be made in the color, design, graphics or any other component to create a unique layout.

Supply Chain Management Inventory Stock Report Brochure PDF
This slide illustrate inventory stock summary of supply chain management to deliver products to end consumer on time. It includes elements such as inventory to sales ratio, last 5 year inventory turnover, inventory carrying cost, inventory accuracy, out of stock items. Pitch your topic with ease and precision using this Supply Chain Management Inventory Stock Report Brochure PDF. This layout presents information on Inventory Carrying Cost, Inventory Accuracy, Out Of Stock Item. It is also available for immediate download and adjustment. So, changes can be made in the color, design, graphics or any other component to create a unique layout.
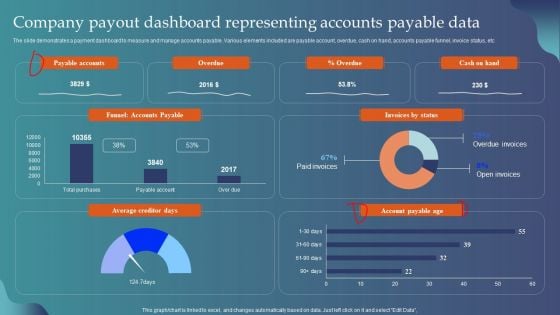
Company Payout Dashboard Representing Accounts Payable Data Introduction PDF
The slide demonstrates a payment dashboard to measure and manage accounts payable. Various elements included are payable account, overdue, cash on hand, accounts payable funnel, invoice status, etc. Pitch your topic with ease and precision using this Company Payout Dashboard Representing Accounts Payable Data Introduction PDF. This layout presents information on Payable Accounts, Overdue, Invoices By Status, Account Payable Age. It is also available for immediate download and adjustment. So, changes can be made in the color, design, graphics or any other component to create a unique layout.
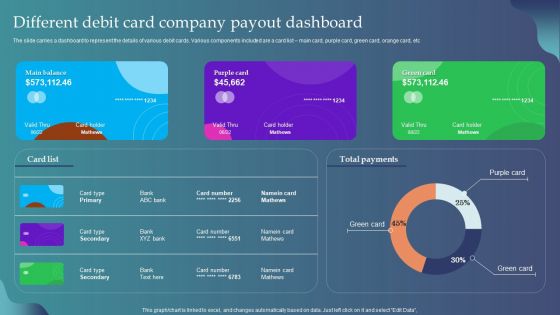
Different Debit Card Company Payout Dashboard Ppt Pictures Inspiration PDF
The slide carries a dashboard to represent the details of various debit cards. Various components included are a card list main card, purple card, green card, orange card, etc. Showcasing this set of slides titled Different Debit Card Company Payout Dashboard Ppt Pictures Inspiration PDF. The topics addressed in these templates are Main Balance, Purple Card, Green Card, Total Payments. All the content presented in this PPT design is completely editable. Download it and make adjustments in color, background, font etc. as per your unique business setting.
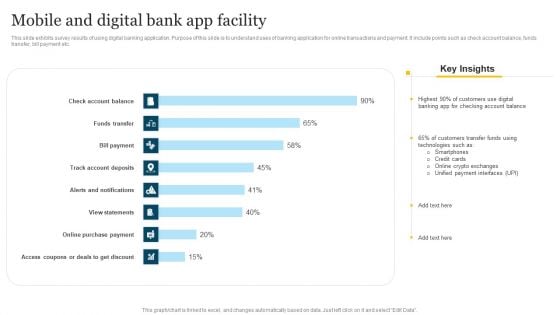
Mobile And Digital Bank App Facility Summary PDF
This slide exhibits survey results of using digital banking application. Purpose of this slide is to understand uses of banking application for online transactions and payment. It include points such as check account balance, funds transfer, bill payment etc. Pitch your topic with ease and precision using this Mobile And Digital Bank App Facility Summary PDF. This layout presents information on Unified Payment Interfaces, Customers Transfer Funds, Technologies It is also available for immediate download and adjustment. So, changes can be made in the color, design, graphics or any other component to create a unique layout.
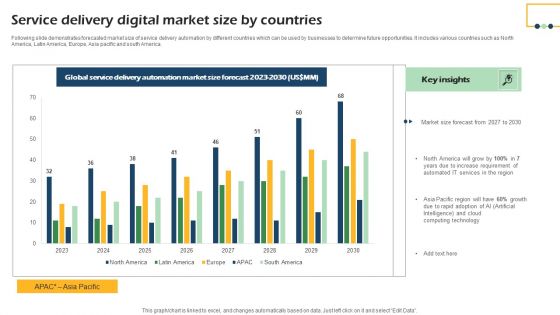
Service Delivery Digital Market Size By Countries Demonstration PDF
Following slide demonstrates forecasted market size of service delivery automation by different countries which can be used by businesses to determine future opportunities. It includes various countries such as North America, Latin America, Europe, Asia pacific and south America. Pitch your topic with ease and precision using this Service Delivery Digital Market Size By Countries Demonstration PDF. This layout presents information on Global Service, Delivery Automation, Market Size Forecast. It is also available for immediate download and adjustment. So, changes can be made in the color, design, graphics or any other component to create a unique layout.
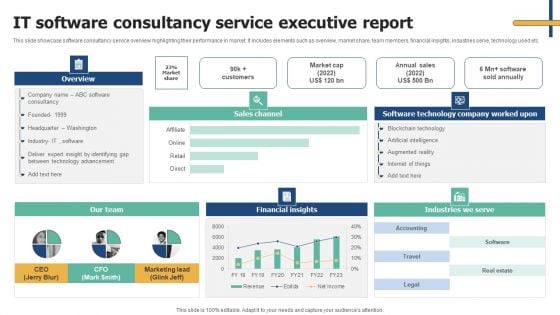
IT Software Consultancy Service Executive Report Structure PDF
This slide showcase software consultancy service overview highlighting their performance in market. It includes elements such as overview, market share, team members, financial insights, industries serve, technology used etc. Pitch your topic with ease and precision using this IT Software Consultancy Service Executive Report Structure PDF. This layout presents information on Financial Insights, Our Team, Industries We Serve. It is also available for immediate download and adjustment. So, changes can be made in the color, design, graphics or any other component to create a unique layout.
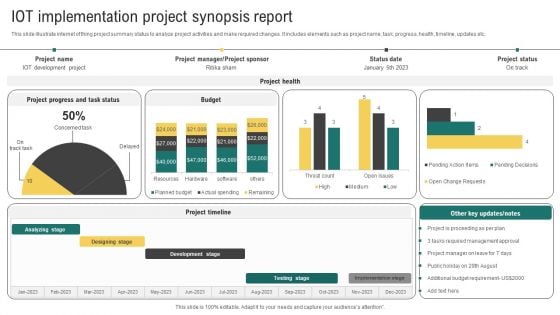
IOT Implementation Project Synopsis Report Summary PDF
This slide illustrate internet of thing project summary status to analyze project activities and make required changes. It includes elements such as project name, task, progress, health, timeline, updates etc. Pitch your topic with ease and precision using this IOT Implementation Project Synopsis Report Summary PDF. This layout presents information on Development Stage, Testing Stage, Implementation Stage. It is also available for immediate download and adjustment. So, changes can be made in the color, design, graphics or any other component to create a unique layout.
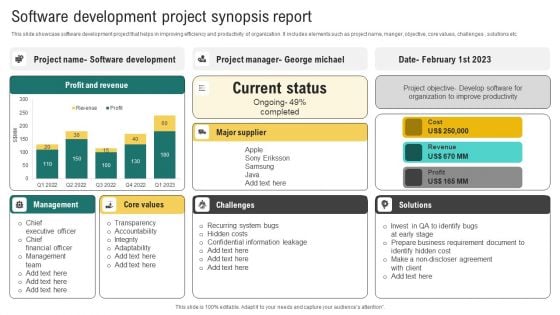
Software Development Project Synopsis Report Microsoft PDF
This slide showcase software development project that helps in improving efficiency and productivity of organization. It includes elements such as project name, manger, objective, core values, challenges , solutions etc. Pitch your topic with ease and precision using this Software Development Project Synopsis Report Microsoft PDF. This layout presents information on Profit Revenue, Current Status, Management. It is also available for immediate download and adjustment. So, changes can be made in the color, design, graphics or any other component to create a unique layout.
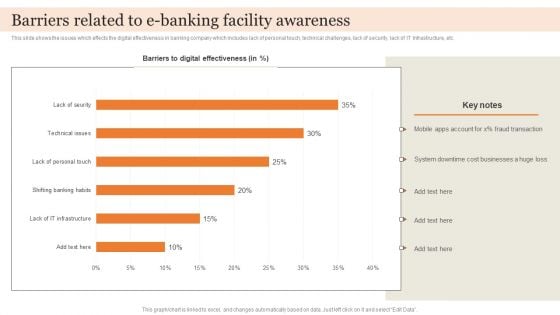
Barriers Related To E Banking Facility Awareness Guidelines PDF
This slide shows the issues which effects the digital effectiveness in banking company which includes lack of personal touch, technical challenges, lack of security, lack of IT Infrastructure, etc. Pitch your topic with ease and precision using this Barriers Related To E Banking Facility Awareness Guidelines PDF. This layout presents information on Cost Businesses, Fraud Transaction, Digital Effectiveness. It is also available for immediate download and adjustment. So, changes can be made in the color, design, graphics or any other component to create a unique layout.
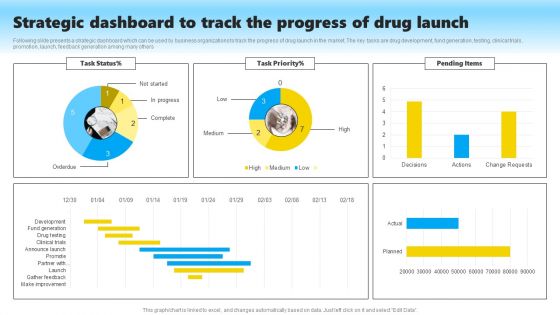
Strategic Dashboard To Track The Progress Of Drug Launch Structure PDF
Following slide presents a strategic dashboard which can be used by business organizations to track the progress of drug launch in the market. The key tasks are drug development, fund generation, testing, clinical trials, promotion, launch, feedback generation among many others. Pitch your topic with ease and precision using this Strategic Dashboard To Track The Progress Of Drug Launch Structure PDF. This layout presents information on Drug Development, Fund Generation, Testing, Clinical Trials, Promotion, Launch, Feedback Generation. It is also available for immediate download and adjustment. So, changes can be made in the color, design, graphics or any other component to create a unique layout.
Monthly Sales KPI Dashboard For Tracking Brand Recommendation Progress Background PDF
Following slide demonstrates key performance indicator dashboard for tracking monthly sales to monitor business performance. It includes components such as monthly execution cost, sales, state wise events, Brand market, and programs. Showcasing this set of slides titled Monthly Sales KPI Dashboard For Tracking Brand Recommendation Progress Background PDF. The topics addressed in these templates are Products Sold, Engagements, Events, Active Markets, Sampled, Attendance. All the content presented in this PPT design is completely editable. Download it and make adjustments in color, background, font etc. as per your unique business setting.
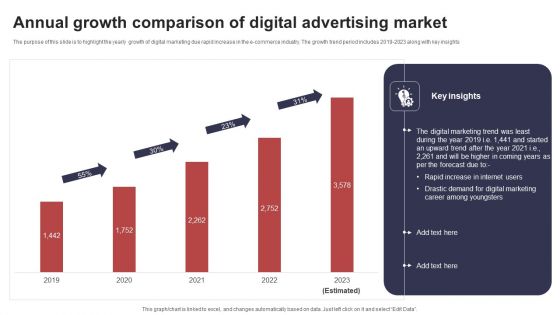
Annual Growth Comparison Of Digital Advertising Market Summary PDF
The purpose of this slide is to highlight the yearly growth of digital marketing due rapid increase in the e commerce industry. The growth trend period includes 2019 2023 along with key insights. Pitch your topic with ease and precision using this Annual Growth Comparison Of Digital Advertising Market Summary PDF. This layout presents information on Digital Marketing, Internet Users, Career Among Youngsters. It is also available for immediate download and adjustment. So, changes can be made in the color, design, graphics or any other component to create a unique layout.
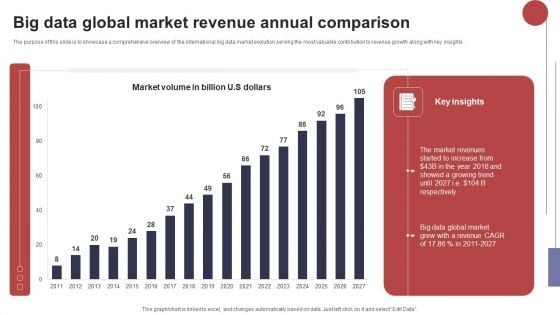
Big Data Global Market Revenue Annual Comparison Structure PDF
The purpose of this slide is to showcase a comprehensive overview of the international big data market evolution serving the most valuable contribution to revenue growth along with key insights. Pitch your topic with ease and precision using this Big Data Global Market Revenue Annual Comparison Structure PDF. This layout presents information on Market Revenues, Global Market, Growing Trend. It is also available for immediate download and adjustment. So, changes can be made in the color, design, graphics or any other component to create a unique layout.
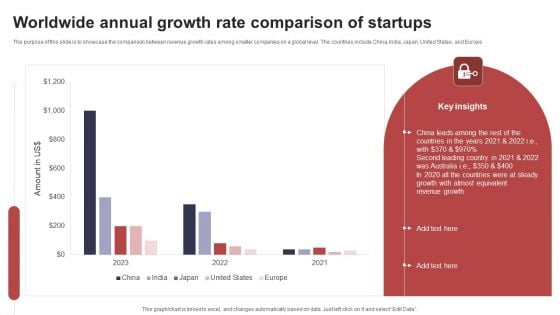
Worldwide Annual Growth Rate Comparison Of Startups Template PDF
The purpose of this slide is to showcase the comparison between revenue growth rates among smaller companies on a global level. The countries include China, India, Japan, United States, and Europe. Pitch your topic with ease and precision using this Worldwide Annual Growth Rate Comparison Of Startups Template PDF. This layout presents information on China Leads Among, Almost Equivalent, Revenue Growth. It is also available for immediate download and adjustment. So, changes can be made in the color, design, graphics or any other component to create a unique layout.
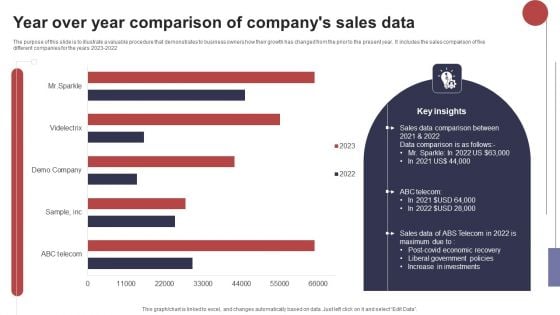
Year Over Year Comparison Of Companys Sales Data Microsoft PDF
The purpose of this slide is to illustrate a valuable procedure that demonstrates to business owners how their growth has changed from the prior to the present year. It includes the sales comparison of five different companies for the years 2023 2022. Pitch your topic with ease and precision using this Year Over Year Comparison Of Companys Sales Data Microsoft PDF. This layout presents information on Sales Data Comparison, Liberal Government, Increase Investments. It is also available for immediate download and adjustment. So, changes can be made in the color, design, graphics or any other component to create a unique layout.
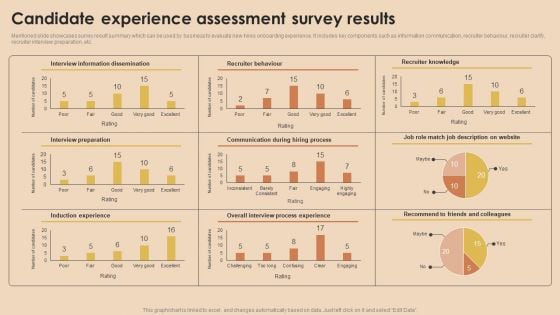
Detailed Guide For Talent Acquisition Candidate Experience Assessment Survey Results Clipart PDF
Mentioned slide showcases survey result summary which can be used by business to evaluate new hires onboarding experience. It includes key components such as information communication, recruiter behaviour, recruiter clarify, recruiter interview preparation, etc. Take your projects to the next level with our ultimate collection of Detailed Guide For Talent Acquisition Candidate Experience Assessment Survey Results Clipart PDF. Slidegeeks has designed a range of layouts that are perfect for representing task or activity duration, keeping track of all your deadlines at a glance. Tailor these designs to your exact needs and give them a truly corporate look with your own brand colors they will make your projects stand out from the rest.
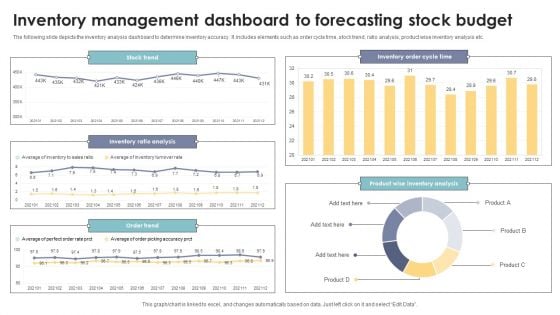
Inventory Management Dashboard To Forecasting Stock Budget Elements PDF
The following slide depicts the inventory analysis dashboard to determine inventory accuracy. It includes elements such as order cycle time, stock trend, ratio analysis, product wise inventory analysis etc. Pitch your topic with ease and precision using this Inventory Management Dashboard To Forecasting Stock Budget Elements PDF. This layout presents information on Inventory Ratio Analysis, Product Wise Inventory Analysis, Stock Trend. It is also available for immediate download and adjustment. So, changes can be made in the color, design, graphics or any other component to create a unique layout.
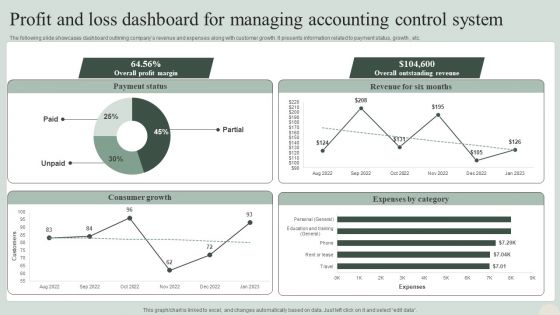
Profit And Loss Dashboard For Managing Accounting Control System Information PDF
The following slide showcases dashboard outlining companys revenue and expenses along with customer growth. It presents information related to payment status, growth , etc. Pitch your topic with ease and precision using this Profit And Loss Dashboard For Managing Accounting Control System Information PDF. This layout presents information on Consumer Growth, Expenses By Category, Overall Outstanding Revenue. It is also available for immediate download and adjustment. So, changes can be made in the color, design, graphics or any other component to create a unique layout.
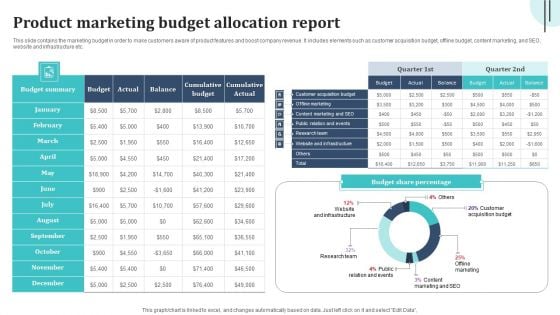
Product Marketing Budget Allocation Report Graphics PDF
This slide contains the marketing budget in order to make customers aware of product features and boost company revenue. It includes elements such as customer acquisition budget, offline budget, content marketing, and SEO, website and infrastructure etc. Pitch your topic with ease and precision using this Product Marketing Budget Allocation Report Graphics PDF. This layout presents information on Cumulative Budget, Offline Marketing, Research Team. It is also available for immediate download and adjustment. So, changes can be made in the color, design, graphics or any other component to create a unique layout.
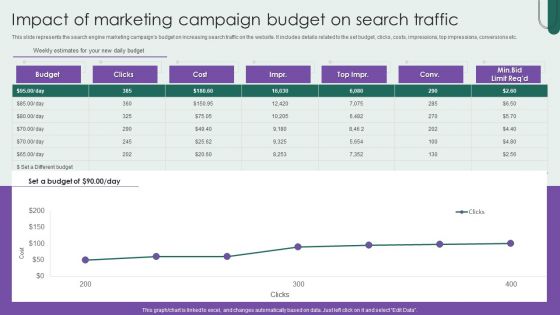
Impact Of Marketing Campaign Budget On Search Traffic Brochure PDF
This slide represents the search engine marketing campaigns budget on increasing search traffic on the website. It includes details related to the set budget, clicks, costs, impressions, top impressions, conversions etc. Pitch your topic with ease and precision using this Impact Of Marketing Campaign Budget On Search Traffic Brochure PDF. This layout presents information on Cost, Budget, Impact Of Marketing Campaign. It is also available for immediate download and adjustment. So, changes can be made in the color, design, graphics or any other component to create a unique layout.
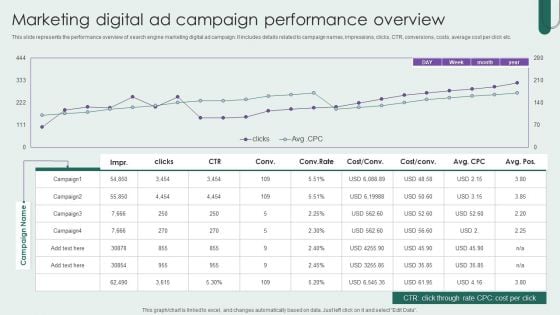
Marketing Digital Ad Campaign Performance Overview Designs PDF
This slide represents the performance overview of search engine marketing digital ad campaign. It includes details related to campaign names, impressions, clicks, CTR, conversions, costs, average cost per click etc. Pitch your topic with ease and precision using this Marketing Digital Ad Campaign Performance Overview Designs PDF. This layout presents information on Marketing Digital Ad Campaign, Performance Overview. It is also available for immediate download and adjustment. So, changes can be made in the color, design, graphics or any other component to create a unique layout.
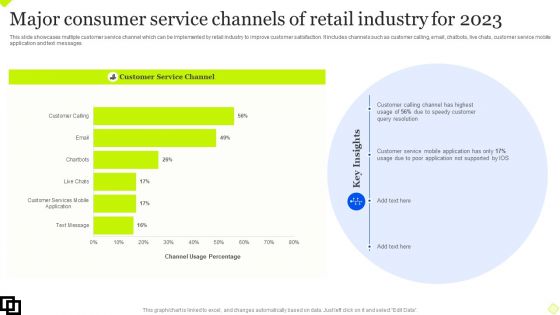
Major Consumer Service Channels Of Retail Industry For 2023 Designs PDF
This slide showcases multiple customer service channel which can be implemented by retail industry to improve customer satisfaction. It includes channels such as customer calling, email, chatbots, live chats, customer service mobile application and text messages. Pitch your topic with ease and precision using this Major Consumer Service Channels Of Retail Industry For 2023 Designs PDF. This layout presents information on Customer Service Channel, Customer Calling Channel, Customer Service Mobile Application. It is also available for immediate download and adjustment. So, changes can be made in the color, design, graphics or any other component to create a unique layout.
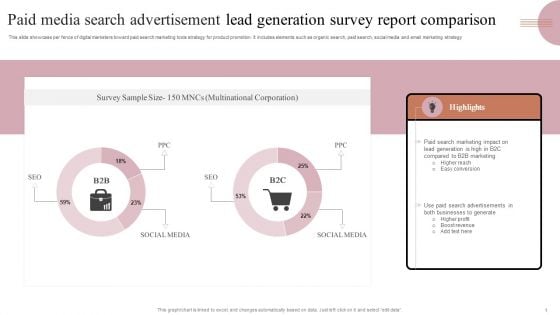
Paid Media Search Advertisement Lead Generation Survey Report Comparison Clipart PDF
This slide showcase per fence of digital marketers toward paid search marketing tools strategy for product promotion. It includes elements such as organic search, paid search, social media and email marketing strategy. Pitch your topic with ease and precision using this Paid Media Search Advertisement Lead Generation Survey Report Comparison Clipart PDF. This layout presents information on Search Marketing, B2B Marketing, Higher Profit. It is also available for immediate download and adjustment. So, changes can be made in the color, design, graphics or any other component to create a unique layout.
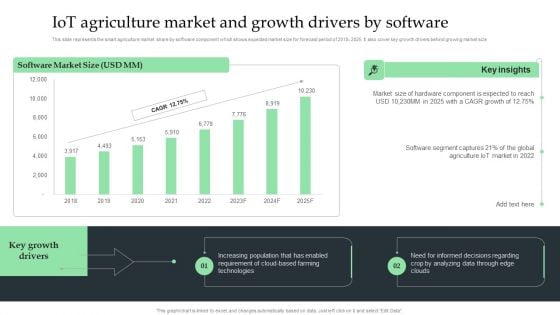
Iot Agriculture Market And Growth Drivers By Software Ppt Summary Graphics Design PDF
This slide represents the smart agriculture market share by software component which shows expected market size for forecast period of 2018- 2025. It also cover key growth drivers behind growing market size. Boost your pitch with our creative Iot Agriculture Market And Growth Drivers By Software Ppt Summary Graphics Design PDF. Deliver an awe-inspiring pitch that will mesmerize everyone. Using these presentation templates you will surely catch everyones attention. You can browse the ppts collection on our website. We have researchers who are experts at creating the right content for the templates. So you do not have to invest time in any additional work. Just grab the template now and use them.
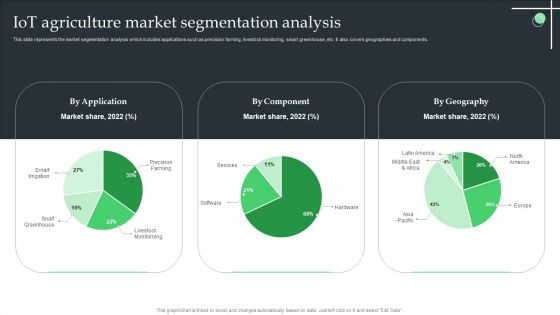
Iot Agriculture Market Segmentation Analysis Ppt Ideas Objects PDF
This slide represents the market segmentation analysis which includes applications such as precision farming, livestock monitoring, smart greenhouse, etc. It also covers geographies and components.. Create an editable Iot Agriculture Market Segmentation Analysis Ppt Ideas Objects PDF that communicates your idea and engages your audience. Whether you are presenting a business or an educational presentation, pre-designed presentation templates help save time. Iot Agriculture Market Segmentation Analysis Ppt Ideas Objects PDF is highly customizable and very easy to edit, covering many different styles from creative to business presentations. Slidegeeks has creative team members who have crafted amazing templates. So, go and get them without any delay.
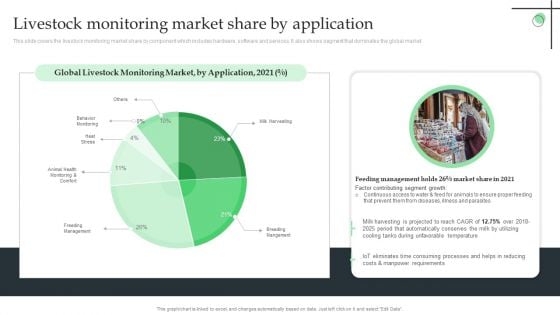
Livestock Monitoring Market Share By Application Ppt Slides Example File PDF
This slide covers the livestock monitoring market share by component which includes hardware, software and services. It also shows segment that dominates the global market. Want to ace your presentation in front of a live audience Our Livestock Monitoring Market Share By Application Ppt Slides Example File PDF can help you do that by engaging all the users towards you.. Slidegeeks experts have put their efforts and expertise into creating these impeccable powerpoint presentations so that you can communicate your ideas clearly. Moreover, all the templates are customizable, and easy-to-edit and downloadable. Use these for both personal and commercial use.
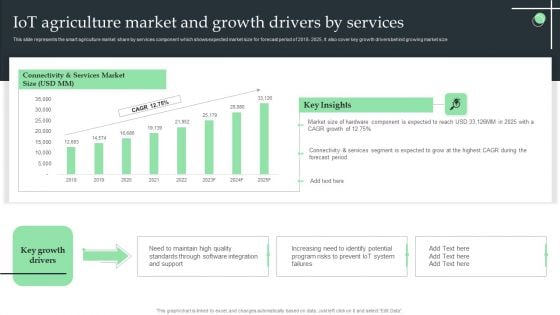
Iot Agriculture Market And Growth Drivers By Services Ppt Infographic Template Elements PDF
This slide represents the smart agriculture market share by services component which shows expected market size for forecast period of 2018- 2025. It also cover key growth drivers behind growing market size. Find a pre-designed and impeccable Iot Agriculture Market And Growth Drivers By Services Ppt Infographic Template Elements PDF. The templates can ace your presentation without additional effort. You can download these easy-to-edit presentation templates to make your presentation stand out from others. So, what are you waiting for Download the template from Slidegeeks today and give a unique touch to your presentation.
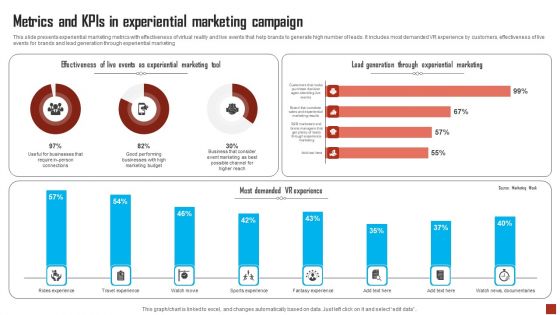
Metrics And Kpis In Experiential Marketing Campaign Structure PDF
This slide presents experiential marketing metrics with effectiveness of virtual reality and live events that help brands to generate high number of leads. It includes most demanded VR experience by customers, effectiveness of live events for brands and lead generation through experiential marketing. Pitch your topic with ease and precision using this Metrics And Kpis In Experiential Marketing Campaign Structure PDF. This layout presents information on Experiential Marketing, Business, Metrics. It is also available for immediate download and adjustment. So, changes can be made in the color, design, graphics or any other component to create a unique layout.
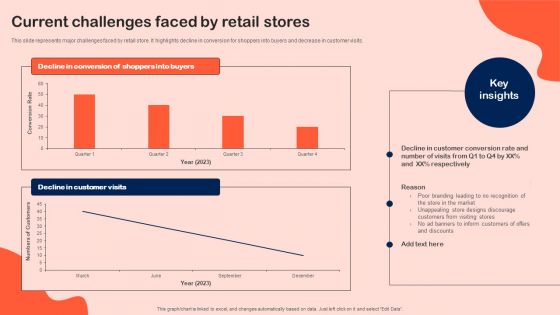
Current Challenges Faced By Retail Stores Microsoft PDF
This slide represents major challenges faced by retail store. It highlights decline in conversion for shoppers into buyers and decrease in customer visits. This Current Challenges Faced By Retail Stores Microsoft PDF from Slidegeeks makes it easy to present information on your topic with precision. It provides customization options, so you can make changes to the colors, design, graphics, or any other component to create a unique layout. It is also available for immediate download, so you can begin using it right away. Slidegeeks has done good research to ensure that you have everything you need to make your presentation stand out. Make a name out there for a brilliant performance.
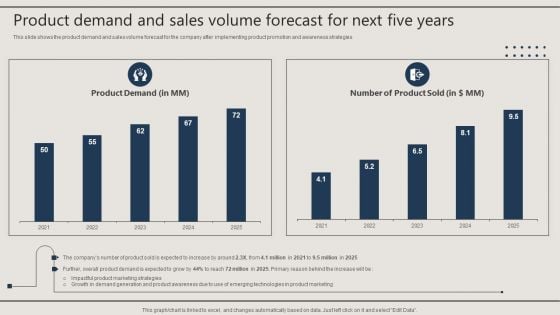
Product Demand And Sales Volume Forecast For Next Five Years Rules PDF
This slide shows the product demand and sales volume forecast for the company after implementing product promotion and awareness strategies. This Product Demand And Sales Volume Forecast For Next Five Years Rules PDF from Slidegeeks makes it easy to present information on your topic with precision. It provides customization options, so you can make changes to the colors, design, graphics, or any other component to create a unique layout. It is also available for immediate download, so you can begin using it right away. Slidegeeks has done good research to ensure that you have everything you need to make your presentation stand out. Make a name out there for a brilliant performance.
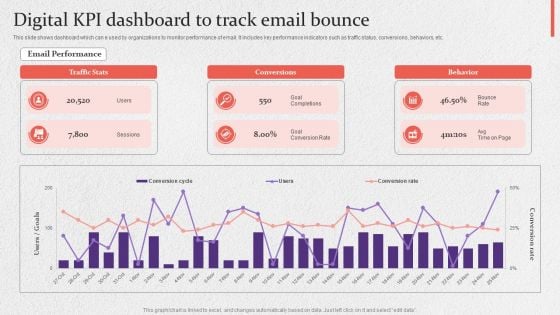
Digital KPI Dashboard To Track Email Bounce Slides PDF
This slide shows dashboard which can e used by organizations to monitor performance of email. It includes key performance indicators such as traffic status, conversions, behaviors, etc. Pitch your topic with ease and precision using this Digital KPI Dashboard To Track Email Bounce Slides PDF. This layout presents information on Digital Kpi Dashboard, Track Email Bounce. It is also available for immediate download and adjustment. So, changes can be made in the color, design, graphics or any other component to create a unique layout.
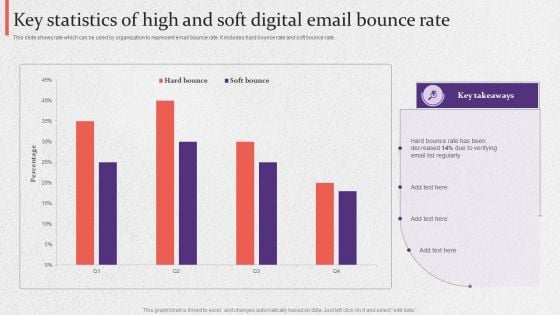
Key Statistics Of High And Soft Digital Email Bounce Rate Summary PDF
This slide shows rate which can be used by organization to represent email bounce rate. It includes hard bounce rate and soft bounce rate. Pitch your topic with ease and precision using this Key Statistics Of High And Soft Digital Email Bounce Rate Summary PDF. This layout presents information on Key Statistics, Soft Digital, Email Bounce Rate. It is also available for immediate download and adjustment. So, changes can be made in the color, design, graphics or any other component to create a unique layout.
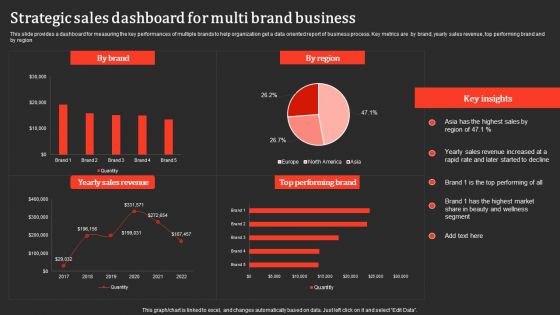
Strategic Sales Dashboard For Multi Brand Business Professional PDF
This slide provides a dashboard for measuring the key performances of multiple brands to help organization get a data oriented report of business process. Key metrics are by brand, yearly sales revenue, top performing brand and by region. Pitch your topic with ease and precision using this Strategic Sales Dashboard For Multi Brand Business Professional PDF. This layout presents information on Yearly Sales Revenue, Performing Brand. It is also available for immediate download and adjustment. So, changes can be made in the color, design, graphics or any other component to create a unique layout.
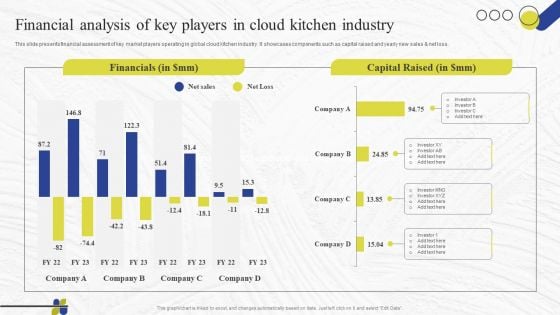
Virtual Kitchen Market Assessment Financial Analysis Of Key Players In Cloud Kitchen Industry Template PDF
This slide presents financial assessment of key market players operating in global cloud kitchen industry. It showcases components such as capital raised and yearly new sales and net loss. Boost your pitch with our creative Virtual Kitchen Market Assessment Financial Analysis Of Key Players In Cloud Kitchen Industry Template PDF. Deliver an awe-inspiring pitch that will mesmerize everyone. Using these presentation templates you will surely catch everyones attention. You can browse the ppts collection on our website. We have researchers who are experts at creating the right content for the templates. So you do not have to invest time in any additional work. Just grab the template now and use them.
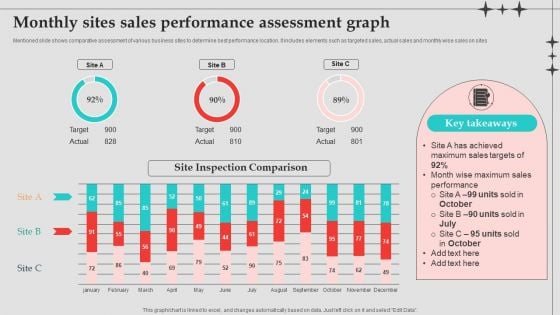
Monthly Sites Sales Performance Assessment Graph Designs PDF
Mentioned slide shows comparative assessment of various business sites to determine best performance location. It includes elements such as targeted sales, actual sales and monthly wise sales on sites. Pitch your topic with ease and precision using this Monthly Sites Sales Performance Assessment Graph Designs PDF. This layout presents information on Sales Performance, Sales Targets, Performance Assessment Graph . It is also available for immediate download and adjustment. So, changes can be made in the color, design, graphics or any other component to create a unique layout.
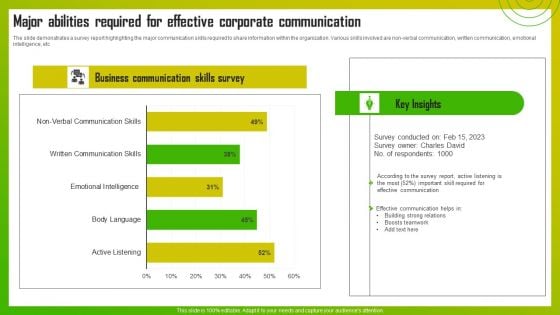
Major Abilities Required For Effective Corporate Communication Template PDF
The slide demonstrates a survey report highlighting the major communication skills required to share information within the organization. Various skills involved are non-verbal communication, written communication, emotional intelligence, etc. Pitch your topic with ease and precision using this Major Abilities Required For Effective Corporate Communication Template PDF. This layout presents information on Effective Communication, Skill Required, Boosts Teamwork. It is also available for immediate download and adjustment. So, changes can be made in the color, design, graphics or any other component to create a unique layout.
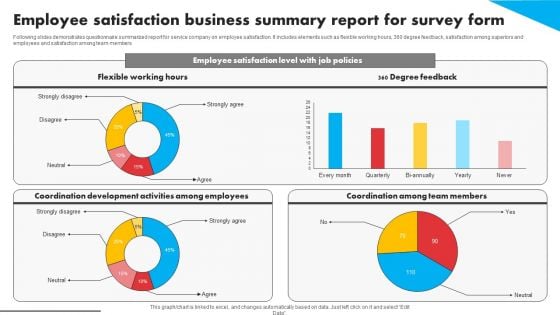
Employee Satisfaction Business Summary Report For Survey Form Survey SS
Following slides demonstrates questionnaire summarized report for service company on employee satisfaction. It includes elements such as flexible working hours, 360 degree feedback, satisfaction among superiors and employees and satisfaction among team members. Pitch your topic with ease and precision using this Employee Satisfaction Business Summary Report For Survey Form Survey SS. This layout presents information on Employee Satisfaction, Business Summary Report, Survey Form. It is also available for immediate download and adjustment. So, changes can be made in the color, design, graphics or any other component to create a unique layout.
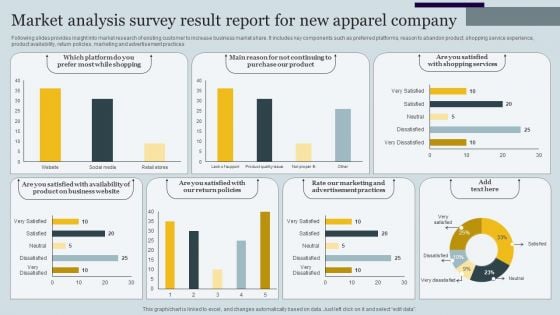
Market Analysis Survey Result Report For New Apparel Company Survey SS
Following slides provides insight into market research of existing customer to increase business market share. It includes key components such as preferred platforms, reason to abandon product, shopping service experience, product availability, return policies, marketing and advertisement practices. Showcasing this set of slides titled Market Analysis Survey Result Report For New Apparel Company Survey SS. The topics addressed in these templates are Purchase Our Product, Shopping Services, Advertisement Practices. All the content presented in this PPT design is completely editable. Download it and make adjustments in color, background, font etc. as per your unique business setting.
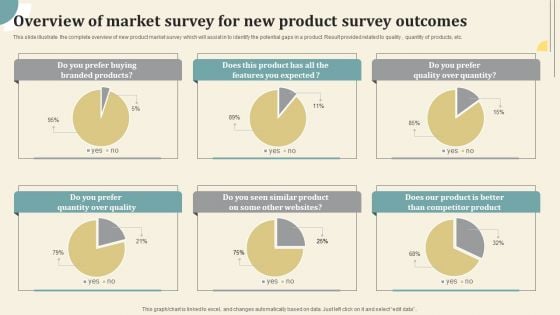
Overview Of Market Survey For New Product Survey Outcomes Survey SS
This slide illustrate the complete overview of new product market survey which will assist in to identify the potential gaps in a product. Result provided related to quality , quantity of products, etc. Pitch your topic with ease and precision using this Overview Of Market Survey For New Product Survey Outcomes Survey SS. This layout presents information on Overview Of Market Survey, Product Survey Outcomes . It is also available for immediate download and adjustment. So, changes can be made in the color, design, graphics or any other component to create a unique layout.
Umbrella Branding Measures To Boost Brand Awareness Product Branding Performance Tracking Dashboard Information PDF
This slide provides information regarding product branding performance tracking dashboard in terms of revenues, new customers, customer satisfaction rate. This Umbrella Branding Measures To Boost Brand Awareness Product Branding Performance Tracking Dashboard Information PDF from Slidegeeks makes it easy to present information on your topic with precision. It provides customization options, so you can make changes to the colors, design, graphics, or any other component to create a unique layout. It is also available for immediate download, so you can begin using it right away. Slidegeeks has done good research to ensure that you have everything you need to make your presentation stand out. Make a name out there for a brilliant performance.
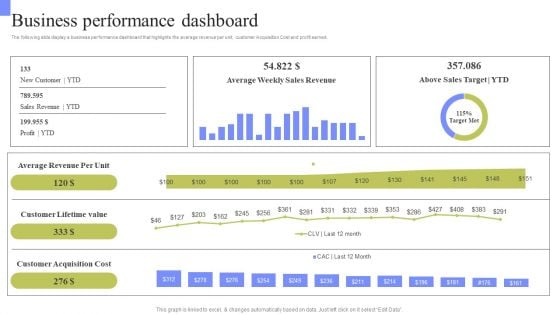
Periodic Revenue Model Business Performance Dashboard Rules PDF
The following slide display a business performance dashboard that highlights the average revenue per unit, customer Acquisition Cost and profit earned. This Periodic Revenue Model Business Performance Dashboard Rules PDF from Slidegeeks makes it easy to present information on your topic with precision. It provides customization options, so you can make changes to the colors, design, graphics, or any other component to create a unique layout. It is also available for immediate download, so you can begin using it right away. Slidegeeks has done good research to ensure that you have everything you need to make your presentation stand out. Make a name out there for a brilliant performance.
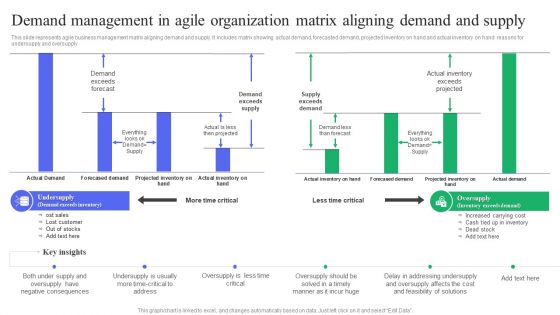
Demand Management In Agile Organization Matrix Aligning Demand And Supply Microsoft PDF
This slide represents agile business management matrix aligning demand and supply. It includes matrix showing actual demand, forecasted demand, projected inventory on hand and actual inventory on hand reasons for undersupply and oversupply Pitch your topic with ease and precision using this Demand Management In Agile Organization Matrix Aligning Demand And Supply Microsoft PDF. This layout presents information on Demand Exceeds Forecast, Demand Exceeds Supply, Supply Exceeds Demand. It is also available for immediate download and adjustment. So, changes can be made in the color, design, graphics or any other component to create a unique layout.
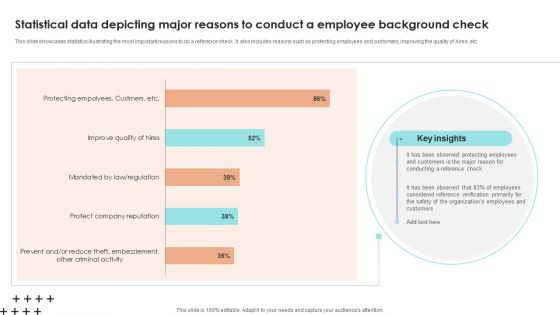
Statistical Data Depicting Major Reasons To Conduct A Employee Background Check Download PDF
This slide showcases statistics illustrating the most important reasons to do a reference check. It also includes reasons such as protecting employees and customers, improving the quality of hires, etc. Pitch your topic with ease and precision using this Statistical Data Depicting Major Reasons To Conduct A Employee Background Check Download PDF. This layout presents information on Key Insights, Reference Check, Customers. It is also available for immediate download and adjustment. So, changes can be made in the color, design, graphics or any other component to create a unique layout.
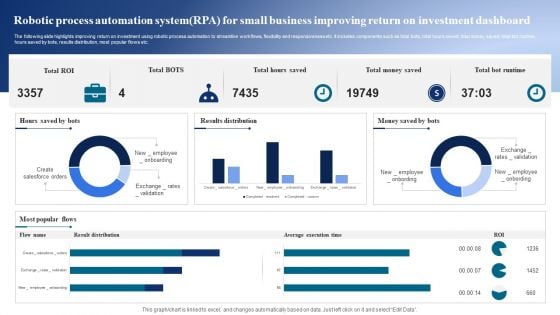
Robotic Process Automation Systemrpa For Small Business Improving Return On Investment Dashboard Ideas PDF
The following slide highlights improving return on investment using robotic process automation to streamline workflows, flexibility and responsiveness etc. It includes components such as total bots, total hours saved, total money saved, total bot runtime, hours saved by bots, results distribution, most popular flows etc. Showcasing this set of slides titled Robotic Process Automation Systemrpa For Small Business Improving Return On Investment Dashboard Ideas PDF. The topics addressed in these templates are Results Distribution, Popular Flows, Runtime. All the content presented in this PPT design is completely editable. Download it and make adjustments in color, background, font etc. as per your unique business setting.
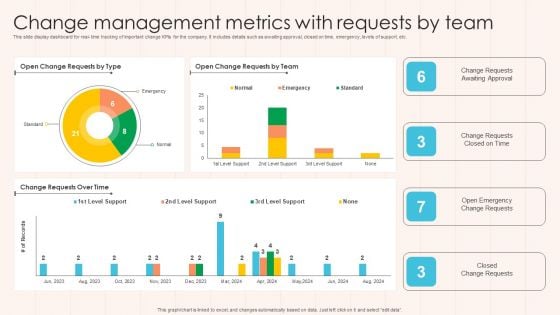
Change Management Metrics With Requests By Team Designs PDF
This slide display dashboard for real- time tracking of important change KPIs for the company. It includes details such as awaiting approval, closed on time, emergency, levels of support, etc. Pitch your topic with ease and precision using this Change Management Metrics With Requests By Team Designs PDF This layout presents information on Change Requests, Approval, Team. It is also available for immediate download and adjustment. So, changes can be made in the color, design, graphics or any other component to create a unique layout.
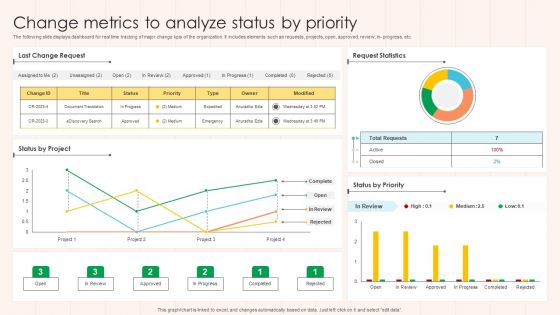
Change Metrics To Analyze Status By Priority Formats PDF
The following slide displays dashboard for real time tracking of major change kpis of the organization. It includes elements such as requests, projects, open, approved, review, in- progress, etc. Pitch your topic with ease and precision using this Change Metrics To Analyze Status By Priority Formats PDF This layout presents information on Project, Request Statistics, Priority. It is also available for immediate download and adjustment. So, changes can be made in the color, design, graphics or any other component to create a unique layout.
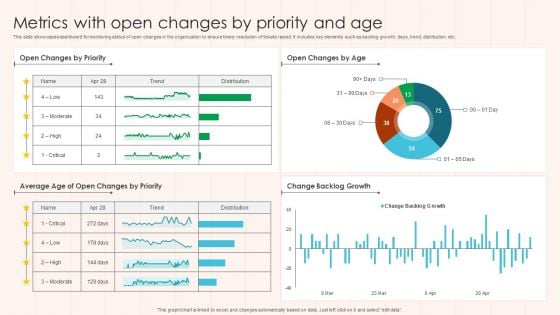
Metrics With Open Changes By Priority And Age Guidelines PDF
This slide showcases dashboard for monitoring status of open changes in the organization to ensure timely resolution of tickets raised. It includes key elements such as backlog growth, days, trend, distribution, etc. Pitch your topic with ease and precision using this Metrics With Open Changes By Priority And Age Guidelines PDF This layout presents information on Change Backlog Growth, Priority, Age. It is also available for immediate download and adjustment. So, changes can be made in the color, design, graphics or any other component to create a unique layout.

Monthly Analysis For Actual And Budget Financials Metrics Professional PDF
The following slide shows review report to compare difference in actually spend and planned budget for cost planning in future. It further includes details about maintenance and repairs, supplies, rent, mortgage, etc. Pitch your topic with ease and precision using this Monthly Analysis For Actual And Budget Financials Metrics Professional PDF. This layout presents information on Budget Totals, Expenses, Budget Overview. It is also available for immediate download and adjustment. So, changes can be made in the color, design, graphics or any other component to create a unique layout.
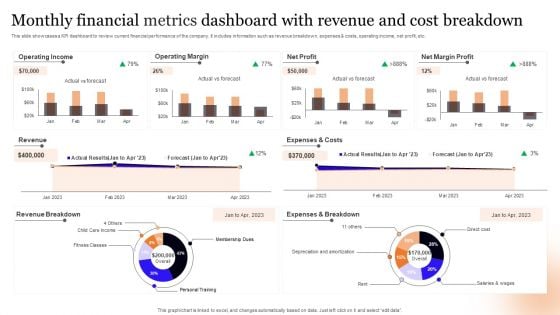
Monthly Financial Metrics Dashboard With Revenue And Cost Breakdown Information PDF
This slide showcases a KPI dashboard to review current financial performance of the company. It includes information such as revenue breakdown, expenses and costs, operating income, net profit, etc. Pitch your topic with ease and precision using this Monthly Financial Metrics Dashboard With Revenue And Cost Breakdown Information PDF. This layout presents information on Operating Income, Operating Margin, Net Profit. It is also available for immediate download and adjustment. So, changes can be made in the color, design, graphics or any other component to create a unique layout.
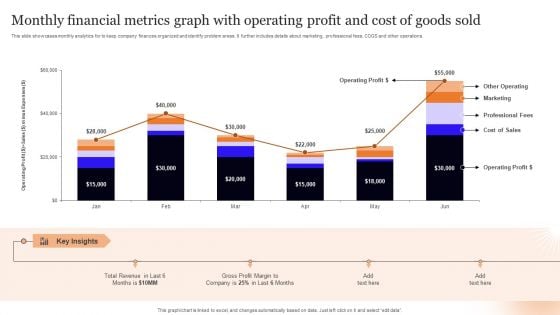
Monthly Financial Metrics Graph With Operating Profit And Cost Of Goods Sold Pictures PDF
This slide showcases monthly analytics for to keep company finances organized and identify problem areas. It further includes details about marketing, professional fees, COGS and other operations. Pitch your topic with ease and precision using this Monthly Financial Metrics Graph With Operating Profit And Cost Of Goods Sold Pictures PDF. This layout presents information on Key Insights, Operating Profit, Total Revenue. It is also available for immediate download and adjustment. So, changes can be made in the color, design, graphics or any other component to create a unique layout.
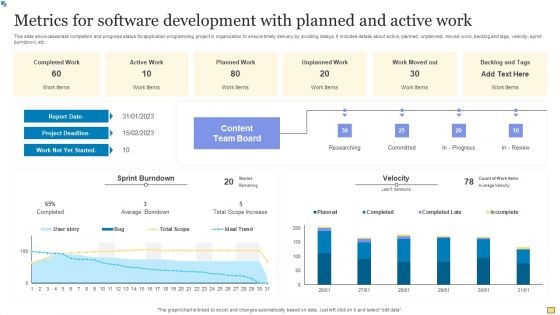
Metrics For Software Development With Planned And Active Work Structure PDF
This slide showcases task completion and progress status for application programming project in organization to ensure timely delivery by avoiding delays. It includes details about active, planned, unplanned, moved work, backlog and tags, velocity, sprint burndown, etc. Pitch your topic with ease and precision using this Metrics For Software Development With Planned And Active Work Structure PDF. This layout presents information on Metrics For Software Development With Planned And Active Work Structure PDF. It is also available for immediate download and adjustment. So, changes can be made in the color, design, graphics or any other component to create a unique layout.
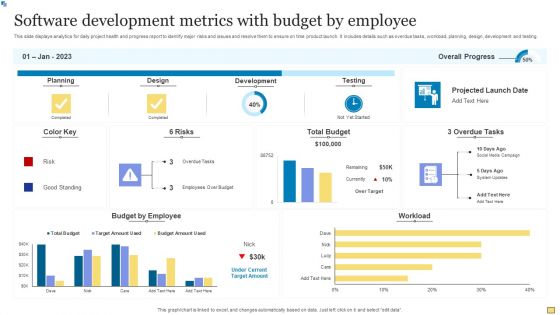
Software Development Metrics With Budget By Employee Guidelines PDF
This slide displays analytics for daily project health and progress report to identify major risks and issues and resolve them to ensure on time product launch. It includes details such as overdue tasks, workload, planning, design, development and testing. Pitch your topic with ease and precision using this Software Development Metrics With Budget By Employee Guidelines PDF. This layout presents information on Planning, Development, Testing. It is also available for immediate download and adjustment. So, changes can be made in the color, design, graphics or any other component to create a unique layout.
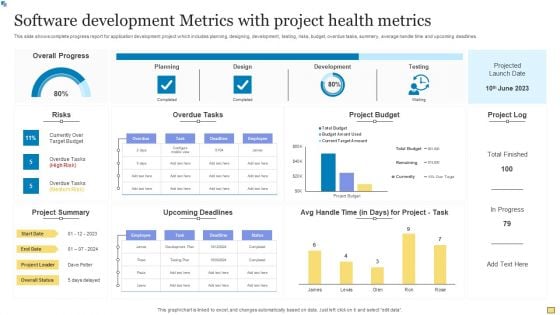
Software Development Metrics With Project Health Metrics Graphics PDF
This slide shows complete progress report for application development project which includes planning, designing, development, testing, risks, budget, overdue tasks, summery, average handle time and upcoming deadlines. Pitch your topic with ease and precision using this Software Development Metrics With Project Health Metrics Graphics PDF. This layout presents information on Overall Progress, Overdue Tasks, Project Budget. It is also available for immediate download and adjustment. So, changes can be made in the color, design, graphics or any other component to create a unique layout.
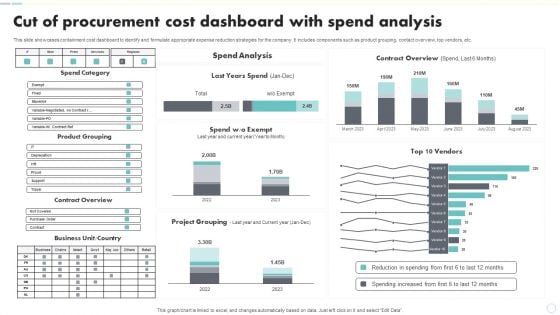
Cut Of Procurement Cost Dashboard With Spend Analysis Elements PDF
This slide showcases containment cost dashboard to identify and formulate appropriate expense reduction strategies for the company. It includes components such as product grouping, contact overview, top vendors, etc. Showcasing this set of slides titled Cut Of Procurement Cost Dashboard With Spend Analysis Elements PDF. The topics addressed in these templates are Spend Category, Product Grouping, Contract Overview. All the content presented in this PPT design is completely editable. Download it and make adjustments in color, background, font etc. as per your unique business setting.
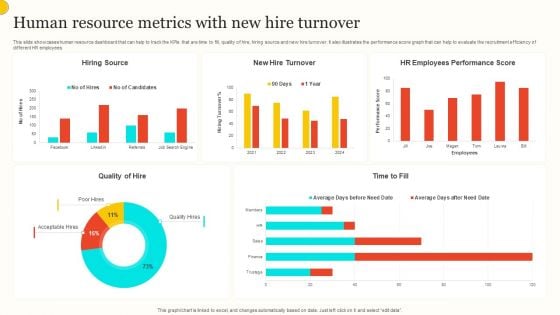
Human Resource Metrics With New Hire Turnover Professional PDF
This slide showcases human resource dashboard that can help to track the KPIs that are time to fill, quality of hire, hiring source and new hire turnover. It also illustrates the performance score graph that can help to evaluate the recruitment efficiency of different HR employees. Pitch your topic with ease and precision using this Human Resource Metrics With New Hire Turnover Professional PDF. This layout presents information on Hiring Source, New Hire Turnover, Hr Employees Performance Score. It is also available for immediate download and adjustment. So, changes can be made in the color, design, graphics or any other component to create a unique layout.
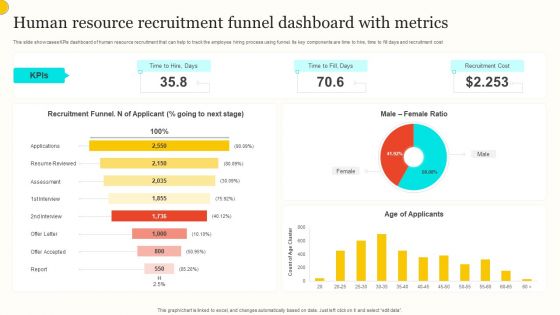
Human Resource Recruitment Funnel Dashboard With Metrics Summary PDF
This slide showcases KPIs dashboard of human resource recruitment that can help to track the employee hiring process using funnel. Its key components are time to hire, time to fill days and recruitment cost. Showcasing this set of slides titled Human Resource Recruitment Funnel Dashboard With Metrics Summary PDF. The topics addressed in these templates are Recruitment Funnel, Male Female Ratio, Age Applicants. All the content presented in this PPT design is completely editable. Download it and make adjustments in color, background, font etc. as per your unique business setting.
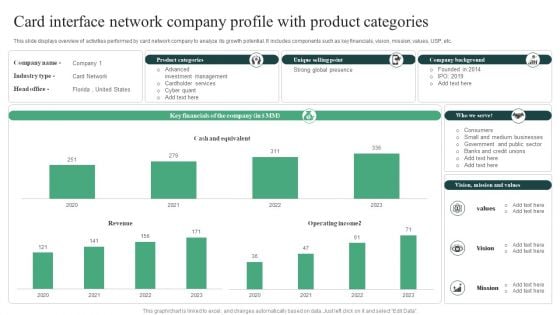
Card Interface Network Company Profile With Product Categories Pictures PDF
This slide displays overview of activities performed by card network company to analyze its growth potential. It includes components such as key financials, vision, mission, values, USP, etc. Showcasing this set of slides titled Card Interface Network Company Profile With Product Categories Pictures PDF. The topics addressed in these templates are Company Background, Unique Selling Point, Product Categories . All the content presented in this PPT design is completely editable. Download it and make adjustments in color, background, font etc. as per your unique business setting.

Hotel Administration Software Dashboard For Business Intelligence Infographics PDF
This slide covers HMS dashboard. The purpose of this dashboard is to get an overview of hotel key metrics and to check financial status against targets. It includes elements such as reservations, check in guests, reservation type and housekeeping. Pitch your topic with ease and precision using this Hotel Administration Software Dashboard For Business Intelligence Infographics PDF. This layout presents information on Guest, Housekeeping, Reservation Type. It is also available for immediate download and adjustment. So, changes can be made in the color, design, graphics or any other component to create a unique layout.
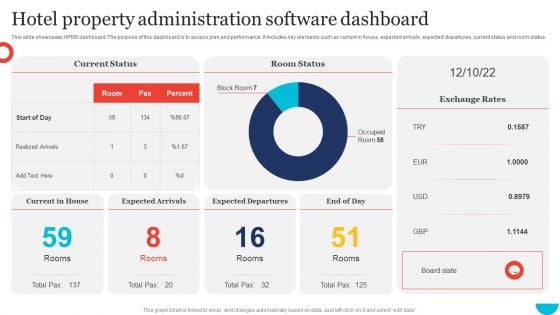
Hotel Property Administration Software Dashboard Guidelines PDF
This slide showcases HPMS dashboard. The purpose of this dashboard is to access plan and performance. It includes key elements such as current in house, expected arrivals, expected departures, current status and room status. Pitch your topic with ease and precision using this Hotel Property Administration Software Dashboard Guidelines PDF. This layout presents information on Current Status, Room Status, Exchange Rates. It is also available for immediate download and adjustment. So, changes can be made in the color, design, graphics or any other component to create a unique layout.
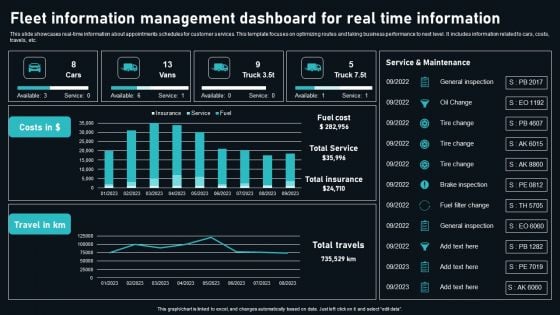
Fleet Information Management Dashboard For Real Time Information Graphics PDF
This slide showcases real time information about appointments schedules for customer services. This template focuses on optimizing routes and taking business performance to next level. It includes information related to cars, costs, travels, etc. Pitch your topic with ease and precision using this Fleet Information Management Dashboard For Real Time Information Graphics PDF. This layout presents information on General Inspection, Oil Change, Tire Change. It is also available for immediate download and adjustment. So, changes can be made in the color, design, graphics or any other component to create a unique layout.
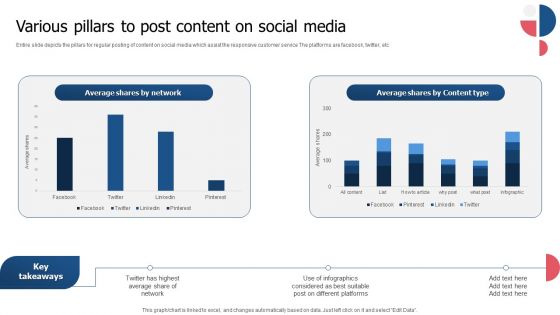
Various Pillars To Post Content On Social Media Mockup PDF
Entire slide depicts the pillars for regular posting of content on social media which assist the responsive customer service The platforms are facebook, twitter, etc. Pitch your topic with ease and precision using this Various Pillars To Post Content On Social Media Mockup PDF. This layout presents information on Average Shares Network, Average Shares Content Type, Average Share Network. It is also available for immediate download and adjustment. So, changes can be made in the color, design, graphics or any other component to create a unique layout.

 Home
Home