Organizational Icons
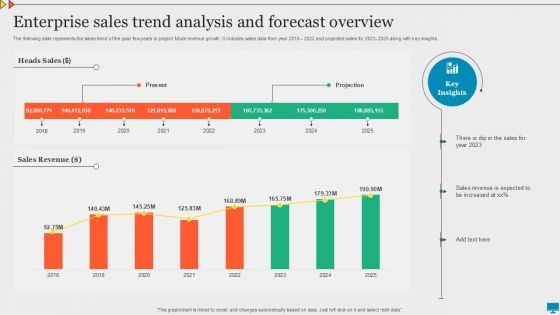
Enterprise Sales Trend Analysis And Forecast Overview Summary PDF
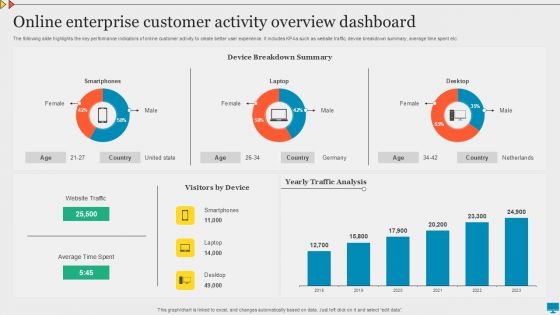
Online Enterprise Customer Activity Overview Dashboard Download PDF
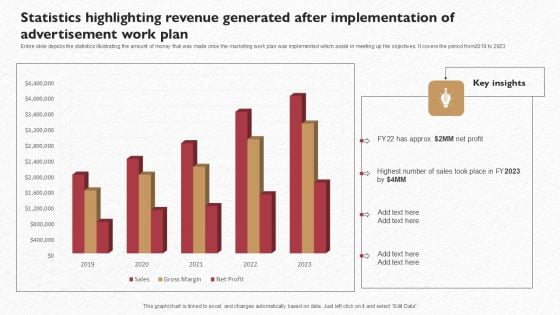
Statistics Highlighting Revenue Generated After Implementation Of Advertisement Work Plan Professional PDF
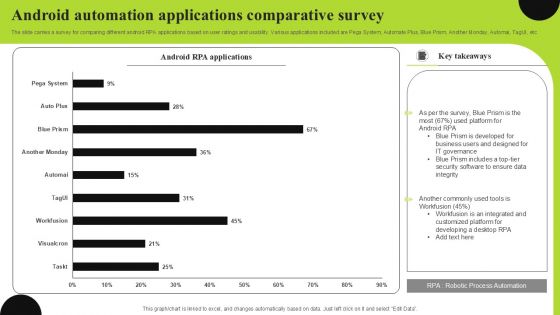
Android Automation Applications Comparative Survey Pictures PDF
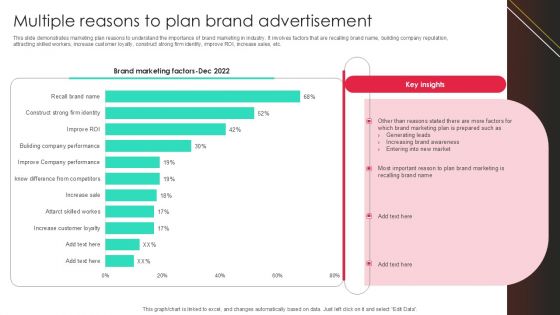
Multiple Reasons To Plan Brand Advertisement Clipart PDF
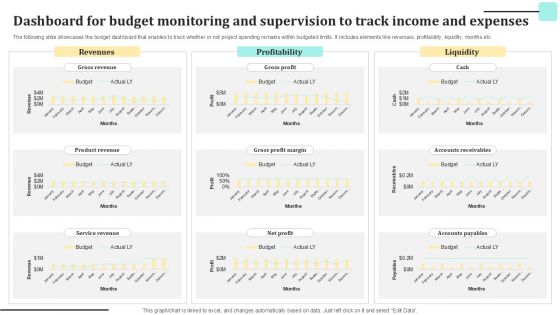
Dashboard For Budget Monitoring And Supervision To Track Income And Expenses Guidelines PDF
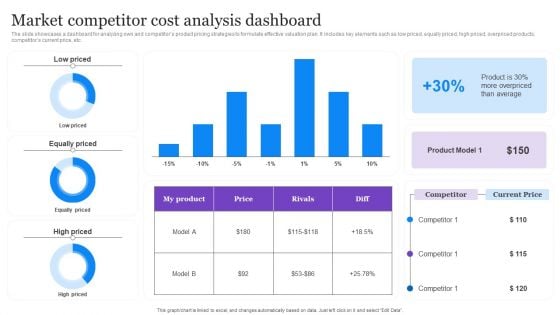
Market Competitor Cost Analysis Dashboard Graphics PDF
The slide showcases a dashboard for analyzing own and competitors product pricing strategies to formulate effective valuation plan. It includes key elements such as low priced, equally priced, high priced, overpriced products, competitors current price, etc. Pitch your topic with ease and precision using this Market Competitor Cost Analysis Dashboard Graphics PDF. This layout presents information on Average, Product Model, Cost Analysis Dashboard. It is also available for immediate download and adjustment. So, changes can be made in the color, design, graphics or any other component to create a unique layout.

Skill Enhancement Plan Dashboard For Training Program Evaluation Download PDF
This slide showcases dashboard that can help organization to evaluate the training program implemented in organization. Its key components are training cost, number of participants, hours of training, cost per participant and occupancy rate. From laying roadmaps to briefing everything in detail, our templates are perfect for you. You can set the stage with your presentation slides. All you have to do is download these easy-to-edit and customizable templates. Skill Enhancement Plan Dashboard For Training Program Evaluation Download PDF will help you deliver an outstanding performance that everyone would remember and praise you for. Do download this presentation today.

Enterprise Recruitment Dashboard With Cost Per Hire Graphics PDF
The following slide showcases KPI dashboard to get real- time insights about efficiency of corporate staffing process in the organization. It includes elements such as hired, days to fill, sources contribution, etc. Pitch your topic with ease and precision using this Enterprise Recruitment Dashboard With Cost Per Hire Graphics PDF. This layout presents information on Enterprise, Contribution, Cost. It is also available for immediate download and adjustment. So, changes can be made in the color, design, graphics or any other component to create a unique layout.
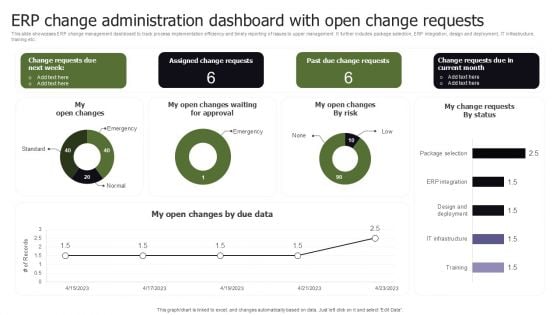
ERP Change Administration Dashboard With Open Change Requests Wd Topics PDF
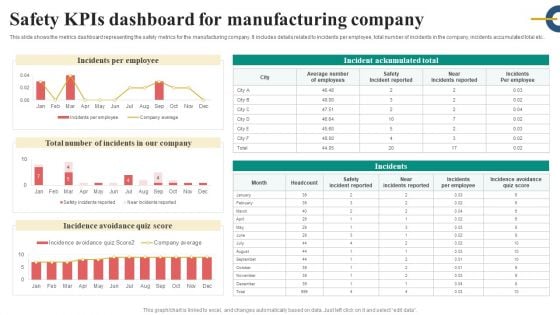
Safety Kpis Dashboard For Manufacturing Company Slides PDF
This slide shows the metrics dashboard representing the safety metrics for the manufacturing company. It includes details related to incidents per employee, total number of incidents in the company, incidents accumulated total etc.. Pitch your topic with ease and precision using this Safety Kpis Dashboard For Manufacturing Company Slides PDF. This layout presents information on Incidents Per Employee, Safety Incident Reported, Incidence Avoidance Quiz Score. It is also available for immediate download and adjustment. So, changes can be made in the color, design, graphics or any other component to create a unique layout.
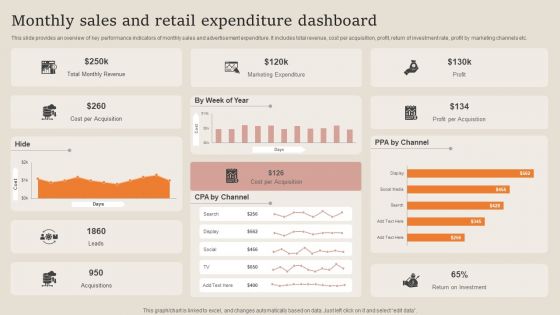
Monthly Sales And Retail Expenditure Dashboard Summary PDF
This slide provides an overview of key performance indicators of monthly sales and advertisement expenditure. It includes total revenue, cost per acquisition, profit, return of investment rate, profit by marketing channels etc. Pitch your topic with ease and precision using this Monthly Sales And Retail Expenditure Dashboard Summary PDF. This layout presents information on Marketing Expenditure, Revenue, Cost Per Acquisition. It is also available for immediate download and adjustment. So, changes can be made in the color, design, graphics or any other component to create a unique layout.

Retail Expenditure Dashboard And Performance Dashboard Formats PDF
This slide enables to track quarterly performance and return on marketing expenditure of online marketing executed by an organization. It includes source wise performance report , return on investment, sales funnel, average order value report etc. Pitch your topic with ease and precision using this Retail Expenditure Dashboard And Performance Dashboard Formats PDF. This layout presents information on Return On Investment, Product Sales, Revenue. It is also available for immediate download and adjustment. So, changes can be made in the color, design, graphics or any other component to create a unique layout.
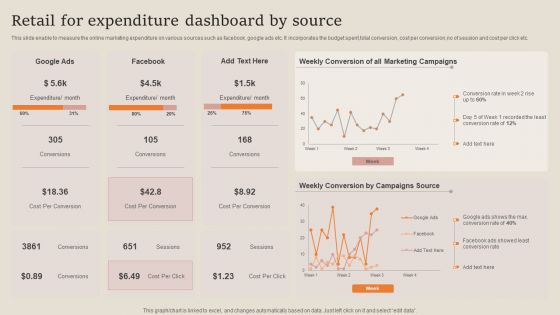
Retail For Expenditure Dashboard By Source Professional PDF
This slide enable to measure the online marketing expenditure on various sources such as facebook, google ads etc. It incorporates the budget spent,total conversion, cost per conversion,no of session and cost per click etc. Pitch your topic with ease and precision using this Retail For Expenditure Dashboard By Source Professional PDF. This layout presents information on Campaigns Source, Conversion Rate, Marketing Campaigns. It is also available for immediate download and adjustment. So, changes can be made in the color, design, graphics or any other component to create a unique layout.
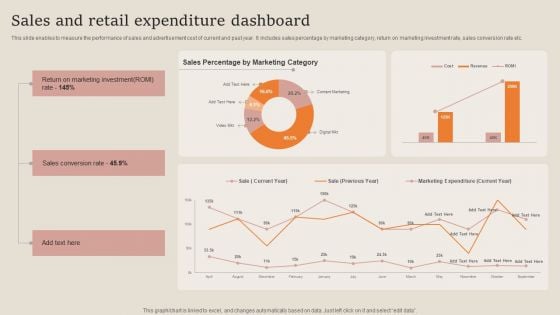
Sales And Retail Expenditure Dashboard Guidelines PDF
This slide enables to measure the performance of sales and advertisement cost of current and past year. It includes sales percentage by marketing category, return on marketing investment rate, sales conversion rate etc. Pitch your topic with ease and precision using this Sales And Retail Expenditure Dashboard Guidelines PDF. This layout presents information on Sales Conversion Rate, Marketing Investment. It is also available for immediate download and adjustment. So, changes can be made in the color, design, graphics or any other component to create a unique layout.
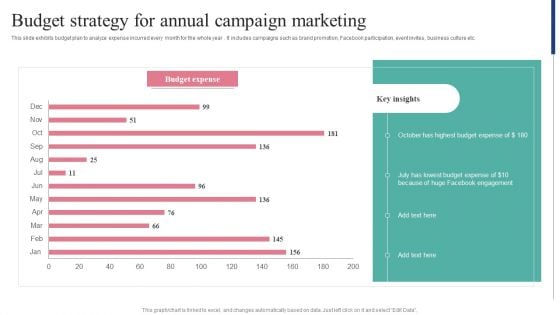
Budget Strategy For Annual Campaign Marketing Guidelines PDF
This slide exhibits budget plan to analyze expense incurred every month for the whole year . It includes campaigns such as brand promotion, Facebook participation, event invites, business culture etc. Pitch your topic with ease and precision using this Budget Strategy For Annual Campaign Marketing Guidelines PDF. This layout presents information on Budget Expense, Key Insights, Marketing. It is also available for immediate download and adjustment. So, changes can be made in the color, design, graphics or any other component to create a unique layout.
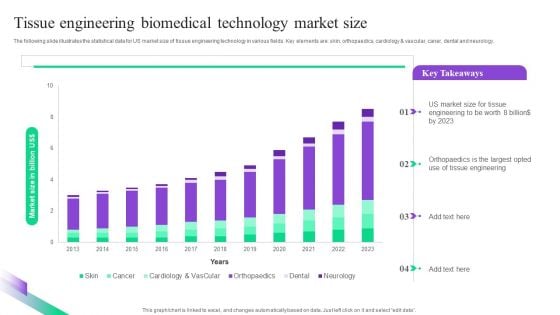
Tissue Engineering Biomedical Technology Market Size Summary PDF
The following slide illustrates the statistical data for US market size of tissue engineering technology in various fields. Key elements are skin, orthopaedics, cardiology and vascular, caner, dental and neurology. Pitch your topic with ease and precision using this Tissue Engineering Biomedical Technology Market Size Summary PDF. This layout presents information on Tissue, Engineering, Market Size. It is also available for immediate download and adjustment. So, changes can be made in the color, design, graphics or any other component to create a unique layout.
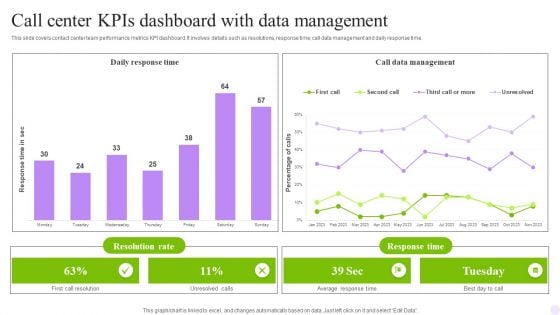
Call Center Kpis Dashboard With Data Management Infographics PDF
This slide covers contact center metrics KPI dashboard with call data details. It involves details such as total number of contacts handled, product sales, repeated calls and contact handles per day. Pitch your topic with ease and precision using this Call Center Kpis Dashboard With Data Management Infographics PDF. This layout presents information on Achieved, Contacts Handled, Repeated Calls. It is also available for immediate download and adjustment. So, changes can be made in the color, design, graphics or any other component to create a unique layout.
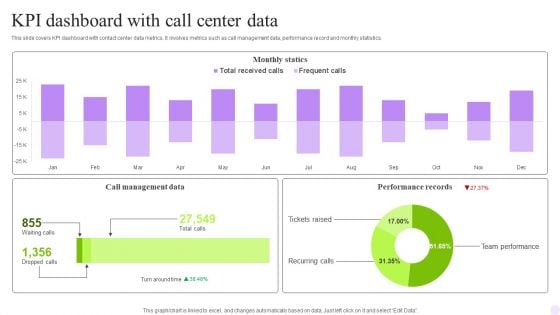
KPI Dashboard With Call Center Data Rules PDF
This slide covers contact center performance metrics KPI dashboard. It involves details such as number of total calls, average answer speed, abandon rate, data of agents performance and call abandon rate by departments. Pitch your topic with ease and precision using this KPI Dashboard With Call Center Data Rules PDF. This layout presents information on Monthly Statics, Management Data, Performance Records. It is also available for immediate download and adjustment. So, changes can be made in the color, design, graphics or any other component to create a unique layout.
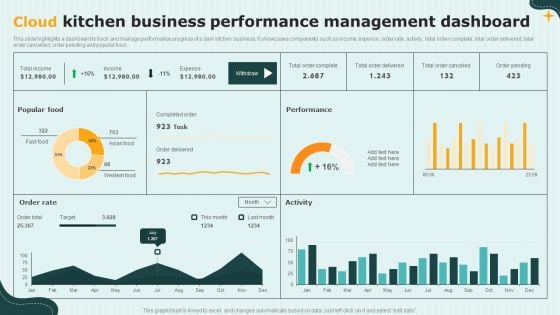
International Cloud Kitchen Industry Analysis Cloud Kitchen Business Performance Management Guidelines PDF
This slide highlights a dashboard to track and manage performance progress of a dark kitchen business. It showcases components such as income, expense, order rate, activity, total order complete, total order delivered, total order cancelled, order pending and popular food. From laying roadmaps to briefing everything in detail, our templates are perfect for you. You can set the stage with your presentation slides. All you have to do is download these easy-to-edit and customizable templates. International Cloud Kitchen Industry Analysis Cloud Kitchen Business Performance Management Guidelines PDF will help you deliver an outstanding performance that everyone would remember and praise you for. Do download this presentation today.
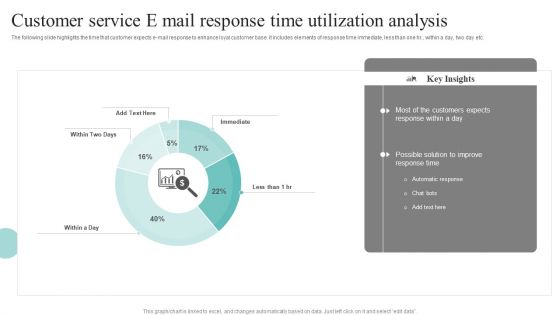
Customer Service E Mail Response Time Utilization Analysis Portrait PDF
The following slide highlights the time that customer expects e-mail response to enhance loyal customer base. It includes elements of response time immediate, less than one hr., within a day, two day etc. Pitch your topic with ease and precision using this Customer Service E Mail Response Time Utilization Analysis Portrait PDF. This layout presents information on Customer Service, E Mail Response, Time Utilization Analysis. It is also available for immediate download and adjustment. So, changes can be made in the color, design, graphics or any other component to create a unique layout.
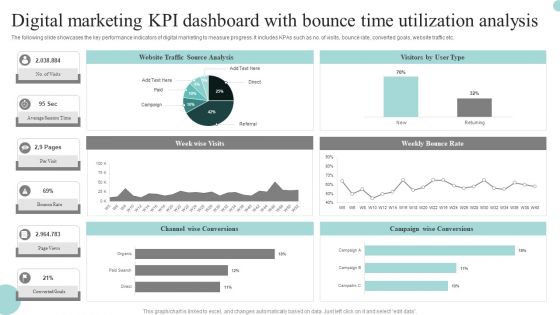
Digital Marketing Kpi Dashboard With Bounce Time Utilization Analysis Graphics PDF
The following slide showcases the key performance indicators of digital marketing to measure progress. It includes KPAs such as no. of visits, bounce rate, converted goals, website traffic etc. Pitch your topic with ease and precision using this Digital Marketing Kpi Dashboard With Bounce Time Utilization Analysis Graphics PDF. This layout presents information on Digital Marketing, KPI Dashboard, Bounce Time Utilization Analysis. It is also available for immediate download and adjustment. So, changes can be made in the color, design, graphics or any other component to create a unique layout.
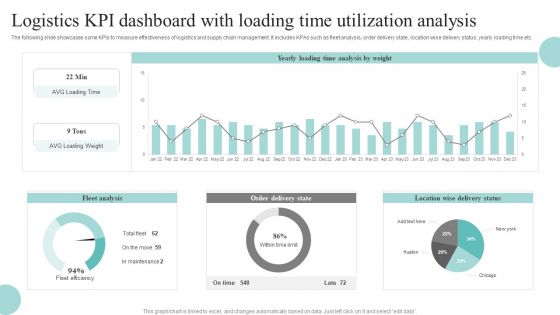
Logistics KPI Dashboard With Loading Time Utilization Analysis Download PDF
The following slide showcases some KPIs to measure effectiveness of logistics and supply chain management. It includes KPAs such as fleet analysis, order delivery state, location wise delivery status, yearly loading time etc. Pitch your topic with ease and precision using this Logistics KPI Dashboard With Loading Time Utilization Analysis Download PDF. This layout presents information on Fleet Analysis, Order Delivery State, Location Wise Delivery Status. It is also available for immediate download and adjustment. So, changes can be made in the color, design, graphics or any other component to create a unique layout.
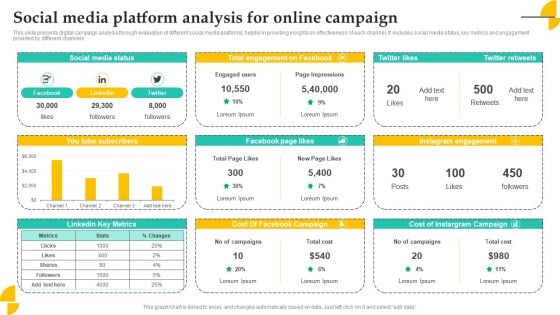
Social Media Platform Analysis For Online Campaign Summary PDF
This slide presents digital campaign analysis through evaluation of different social media platforms, helpful in providing insights on effectiveness of each channel. It includes social media status, key metrics and engagement provided by different channels Pitch your topic with ease and precision using this Social Media Platform Analysis For Online Campaign Summary PDF. This layout presents information on Media Status, Campaign, Engagement. It is also available for immediate download and adjustment. So, changes can be made in the color, design, graphics or any other component to create a unique layout.
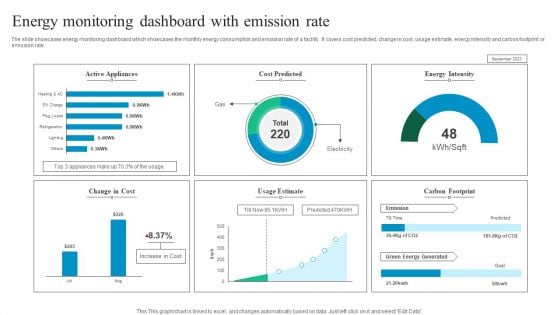
Energy Monitoring Dashboard With Emission Rate Mockup PDF
The slide showcases energy monitoring dashboard which showcases the monthly energy consumption and emission rate of a facility. It covers cost predicted, change in cost, usage estimate, energy intensity and carbon footprint or emission rate. Pitch your topic with ease and precision using this Energy Monitoring Dashboard With Emission Rate Mockup PDF. This layout presents information on Active Appliances, Cost Predicted, Energy Intensity. It is also available for immediate download and adjustment. So, changes can be made in the color, design, graphics or any other component to create a unique layout.
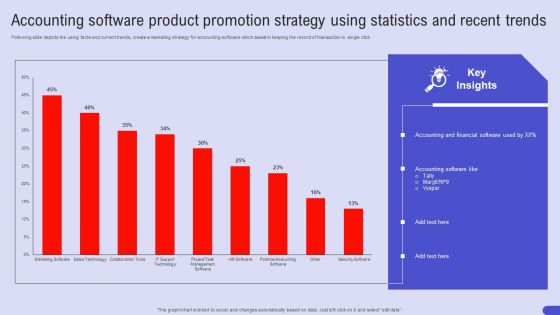
Accounting Software Product Promotion Strategy Using Statistics And Recent Trends Sample PDF
Following slide depicts the using facts and current trends, create a marketing strategy for accounting software which assist in keeping the record of transaction in single click. Pitch your topic with ease and precision using this Accounting Software Product Promotion Strategy Using Statistics And Recent Trends Sample PDF. This layout presents information on Accounting Software Product, Promotion Strategy, Statistics And Recent Trends. It is also available for immediate download and adjustment. So, changes can be made in the color, design, graphics or any other component to create a unique layout.

IT Cyber Threat Prevention Technology Market Topics PDF
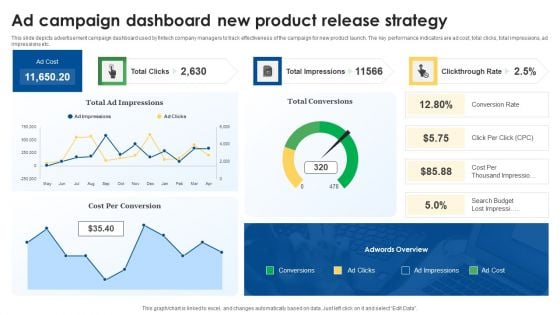
Ad Campaign Dashboard New Product Release Strategy Guidelines PDF
This slide depicts advertisement campaign dashboard used by fintech company managers to track effectiveness of the campaign for new product launch. The key performance indicators are ad cost, total clicks, total impressions, ad impressions etc. Pitch your topic with ease and precision using this Ad Campaign Dashboard New Product Release Strategy Guidelines PDF. This layout presents information on Impressions, Conversion, Strategy. It is also available for immediate download and adjustment. So, changes can be made in the color, design, graphics or any other component to create a unique layout.
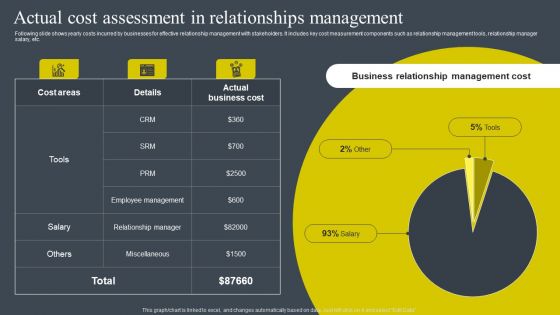
Actual Cost Assessment In Relationships Management Guidelines PDF
Following slide shows yearly costs incurred by businesses for effective relationship management with stakeholders. It includes key cost measurement components such as relationship management tools, relationship manager salary, etc. Find a pre-designed and impeccable Actual Cost Assessment In Relationships Management Guidelines PDF. The templates can ace your presentation without additional effort. You can download these easy-to-edit presentation templates to make your presentation stand out from others. So, what are you waiting for Download the template from Slidegeeks today and give a unique touch to your presentation.
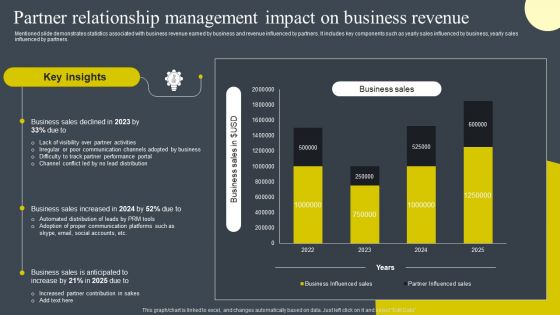
Partner Relationship Management Impact On Business Revenue Summary PDF
Mentioned slide demonstrates statistics associated with business revenue earned by business and revenue influenced by partners. It includes key components such as yearly sales influenced by business, yearly sales influenced by partners. Create an editable Partner Relationship Management Impact On Business Revenue Summary PDF that communicates your idea and engages your audience. Whether you are presenting a business or an educational presentation, pre-designed presentation templates help save time. Partner Relationship Management Impact On Business Revenue Summary PDF is highly customizable and very easy to edit, covering many different styles from creative to business presentations. Slidegeeks has creative team members who have crafted amazing templates. So, go and get them without any delay.

Customer Segmentation Dashboard For Market Research Ppt Portfolio Format PDF
The following slide presents a customer segmentation dashboard distributing customers on demographics basis. It includes key components such as gender, technology adoption lifecycle, education and brand innovation consent. Find a pre designed and impeccable Customer Segmentation Dashboard For Market Research Ppt Portfolio Format PDF. The templates can ace your presentation without additional effort. You can download these easy to edit presentation templates to make your presentation stand out from others. So, what are you waiting for Download the template from Slidegeeks today and give a unique touch to your presentation.
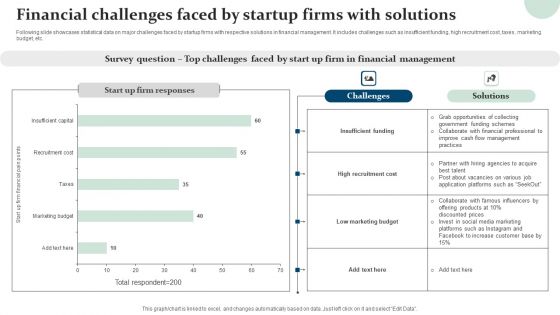
Financial Challenges Faced By Startup Firms With Solutions Slides PDF
Following slide showcases statistical data on major challenges faced by startup firms with respective solutions in financial management. It includes challenges such as insufficient funding, high recruitment cost, taxes, marketing budget, etc. Pitch your topic with ease and precision using this Financial Challenges Faced By Startup Firms With Solutions Slides PDF. This layout presents information on Insufficient Funding, High Recruitment Cost, Low Marketing Budget. It is also available for immediate download and adjustment. So, changes can be made in the color, design, graphics or any other component to create a unique layout.
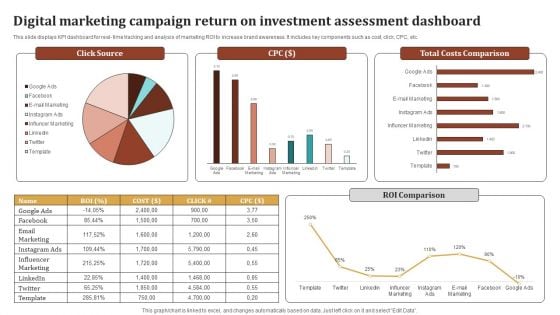
Digital Marketing Campaign Return On Investment Assessment Dashboard Ideas PDF
This slide displays KPI dashboard for real- time tracking and analysis of marketing ROI to increase brand awareness. It includes key components such as cost, click, CPC, etc. Showcasing this set of slides titled Digital Marketing Campaign Return On Investment Assessment Dashboard Ideas PDF. The topics addressed in these templates are Influencer Marketing, Email Marketing, Total Costs Comparison, Roi Comparison. All the content presented in this PPT design is completely editable. Download it and make adjustments in color, background, font etc. as per your unique business setting.
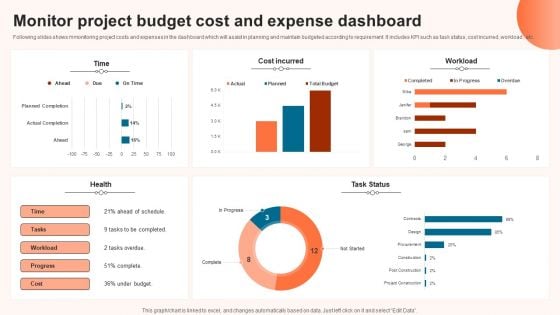
Monitor Project Budget Cost And Expense Dashboard Brochure PDF
Following slides shows mmonitoring project costs and expenses in the dashboard which will assist in planning and maintain budgeted according to requirement. It includes KPI such as task status, cost incurred ,workload , etc. Pitch your topic with ease and precision using this Monitor Project Budget Cost And Expense Dashboard Brochure PDF. This layout presents information on Expense Dashboard, Monitor Project Budget Cost. It is also available for immediate download and adjustment. So, changes can be made in the color, design, graphics or any other component to create a unique layout.
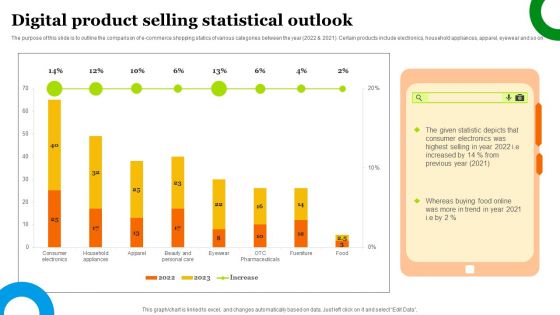
Digital Product Selling Statistical Outlook Guidelines PDF
The purpose of this slide is to outline the comparison of e-commerce shopping statics of various categories between the year 2022 and 2021. Certain products include electronics, household appliances, apparel, eyewear and so on. Pitch your topic with ease and precision using this Digital Product Selling Statistical Outlook Guidelines PDF. This layout presents information on Digital Product, Selling Statistical Outlook. It is also available for immediate download and adjustment. So, changes can be made in the color, design, graphics or any other component to create a unique layout.

Vendor Performance KPI With Rejection Rate Inspiration PDF
This slide exhibits supplier dashboard which allows organisation to monitor level of dependency towards supplier and analyse the quality of each of them. It includes elements such as number of suppliers currently, compliance rate, rejection rate, etc. Pitch your topic with ease and precision using this Vendor Performance KPI With Rejection Rate Inspiration PDF. This layout presents information on Vendor Performance KPI, Rejection Rate. It is also available for immediate download and adjustment. So, changes can be made in the color, design, graphics or any other component to create a unique layout.
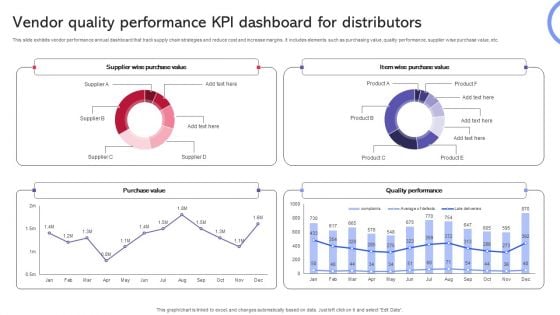
Vendor Quality Performance KPI Dashboard For Distributors Template PDF
This slide exhibits vendor performance annual dashboard that track supply chain strategies and reduce cost and increase margins. It includes elements such as purchasing value, quality performance, supplier wise purchase value, etc. Pitch your topic with ease and precision using this Vendor Quality Performance KPI Dashboard For Distributors Template PDF. This layout presents information on Purchase Value, Quality Performance, Supplier Wise Purchase Value. It is also available for immediate download and adjustment. So, changes can be made in the color, design, graphics or any other component to create a unique layout.
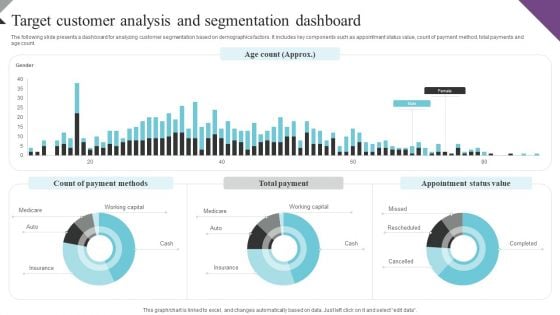
Customer Segmentation And Behavioral Analysis Target Customer Analysis Ideas PDF
The following slide presents a dashboard for analyzing customer segmentation based on demographics factors. It includes key components such as appointment status value, count of payment method, total payments and age count. The Customer Segmentation And Behavioral Analysis Target Customer Analysis Ideas PDF is a compilation of the most recent design trends as a series of slides. It is suitable for any subject or industry presentation, containing attractive visuals and photo spots for businesses to clearly express their messages. This template contains a variety of slides for the user to input data, such as structures to contrast two elements, bullet points, and slides for written information. Slidegeeks is prepared to create an impression.
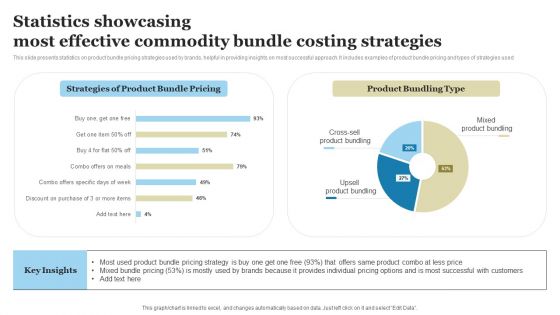
Statistics Showcasing Most Effective Commodity Bundle Costing Strategies Ideas PDF
This slide presents statistics on product bundle pricing strategies used by brands, helpful in providing insights on most successful approach. It includes examples of product bundle pricing and types of strategies used. Pitch your topic with ease and precision using this Statistics Showcasing Most Effective Commodity Bundle Costing Strategies Ideas PDF. This layout presents information on Cross-Sell Product Bundling, Mixed Product Bundling, Upsell Product Bundling. It is also available for immediate download and adjustment. So, changes can be made in the color, design, graphics or any other component to create a unique layout.
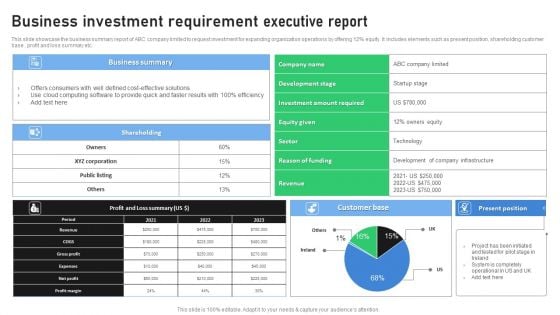
Business Investment Requirement Executive Report Designs PDF
This slide showcase the business summary report of ABC company limited to request investment for expanding organization operations by offering 12 percent equity. It includes elements such as present position, shareholding customer base , profit and loss summary etc. Pitch your topic with ease and precision using this Business Investment Requirement Executive Report Designs PDF. This layout presents information on Development Stage, Investment Amount Required, Business Summary. It is also available for immediate download and adjustment. So, changes can be made in the color, design, graphics or any other component to create a unique layout.
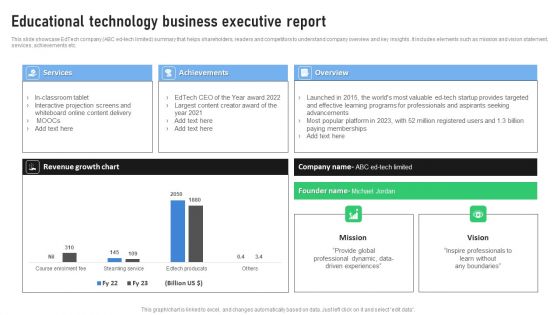
Educational Technology Business Executive Report Clipart PDF
This slide showcase EdTech company ABC ed-tech limited summary that helps shareholders, readers and competitors to understand company overview and key insights. It includes elements such as mission and vision statement, services, achievements etc. Pitch your topic with ease and precision using this Educational Technology Business Executive Report Clipart PDF. This layout presents information on Services, Achievements, Overview. It is also available for immediate download and adjustment. So, changes can be made in the color, design, graphics or any other component to create a unique layout.
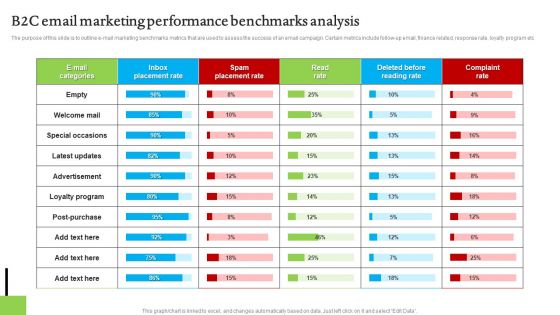
B2C Email Marketing Performance Benchmarks Analysis Topics PDF
The purpose of this slide is to outline e-mail marketing benchmarks metrics that are used to assess the success of an email campaign. Certain metrics include follow-up email, finance related, response rate, loyalty program etc. Pitch your topic with ease and precision using this B2C Email Marketing Performance Benchmarks Analysis Topics PDF. This layout presents information on Advertisement, Loyalty Program, Performance Benchmarks Analysis. It is also available for immediate download and adjustment. So, changes can be made in the color, design, graphics or any other component to create a unique layout.
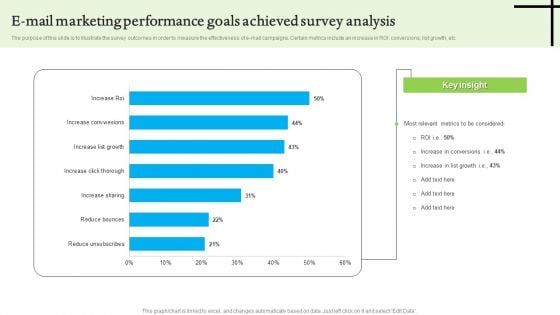
E Mail Marketing Performance Goals Achieved Survey Analysis Sample PDF
The purpose of this slide is to illustrate the survey outcomes in order to measure the effectiveness of e-mail campaigns. Certain metrics include an increase in ROI, conversions, list growth, etc. Pitch your topic with ease and precision using this E Mail Marketing Performance Goals Achieved Survey Analysis Sample PDF. This layout presents information on E Mail Marketing Performance, Goals Achieved Survey Analysis. It is also available for immediate download and adjustment. So, changes can be made in the color, design, graphics or any other component to create a unique layout.
E Mail Performance Analytics Metrics Tracking Report Analysis Demonstration PDF
The purpose of this slide is to showcase an e-mail analytics mechanism in order to track the performance of certain e-mail marketing based on various metrics. Certain KPIs include open rate, click rate, unsubscribe rate etc. Pitch your topic with ease and precision using this E Mail Performance Analytics Metrics Tracking Report Analysis Demonstration PDF. This layout presents information on E Mail Performance Analytics, Metrics Tracking Report Analysis. It is also available for immediate download and adjustment. So, changes can be made in the color, design, graphics or any other component to create a unique layout.
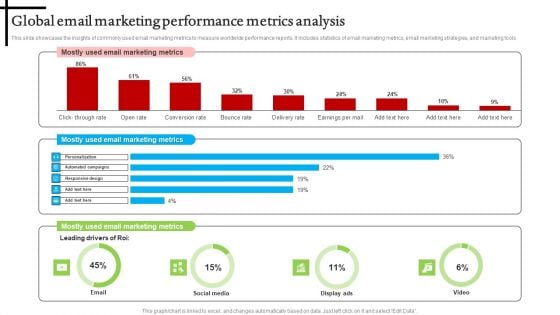
Global Email Marketing Performance Metrics Analysis Microsoft PDF
This slide showcases the insights of commonly used email marketing metrics to measure worldwide performance reports. It includes statistics of email marketing metrics, email marketing strategies, and marketing tools. Pitch your topic with ease and precision using this Global Email Marketing Performance Metrics Analysis Microsoft PDF. This layout presents information on Global Email Marketing, Performance Metrics Analysis. It is also available for immediate download and adjustment. So, changes can be made in the color, design, graphics or any other component to create a unique layout.
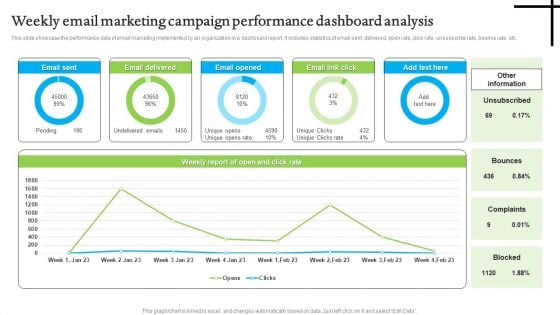
Weekly Email Marketing Campaign Performance Dashboard Analysis Structure PDF
This slide showcase the performance data of email marketing implemented by an organization in a dashboard report. It includes statistics of email sent, delivered, open rate, click rate, unsubscribe rate, bounce rate, etc. Pitch your topic with ease and precision using this Weekly Email Marketing Campaign Performance Dashboard Analysis Structure PDF. This layout presents information on Weekly Email Marketing, Campaign Performance Dashboard Analysis. It is also available for immediate download and adjustment. So, changes can be made in the color, design, graphics or any other component to create a unique layout.
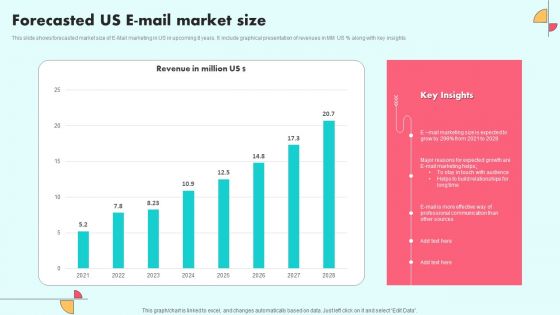
Forecasted Us E Mail Market Size Ideas PDF
This slide shows forecasted market size of E-Mail marketing in US in upcoming 8 years. It include graphical presentation of revenues in MM US percentage along with key insights. Pitch your topic with ease and precision using this Forecasted Us E Mail Market Size Ideas PDF. This layout presents information on E Mail Marketing, Sources, Communication. It is also available for immediate download and adjustment. So, changes can be made in the color, design, graphics or any other component to create a unique layout.
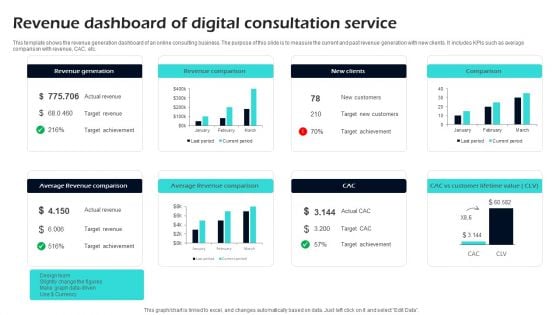
Revenue Dashboard Of Digital Consultation Service Ppt Designs
This template shows the revenue generation dashboard of an online consulting business. The purpose of this slide is to measure the current and past revenue generation with new clients. It includes KPIs such as average comparison with revenue, CAC, etc. Pitch your topic with ease and precision using this Revenue Dashboard Of Digital Consultation Service Ppt Designs. This layout presents information on Revenue, Digital, Consultation. It is also available for immediate download and adjustment. So, changes can be made in the color, design, graphics or any other component to create a unique layout.
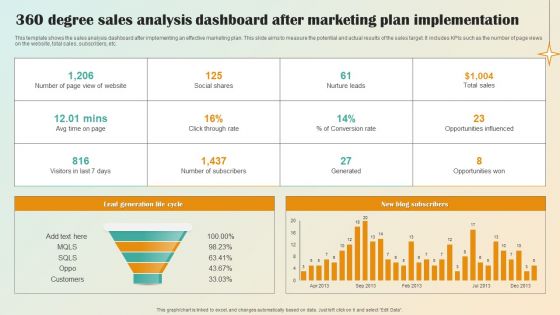
360 Degree Sales Analysis Dashboard After Marketing Plan Implementation Pictures PDF
This template shows the sales analysis dashboard after implementing an effective marketing plan. This slide aims to measure the potential and actual results of the sales target. It includes KPIs such as the number of page views on the website, total sales, subscribers, etc.Pitch your topic with ease and precision using this 360 Degree Sales Analysis Dashboard After Marketing Plan Implementation Pictures PDF. This layout presents information on Lead Generation Life, Conversion Rate. It is also available for immediate download and adjustment. So, changes can be made in the color, design, graphics or any other component to create a unique layout.
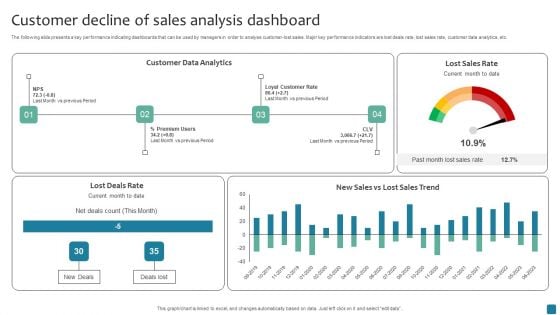
Customer Decline Of Sales Analysis Dashboard Rules PDF
The following slide presents a key performance indicating dashboards that can be used by managers in order to analyse customer-lost sales. Major key performance indicators are lost deals rate, lost sales rate, customer data analytics, etc. Pitch your topic with ease and precision using this Customer Decline Of Sales Analysis Dashboard Rules PDF. This layout presents information on Customer Data Analytics. It is also available for immediate download and adjustment. So, changes can be made in the color, design, graphics or any other component to create a unique layout.
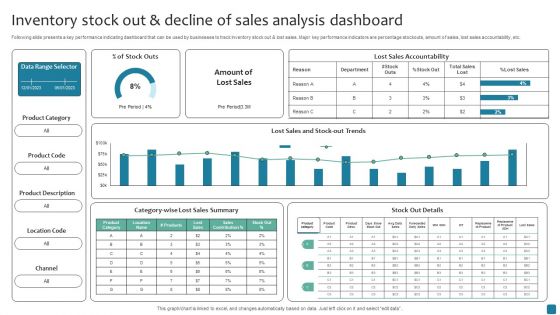
Inventory Stock Out And Decline Of Sales Analysis Dashboard Inspiration PDF
Following slide presents a key performance indicating dashboard that can be used by businesses to track Inventory stock out and lost sales. Major key performance indicators are percentage stockouts, amount of sales, lost sales accountability, etc. Pitch your topic with ease and precision using this Inventory Stock Out And Decline Of Sales Analysis Dashboard Inspiration PDF. This layout presents information on Lost Sales Summary, Stock Out Details It is also available for immediate download and adjustment. So, changes can be made in the color, design, graphics or any other component to create a unique layout.
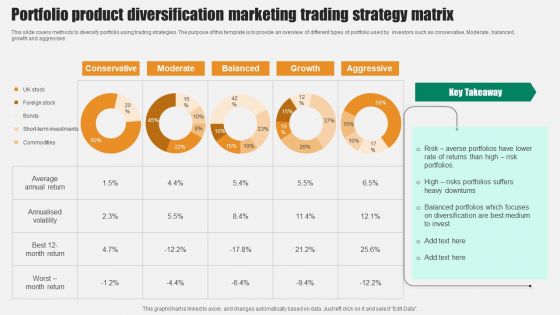
Portfolio Product Diversification Marketing Trading Strategy Matrix Clipart PDF
This slide covers methods to diversify portfolio using trading strategies. The purpose of this template is to provide an overview of different types of portfolio used by investors such as conservative, Moderate, balanced, growth and aggressive. Pitch your topic with ease and precision using this Portfolio Product Diversification Marketing Trading Strategy Matrix Clipart PDF. This layout presents information on Conservative, Moderate, Balanced, Growth, Aggressive. It is also available for immediate download and adjustment. So, changes can be made in the color, design, graphics or any other component to create a unique layout.
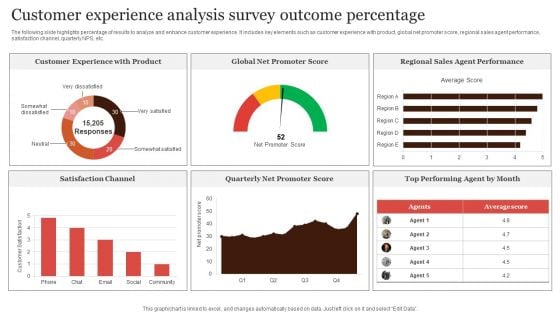
Customer Experience Analysis Survey Outcome Percentage Portrait PDF
The following slide highlights percentage of results to analyze and enhance customer experience. It includes key elements such as customer experience with product, global net promoter score, regional sales agent performance, satisfaction channel, quarterly NPS, etc. Pitch your topic with ease and precision using this Customer Experience Analysis Survey Outcome Percentage Portrait PDF. This layout presents information on Customer Experience, Promoter Score, Regional Sales. It is also available for immediate download and adjustment. So, changes can be made in the color, design, graphics or any other component to create a unique layout.
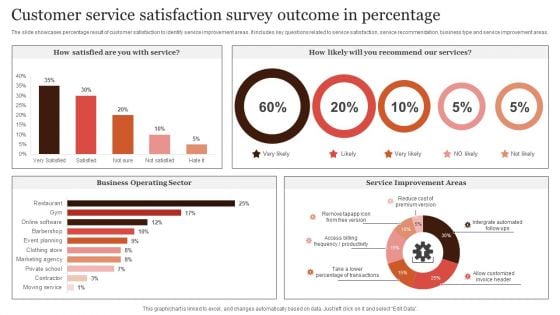
Customer Service Satisfaction Survey Outcome In Percentage Microsoft PDF
The slide showcases percentage result of customer satisfaction to identify service improvement areas. It includes key questions related to service satisfaction, service recommendation, business type and service improvement areas. Pitch your topic with ease and precision using this Customer Service Satisfaction Survey Outcome In Percentage Microsoft PDF. This layout presents information on Customer Service, Satisfaction Survey, Outcome In Percentage. It is also available for immediate download and adjustment. So, changes can be made in the color, design, graphics or any other component to create a unique layout.
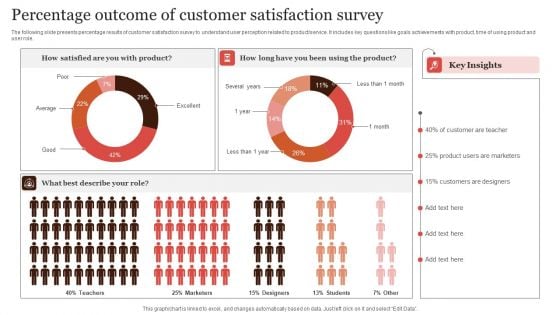
Percentage Outcome Of Customer Satisfaction Survey Infographics PDF
The following slide presents percentage results of customer satisfaction survey to understand user perception related to product or service. It includes key questions like goals achievements with product, time of using product and user role. Pitch your topic with ease and precision using this Percentage Outcome Of Customer Satisfaction Survey Infographics PDF. This layout presents information on Percentage Outcome, Customer Satisfaction Survey. It is also available for immediate download and adjustment. So, changes can be made in the color, design, graphics or any other component to create a unique layout.
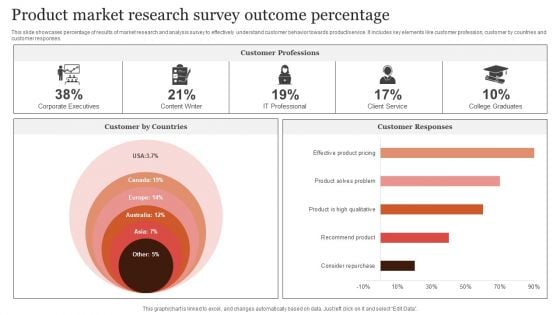
Product Market Research Survey Outcome Percentage Elements PDF
This slide showcases percentage of results of market research and analysis survey to effectively understand customer behavior towards product or service. It includes key elements like customer profession, customer by countries and customer responses. Pitch your topic with ease and precision using this Product Market Research Survey Outcome Percentage Elements PDF. This layout presents information on Customer By Countries, Customer Professions, Customer Responses. It is also available for immediate download and adjustment. So, changes can be made in the color, design, graphics or any other component to create a unique layout.
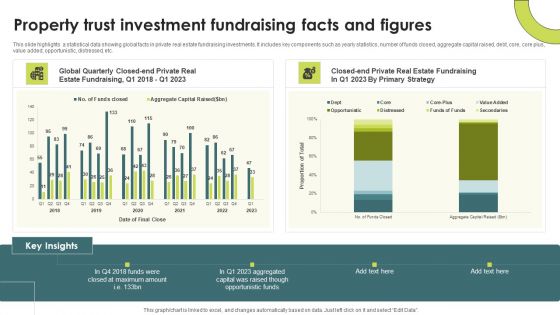
Property Trust Investment Fundraising Facts And Figures Background PDF
This slide highlights a statistical data showing global facts in private real estate fundraising investments. It includes key components such as yearly statistics, number of funds closed, aggregate capital raised, debt, core, core plus, value added, opportunistic, distressed, etc.Showcasing this set of slides titled Property Trust Investment Fundraising Facts And Figures Background PDF. The topics addressed in these templates are Closed At Maximum, Opportunistic Funds. All the content presented in this PPT design is completely editable. Download it and make adjustments in color, background, font etc. as per your unique business setting.
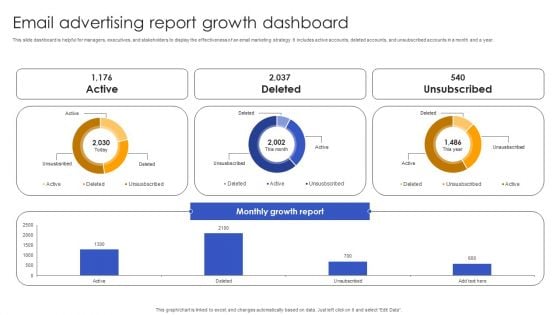
Email Advertising Report Growth Dashboard Formats PDF
This slide dashboard is helpful for managers, executives, and stakeholders to display the effectiveness of an email marketing strategy. It includes active accounts, deleted accounts, and unsubscribed accounts in a month and a year. Pitch your topic with ease and precision using this Email Advertising Report Growth Dashboard Formats PDF. This layout presents information on Email Advertising, Report Growth Dashboard . It is also available for immediate download and adjustment. So, changes can be made in the color, design, graphics or any other component to create a unique layout.
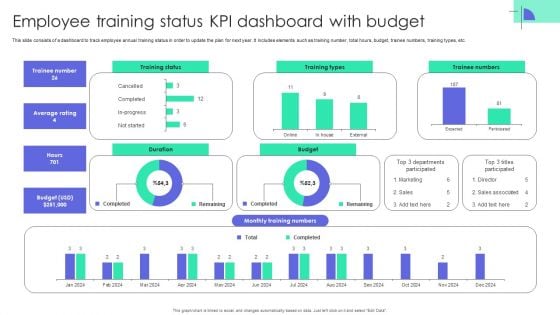
Employee Training Status KPI Dashboard With Budget Summary PDF
This slide consists of a dashboard to track employee annual training status in order to update the plan for next year. It includes elements such as training number, total hours, budget, trainee numbers, training types, etc. Pitch your topic with ease and precision using this Employee Training Status KPI Dashboard With Budget Summary PDF. This layout presents information on Employee Training Status, KPI Dashboard With Budget. It is also available for immediate download and adjustment. So, changes can be made in the color, design, graphics or any other component to create a unique layout.
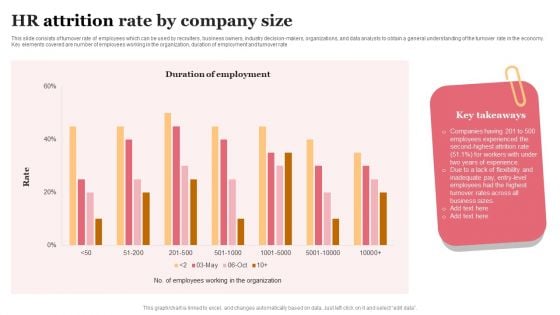
HR Attrition Rate By Company Size Elements PDF
This slide consists of turnover rate of employees which can be used by recruiters, business owners, industry decision-makers, organizations, and data analysts to obtain a general understanding of the turnover rate in the economy. Key elements covered are number of employees working in the organization, duration of employment and turnover rate. Pitch your topic with ease and precision using this HR Attrition Rate By Company Size Elements PDF. This layout presents information on Key Takeaways, Business Sizes, Employees. It is also available for immediate download and adjustment. So, changes can be made in the color, design, graphics or any other component to create a unique layout.
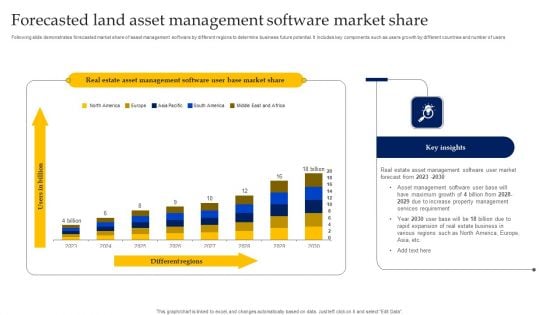
Forecasted Land Asset Management Software Market Share Introduction PDF
Following slide demonstrates forecasted market share of asset management software by different regions to determine business future potential. It includes key components such as users growth by different countries and number of users. Showcasing this set of slides titled Forecasted Land Asset Management Software Market Share Introduction PDF. The topics addressed in these templates are Services Requirement, Asset Management, Maximum Growth. All the content presented in this PPT design is completely editable. Download it and make adjustments in color, background, font etc. as per your unique business setting.
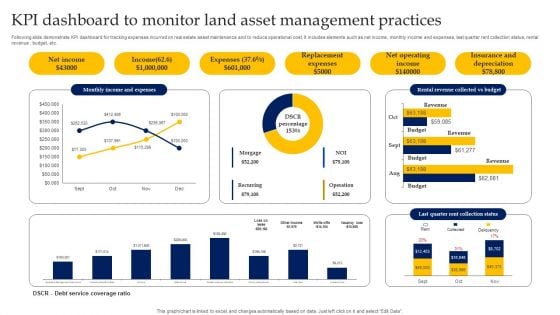
KPI Dashboard To Monitor Land Asset Management Practices Clipart PDF
Following slide demonstrate KPI dashboard for tracking expenses incurred on real estate asset maintenance and to reduce operational cost. It includes elements such as net income, monthly income and expenses, last quarter rent collection status, rental revenue , budget, etc. Pitch your topic with ease and precision using this KPI Dashboard To Monitor Land Asset Management Practices Clipart PDF. This layout presents information on Revenue, Budget, Income. It is also available for immediate download and adjustment. So, changes can be made in the color, design, graphics or any other component to create a unique layout.
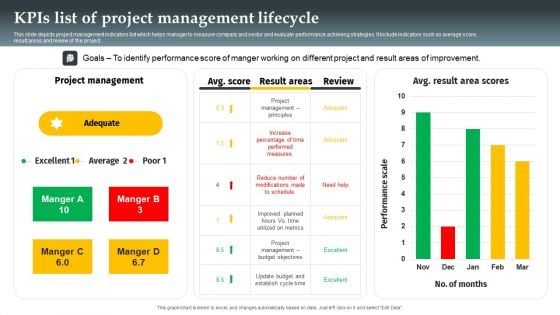
Kpis List Of Project Management Lifecycle Formats PDF
This slide depicts project management indicators list which helps manager to measure company and sector and evaluate performance achieving strategies. It include indicators such as average score, result areas and review of the project. Pitch your topic with ease and precision using this Kpis List Of Project Management Lifecycle Formats PDF. This layout presents information on Project Management, Performance Score, Average. It is also available for immediate download and adjustment. So, changes can be made in the color, design, graphics or any other component to create a unique layout.
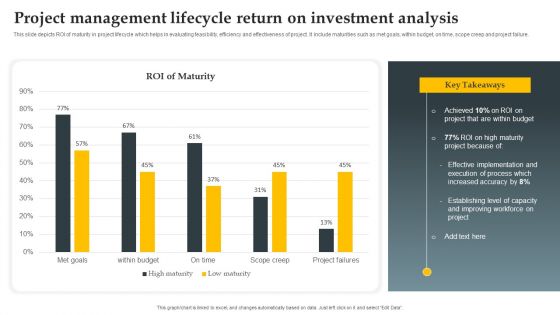
Project Management Lifecycle Return On Investment Analysis Demonstration PDF
This slide depicts ROI of maturity in project lifecycle which helps in evaluating feasibility, efficiency and effectiveness of project. It include maturities such as met goals, within budget, on time, scope creep and project failure. Pitch your topic with ease and precision using this Project Management Lifecycle Return On Investment Analysis Demonstration PDF. This layout presents information on Implementation, Execution Of Process, Budget. It is also available for immediate download and adjustment. So, changes can be made in the color, design, graphics or any other component to create a unique layout.
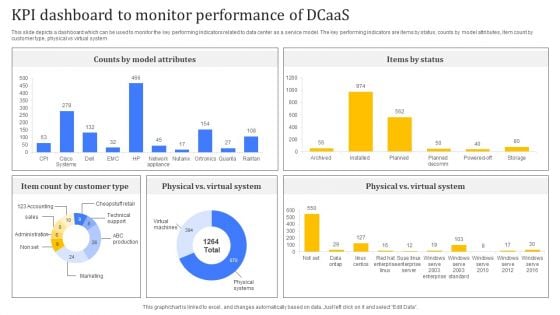
KPI Dashboard To Monitor Performance Of Dcaas Pictures PDF
Following slide highlights major benefits of applying data center as a service to business operations which can be used by businesses looking to modernize their IT infrastructure. Major benefits are in terms of scalability, flexibility, cost effectiveness, and security. Pitch your topic with ease and precision using this KPI Dashboard To Monitor Performance Of Dcaas Pictures PDF. This layout presents information on Customer Type, Counts By Model Attributes, Items By Status. It is also available for immediate download and adjustment. So, changes can be made in the color, design, graphics or any other component to create a unique layout.
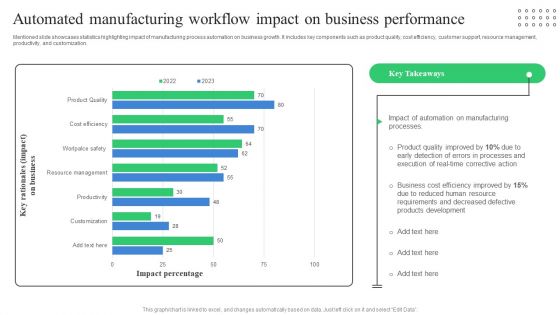
Automated Manufacturing Workflow Impact On Business Performance Sample PDF
Mentioned slide showcases statistics highlighting impact of manufacturing process automation on business growth. It includes key components such as product quality, cost efficiency, customer support, resource management, productivity, and customization. Showcasing this set of slides titled Automated Manufacturing Workflow Impact On Business Performance Sample PDF. The topics addressed in these templates are Product Quality Improved, Business Cost Efficiency, Defective Products Development. All the content presented in this PPT design is completely editable. Download it and make adjustments in color, background, font etc. as per your unique business setting.
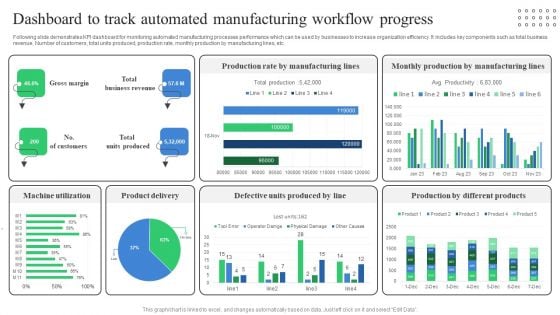
Dashboard To Track Automated Manufacturing Workflow Progress Professional PDF
Following slide demonstrates KPI dashboard for monitoring automated manufacturing processes performance which can be used by businesses to increase organization efficiency. It includes key components such as total business revenue, Number of customers, total units produced, production rate, monthly production by manufacturing lines, etc. Showcasing this set of slides titled Dashboard To Track Automated Manufacturing Workflow Progress Professional PDF. The topics addressed in these templates are Machine Utilization, Product Delivery, Defective Units Produced. All the content presented in this PPT design is completely editable. Download it and make adjustments in color, background, font etc. as per your unique business setting.
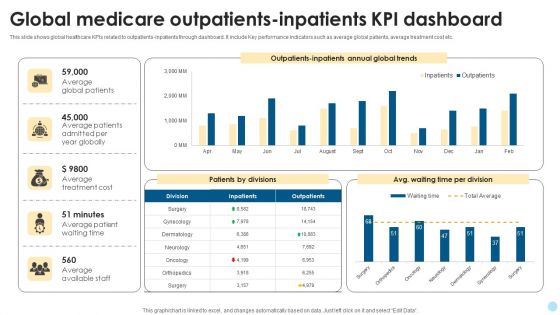
Global Medicare Outpatients Inpatients Kpi Dashboard Template PDF
This slide shows global healthcare KPIs related to outpatients-inpatients through dashboard. It include Key performance indicators such as average global patients, average treatment cost etc. Pitch your topic with ease and precision using this Global Medicare Outpatients Inpatients Kpi Dashboard Template PDF. This layout presents information on Average Treatment Cost, Average Global Patients, Average Available Staff. It is also available for immediate download and adjustment. So, changes can be made in the color, design, graphics or any other component to create a unique layout.
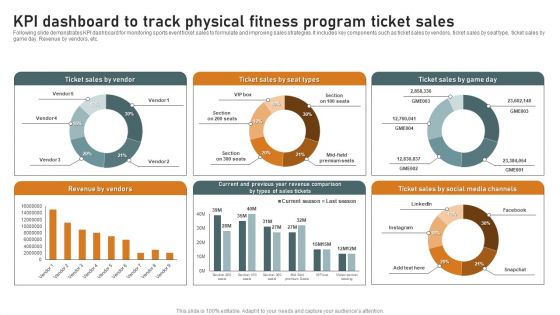
KPI Dashboard To Track Physical Fitness Program Ticket Sales Summary PDF
Following slide demonstrates KPI dashboard for monitoring sports event ticket sales to formulate and improving sales strategies. It includes key components such as ticket sales by vendors, ticket sales by seat type, ticket sales by game day. Revenue by vendors, etc. Showcasing this set of slides titled KPI Dashboard To Track Physical Fitness Program Ticket Sales Summary PDF. The topics addressed in these templates are Revenue By Vendors, Sales By Vendor, Social Media Channels. All the content presented in this PPT design is completely editable. Download it and make adjustments in color, background, font etc. as per your unique business setting.
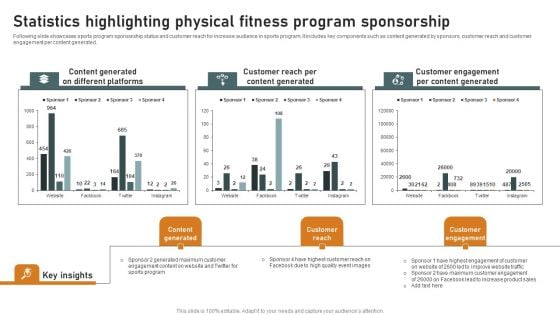
Statistics Highlighting Physical Fitness Program Sponsorship Slides PDF
Following slide showcases sports program sponsorship status and customer reach for increase audience in sports program. It includes key components such as content generated by sponsors, customer reach and customer engagement per content generated. Showcasing this set of slides titled Statistics Highlighting Physical Fitness Program Sponsorship Slides PDF. The topics addressed in these templates are Content Generated, Customer Reach, Customer Engagement. All the content presented in this PPT design is completely editable. Download it and make adjustments in color, background, font etc. as per your unique business setting.
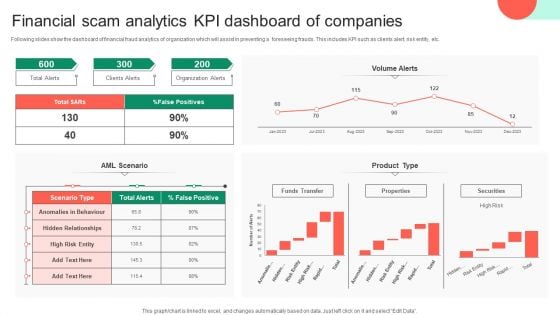
Financial Scam Analytics KPI Dashboard Of Companies Clipart PDF
Following slides show the dashboard of financial fraud analytics of organization which will assist in preventing a foreseeing frauds. This includes KPI such as clients alert, risk entity, etc. Pitch your topic with ease and precision using this Financial Scam Analytics KPI Dashboard Of Companies Clipart PDF. This layout presents information on Financial Scam Analytics, Kpi Dashboard Of Companies. It is also available for immediate download and adjustment. So, changes can be made in the color, design, graphics or any other component to create a unique layout.
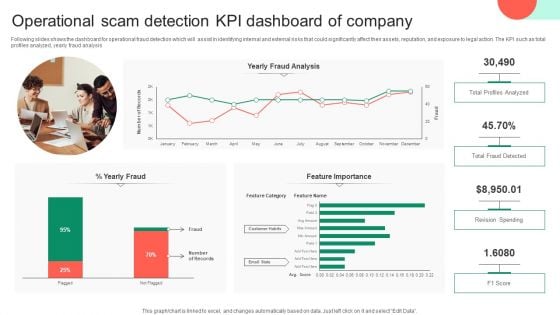
Operational Scam Detection KPI Dashboard Of Company Topics PDF
Following slides shows the dashboard for operational fraud detection which will assist in identifying internal and external risks that could significantly affect their assets, reputation, and exposure to legal action. The KPI such as total profiles analyzed, yearly fraud analysis. Pitch your topic with ease and precision using this Operational Scam Detection KPI Dashboard Of Company Topics PDF. This layout presents information on Profiles Analyzed, Operational Scam Detection, Kpi Dashboard Of Company. It is also available for immediate download and adjustment. So, changes can be made in the color, design, graphics or any other component to create a unique layout.
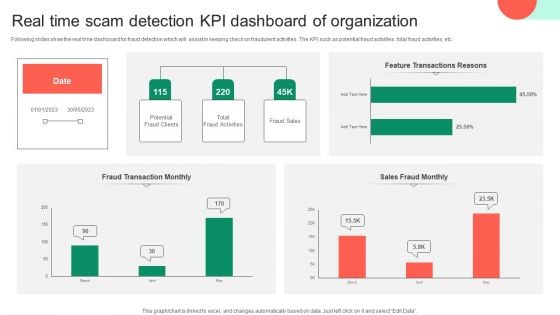
Real Time Scam Detection KPI Dashboard Of Organization Information PDF
Following slides show the real time dashboard for fraud detection which will assist in keeping check on fraudulent activities. The KPI such as potential fraud activities, total fraud activities, etc. Pitch your topic with ease and precision using this Real Time Scam Detection KPI Dashboard Of Organization Information PDF. This layout presents information on Real Time Scam Detection, Kpi Dashboard Of Organization. It is also available for immediate download and adjustment. So, changes can be made in the color, design, graphics or any other component to create a unique layout.
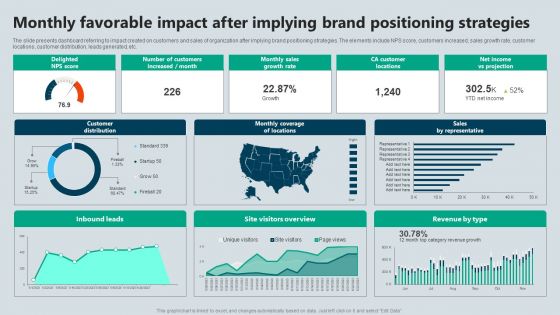
Monthly Favorable Impact After Implying Brand Positioning Strategies Demonstration PDF
The slide presents dashboard referring to impact created on customers and sales of organization after implying brand positioning strategies. The elements include NPS score, customers increased, sales growth rate, customer locations, customer distribution, leads generated, etc. Pitch your topic with ease and precision using this Monthly Favorable Impact After Implying Brand Positioning Strategies Demonstration PDF. This layout presents information on Strategies, Projection, Growth Rate. It is also available for immediate download and adjustment. So, changes can be made in the color, design, graphics or any other component to create a unique layout.
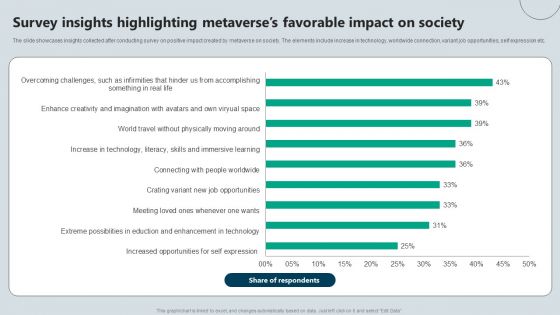
Survey Insights Highlighting Metaverses Favorable Impact On Society Background PDF
The slide showcases insights collected after conducting survey on positive impact created by metaverse on society. The elements include increase in technology, worldwide connection, variant job opportunities, self expression etc. Pitch your topic with ease and precision using this Survey Insights Highlighting Metaverses Favorable Impact On Society Background PDF. This layout presents information on Respondents, Society, Survey. It is also available for immediate download and adjustment. So, changes can be made in the color, design, graphics or any other component to create a unique layout.
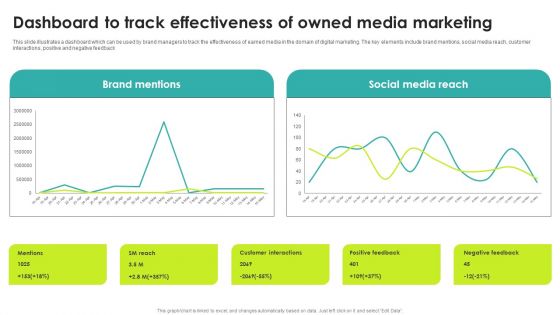
Dashboard To Track Effectiveness Of Owned Media Marketing Structure PDF
This slide illustrates a dashboard which can be used by brand managers to track the effectiveness of earned media in the domain of digital marketing. The key elements include brand mentions, social media reach, customer interactions, positive and negative feedback Pitch your topic with ease and precision using this Dashboard To Track Effectiveness Of Owned Media Marketing Structure PDF. This layout presents information on Brand Mentions, Social Media, Marketing. It is also available for immediate download and adjustment. So, changes can be made in the color, design, graphics or any other component to create a unique layout.
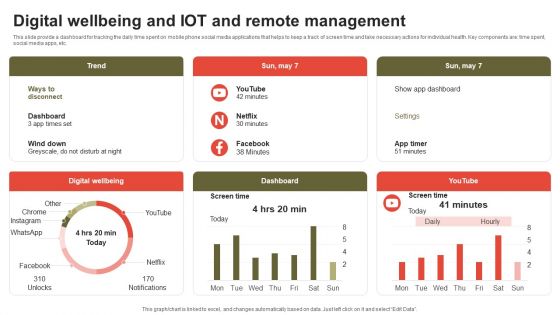
Digital Wellbeing And IOT And Remote Management Professional PDF
This slide provide a dashboard for tracking the daily time spent on mobile phone social media applications that helps to keep a track of screen time and take necessary actions for individual health. Key components are time spent, social media apps, etc. Showcasing this set of slides titled Digital Wellbeing And IOT And Remote Management Professional PDF. The topics addressed in these templates are Trend, Dashboard, Digital Wellbeing. All the content presented in this PPT design is completely editable. Download it and make adjustments in color, background, font etc. as per your unique business setting.
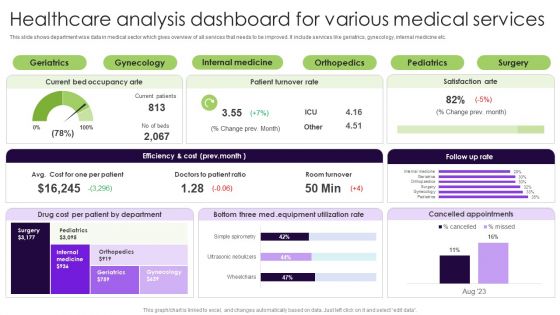
Healthcare Analysis Dashboard For Various Medical Services Ideas PDF
This slide shows department wise data in medical sector which gives overview of all services that needs to be improved. It include services like geriatrics, gynecology, internal medicine etc. Pitch your topic with ease and precision using this Healthcare Analysis Dashboard For Various Medical Services Ideas PDF. This layout presents information on Equipment Utilization Rate, Drug Cost Per Patient, Internal Medicine. It is also available for immediate download and adjustment. So, changes can be made in the color, design, graphics or any other component to create a unique layout.
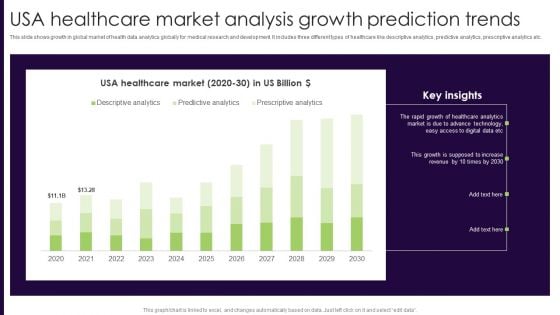
USA Healthcare Market Analysis Growth Prediction Trends Inspiration PDF
This slide shows growth in global market of health data analytics globally for medical research and development. It includes three different types of healthcare like descriptive analytics, predictive analytics, prescriptive analytics etc. Pitch your topic with ease and precision using this USA Healthcare Market Analysis Growth Prediction Trends Inspiration PDF. This layout presents information on USA Healthcare Market Analysis, Growth Prediction Trends. It is also available for immediate download and adjustment. So, changes can be made in the color, design, graphics or any other component to create a unique layout.
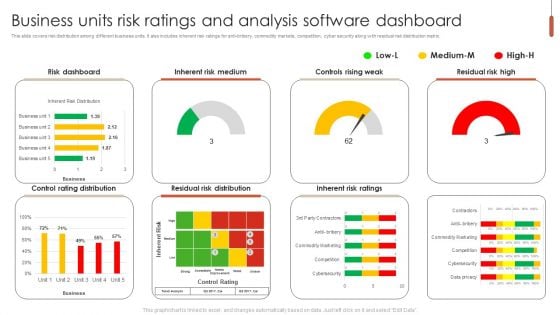
Business Units Risk Ratings And Analysis Software Dashboard Ideas PDF
This slide covers risk distribution among different business units. It also includes inherent risk ratings for anti-bribery, commodity markets, competition, cyber security along with residual risk distribution matrix. Pitch your topic with ease and precision using this Business Units Risk Ratings And Analysis Software Dashboard Ideas PDF. This layout presents information on Risk Dashboard, Inherent Risk Medium, Controls Rising Weak. It is also available for immediate download and adjustment. So, changes can be made in the color, design, graphics or any other component to create a unique layout.
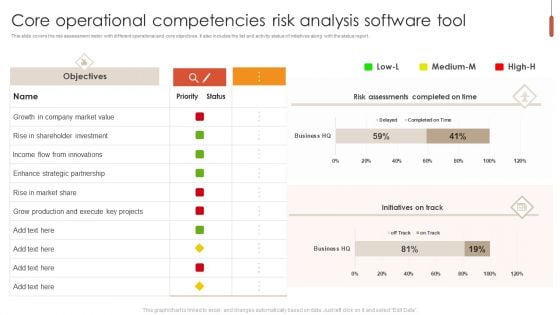
Core Operational Competencies Risk Analysis Software Tool Graphics PDF
This slide covers the risk assessment meter with different operational and core objectives. It also includes the list and activity status of initiatives along with the status report. Pitch your topic with ease and precision using this Core Operational Competencies Risk Analysis Software Tool Graphics PDF. This layout presents information on Strategic Partnership, Market Value, Shareholder Investment. It is also available for immediate download and adjustment. So, changes can be made in the color, design, graphics or any other component to create a unique layout.
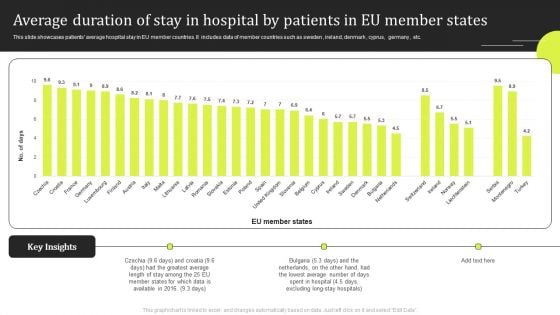
Average Duration Of Stay In Hospital By Patients In EU Member States Slides PDF
This slide showcases patients average hospital stay in EU member countries. It includes data of member countries such as sweden , ireland, denmark , cyprus, germany , etc. Pitch your topic with ease and precision using this Average Duration Of Stay In Hospital By Patients In EU Member States Slides PDF. This layout presents information on Greatest Average, Key Insights. It is also available for immediate download and adjustment. So, changes can be made in the color, design, graphics or any other component to create a unique layout.
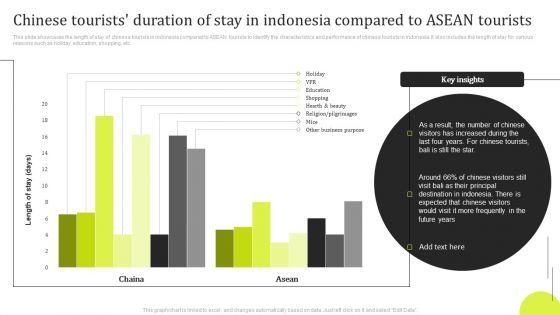
Chinese Tourists Duration Of Stay In Indonesia Compared To ASEAN Tourists Brochure PDF
This slide showcases the length of stay of chinese tourists in indonesia compared to ASEAN tourists to identify the characteristics and performance of chinese tourists in indonesia. It also includes the length of stay for various reasons such as holiday, education, shopping, etc. Pitch your topic with ease and precision using this Chinese Tourists Duration Of Stay In Indonesia Compared To ASEAN Tourists Brochure PDF. This layout presents information on Chinese Tourists Duration, Indonesia Compared, Asean Tourists. It is also available for immediate download and adjustment. So, changes can be made in the color, design, graphics or any other component to create a unique layout.
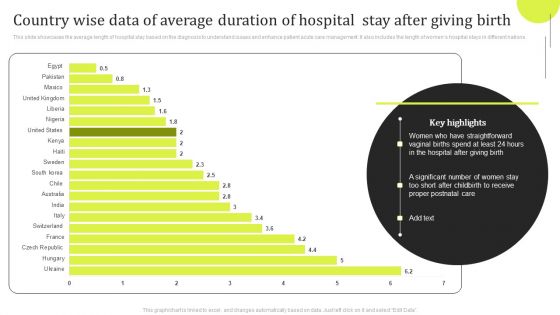
Country Wise Data Of Average Duration Of Hospital Stay After Giving Birth Designs PDF
This slide showcases the average length of hospital stay based on the diagnosis to understand issues and enhance patient acute care management. It also includes the length of womens hospital stays in different nations. Pitch your topic with ease and precision using this Country Wise Data Of Average Duration Of Hospital Stay After Giving Birth Designs PDF. This layout presents information on Country Wise Data, Average Duration. It is also available for immediate download and adjustment. So, changes can be made in the color, design, graphics or any other component to create a unique layout.
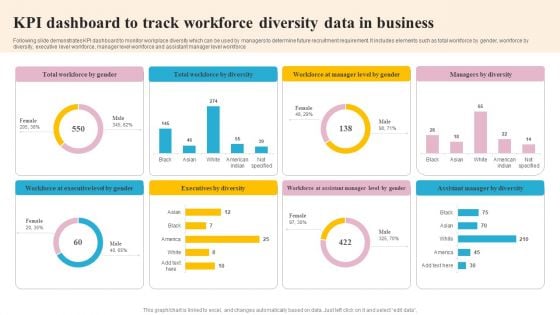
KPI Dashboard To Track Workforce Diversity Data In Business Mockup PDF
Following slide demonstrates KPI dashboard to monitor workplace diversity which can be used by managers to determine future recruitment requirement. It includes elements such as total workforce by gender, workforce by diversity, executive level workforce, manager level workforce and assistant manager level workforce. Pitch your topic with ease and precision using this KPI Dashboard To Track Workforce Diversity Data In Business Mockup PDF. This layout presents information on Executives By Diversity, Workforce By Diversity, Executive Level By Gender. It is also available for immediate download and adjustment. So, changes can be made in the color, design, graphics or any other component to create a unique layout.
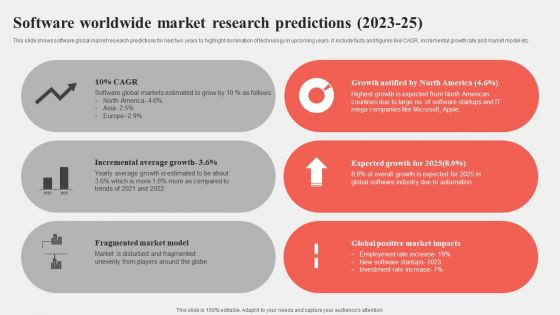
Software Worldwide Market Research Predictions 2023 25 Graphics PDF
This slide shows software global market research predictions for next two years to highlight domination of technology in upcoming years. It include facts and figures like CAGR, incremental growth rate and market model etc Pitch your topic with ease and precision using this Software Worldwide Market Research Predictions 2023 25 Graphics PDF. This layout presents information on Average Growth, Market Model, Market Impacts. It is also available for immediate download and adjustment. So, changes can be made in the color, design, graphics or any other component to create a unique layout.
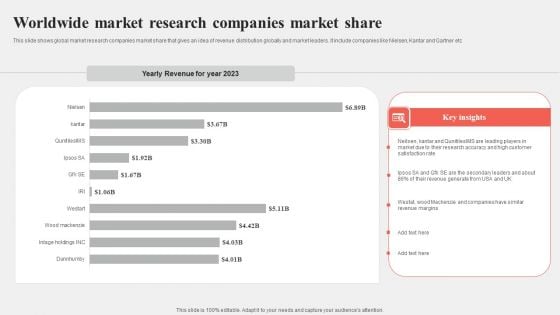
Worldwide Market Research Companies Market Share Portrait PDF
This slide shows global market research companies market share that gives an idea of revenue distribution globally and market leaders. It include companies like Nielsen, Kantar and Gartner etc Pitch your topic with ease and precision using this Worldwide Market Research Companies Market Share Portrait PDF. This layout presents information on Market Share, Key Insights, Worldwide. It is also available for immediate download and adjustment. So, changes can be made in the color, design, graphics or any other component to create a unique layout.
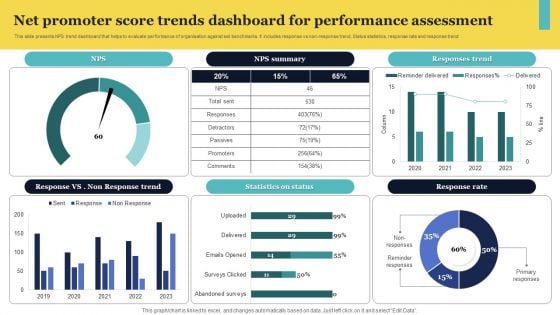
Net Promoter Score Trends Dashboard For Performance Assessment Elements PDF
This slide presents NPS trend dashboard that helps to evaluate performance of organisation against set benchmarks. It includes response vs non-response trend, Status statistics, response rate and response trend Pitch your topic with ease and precision using this Net Promoter Score Trends Dashboard For Performance Assessment Elements PDF. This layout presents information on Response Trend, Summary, Status. It is also available for immediate download and adjustment. So, changes can be made in the color, design, graphics or any other component to create a unique layout.
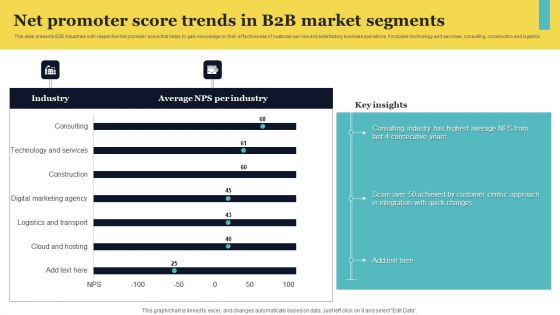
Net Promoter Score Trends In B2b Market Segments Pictures PDF
This slide presents B2B industries with respective Net promoter score that helps to gain knowledge on their effectiveness of customer service and satisfactory business operations. It includes technology and services, consulting, construction and logistics Pitch your topic with ease and precision using this Net Promoter Score Trends In B2b Market Segments Pictures PDF. This layout presents information on Key Insights, Segments, Promoter. It is also available for immediate download and adjustment. So, changes can be made in the color, design, graphics or any other component to create a unique layout.
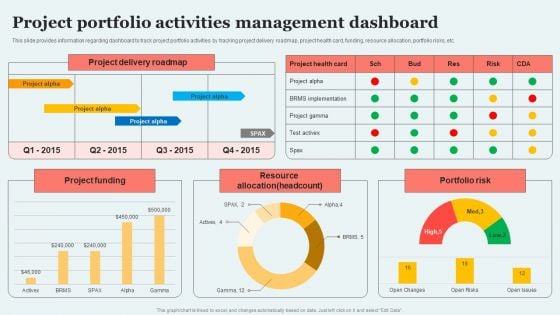
Project Portfolio Activities Management Dashboard Introduction PDF
This slide provides information regarding dashboard to track project portfolio activities by tracking project delivery roadmap, project health card, funding, resource allocation, portfolio risks, etc. This Project Portfolio Activities Management Dashboard Introduction PDF from Slidegeeks makes it easy to present information on your topic with precision. It provides customization options, so you can make changes to the colors, design, graphics, or any other component to create a unique layout. It is also available for immediate download, so you can begin using it right away. Slidegeeks has done good research to ensure that you have everything you need to make your presentation stand out. Make a name out there for a brilliant performance.
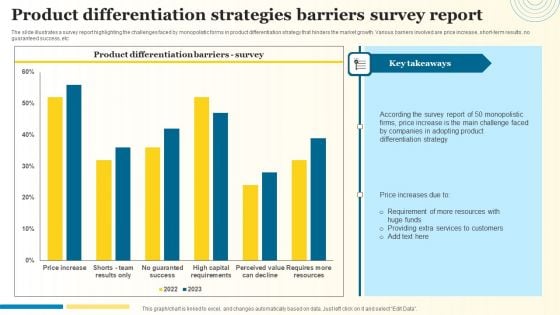
Product Differentiation Strategies Barriers Survey Report Introduction PDF
The slide illustrates a survey report highlighting the challenges faced by monopolistic forms in product differentiation strategy that hinders the market growth. Various barriers involved are price increase, short-term results, no guaranteed success, etc. Pitch your topic with ease and precision using this Product Differentiation Strategies Barriers Survey Report Introduction PDF. This layout presents information on Differentiation Strategy, Adopting Product, Price Increase. It is also available for immediate download and adjustment. So, changes can be made in the color, design, graphics or any other component to create a unique layout.
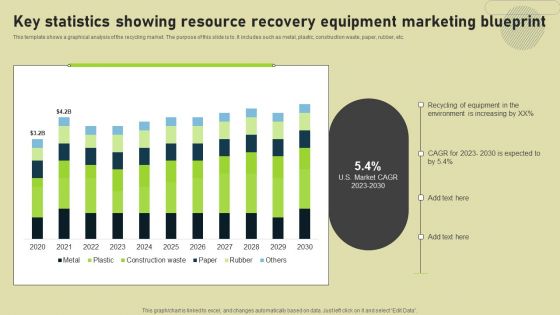
Key Statistics Showing Resource Recovery Equipment Marketing Blueprint Graphics PDF
This template shows a graphical analysis of the recycling market. The purpose of this slide is to. It includes such as metal, plastic, construction waste, paper, rubber, etc. Pitch your topic with ease and precision using this Key Statistics Showing Resource Recovery Equipment Marketing Blueprint Graphics PDF. This layout presents information on Equipment, Environment, Marketing Blueprint. It is also available for immediate download and adjustment. So, changes can be made in the color, design, graphics or any other component to create a unique layout.
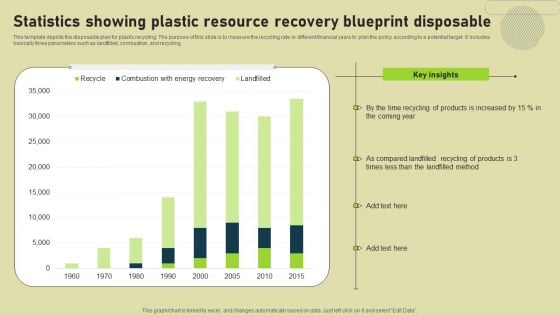
Statistics Showing Plastic Resource Recovery Blueprint Disposable Elements PDF
This template depicts the disposable plan for plastic recycling. The purpose of this slide is to measure the recycling rate in different financial years to plan the policy according to a potential target. It includes basically three parameters such as landfilled, combustion, and recycling. Pitch your topic with ease and precision using this Statistics Showing Plastic Resource Recovery Blueprint Disposable Elements PDF. This layout presents information on Products, Key Insights, Resource Recovery Blueprint Disposable. It is also available for immediate download and adjustment. So, changes can be made in the color, design, graphics or any other component to create a unique layout.
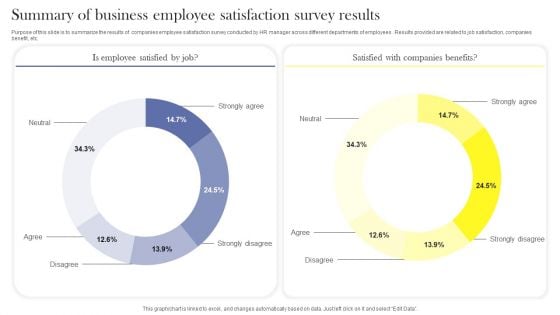
Summary Of Business Employee Satisfaction Survey Results Survey SS
Purpose of this slide is to summarize the results of companies employee satisfaction survey conducted by HR manager across different departments of employees . Results provided are related to job satisfaction, companies benefit, etc. Pitch your topic with ease and precision using this Summary Of Business Employee Satisfaction Survey Results Survey SS. This layout presents information on Neutral, Strongly Agree, Strongly Disagree, Disagree, Agree. It is also available for immediate download and adjustment. So, changes can be made in the color, design, graphics or any other component to create a unique layout.
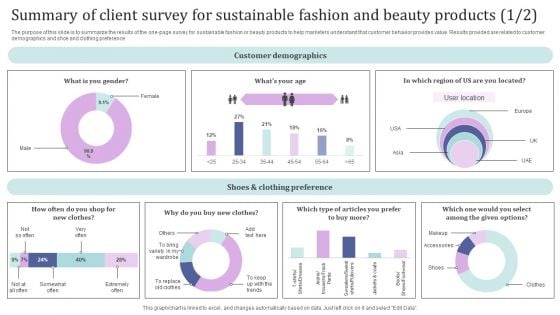
Summary Of Client Survey For Sustainable Fashion And Beauty Products Survey SS
The purpose of this slide is to summarize the results of the one-page survey for sustainable fashion or beauty products to help marketers understand that customer behavior provides value. Results provided are related to customer demographics and shoe and clothing preference. Pitch your topic with ease and precision using this Summary Of Client Survey For Sustainable Fashion And Beauty Products Survey SS. This layout presents information on Customer Demographics, Shoes And Clothing Preference, User Location. It is also available for immediate download and adjustment. So, changes can be made in the color, design, graphics or any other component to create a unique layout.
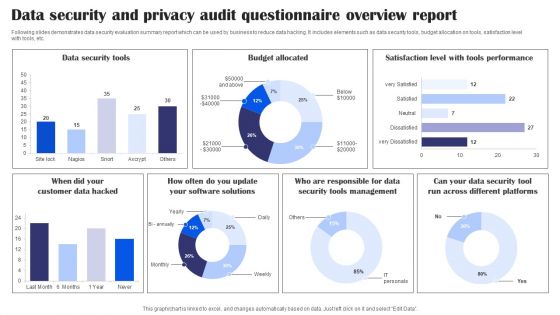
Data Security And Privacy Audit Questionnaire Overview Report Survey SS
Following slides demonstrates data security evaluation summary report which can be used by business to reduce data hacking. It includes elements such as data security tools, budget allocation on tools, satisfaction level with tools, etc. Pitch your topic with ease and precision using this Data Security And Privacy Audit Questionnaire Overview Report Survey SS. This layout presents information on Data Security Tools, Budget Allocated, Tools Performance, Data Security Tools Management. It is also available for immediate download and adjustment. So, changes can be made in the color, design, graphics or any other component to create a unique layout.
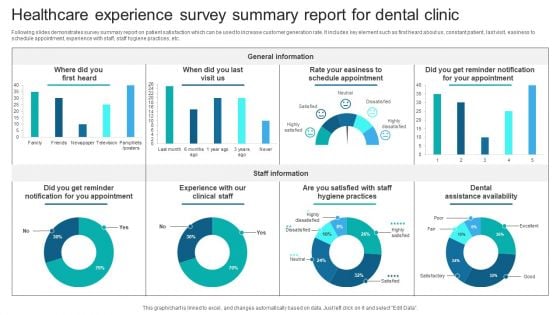
Healthcare Experience Survey Summary Report For Dental Clinic Survey SS
Following slides demonstrates survey summary report on patient satisfaction which can be used to increase customer generation rate. It includes key element such as first heard about us, constant patient, last visit, easiness to schedule appointment, experience with staff, staff hygiene practices, etc. Pitch your topic with ease and precision using this Healthcare Experience Survey Summary Report For Dental Clinic Survey SS. This layout presents information on General Information, Staff Information, Easiness To Schedule Appointment, Dental Assistance Availability, Staff Hygiene Practices. It is also available for immediate download and adjustment. So, changes can be made in the color, design, graphics or any other component to create a unique layout.
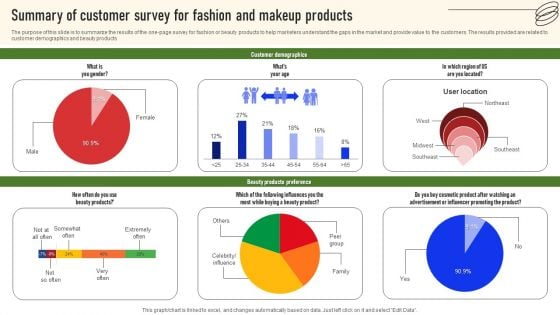
Summary Of Customer Survey For Fashion And Makeup Products Survey SS
The purpose of this slide is to summarize the results of the one-page survey for fashion or beauty products to help marketers understand the gaps in the market and provide value to the customers. The results provided are related to customer demographics and beauty products. Pitch your topic with ease and precision using this Summary Of Customer Survey For Fashion And Makeup Products Survey SS. This layout presents information on Customer Demographics, Beauty Products Preference. It is also available for immediate download and adjustment. So, changes can be made in the color, design, graphics or any other component to create a unique layout.
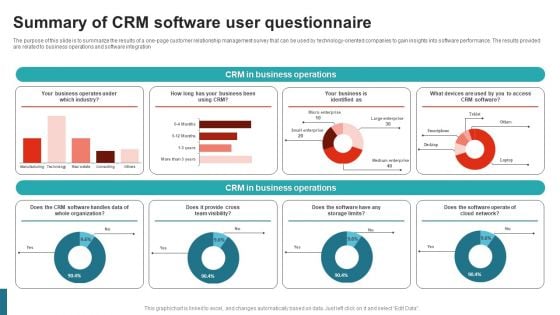
Summary Of CRM Software User Questionnaire Survey SS
The purpose of this slide is to summarize the results of a one-page customer relationship management survey that can be used by technology-oriented companies to gain insights into software performance. The results provided are related to business operations and software integration. Pitch your topic with ease and precision using this Summary Of CRM Software User Questionnaire Survey SS. This layout presents information on CRM In Business Operations, Industry, Cloud Network, Team Visibility. It is also available for immediate download and adjustment. So, changes can be made in the color, design, graphics or any other component to create a unique layout.
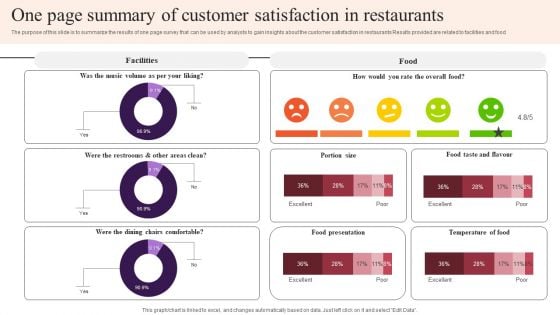
One Page Summary Of Customer Satisfaction In Restaurants Survey SS
The purpose of this slide is to summarize the results of one page survey that can be used by analysts to gain insights about the customer satisfaction in restaurants Results provided are related to facilities and food. Pitch your topic with ease and precision using this One Page Summary Of Customer Satisfaction In Restaurants Survey SS. This layout presents information on Facilities, Food Presentation, Temperature Of Food, Food Taste And Flavour. It is also available for immediate download and adjustment. So, changes can be made in the color, design, graphics or any other component to create a unique layout.
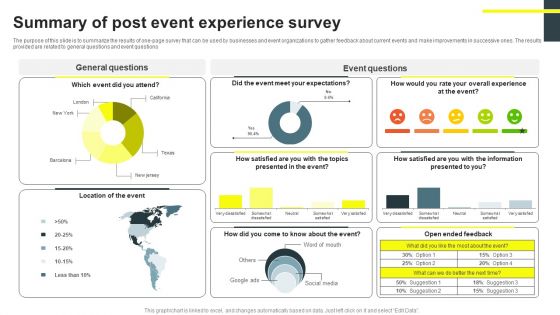
Summary Of Post Event Experience Survey Survey SS
The purpose of this slide is to summarize the results of one-page survey that can be used by businesses and event organizations to gather feedback about current events and make improvements in successive ones. The results provided are related to general questions and event questions. Pitch your topic with ease and precision using this Summary Of Post Event Experience Survey Survey SS. This layout presents information on General Questions, Event Questions, Location Of The Event, Social Media. It is also available for immediate download and adjustment. So, changes can be made in the color, design, graphics or any other component to create a unique layout.
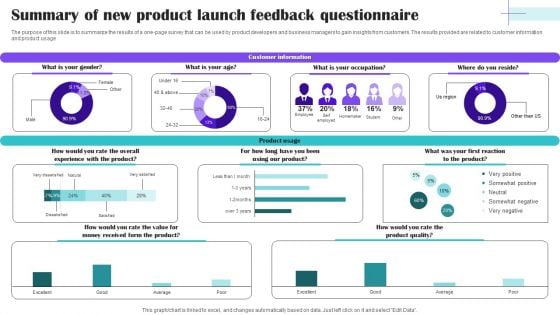
Summary Of New Product Launch Feedback Questionnaire Survey SS
The purpose of this slide is to summarize the results of a one-page survey that can be used by product developers and business managers to gain insights from customers. The results provided are related to customer information and product usage. Pitch your topic with ease and precision using this Summary Of New Product Launch Feedback Questionnaire Survey SS. This layout presents information on Customer Information, Product Usage, Occupation, Value For Money, Product Quality. It is also available for immediate download and adjustment. So, changes can be made in the color, design, graphics or any other component to create a unique layout.
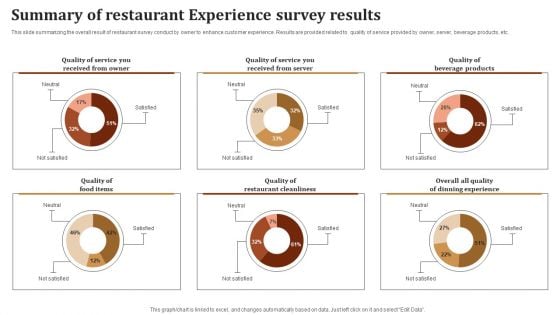
Summary Of Restaurant Experience Survey Results Survey SS
This slide summarizing the overall result of restaurant survey conduct by owner to enhance customer experience. Results are provided related to quality of service provided by owner, server, beverage products, etc. Pitch your topic with ease and precision using this Summary Of Restaurant Experience Survey Results Survey SS. This layout presents information on Quality Of Food Items, Quality Of Restaurant Cleanliness, Quality Of Beverage Products. It is also available for immediate download and adjustment. So, changes can be made in the color, design, graphics or any other component to create a unique layout.
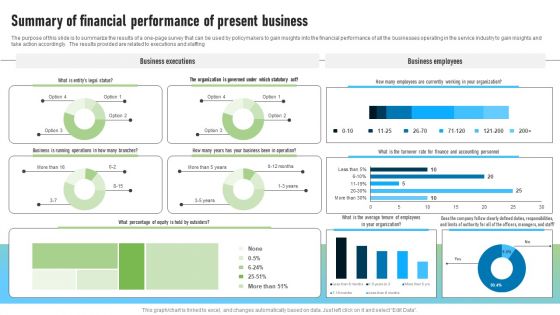
Summary Of Financial Performance Of Present Business Survey SS
The purpose of this slide is to summarize the results of a one-page survey that can be used by policymakers to gain insights into the financial performance of all the businesses operating in the service industry to gain insights and take action accordingly. The results provided are related to executions and staffing. Pitch your topic with ease and precision using this Summary Of Financial Performance Of Present Business Survey SS. This layout presents information on Business Executions, Business Employees, Organization, Officers, Managers, Staff. It is also available for immediate download and adjustment. So, changes can be made in the color, design, graphics or any other component to create a unique layout.
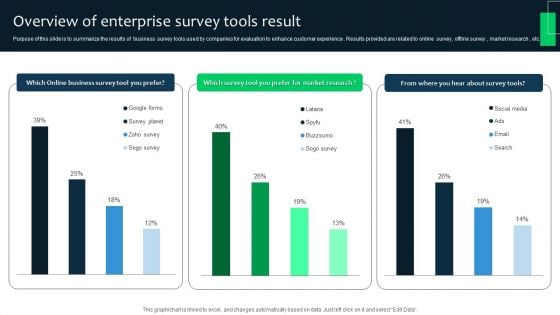
Overview Of Enterprise Survey Tools Result Survey SS
Purpose of this slide is to summarize the results of business survey tools used by companies for evaluation to enhance customer experience . Results provided are related to online survey, offline survey , market research , etc. Pitch your topic with ease and precision using this Overview Of Enterprise Survey Tools Result Survey SS. This layout presents information on Online Business Survey Tool, Market Research, Survey Tools, Social Media. It is also available for immediate download and adjustment. So, changes can be made in the color, design, graphics or any other component to create a unique layout.
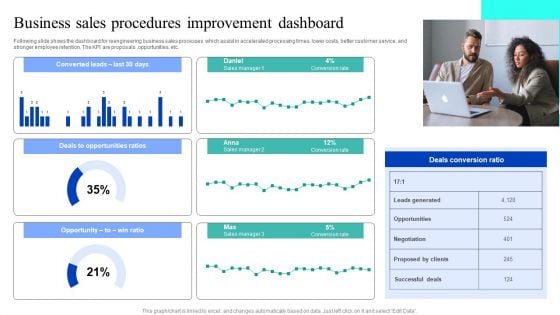
Business Sales Procedures Improvement Dashboard Designs PDF
Following slide shows the dashboard for reengineering business sales processes which assist in accelerated processing times, lower costs, better customer service, and stronger employee retention. The KPI are proposals ,opportunities, etc. Pitch your topic with ease and precision using this Business Sales Procedures Improvement Dashboard Designs PDF. This layout presents information on Deals Opportunities Ratios, Opportunity, Deals Conversion Ratio. It is also available for immediate download and adjustment. So, changes can be made in the color, design, graphics or any other component to create a unique layout.
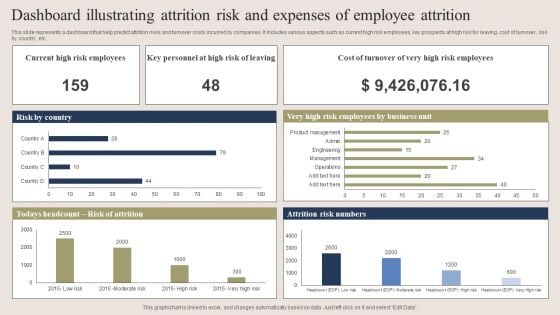
Dashboard Illustrating Attrition Risk And Expenses Of Employee Attrition Clipart PDF
This slide represents a dashboard that help predict attrition risks and turnover costs incurred by companies. It includes various aspects such as current high risk employees, key prospects at high risk for leaving, cost of turnover, risk by country, etc. Pitch your topic with ease and precision using this Dashboard Illustrating Attrition Risk And Expenses Of Employee Attrition Clipart PDF. This layout presents information on Dashboard Illustrating Attrition Risk, Expenses Of Employee Attrition . It is also available for immediate download and adjustment. So, changes can be made in the color, design, graphics or any other component to create a unique layout.
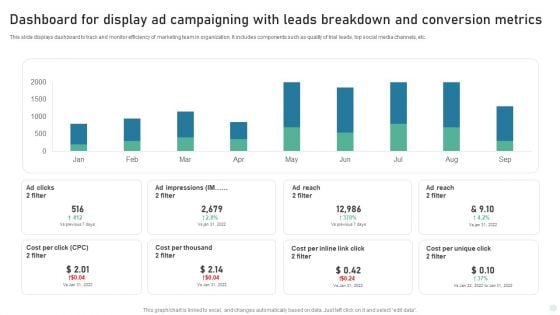
Dashboard For Display Ad Campaigning With Leads Breakdown And Conversion Metrics Inspiration PDF
This slide displays dashboard to track and monitor efficiency of marketing team in organization. It includes components such as quality of trial leads, top social media channels, etc. Showcasing this set of slides titled Dashboard For Display Ad Campaigning With Leads Breakdown And Conversion Metrics Inspiration PDF. The topics addressed in these templates are Dashboard Display, Ad Campaigning, Conversion Metrics. All the content presented in this PPT design is completely editable. Download it and make adjustments in color, background, font etc. as per your unique business setting.
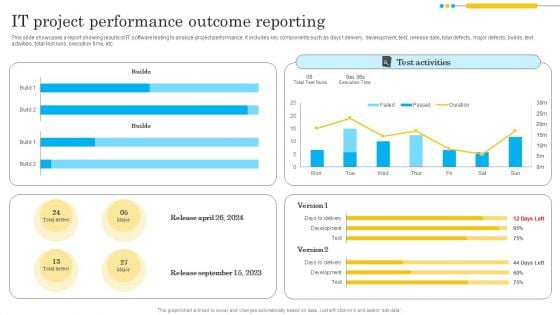
IT Project Performance Outcome Reporting Template PDF
This slide showcases a report showing results of IT software testing to analyze project performance. It includes key components such as days t delivery, development, test, release date, total defects, major defects, builds, test activities, total test runs, execution time, etc. Showcasing this set of slides titled IT Project Performance Outcome Reporting Template PDF. The topics addressed in these templates are Test Activities, Builds, Project Performance. All the content presented in this PPT design is completely editable. Download it and make adjustments in color, background, font etc. as per your unique business setting.
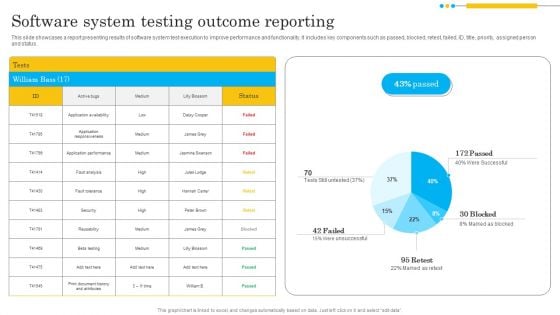
Software System Testing Outcome Reporting Infographics PDF
This slide showcases a report presenting results of software system test execution to improve performance and functionality. It includes key components such as passed, blocked, retest, failed, ID, title, priority, assigned person and status. Showcasing this set of slides titled Software System Testing Outcome Reporting Infographics PDF. The topics addressed in these templates are Application Responsiveness, Application Performance, Security. All the content presented in this PPT design is completely editable. Download it and make adjustments in color, background, font etc. as per your unique business setting.
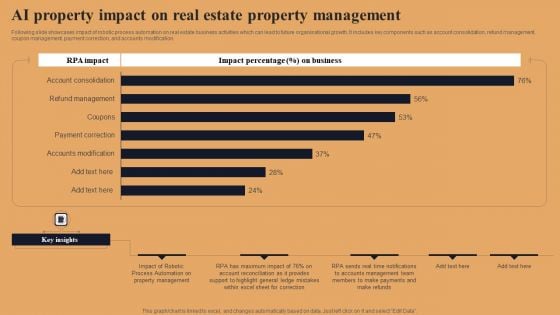
AI Property Impact On Real Estate Property Management Brochure PDF
Following slide showcases impact of robotic process automation on real estate business activities which can lead to future organisational growth. It includes key components such as account consolidation, refund management, coupon management, payment correction, and accounts modification. Showcasing this set of slides titled AI Property Impact On Real Estate Property Management Brochure PDF. The topics addressed in these templates are Impact Robotic Process Automation, Highlight General Ledge, Notifications Accounts Management. All the content presented in this PPT design is completely editable. Download it and make adjustments in color, background, font etc. as per your unique business setting.
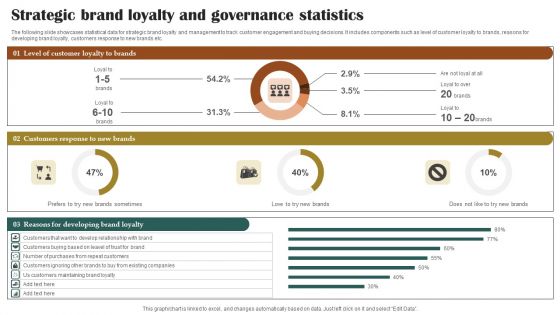
Strategic Brand Loyalty And Governance Statistics Clipart PDF
The following slide showcases statistical data for strategic brand loyalty and management to track customer engagement and buying decisions. It includes components such as level of customer loyalty to brands, reasons for developing brand loyalty, customers response to new brands etc. Showcasing this set of slides titled Strategic Brand Loyalty And Governance Statistics Clipart PDF. The topics addressed in these templates are Customer Loyalty Brands, Customers Response Brands, Reasons Developing Brand Loyalty. All the content presented in this PPT design is completely editable. Download it and make adjustments in color, background, font etc. as per your unique business setting.
Tracking Performance Of Cloud Storage Deployment Dashboard Portrait PDF
The following slide highlights implementation of cloud storage performance tracking dashboard to improve innovation, to attain faster time to market. It includes components such as pinned folders, storage usage, recently used files, documents, images, videos, music, fonts, projects etc. Showcasing this set of slides titled Tracking Performance Of Cloud Storage Deployment Dashboard Portrait PDF. The topics addressed in these templates are Storage Usage, Dashboard, Tracking. All the content presented in this PPT design is completely editable. Download it and make adjustments in color, background, font etc. as per your unique business setting.
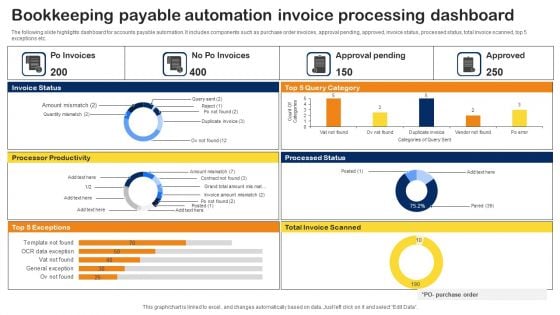
Bookkeeping Payable Automation Invoice Processing Dashboard Summary PDF
The following slide highlights dashboard for accounts payable automation. It includes components such as purchase order invoices, approval pending, approved, invoice status, processed status, total invoice scanned, top 5 exceptions etc. Showcasing this set of slides titled Bookkeeping Payable Automation Invoice Processing Dashboard Summary PDF. The topics addressed in these templates are Processor Productivity, Bookkeeping Payable Automation, Invoice Processing Dashboard. All the content presented in this PPT design is completely editable. Download it and make adjustments in color, background, font etc. as per your unique business setting.
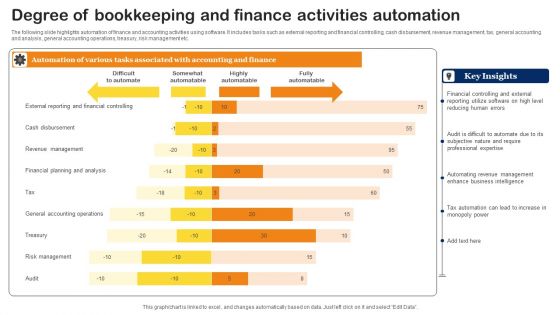
Degree Of Bookkeeping And Finance Activities Automation Graphics PDF
The following slide highlights automation of finance and accounting activities using software. It includes tasks such as external reporting and financial controlling, cash disbursement, revenue management, tax, general accounting and analysis, general accounting operations, treasury, risk management etc. Pitch your topic with ease and precision using this Degree Of Bookkeeping And Finance Activities Automation Graphics PDF. This layout presents information on Tax Automation, Business Intelligence, Revenue Management. It is also available for immediate download and adjustment. So, changes can be made in the color, design, graphics or any other component to create a unique layout.
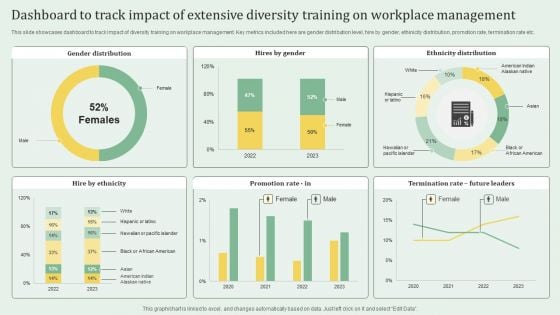
Dashboard To Track Impact Of Extensive Diversity Training On Workplace Management Portrait PDF
This slide showcases dashboard to track impact of diversity training on workplace management. Key metrics included here are gender distribution level, hire by gender, ethinicity distribution, promotion rate, termination rate etc. Pitch your topic with ease and precision using this Dashboard To Track Impact Of Extensive Diversity Training On Workplace Management Portrait PDF. This layout presents information on Dashboard To Track Impact, Extensive Diversity Training, Workplace Management. It is also available for immediate download and adjustment. So, changes can be made in the color, design, graphics or any other component to create a unique layout.
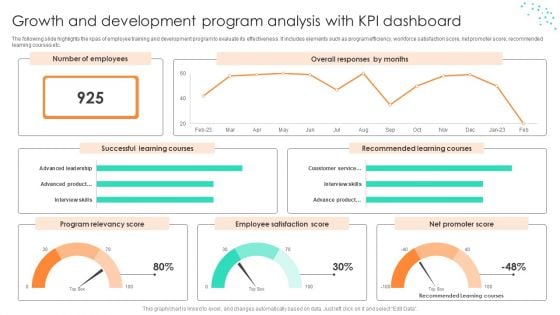
Growth And Development Program Analysis With KPI Dashboard Structure PDF
The following slide highlights the kpas of employee training and development program to evaluate its effectiveness. It includes elements such as program efficiency, workforce satisfaction score, net promoter score, recommended learning courses etc. Pitch your topic with ease and precision using this Growth And Development Program Analysis With KPI Dashboard Structure PDF. This layout presents information on Analysis With KPI Dashboard, Growth And Development Program. It is also available for immediate download and adjustment. So, changes can be made in the color, design, graphics or any other component to create a unique layout.
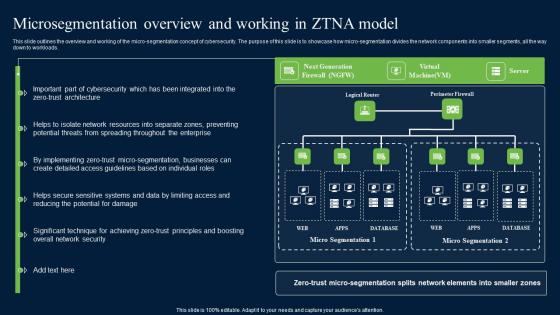
Microsegmentation Overview And Working In ZTNA Zero Trust Network Security Diagrams Pdf
This slide outlines the overview and working of the micro-segmentation concept of cybersecurity. The purpose of this slide is to showcase how micro-segmentation divides the network components into smaller segments, all the way down to workloads. Explore a selection of the finest Microsegmentation Overview And Working In ZTNA Zero Trust Network Security Diagrams Pdf here. With a plethora of professionally designed and pre-made slide templates, you can quickly and easily find the right one for your upcoming presentation. You can use our Microsegmentation Overview And Working In ZTNA Zero Trust Network Security Diagrams Pdf to effectively convey your message to a wider audience. Slidegeeks has done a lot of research before preparing these presentation templates. The content can be personalized and the slides are highly editable. Grab templates today from Slidegeeks. This slide outlines the overview and working of the micro-segmentation concept of cybersecurity. The purpose of this slide is to showcase how micro-segmentation divides the network components into smaller segments, all the way down to workloads.

3 Stages Converging To Form Business Process Ppt Pie Network PowerPoint Templates
We present our 3 stages converging to form business process ppt Pie Network PowerPoint templates.Present our Marketing PowerPoint Templates because you should Lay down the fundamentals to build upon. Present our Arrows PowerPoint Templates because it is in your DNA to analyse possible causes to the minutest detail. Download and present our Business PowerPoint Templates because maximising sales of your product is the intended destination. Download and present our Flow charts PowerPoint Templates because you can Show them how to churn out fresh ideas. Use our Shapes PowerPoint Templates because the gears of youthful minds are useful, therefore set them in motion.Use these PowerPoint slides for presentations relating to Analysis, analyze, background, blank, business, businessman, center, central, chart component, concept, connect, core, decentralize, deploy, diagram, disperse disseminate, distribute, diverge, diverse, diversify, divide, education, element, empty expand, extend, flow, gist, group, industry, link, man, management, manager, part people, person, plan, process, scatter, separate, spread, strategy, support, surround teacher, template, transfer. The prominent colors used in the PowerPoint template are Green, Gray, White. People tell us our 3 stages converging to form business process ppt Pie Network PowerPoint templates are designed by professionals PowerPoint presentation experts tell us our blank PowerPoint templates and PPT Slides are Majestic. Presenters tell us our 3 stages converging to form business process ppt Pie Network PowerPoint templates are Second to none. PowerPoint presentation experts tell us our central PowerPoint templates and PPT Slides are visually appealing. People tell us our 3 stages converging to form business process ppt Pie Network PowerPoint templates are Nice. People tell us our blank PowerPoint templates and PPT Slides are Magnificent. Your audience will fall under your spell. Chant the words with our 3 Stages Converging To Form Business Process Ppt Pie Network PowerPoint Templates.
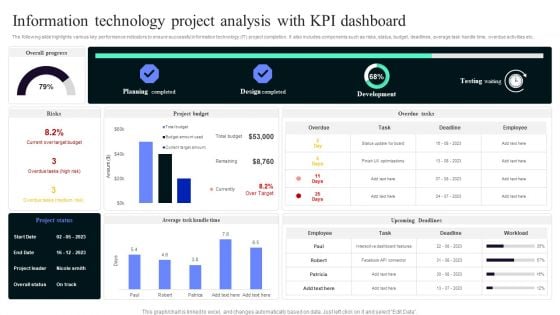
Information Technology Project Analysis With Kpi Dashboard Portrait PDF
The following slide highlights various key performance indicators to ensure successful information technology IT project completion. It also includes components such as risks, status, budget, deadlines, average task handle time, overdue activities etc. Pitch your topic with ease and precision using this Information Technology Project Analysis With Kpi Dashboard Portrait PDF. This layout presents information on Planning Completed, Design Completed, Development . It is also available for immediate download and adjustment. So, changes can be made in the color, design, graphics or any other component to create a unique layout.
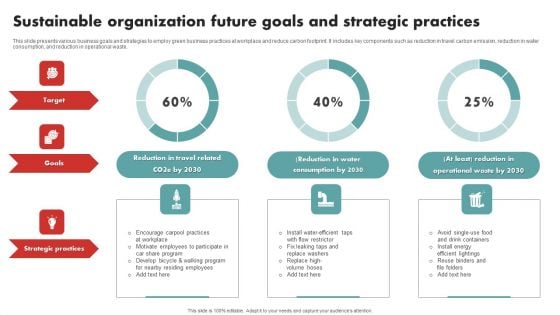
Sustainable Organization Future Goals And Strategic Practices Sample PDF
This slide presents various business goals and strategies to employ green business practices at workplace and reduce carbon footprint. It includes key components such as reduction in travel carbon emission, reduction in water consumption, and reduction in operational waste. Pitch your topic with ease and precision using this Sustainable Organization Future Goals And Strategic Practices Sample PDF This layout presents information on Goals, Target, Strategic Practices. It is also available for immediate download and adjustment. So, changes can be made in the color, design, graphics or any other component to create a unique layout.
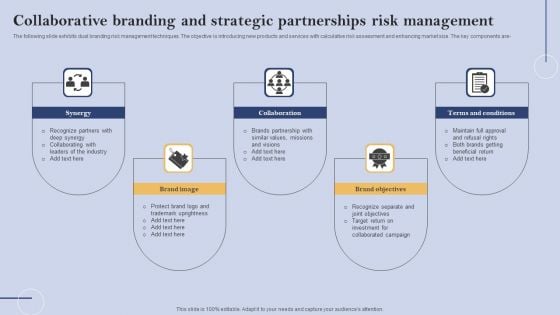
Collaborative Branding And Strategic Partnerships Risk Management Sample PDF
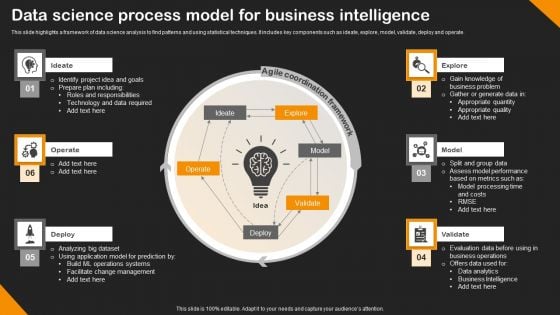
Data Science Process Model For Business Intelligence Infographics PDF
This slide highlights a framework of data science analysis to find patterns and using statistical techniques. It includes key components such as ideate, explore, model, validate, deploy and operate. Presenting Data Science Process Model For Business Intelligence Infographics PDF to dispense important information. This template comprises six stages. It also presents valuable insights into the topics including Operate, Deploy, Validate. This is a completely customizable PowerPoint theme that can be put to use immediately. So, download it and address the topic impactfully.
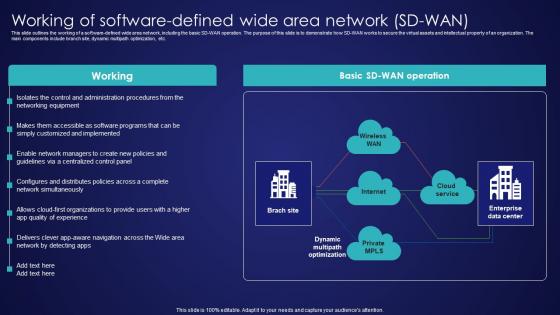
Working Of Software Defined Wide Area Network SD Wan Wide Area Network Services Diagrams Pdf
This slide outlines the working of a software-defined wide area network, including the basic SD-WAN operation. The purpose of this slide is to demonstrate how SD-WAN works to secure the virtual assets and intellectual property of an organization. The main components include branch site, dynamic multipath optimization, etc. Present like a pro with Working Of Software Defined Wide Area Network SD Wan Wide Area Network Services Diagrams Pdf Create beautiful presentations together with your team, using our easy-to-use presentation slides. Share your ideas in real-time and make changes on the fly by downloading our templates. So whether you are in the office, on the go, or in a remote location, you can stay in sync with your team and present your ideas with confidence. With Slidegeeks presentation got a whole lot easier. Grab these presentations today. This slide outlines the working of a software-defined wide area network, including the basic SD-WAN operation. The purpose of this slide is to demonstrate how SD-WAN works to secure the virtual assets and intellectual property of an organization. The main components include branch site, dynamic multipath optimization, etc.
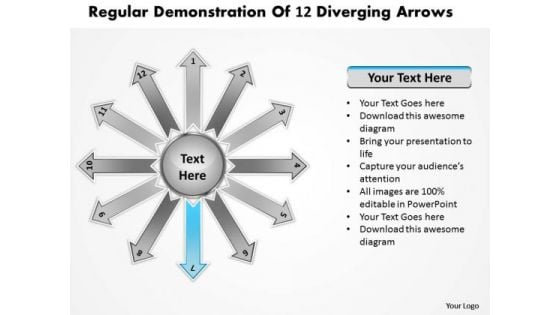
Regular Demonstration Of 12 Diverging Arrows Circular Spoke Network PowerPoint Slides
We present our regular demonstration of 12 diverging arrows Circular Spoke Network PowerPoint Slides.Download and present our Process and Flows PowerPoint Templates because it explains the goals of each team and how you intend for each slice to contribute to the entire cake. Use our Arrows PowerPoint Templates because individual components well researched and understood in their place. Present our Marketing PowerPoint Templates because it transmits this clarity of purpose onto the eager minds of your team. Download and present our Flow charts PowerPoint Templates because others naturally tend to follow in the path blazed by you. Download our Targets PowerPoint Templates because this diagram helps to reaffirm to your team your faith in maintaining the highest ethical standards.Use these PowerPoint slides for presentations relating to Arrow, background, banner,concept,creative, design, direction, flow, ten,illustration, infographic, instruction, label,layout, manual, marketing, modern, next,number, offer, one, options, order,pointer, process, product,promotion, sequence, simple, special,step, symbol. The prominent colors used in the PowerPoint template are Blue, Black, Gray. Customers tell us our regular demonstration of 12 diverging arrows Circular Spoke Network PowerPoint Slides look good visually. We assure you our concept PowerPoint templates and PPT Slides are Gorgeous. PowerPoint presentation experts tell us our regular demonstration of 12 diverging arrows Circular Spoke Network PowerPoint Slides will make the presenter look like a pro even if they are not computer savvy. People tell us our concept PowerPoint templates and PPT Slides are second to none. We assure you our regular demonstration of 12 diverging arrows Circular Spoke Network PowerPoint Slides are Excellent. Use our ten PowerPoint templates and PPT Slides are Exuberant. Give good counsel with our Regular Demonstration Of 12 Diverging Arrows Circular Spoke Network PowerPoint Slides. Your thoughts will show your compassion.
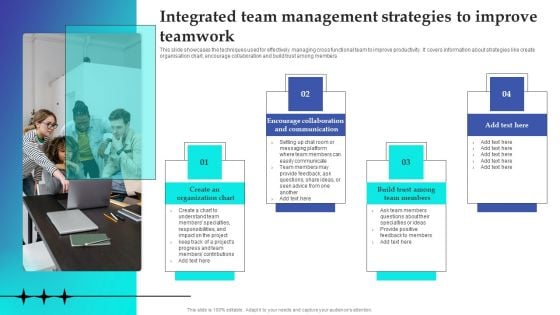
Integrated Team Management Strategies To Improve Teamwork Mockup PDF
This slide showcases the techniques used for effectively managing cross functional team to improve productivity. It covers information about strategies like create organisation chart, encourage collaboration and build trust among members. Presenting Integrated Team Management Strategies To Improve Teamwork Mockup PDF to dispense important information. This template comprises two stages. It also presents valuable insights into the topics including Create Organization Chart, Build Trust Among, Encourage Collaboration. This is a completely customizable PowerPoint theme that can be put to use immediately. So, download it and address the topic impactfully.
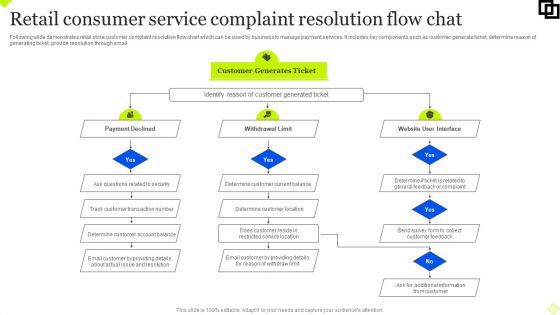
Retail Consumer Service Complaint Resolution Flow Chat Sample PDF
Following slide demonstrates retail store customer complaint resolution flow chart which can be used by business to manage payment services. It includes key components such as customer generate ticket, determine reason of generating ticket, provide resolution through email. Presenting Retail Consumer Service Complaint Resolution Flow Chat Sample PDF to dispense important information. This template comprises one stages. It also presents valuable insights into the topics including Payment Declined, Withdrawal Limit, Website User Interface. This is a completely customizable PowerPoint theme that can be put to use immediately. So, download it and address the topic impactfully.
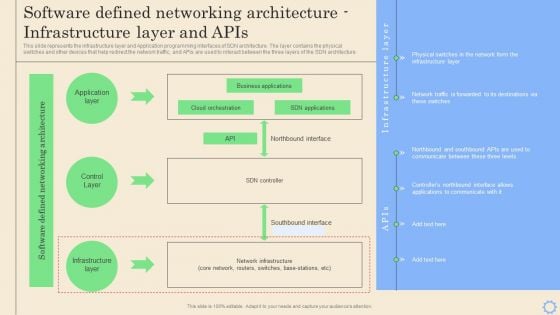
Software Defined Networking Development Strategies Software Defined Networking Architecture Infrastructure Diagrams PDF
This slide talks about the application layer of the SDN architecture that includes the network applications and functions that businesses deploy. The main components of the application layer are cloud orchestration and SDN applications. Are you searching for a Software Defined Networking Development Strategies Software Defined Networking Architecture Infrastructure Diagrams PDF that is uncluttered, straightforward, and original Its easy to edit, and you can change the colors to suit your personal or business branding. For a presentation that expresses how much effort you have put in, this template is ideal. With all of its features, including tables, diagrams, statistics, and lists, its perfect for a business plan presentation. Make your ideas more appealing with these professional slides. Download Software Defined Networking Development Strategies Software Defined Networking Architecture Infrastructure Diagrams PDF from Slidegeeks today.

F22 And F35 Fighter Jets Of United States Air Force In Echelon Formation Ppt PowerPoint Presentation Diagram Templates PDF
Pitch your topic with ease and precision using this f22 and f35 fighter jets of united states air force in echelon formation ppt powerpoint presentation diagram templates pdf. This layout presents information on f22 and f35 fighter jets of united states air force in echelon formation. It is also available for immediate download and adjustment. So, changes can be made in the color, design, graphics or any other component to create a unique layout.
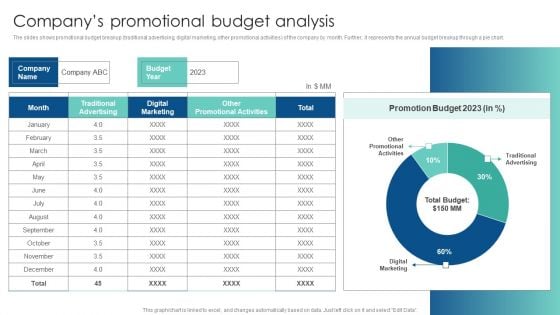
Companys Promotional Budget Analysis Customer Acquisition Through Advertising Download PDF
The slides shows promotional budget breakup traditional advertising, digital marketing, other promotional activities of the company by month. Further, it represents the annual budget breakup through a pie chart. This Companys Promotional Budget Analysis Customer Acquisition Through Advertising Download PDF from Slidegeeks makes it easy to present information on your topic with precision. It provides customization options, so you can make changes to the colors, design, graphics, or any other component to create a unique layout. It is also available for immediate download, so you can begin using it right away. Slidegeeks has done good research to ensure that you have everything you need to make your presentation stand out. Make a name out there for a brilliant performance.
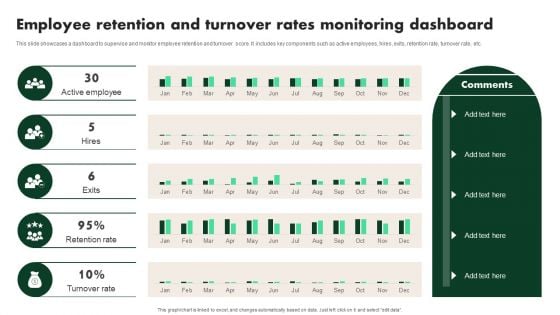
Creating Employee Value Proposition Employee Retention And Turnover Rates Monitoring Brochure PDF
This slide showcases a dashboard to supervise and monitor employee retention and turnover score. It includes key components such as active employees, hires, exits, retention rate, turnover rate, etc. If you are looking for a format to display your unique thoughts, then the professionally designed Creating Employee Value Proposition Employee Retention And Turnover Rates Monitoring Brochure PDF is the one for you. You can use it as a Google Slides template or a PowerPoint template. Incorporate impressive visuals, symbols, images, and other charts. Modify or reorganize the text boxes as you desire. Experiment with shade schemes and font pairings. Alter, share or cooperate with other people on your work. Download Creating Employee Value Proposition Employee Retention And Turnover Rates Monitoring Brochure PDF and find out how to give a successful presentation. Present a perfect display to your team and make your presentation unforgettable.
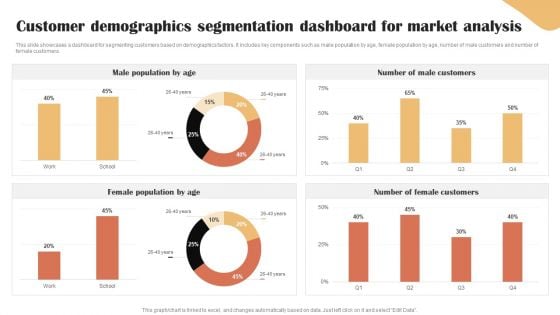
Categories Of Segmenting And Profiling Customers Customer Demographics Segmentation Dashboard Guidelines PDF
This slide showcases a dashboard for segmenting customers based on demographics factors. It includes key components such as make population by age, female population by age, number of male customers and number of female customers. If you are looking for a format to display your unique thoughts, then the professionally designed Categories Of Segmenting And Profiling Customers Customer Demographics Segmentation Dashboard Guidelines PDF is the one for you. You can use it as a Google Slides template or a PowerPoint template. Incorporate impressive visuals, symbols, images, and other charts. Modify or reorganize the text boxes as you desire. Experiment with shade schemes and font pairings. Alter, share or cooperate with other people on your work. Download Categories Of Segmenting And Profiling Customers Customer Demographics Segmentation Dashboard Guidelines PDF and find out how to give a successful presentation. Present a perfect display to your team and make your presentation unforgettable.
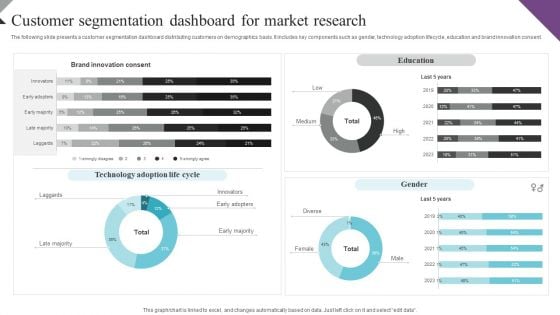
Customer Segmentation And Behavioral Analysis Customer Segmentation Dashboard Designs PDF
The following slide presents a customer segmentation dashboard distributing customers on demographics basis. It includes key components such as gender, technology adoption lifecycle, education and brand innovation consent. If you are looking for a format to display your unique thoughts, then the professionally designed Customer Segmentation And Behavioral Analysis Customer Segmentation Dashboard Designs PDF is the one for you. You can use it as a Google Slides template or a PowerPoint template. Incorporate impressive visuals, symbols, images, and other charts. Modify or reorganize the text boxes as you desire. Experiment with shade schemes and font pairings. Alter, share or cooperate with other people on your work. Download Customer Segmentation And Behavioral Analysis Customer Segmentation Dashboard Designs PDF and find out how to give a successful presentation. Present a perfect display to your team and make your presentation unforgettable.
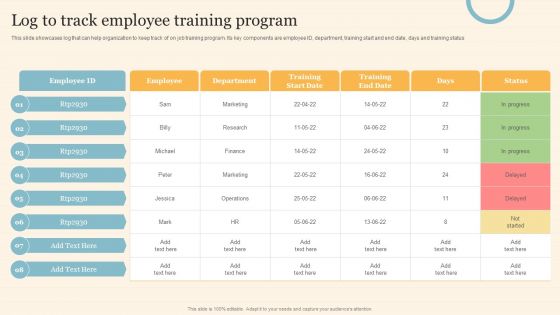
Staff On Job Coaching Program For Skills Enhancement Log To Track Employee Training Program Diagrams PDF
This slide showcases log that can help organization to keep track of on job training program. Its key components are employee ID, department, training start and end date, days and training status. Get a simple yet stunning designed Staff On Job Coaching Program For Skills Enhancement Log To Track Employee Training Program Diagrams PDF. It is the best one to establish the tone in your meetings. It is an excellent way to make your presentations highly effective. So, download this PPT today from Slidegeeks and see the positive impacts. Our easy to edit Staff On Job Coaching Program For Skills Enhancement Log To Track Employee Training Program Diagrams PDF can be your go to option for all upcoming conferences and meetings. So, what are you waiting for Grab this template today.
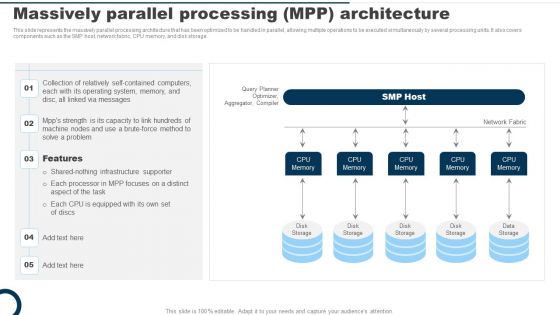
Massively Parallel Processing Mpp Architecture Ppt PowerPoint Presentation Diagram Images PDF
This slide represents the massively parallel processing architecture that has been optimized to be handled in parallel, allowing multiple operations to be executed simultaneously by several processing units. It also covers components such as the SMP host, network fabric, CPU memory, and disk storage. This Massively Parallel Processing Mpp Architecture Ppt PowerPoint Presentation Diagram Images PDF is perfect for any presentation, be it in front of clients or colleagues. It is a versatile and stylish solution for organizing your meetings. The Massively Parallel Processing Mpp Architecture Ppt PowerPoint Presentation Diagram Images PDF features a modern design for your presentation meetings. The adjustable and customizable slides provide unlimited possibilities for acing up your presentation. Slidegeeks has done all the homework before launching the product for you. So, do not wait, grab the presentation templates today.
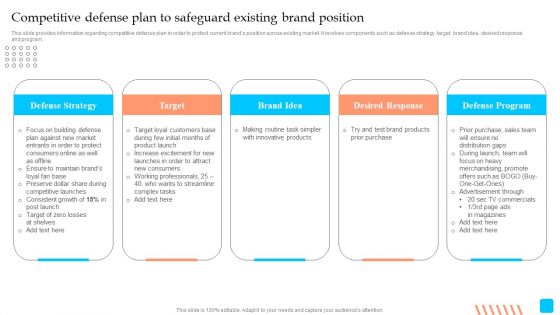
Strategic Toolkit To Administer Brand Image Competitive Defense Plan To Safeguard Existing Brand Position Diagrams PDF
This slide provides information regarding competitive defense plan in order to protect current brands position across existing market. It involves components such as defense strategy, target, brand idea, desired response and program. Find highly impressive Strategic Toolkit To Administer Brand Image Competitive Defense Plan To Safeguard Existing Brand Position Diagrams PDF on Slidegeeks to deliver a meaningful presentation. You can save an ample amount of time using these presentation templates. No need to worry to prepare everything from scratch because Slidegeeks experts have already done a huge research and work for you. You need to download Strategic Toolkit To Administer Brand Image Competitive Defense Plan To Safeguard Existing Brand Position Diagrams PDFfor your upcoming presentation. All the presentation templates are 100 percent editable and you can change the color and personalize the content accordingly. Download now.
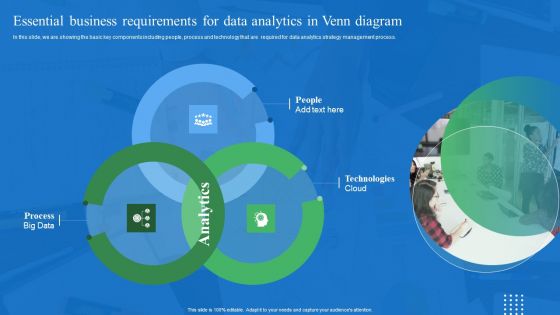
Essential Business Requirements For Data Analytics In Venn Diagram Introduction PDF
In this slide, we are showing the basic key components including people, process and technology that are required for data analytics strategy management process. Here you can discover an assortment of the finest PowerPoint and Google Slides templates. With these templates, you can create presentations for a variety of purposes while simultaneously providing your audience with an eye catching visual experience. Download Essential Business Requirements For Data Analytics In Venn Diagram Introduction PDF to deliver an impeccable presentation. These templates will make your job of preparing presentations much quicker, yet still, maintain a high level of quality. Slidegeeks has experienced researchers who prepare these templates and write high quality content for you. Later on, you can personalize the content by editing the Essential Business Requirements For Data Analytics In Venn Diagram Introduction PDF.
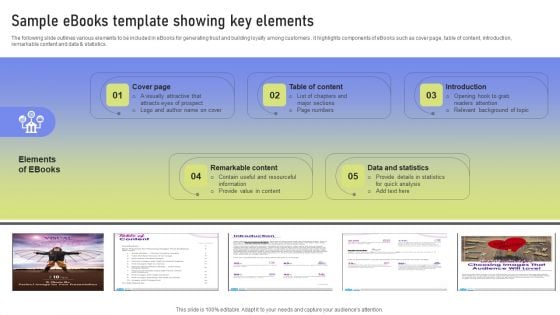
Sample Ebooks Template Showing Key Elements Ppt PowerPoint Presentation Diagram PDF
The following slide outlines various elements to be included in eBooks for generating trust and building loyalty among customers . it highlights components of eBooks such as cover page, table of content, introduction, remarkable content and data and statistics. Here you can discover an assortment of the finest PowerPoint and Google Slides templates. With these templates, you can create presentations for a variety of purposes while simultaneously providing your audience with an eye catching visual experience. Download Sample Ebooks Template Showing Key Elements Ppt PowerPoint Presentation Diagram PDF to deliver an impeccable presentation. These templates will make your job of preparing presentations much quicker, yet still, maintain a high level of quality. Slidegeeks has experienced researchers who prepare these templates and write high quality content for you. Later on, you can personalize the content by editing the Sample Ebooks Template Showing Key Elements Ppt PowerPoint Presentation Diagram PDF.
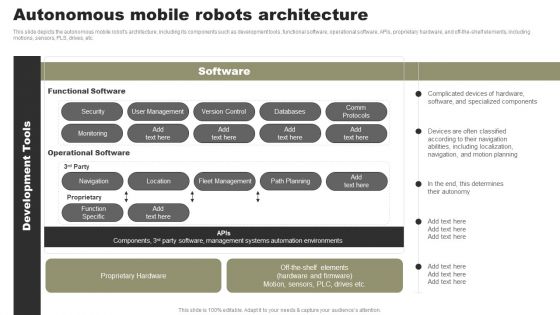
Types Of Independent Robotic System Autonomous Mobile Robots Architecture Diagrams PDF
This slide depicts the autonomous mobile robots architecture, including its components such as development tools, functional software, operational software, APIs, proprietary hardware, and off-the-shelf elements, including motions, sensors, PLS, drives, etc. Do you have to make sure that everyone on your team knows about any specific topic I yes, then you should give Types Of Independent Robotic System Autonomous Mobile Robots Architecture Diagrams PDF a try. Our experts have put a lot of knowledge and effort into creating this impeccable Types Of Independent Robotic System Autonomous Mobile Robots Architecture Diagrams PDF You can use this template for your upcoming presentations, as the slides are perfect to represent even the tiniest detail. You can download these templates from the Slidegeeks website and these are easy to edit. So grab these today.

Contact Us Mobile App Analytics Company Fund Raising Pitch Deck Diagrams Pdf
This Contact Us Mobile App Analytics Company Fund Raising Pitch Deck Diagrams Pdf from Slidegeeks makes it easy to present information on your topic with precision. It provides customization options, so you can make changes to the colors, design, graphics, or any other component to create a unique layout. It is also available for immediate download, so you can begin using it right away. Slidegeeks has done good research to ensure that you have everything you need to make your presentation stand out. Make a name out there for a brilliant performance. Our Contact Us Mobile App Analytics Company Fund Raising Pitch Deck Diagrams Pdf are topically designed to provide an attractive backdrop to any subject. Use them to look like a presentation pro.
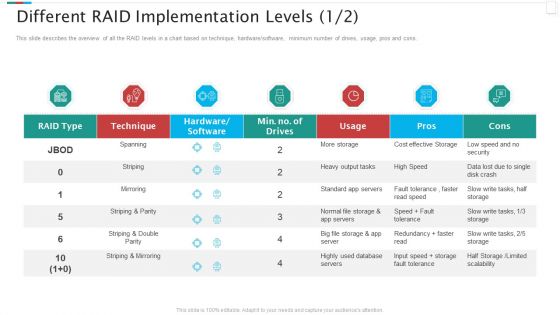
Redundant Array Of Independent Disks Storage IT Different RAID Implementation Levels Data Sample PDF
This slide describes the overview of all the RAID levels in a chart based on technique, hardware or software, minimum number of drives, usage, pros and cons. Deliver an awe inspiring pitch with this creative redundant array of independent disks storage it different raid implementation levels data sample pdf bundle. Topics like technique, servers, hardware or software, cost effective can be discussed with this completely editable template. It is available for immediate download depending on the needs and requirements of the user.
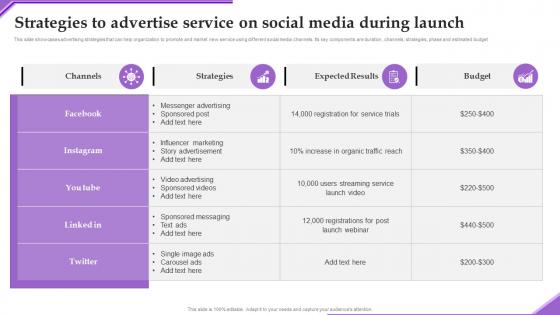
Strategies To Advertise Service Adverting New Sarvice Via Social Network Platfo Clipart Pdf
This slide showcases advertising strategies that can help organization to promote and market new service using different social media channels. Its key components are duration, channels, strategies, phase and estimated budget The best PPT templates are a great way to save time, energy, and resources. Slidegeeks have 100 percent editable powerpoint slides making them incredibly versatile. With these quality presentation templates, you can create a captivating and memorable presentation by combining visually appealing slides and effectively communicating your message. Download Strategies To Advertise Service Adverting New Sarvice Via Social Network Platfo Clipart Pdf from Slidegeeks and deliver a wonderful presentation. This slide showcases advertising strategies that can help organization to promote and market new service using different social media channels. Its key components are duration, channels, strategies, phase and estimated budget
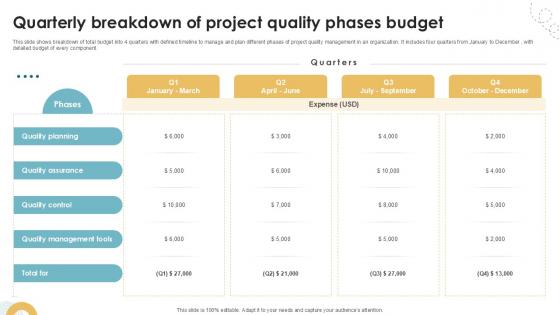
Quarterly Breakdown Of Project Quality Executing Quality Ppt Sample PM SS V
This slide shows breakdown of total budget into 4 quarters with defined timeline to manage and plan different phases of project quality management in an organization. It includes four quarters from January to December , with detailed budget of every component. Want to ace your presentation in front of a live audience Our Quarterly Breakdown Of Project Quality Executing Quality Ppt Sample PM SS V can help you do that by engaging all the users towards you. Slidegeeks experts have put their efforts and expertise into creating these impeccable powerpoint presentations so that you can communicate your ideas clearly. Moreover, all the templates are customizable, and easy-to-edit and downloadable. Use these for both personal and commercial use. This slide shows breakdown of total budget into 4 quarters with defined timeline to manage and plan different phases of project quality management in an organization. It includes four quarters from January to December, with detailed budget of every component.

Procedure Flow Diagram Arrows Investment Goals Ppt PowerPoint Presentation Complete Deck With Slides
Boost your confidence and team morale with this well-structured procedure flow diagram arrows investment goals ppt powerpoint presentation complete deck with slides. This prefabricated set gives a voice to your presentation because of its well-researched content and graphics. Our experts have added all the components very carefully, thus helping you deliver great presentations with a single click. Not only that, it contains a set of twelve slides that are designed using the right visuals, graphics, etc. Various topics can be discussed, and effective brainstorming sessions can be conducted using the wide variety of slides added in this complete deck. Apart from this, our PPT design contains clear instructions to help you restructure your presentations and create multiple variations. The color, format, design anything can be modified as deemed fit by the user. Not only this, it is available for immediate download. So, grab it now.
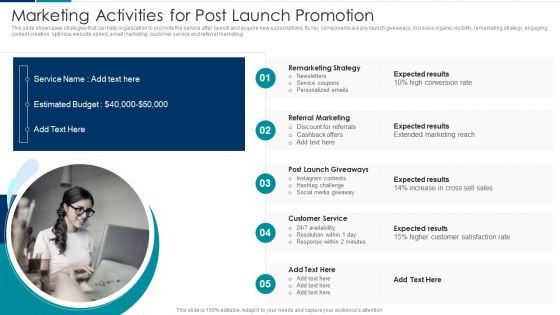
Managing New Service Roll Out And Marketing Procedure Marketing Activities For Post Launch Promotion Diagrams PDF
This slide showcases strategies that can help organization to promote the service after launch and acquire new subscriptions. Its key components are pre launch giveaways, increase organic visibility, remarketing strategy, engaging content creation, optimize website speed, email marketing, customer service and referral marketing. Presenting Managing New Service Roll Out And Marketing Procedure Marketing Activities For Post Launch Promotion Diagrams PDF to provide visual cues and insights. Share and navigate important information on five stages that need your due attention. This template can be used to pitch topics like Referral Marketing, Remarketing Strategy, Customer Service. In addtion, this PPT design contains high resolution images, graphics, etc, that are easily editable and available for immediate download.
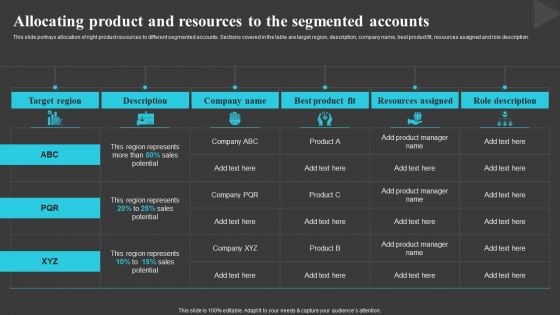
Allocating Product And Resources Creating And Offering Multiple Product Ranges In New Business Diagrams PDF
This slide portrays allocation of right product resources to different segmented accounts. Sections covered in the table are target region, description, company name, best product fit, resources assigned and role description. This Allocating Product And Resources Creating And Offering Multiple Product Ranges In New Business Diagrams PDF from Slidegeeks makes it easy to present information on your topic with precision. It provides customization options, so you can make changes to the colors, design, graphics, or any other component to create a unique layout. It is also available for immediate download, so you can begin using it right away. Slidegeeks has done good research to ensure that you have everything you need to make your presentation stand out. Make a name out there for a brilliant performance.
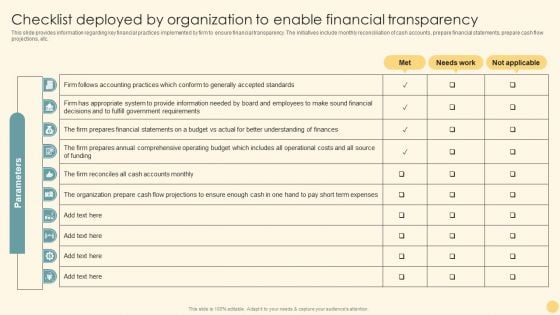
Checklist Deployed By Organization To Enable Financial Transparency Ppt PowerPoint Presentation Diagram PDF
This slide provides information regarding key financial practices implemented by firm to ensure financial transparency. The initiatives include monthly reconciliation of cash accounts, prepare financial statements, prepare cash flow projections, etc. This Checklist Deployed By Organization To Enable Financial Transparency Ppt PowerPoint Presentation Diagram PDF from Slidegeeks makes it easy to present information on your topic with precision. It provides customization options, so you can make changes to the colors, design, graphics, or any other component to create a unique layout. It is also available for immediate download, so you can begin using it right away. Slidegeeks has done good research to ensure that you have everything you need to make your presentation stand out. Make a name out there for a brilliant performance.
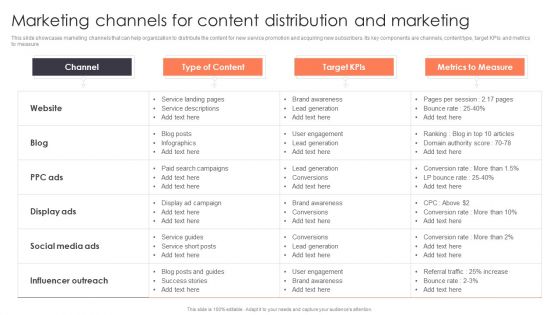
Promotion Strategies For New Service Launch Marketing Channels For Content Distribution And Marketing Diagrams PDF
This slide showcases marketing channels that can help organization to distribute the content for new service promotion and acquiring new subscribers. Its key components are channels, content type, target KPIs and metrics to measure. This modern and well arranged Promotion Strategies For New Service Launch Marketing Channels For Content Distribution And Marketing Diagrams PDF provides lots of creative possibilities. It is very simple to customize and edit with the Powerpoint Software. Just drag and drop your pictures into the shapes. All facets of this template can be edited with Powerpoint no extra software is necessary. Add your own material, put your images in the places assigned for them, adjust the colors, and then you can show your slides to the world, with an animated slide included.
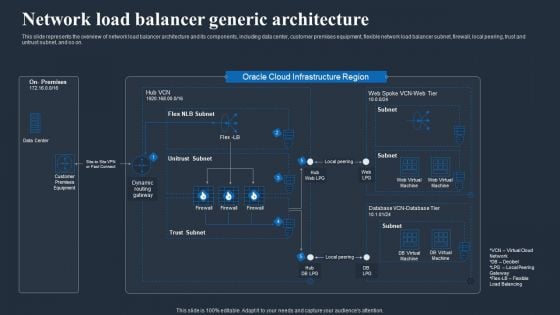
Load Balancing In Networking IT Network Load Balancer Generic Architecture Diagrams PDF
This slide represents the overview of network load balancer architecture and its components, including data center, customer premises equipment, flexible network load balancer subnet, firewall, local peering, trust and untrust subnet, and so on. Coming up with a presentation necessitates that the majority of the effort goes into the content and the message you intend to convey. The visuals of a PowerPoint presentation can only be effective if it supplements and supports the story that is being told. Keeping this in mind our experts created Load Balancing In Networking IT Network Load Balancer Generic Architecture Diagrams PDF to reduce the time that goes into designing the presentation. This way, you can concentrate on the message while our designers take care of providing you with the right template for the situation.
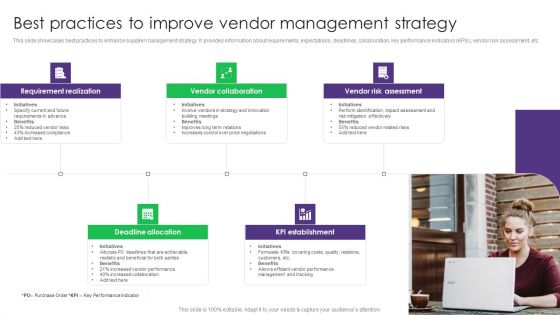
Vendor Management System Deployment Best Practices To Improve Vendor Management Strategy Diagrams PDF
This slide showcases best practices to enhance supplier management strategy. It provides information about requirements, expectations, deadlines, collaboration, key performance indicators KPIs, vendor risk assessment, etc. This Vendor Management System Deployment Best Practices To Improve Vendor Management Strategy Diagrams PDF from Slidegeeks makes it easy to present information on your topic with precision. It provides customization options, so you can make changes to the colors, design, graphics, or any other component to create a unique layout. It is also available for immediate download, so you can begin using it right away. Slidegeeks has done good research to ensure that you have everything you need to make your presentation stand out. Make a name out there for a brilliant performance.
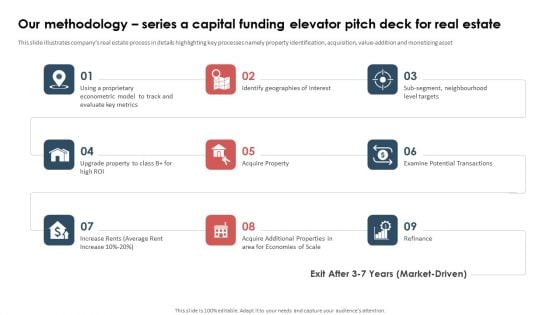
Our Methodology Series A Capital Funding Elevator Pitch Deck For Real Estate Diagrams PDF
This slide illustrates companys real estate process in details highlighting key processes namely property identification, acquisition, value-addition and monetizing asset. This Our Methodology Series A Capital Funding Elevator Pitch Deck For Real Estate Diagrams PDF from Slidegeeks makes it easy to present information on your topic with precision. It provides customization options, so you can make changes to the colors, design, graphics, or any other component to create a unique layout. It is also available for immediate download, so you can begin using it right away. Slidegeeks has done good research to ensure that you have everything you need to make your presentation stand out. Make a name out there for a brilliant performance.
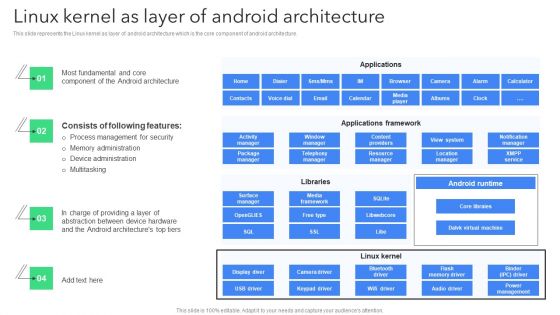
Creating Mobile Application For Android Linux Kernel As Layer Of Android Architecture Diagrams PDF
This slide represents the Linux kernel as layer of android architecture which is the core component of android architecture. Coming up with a presentation necessitates that the majority of the effort goes into the content and the message you intend to convey. The visuals of a PowerPoint presentation can only be effective if it supplements and supports the story that is being told. Keeping this in mind our experts created Creating Mobile Application For Android Linux Kernel As Layer Of Android Architecture Diagrams PDF to reduce the time that goes into designing the presentation. This way, you can concentrate on the message while our designers take care of providing you with the right template for the situation.
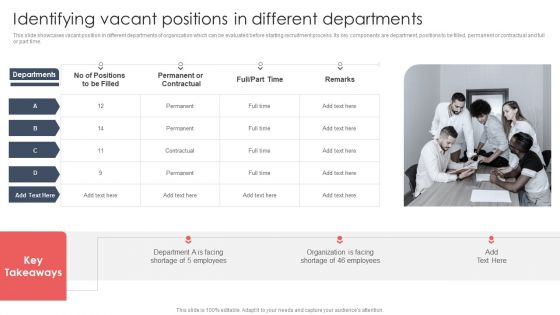
Screening And Staffing Identifying Vacant Positions In Different Departments Diagrams PDF
This slide showcases vacant position in different departments of organization which can be evaluated before starting recruitment process. Its key components are department, positions to be filled, permanent or contractual and full or part time. Are you in need of a template that can accommodate all of your creative concepts This one is crafted professionally and can be altered to fit any style. Use it with Google Slides or PowerPoint. Include striking photographs, symbols, depictions, and other visuals. Fill, move around, or remove text boxes as desired. Test out color palettes and font mixtures. Edit and save your work, or work with colleagues. Download Screening And Staffing Identifying Vacant Positions In Different Departments Diagrams PDF and observe how to make your presentation outstanding. Give an impeccable presentation to your group and make your presentation unforgettable.
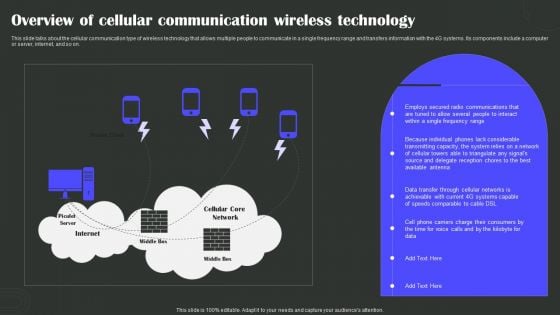
Overview Of Cellular Communication Wireless Technology Wireless Technology Transformation Diagrams PDF
This slide talks about the cellular communication type of wireless technology that allows multiple people to communicate in a single frequency range and transfers information with the 4G systems. Its components include a computer or server, internet, and so on. Take your projects to the next level with our ultimate collection of Overview Of Cellular Communication Wireless Technology Wireless Technology Transformation Diagrams PDF. Slidegeeks has designed a range of layouts that are perfect for representing task or activity duration, keeping track of all your deadlines at a glance. Tailor these designs to your exact needs and give them a truly corporate look with your own brand colors they well make your projects stand out from the rest.
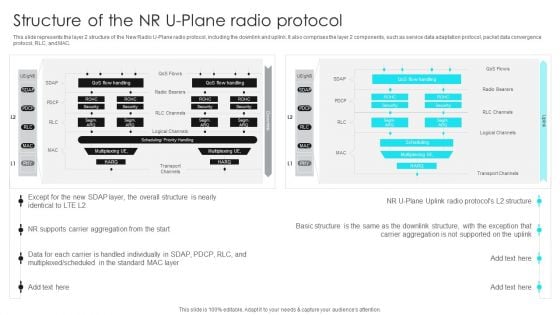
5G Network Operations Structure Of The NR U Plane Radio Protocol Diagrams PDF
This slide represents the layer 2 structure of the New Radio U-Plane radio protocol, including the downlink and uplink. It also comprises the layer 2 components, such as service data adaptation protocol, packet data convergence protocol, RLC, and MAC. Take your projects to the next level with our ultimate collection of 5G Network Operations Structure Of The NR U Plane Radio Protocol Diagrams PDF. Slidegeeks has designed a range of layouts that are perfect for representing task or activity duration, keeping track of all your deadlines at a glance. Tailor these designs to your exact needs and give them a truly corporate look with your own brand colors they will make your projects stand out from the rest.
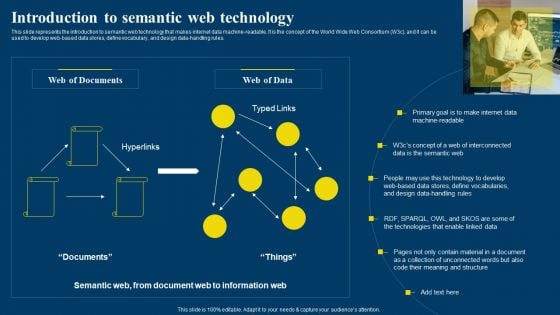
Semantic Web Business Framework Advantages IT Introduction To Semantic Web Technology Diagrams PDF
This slide represents the introduction to semantic web technology that makes internet data machine-readable. It is the concept of the World Wide Web Consortium W3c, and it can be used to develop web-based data stores, define vocabulary, and design data-handling rules. This Semantic Web Business Framework Advantages IT Introduction To Semantic Web Technology Diagrams PDF from Slidegeeks makes it easy to present information on your topic with precision. It provides customization options, so you can make changes to the colors, design, graphics, or any other component to create a unique layout. It is also available for immediate download, so you can begin using it right away. Slidegeeks has done good research to ensure that you have everything you need to make your presentation stand out. Make a name out there for a brilliant performance.
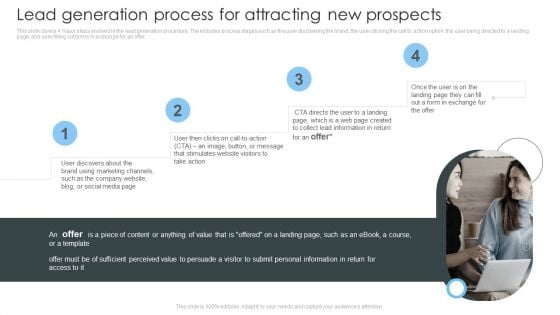
Consumer Lead Generation Process Lead Generation Process For Attracting New Prospects Diagrams PDF
This slide covers 4 major steps involved in the lead generation procedure. The includes process stages such as the user discovering the brand, the user clicking the call to action option, the user being directed to a landing page, and user filling out forms in exchange for an offer. This Consumer Lead Generation Process Lead Generation Process For Attracting New Prospects Diagrams PDF from Slidegeeks makes it easy to present information on your topic with precision. It provides customization options, so you can make changes to the colors, design, graphics, or any other component to create a unique layout. It is also available for immediate download, so you can begin using it right away. Slidegeeks has done good research to ensure that you have everything you need to make your presentation stand out. Make a name out there for a brilliant performance.
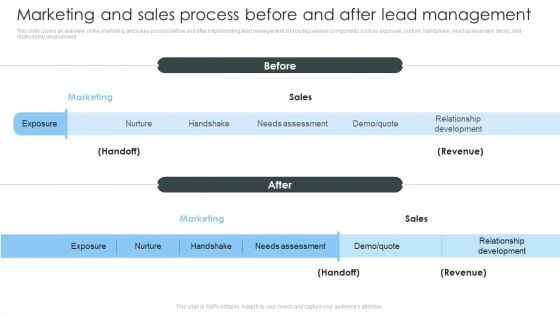
Consumer Lead Generation Process Marketing And Sales Process Before And After Lead Diagrams PDF
This slide covers an overview of the marketing and sales process before and after implementing lead management. It includes various components such as exposure, nurture, handshake, need assessment, demo, and relationship development. Welcome to our selection of the Consumer Lead Generation Process Marketing And Sales Process Before And After Lead Diagrams PDF. These are designed to help you showcase your creativity and bring your sphere to life. Planning and Innovation are essential for any business that is just starting out. This collection contains the designs that you need for your everyday presentations. All of our PowerPoints are 100 percent editable, so you can customize them to suit your needs. This multi-purpose template can be used in various situations. Grab these presentation templates today.
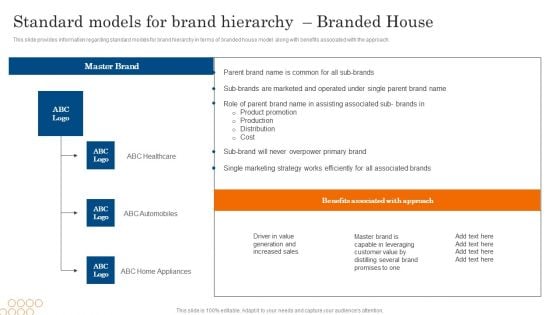
Standard Models For Brand Hierarchy Branded House Ppt PowerPoint Presentation File Diagrams PDF
This slide provides information regarding standard models for brand hierarchy in terms of branded house model along with benefits associated with the approach. This Standard Models For Brand Hierarchy Branded House Ppt PowerPoint Presentation File Diagrams PDF from Slidegeeks makes it easy to present information on your topic with precision. It provides customization options, so you can make changes to the colors, design, graphics, or any other component to create a unique layout. It is also available for immediate download, so you can begin using it right away. Slidegeeks has done good research to ensure that you have everything you need to make your presentation stand out. Make a name out there for a brilliant performance.
ATS Administration To Improve Key Benefits Of Implementing Nfc For Asset Tracking Diagrams PDF
This slide covers key advantages of implementing near field communication in asset management. It involves features such as effective asset return, web interface and speed. This ATS Administration To Improve Key Benefits Of Implementing Nfc For Asset Tracking Diagrams PDF from Slidegeeks makes it easy to present information on your topic with precision. It provides customization options, so you can make changes to the colors, design, graphics, or any other component to create a unique layout. It is also available for immediate download, so you can begin using it right away. Slidegeeks has done good research to ensure that you have everything you need to make your presentation stand out. Make a name out there for a brilliant performance.
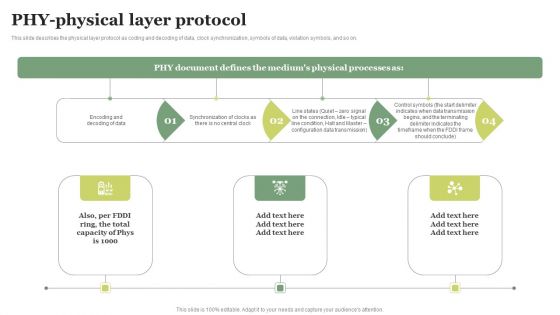
FDDI Deployment Phy Physical Layer Protocol Ppt PowerPoint Presentation Diagram Templates PDF
This slide describes the physical layer protocol as coding and decoding of data, clock synchronization, symbols of data, violation symbols, and so on. This FDDI Deployment Phy Physical Layer Protocol Ppt PowerPoint Presentation Diagram Templates PDF from Slidegeeks makes it easy to present information on your topic with precision. It provides customization options, so you can make changes to the colors, design, graphics, or any other component to create a unique layout. It is also available for immediate download, so you can begin using it right away. Slidegeeks has done good research to ensure that you have everything you need to make your presentation stand out. Make a name out there for a brilliant performance.
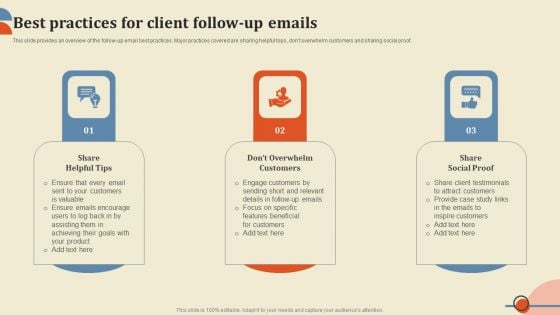
Best Practices For Client Follow Up Emails Ppt PowerPoint Presentation Diagram Templates PDF
This slide provides an overview of the follow-up email best practices. Major practices covered are sharing helpful tops, dont overwhelm customers and sharing social proof. This Best Practices For Client Follow Up Emails Ppt PowerPoint Presentation Diagram Templates PDF from Slidegeeks makes it easy to present information on your topic with precision. It provides customization options, so you can make changes to the colors, design, graphics, or any other component to create a unique layout. It is also available for immediate download, so you can begin using it right away. Slidegeeks has done good research to ensure that you have everything you need to make your presentation stand out. Make a name out there for a brilliant performance.
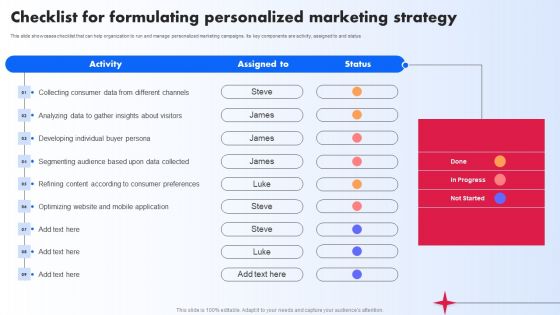
Checklist For Formulating Personalized Marketing Strategy Ppt PowerPoint Presentation Diagram Templates PDF
This slide showcases checklist that can help organization to run and manage personalized marketing campaigns. Its key components are activity, assigned to and status Slidegeeks is here to make your presentations a breeze with Checklist For Formulating Personalized Marketing Strategy Ppt PowerPoint Presentation Diagram Templates PDF With our easy to use and customizable templates, you can focus on delivering your ideas rather than worrying about formatting. With a variety of designs to choose from, you are sure to find one that suits your needs. And with animations and unique photos, illustrations, and fonts, you can make your presentation pop. So whether you are giving a sales pitch or presenting to the board, make sure to check out Slidegeeks first.
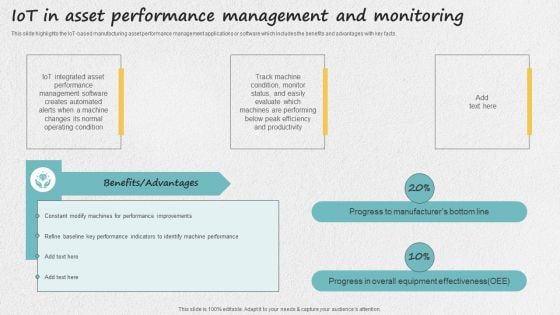
Iot Applications For Manufacturing Industry Iot In Asset Performance Management And Monitoring Diagrams PDF
This slide highlights the IoT-based manufacturing asset performance management applications or software which includes the benefits and advantages with key facts. This Iot Applications For Manufacturing Industry Iot In Asset Performance Management And Monitoring Diagrams PDF from Slidegeeks makes it easy to present information on your topic with precision. It provides customization options, so you can make changes to the colors, design, graphics, or any other component to create a unique layout. It is also available for immediate download, so you can begin using it right away. Slidegeeks has done good research to ensure that you have everything you need to make your presentation stand out. Make a name out there for a brilliant performance.
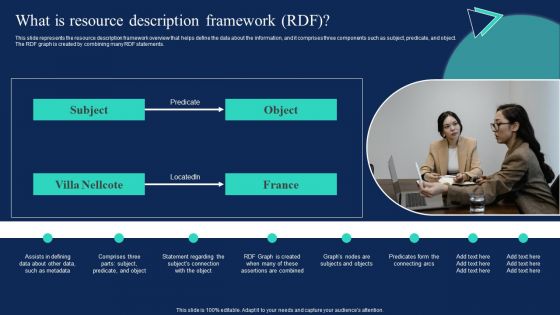
Enterprise Information Web Standards What Is Resource Description Framework RDF Diagrams PDF
This slide represents the resource description framework overview that helps define the data about the information, and it comprises three components such as subject, predicate, and object. The RDF graph is created by combining many RDF statements. Welcome to our selection of the Enterprise Information Web Standards What Is Resource Description Framework RDF Diagrams PDF. These are designed to help you showcase your creativity and bring your sphere to life. Planning and Innovation are essential for any business that is just starting out. This collection contains the designs that you need for your everyday presentations. All of our PowerPoints are 100 percent editable, so you can customize them to suit your needs. This multi purpose template can be used in various situations. Grab these presentation templates today.
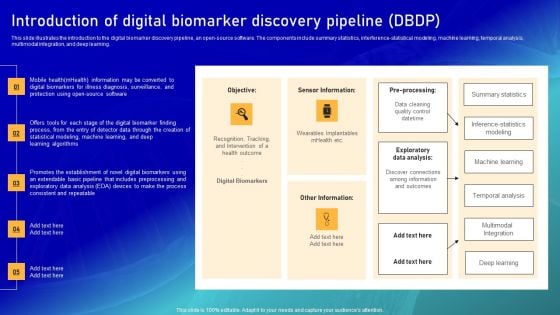
Biomarker Categorization Introduction Of Digital Biomarker Discovery Pipeline DBDP Diagrams PDF
This slide illustrates the introduction to the digital biomarker discovery pipeline, an open-source software. The components include summary statistics, interference-statistical modeling, machine learning, temporal analysis, multimodal integration, and deep learning. This modern and well arranged Biomarker Categorization Introduction Of Digital Biomarker Discovery Pipeline DBDP Diagrams PDF provides lots of creative possibilities. It is very simple to customize and edit with the Powerpoint Software. Just drag and drop your pictures into the shapes. All facets of this template can be edited with Powerpoint no extra software is necessary. Add your own material, put your images in the places assigned for them, adjust the colors, and then you can show your slides to the world, with an animated slide included.
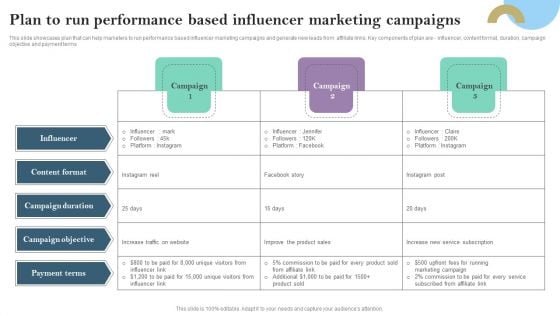
Plan To Run Performance Based Influencer Marketing Campaigns Ppt PowerPoint Presentation Diagram PDF
This slide showcases plan that can help marketers to run performance based influencer marketing campaigns and generate new leads from affiliate links. Key components of plan are - influencer, content format, duration, campaign objective and payment terms Present like a pro with Plan To Run Performance Based Influencer Marketing Campaigns Ppt PowerPoint Presentation Diagram PDF Create beautiful presentations together with your team, using our easy to use presentation slides. Share your ideas in real time and make changes on the fly by downloading our templates. So whether you are in the office, on the go, or in a remote location, you can stay in sync with your team and present your ideas with confidence. With Slidegeeks presentation got a whole lot easier. Grab these presentations today.
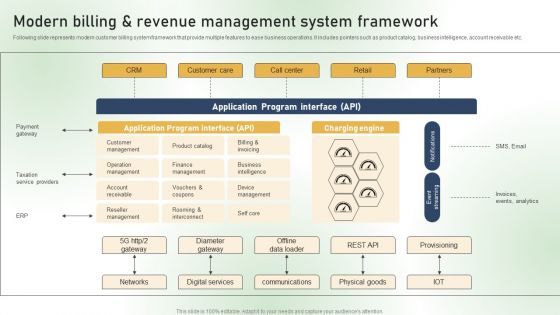
Modern Billing And Revenue Management System Framework Ppt PowerPoint Presentation Diagram Images PDF
Following slide represents modern customer billing system framework that provide multiple features to ease business operations. It includes pointers such as product catalog, business intelligence, account receivable etc. This Modern Billing And Revenue Management System Framework Ppt PowerPoint Presentation Diagram Images PDF from Slidegeeks makes it easy to present information on your topic with precision. It provides customization options, so you can make changes to the colors, design, graphics, or any other component to create a unique layout. It is also available for immediate download, so you can begin using it right away. Slidegeeks has done good research to ensure that you have everything you need to make your presentation stand out. Make a name out there for a brilliant performance.
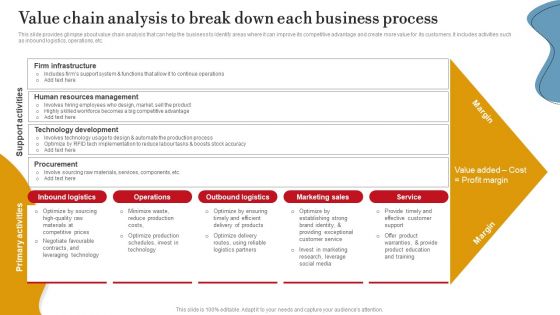
Value Chain Analysis To Break Down Each Business Process Ppt PowerPoint Presentation Diagram Images PDF
This slide provides glimpse about value chain analysis that can help the business to identify areas where it can improve its competitive advantage and create more value for its customers. It includes activities such as inbound logistics, operations, etc. This Value Chain Analysis To Break Down Each Business Process Ppt PowerPoint Presentation Diagram Images PDF from Slidegeeks makes it easy to present information on your topic with precision. It provides customization options, so you can make changes to the colors, design, graphics, or any other component to create a unique layout. It is also available for immediate download, so you can begin using it right away. Slidegeeks has done good research to ensure that you have everything you need to make your presentation stand out. Make a name out there for a brilliant performance.
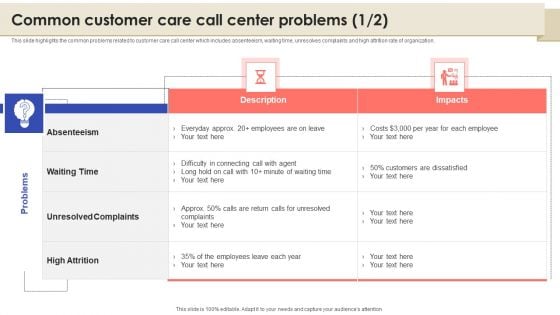
Call Center Quality Enhancement Plan Common Customer Care Call Center Problems Diagrams PDF
This slide highlights the common problems related to customer care call center which includes absenteeism, waiting time, unresolves complaints and high attrition rate of organization. This Call Center Quality Enhancement Plan Common Customer Care Call Center Problems Diagrams PDF from Slidegeeks makes it easy to present information on your topic with precision. It provides customization options, so you can make changes to the colors, design, graphics, or any other component to create a unique layout. It is also available for immediate download, so you can begin using it right away. Slidegeeks has done good research to ensure that you have everything you need to make your presentation stand out. Make a name out there for a brilliant performance.
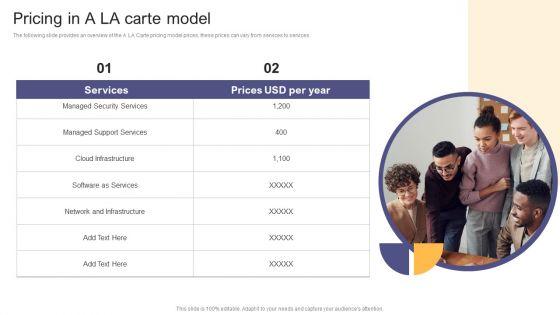
Per Device Pricing Strategy For Managed Solutions Pricing In A LA Carte Model Diagrams PDF
The following slide provides an overview of the A LA Carte pricing model prices, these prices can vary from services to services. This Per Device Pricing Strategy For Managed Solutions Pricing In A LA Carte Model Diagrams PDF from Slidegeeks makes it easy to present information on your topic with precision. It provides customization options, so you can make changes to the colors, design, graphics, or any other component to create a unique layout. It is also available for immediate download, so you can begin using it right away. Slidegeeks has done good research to ensure that you have everything you need to make your presentation stand out. Make a name out there for a brilliant performance.
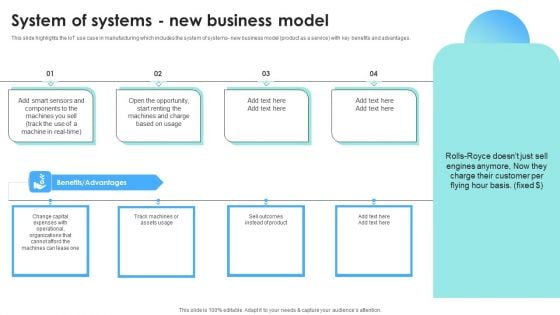
IOT Use Cases For Manufacturing System Of Systems New Business Model Diagrams PDF
This slide highlights the IoT use case in manufacturing which includes the system of systems- new business model product as a service with key benefits and advantages. This IOT Use Cases For Manufacturing System Of Systems New Business Model Diagrams PDF from Slidegeeks makes it easy to present information on your topic with precision. It provides customization options, so you can make changes to the colors, design, graphics, or any other component to create a unique layout. It is also available for immediate download, so you can begin using it right away. Slidegeeks has done good research to ensure that you have everything you need to make your presentation stand out. Make a name out there for a brilliant performance.
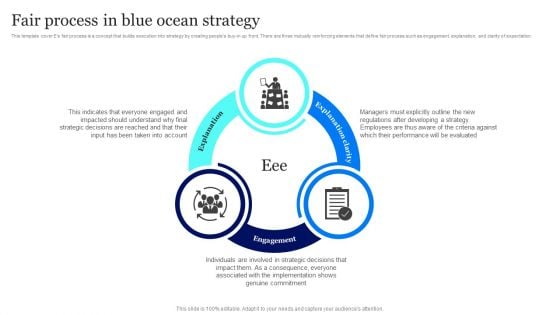
Blue Ocean Plan Of Tesla Fair Process In Blue Ocean Strategy Ppt Ideas Diagrams PDF
This template cover Es fair process is a concept that builds execution into strategy by creating peoples buy-in up front. There are three mutually reinforcing elements that define fair process such as engagement, explanation, and clarity of expectation. This Blue Ocean Plan Of Tesla Fair Process In Blue Ocean Strategy Ppt Ideas Diagrams PDF from Slidegeeks makes it easy to present information on your topic with precision. It provides customization options, so you can make changes to the colors, design, graphics, or any other component to create a unique layout. It is also available for immediate download, so you can begin using it right away. Slidegeeks has done good research to ensure that you have everything you need to make your presentation stand out. Make a name out there for a brilliant performance.
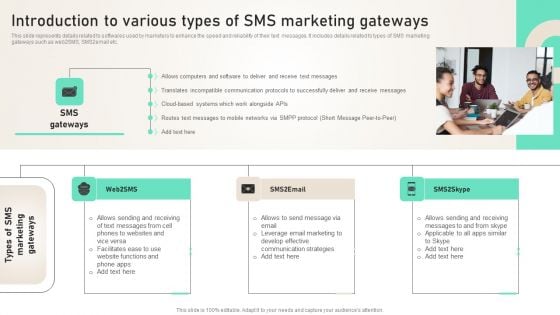
Introduction To Various Types Of SMS Marketing Gateways Ppt PowerPoint Presentation Diagram Lists PDF
This slide represents details related to softwares used by marketers to enhance the speed and reliability of their text messages. It includes details related to types of SMS marketing gateways such as web2SMS, SMS2email etc. This Introduction To Various Types Of SMS Marketing Gateways Ppt PowerPoint Presentation Diagram Lists PDF from Slidegeeks makes it easy to present information on your topic with precision. It provides customization options, so you can make changes to the colors, design, graphics, or any other component to create a unique layout. It is also available for immediate download, so you can begin using it right away. Slidegeeks has done good research to ensure that you have everything you need to make your presentation stand out. Make a name out there for a brilliant performance.
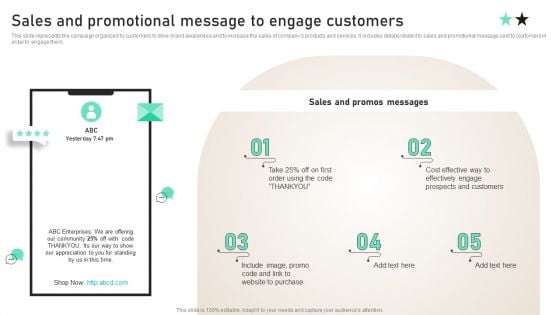
Sales And Promotional Message To Engage Customers Ppt PowerPoint Presentation File Diagrams PDF
This slide represents the campaign organized by customers to drive brand awareness and to increase the sales of companys products and services. It includes details related to sales and promotional message sent to customers in order to engage them. This Sales And Promotional Message To Engage Customers Ppt PowerPoint Presentation File Diagrams PDF from Slidegeeks makes it easy to present information on your topic with precision. It provides customization options, so you can make changes to the colors, design, graphics, or any other component to create a unique layout. It is also available for immediate download, so you can begin using it right away. Slidegeeks has done good research to ensure that you have everything you need to make your presentation stand out. Make a name out there for a brilliant performance.
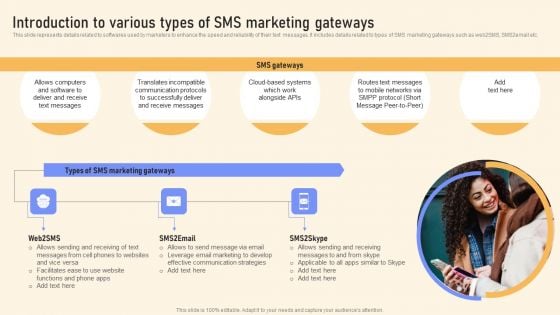
Introduction To Various Types Of SMS Marketing Gateways Ppt PowerPoint Presentation Diagram PDF
This slide represents details related to softwares used by marketers to enhance the speed and reliability of their text messages. It includes details related to types of SMS marketing gateways such as web2SMS, SMS2email etc. This Introduction To Various Types Of SMS Marketing Gateways Ppt PowerPoint Presentation Diagram PDF from Slidegeeks makes it easy to present information on your topic with precision. It provides customization options, so you can make changes to the colors, design, graphics, or any other component to create a unique layout. It is also available for immediate download, so you can begin using it right away. Slidegeeks has done good research to ensure that you have everything you need to make your presentation stand out. Make a name out there for a brilliant performance.
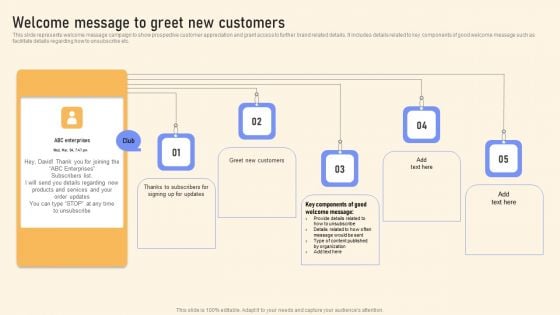
Welcome Message To Greet New Customers Ppt PowerPoint Presentation Diagram Templates PDF
This slide represents welcome message campaign to show prospective customer appreciation and grant access to further brand related details. It includes details related to key components of good welcome message such as facilitate details regarding how to unsubscribe etc. Slidegeeks is here to make your presentations a breeze with Welcome Message To Greet New Customers Ppt PowerPoint Presentation Diagram Templates PDF With our easy to use and customizable templates, you can focus on delivering your ideas rather than worrying about formatting. With a variety of designs to choose from, you are sure to find one that suits your needs. And with animations and unique photos, illustrations, and fonts, you can make your presentation pop. So whether you are giving a sales pitch or presenting to the board, make sure to check out Slidegeeks first.
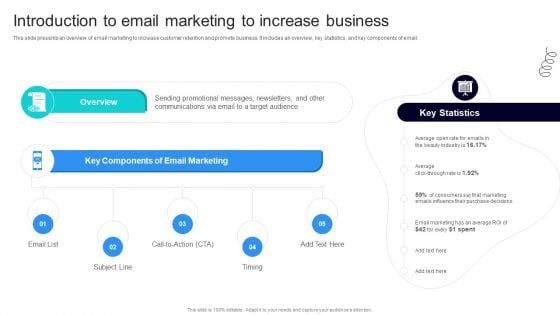
Strategic Marketing For Hair And Beauty Salon To Increase Introduction To Email Marketing Diagrams PDF
This slide presents an overview of email marketing to increase customer retention and promote business. It includes an overview, key statistics, and key components of email. Coming up with a presentation necessitates that the majority of the effort goes into the content and the message you intend to convey. The visuals of a PowerPoint presentation can only be effective if it supplements and supports the story that is being told. Keeping this in mind our experts created Strategic Marketing For Hair And Beauty Salon To Increase Introduction To Email Marketing Diagrams PDF to reduce the time that goes into designing the presentation. This way, you can concentrate on the message while our designers take care of providing you with the right template for the situation.
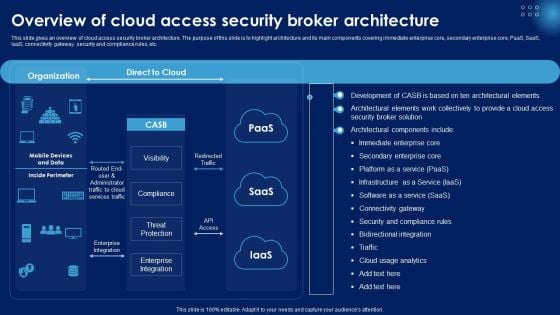
Overview Of Cloud Access Security Broker Architecture Ppt PowerPoint Presentation Diagram Lists PDF
This slide gives an overview of cloud access security broker architecture. The purpose of this slide is to highlight architecture and its main components covering immediate enterprise core, secondary enterprise core, PaaS, SaaS, IaaS, connectivity gateway, security and compliance rules, etc. Slidegeeks has constructed Overview Of Cloud Access Security Broker Architecture Ppt PowerPoint Presentation Diagram Lists PDF after conducting extensive research and examination. These presentation templates are constantly being generated and modified based on user preferences and critiques from editors. Here, you will find the most attractive templates for a range of purposes while taking into account ratings and remarks from users regarding the content. This is an excellent jumping off point to explore our content and will give new users an insight into our top notch PowerPoint Templates.
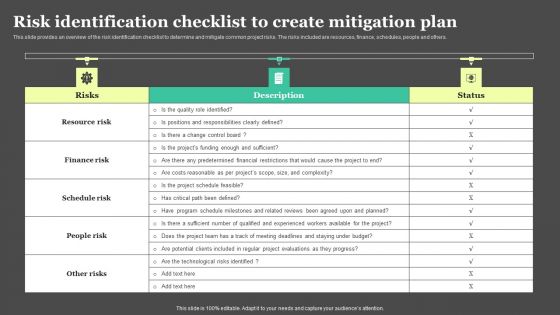
Risk Detection And Management Risk Identification Checklist To Create Mitigation Plan Diagrams PDF
This slide provides an overview of the risk identification checklist to determine and mitigate common project risks. The risks included are resources, finance, schedules, people and others. This Risk Detection And Management Risk Identification Checklist To Create Mitigation Plan Diagrams PDF from Slidegeeks makes it easy to present information on your topic with precision. It provides customization options, so you can make changes to the colors, design, graphics, or any other component to create a unique layout. It is also available for immediate download, so you can begin using it right away. Slidegeeks has done good research to ensure that you have everything you need to make your presentation stand out. Make a name out there for a brilliant performance.

 Home
Home