Outline
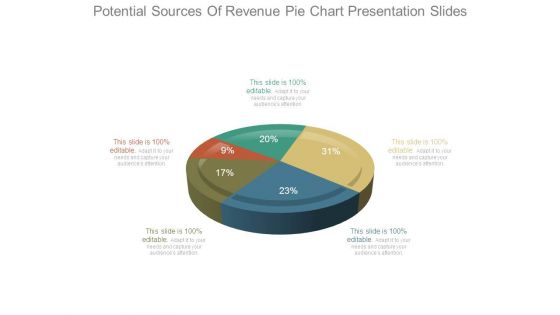
Potential Sources Of Revenue Pie Chart Presentation Slides
This is a potential sources of revenue pie chart presentation slides. This is a five stage process. The stages in this process are finance, success, business, marketing, percentage, pie.
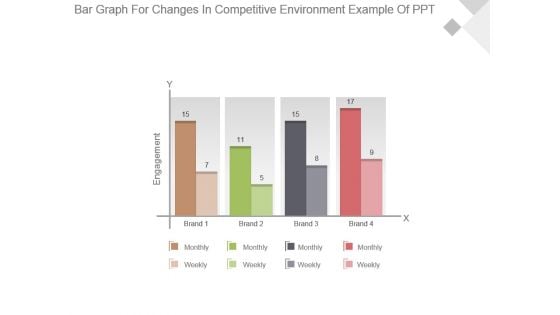
Bar Graph For Changes In Competitive Environment Example Of Ppt
This is a bar graph for changes in competitive environment example of ppt. This is a four stage process. The stages in this process are engagement, brand, monthly, weekly.
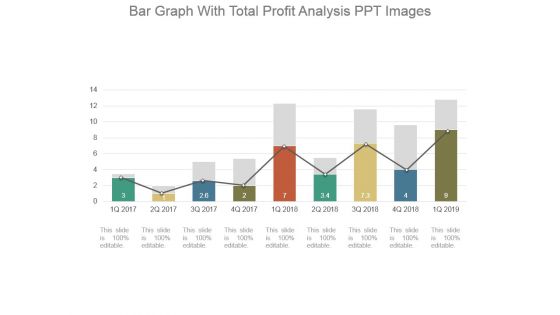
Bar Graph With Total Profit Analysis Ppt Images
This is a bar graph with total profit analysis ppt images. This is a nine stage process. The stages in this process are bar graph, business, marketing, growth, success.
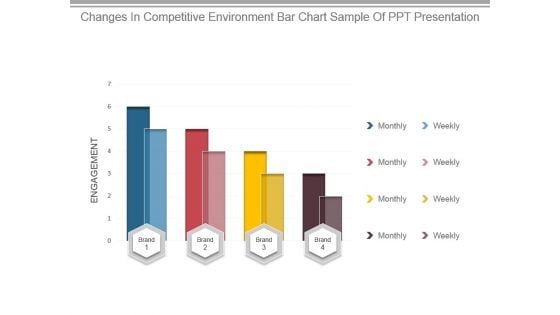
Changes In Competitive Environment Bar Chart Sample Of Ppt Presentation
This is a changes in competitive environment bar chart sample of ppt presentation. This is a four stage process. The stages in this process are engagement, brand, monthly, weekly.
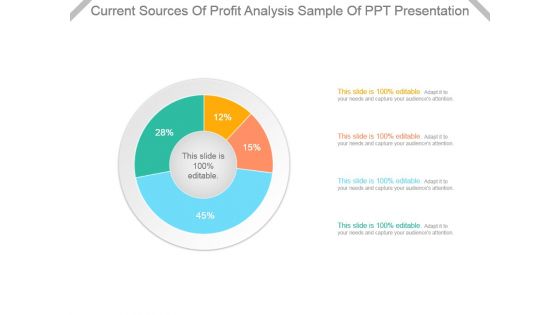
Current Sources Of Profit Analysis Sample Of Ppt Presentation
This is a current sources of profit analysis sample of ppt presentation. This is a four stage process. The stages in this process are business, finance, marketing, percentage, management.
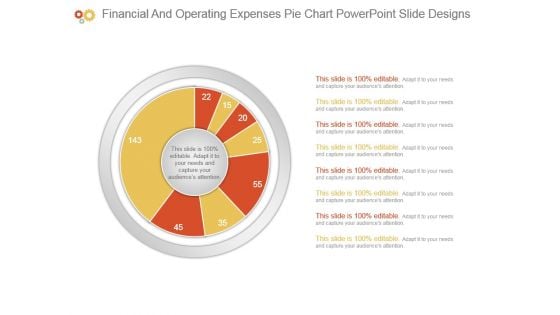
Financial And Operating Expenses Pie Chart Powerpoint Slide Designs
This is a financial and operating expenses pie chart powerpoint slide designs. This is a eight stage process. The stages in this process are business, diagram, marketing, management, presentation.
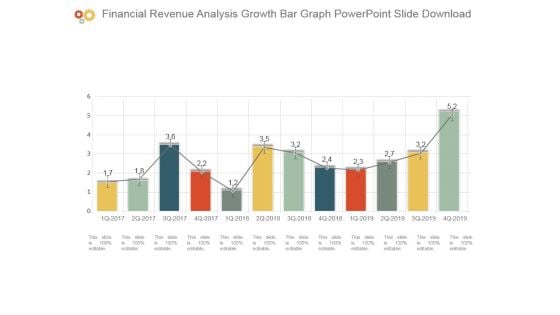
Financial Revenue Analysis Growth Bar Graph Powerpoint Slide Download
This is a financial revenue analysis growth bar graph powerpoint slide download. This is a twelve stage process. The stages in this process are bar graph, business, marketing, growth, success.
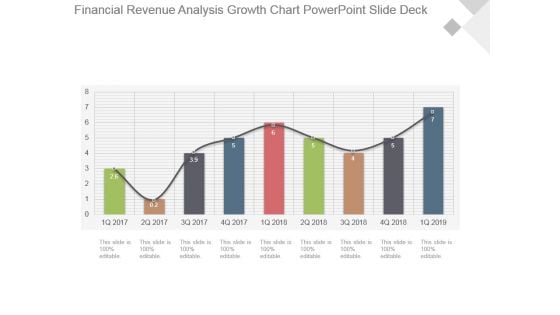
Financial Revenue Analysis Growth Chart Powerpoint Slide Deck
This is a financial revenue analysis growth chart powerpoint slide deck. This is a nine stage process. The stages in this process are growth, success, business, marketing, bar graph.
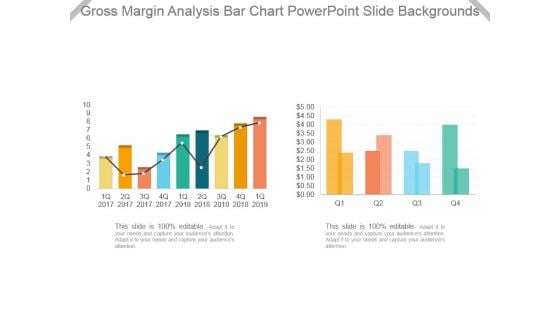
Gross Margin Analysis Bar Chart Powerpoint Slide Backgrounds
This is a gross margin analysis bar chart powerpoint slide backgrounds. This is a two stage process. The stages in this process are bar graph, business, marketing, growth, success.
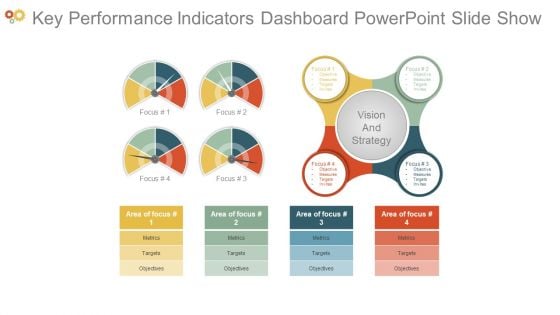
Key Performance Indicators Dashboard Powerpoint Slide Show
This is a key performance indicators dashboard powerpoint slide show. This is a four stage process. The stages in this process are focus, objective, measures, targets, invites, vision and strategy, area of focus, metrics, objectives.
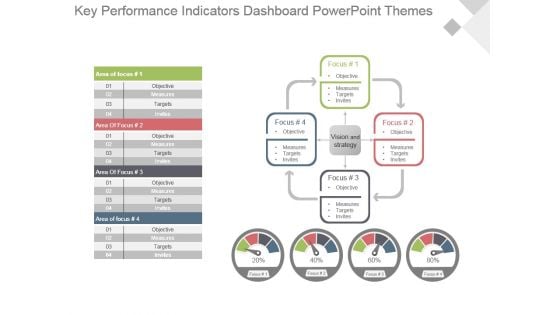
Key Performance Indicators Dashboard Powerpoint Themes
This is a key performance indicators dashboard powerpoint themes. This is a four stage process. The stages in this process are focus, objective, measures, targets, invites, vision and strategy, area of focus.

Key Performance Indicators For Area Of Focus Powerpoint Slide Backgrounds
This is a key performance indicators for area of focus powerpoint slide backgrounds. This is a four stage process. The stages in this process are area of focus, metrics, targets, objectives, focus, measures, invites, vision and strategy.
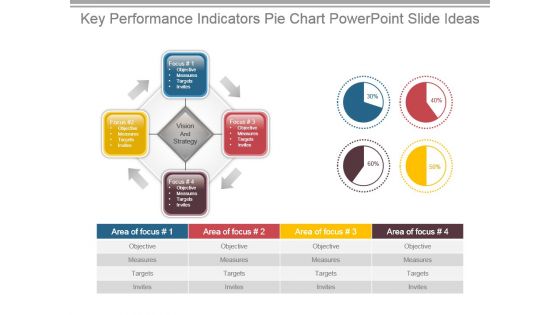
Key Performance Indicators Pie Chart Powerpoint Slide Ideas
This is a key performance indicators pie chart powerpoint slide ideas. This is a four stage process. The stages in this process are focus, objectives, measures, targets, invites, vision and strategy, area of focus.
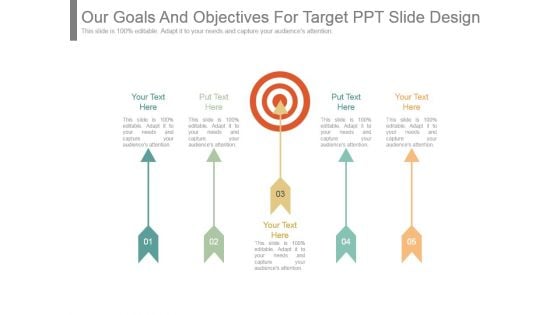
Our Goals And Objectives For Target Ppt Slide Design
This is a our goals and objectives for target ppt slide design. This is a five stage process. The stages in this process are business, marketing, goal, target, arrows.
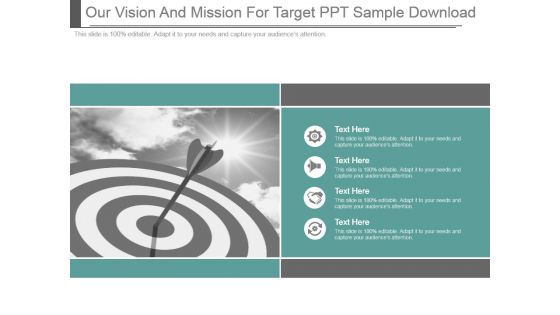
Our Vision And Mission For Target Ppt Sample Download
This is a our vision and mission for target ppt sample download. This is a four stage process. The stages in this process are business, marketing, goal, success, strategy.
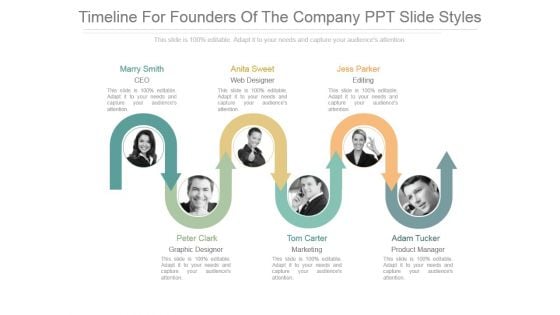
Timeline For Founders Of The Company Ppt Slide Styles
This is a timeline for founders of the company ppt slide styles. This is a six stage process. The stages in this process are ceo, web designer, editing, graphic designer, marketing, product manager.
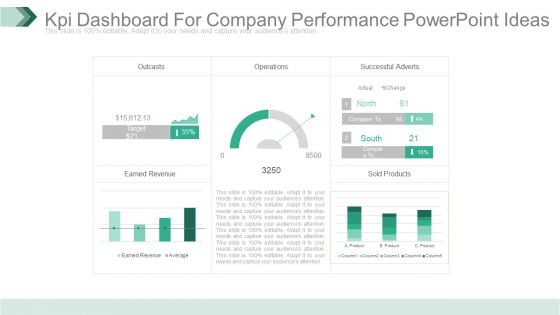
Kpi Dashboard For Company Performance Powerpoint Ideas
This is a kpi dashboard for company performance powerpoint ideas. This is a five stage process. The stages in this process are outcasts, operations, successful adverts, earned revenue, sold products.
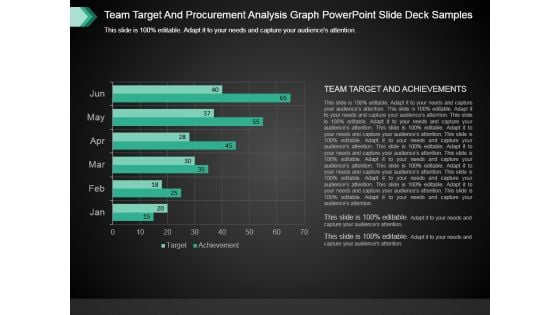
Team Target And Procurement Analysis Graph Powerpoint Slide Deck Samples
This is a team target and procurement analysis graph powerpoint slide deck samples. This is a six stage process. The stages in this process are graph chart, business, success, strategy, management.
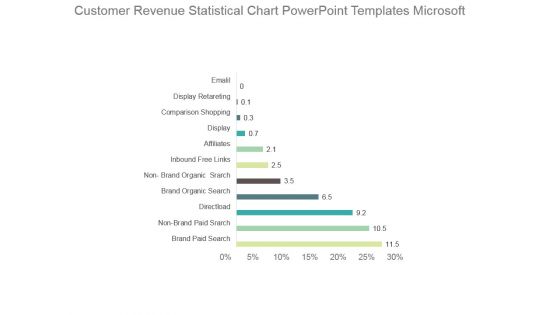
Customer Revenue Statistical Chart Powerpoint Templates Microsoft
This is a customer revenue statistical chart powerpoint templates microsoft. This is a ten stage process. The stages in this process are email, display retargeting, comparison shopping, display, affiliates, inbound free links, brand organic search, brand paid search.
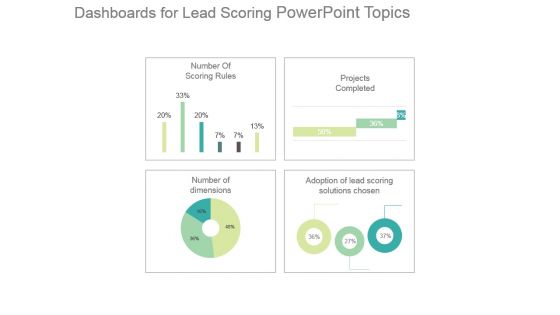
Dashboards For Lead Scoring Powerpoint Topics
This is a dashboards for lead scoring powerpoint topics. This is a four stage process. The stages in this process are number of scoring rules, projects completed, adoption of lead scoring solutions chosen, number of dimensions.
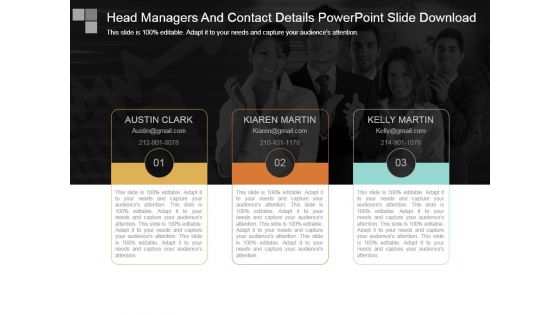
Head Managers And Contact Details Powerpoint Slide Download
This is a head managers and contact details powerpoint slide download. This is a three stage process. The stages in this process are austin clark, kiaren martin, kelly martin.

Introduction Of Workforce Professional Skills Powerpoint Slide Ideas
This is a introduction of workforce professional skills powerpoint slide ideas. This is a one stage process. The stages in this process are personal skills, business, presentation, management, strategy.

Key Responsibility Areas Presentation Deck
This is a key responsibility areas presentation deck. This is a six stage process. The stages in this process are peter lee developer, marry graves ceo, john steven programmer, julie daniel marketing, tom steven general manager, jasmin smith designer.
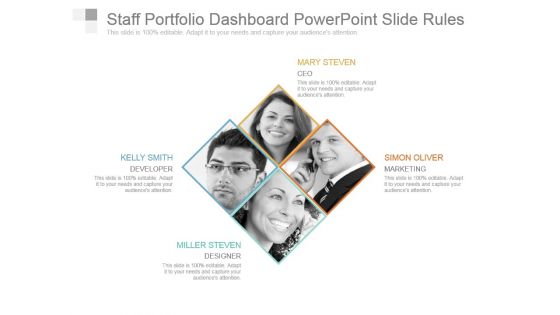
Staff Portfolio Dashboard Powerpoint Slide Rules
This is a staff portfolio dashboard powerpoint slide rules. This is a four stage process. The stages in this process are mary steven ceo, simon oliver marketing, miller steven designer, kelly smith developer.
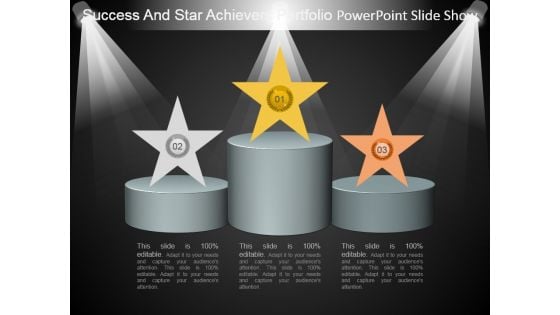
Success And Star Achievers Portfolio Powerpoint Slide Show
This is a success and star achievers portfolio powerpoint slide show. This is a three stage process. The stages in this process are podium, portfolio, success, achievement, stars, business.
Team Performance Kpi Tracker Powerpoint Slide Templates
This is a team performance kpi tracker powerpoint slide templates. This is a eight stage process. The stages in this process are successful, no answer, call busy, disconnected, wrong number, unavailable, disconnected, demo booked.
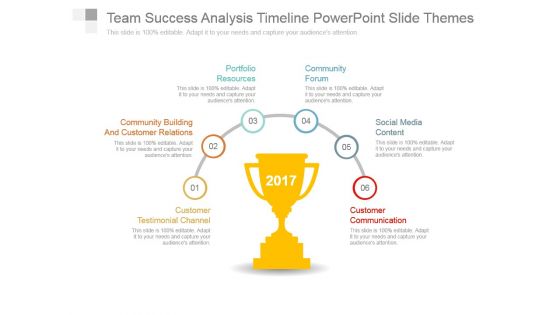
Team Success Analysis Timeline Powerpoint Slide Themes
This is a team success analysis timeline powerpoint slide themes. This is a six stage process. The stages in this process are customer testimonial channel, community building and customer relations, portfolio resources, community forum, social media content, customer communication.
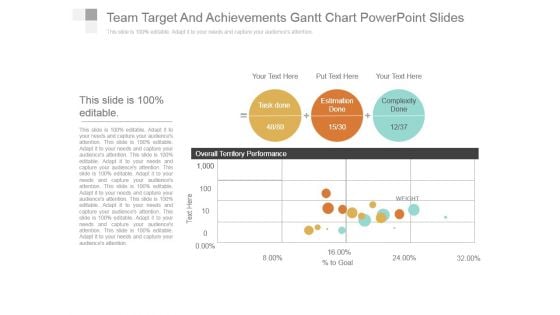
Team Target And Achievements Gantt Chart Powerpoint Slides
This is a team target and achievements gantt chart powerpoint slides. This is a three stage process. The stages in this process are task done, estimation done, complexity done, overall territory performance.
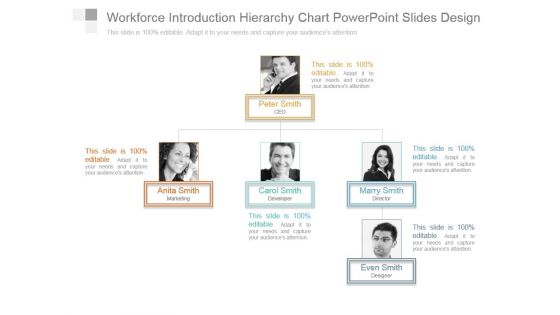
Workforce Introduction Hierarchy Chart Powerpoint Slides Design
This is a workforce introduction hierarchy chart powerpoint slides design. This is a three stage process. The stages in this process are peter smith ceo, anita smith marketing, carol smith developer, marry smith director, even smith designer.
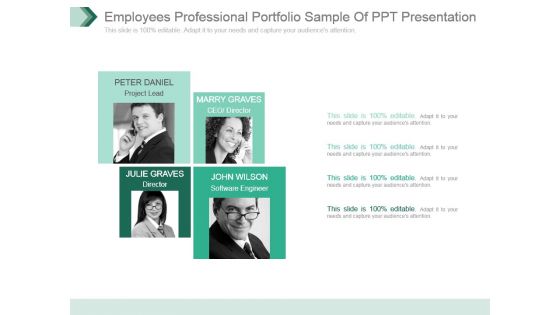
Employees Professional Portfolio Sample Of Ppt Presentation
This is a employees professional portfolio sample of ppt presentation. This is a four stage process. The stages in this process are peter daniel project lead, marry graves ceo director, julie graves director, john wilson software engineer.
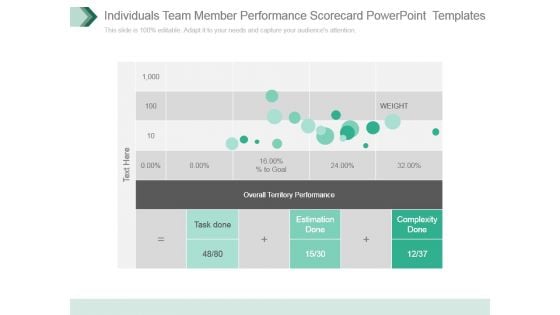
Individuals Team Member Performance Scorecard Powerpoint Templates
This is a individuals team member performance scorecard powerpoint templates. This is a four stage process. The stages in this process are task done, estimation done, complexity done, overall territory performance, weight.
Kpi Tracker For Customer Calls Powerpoint Images
This is a kpi tracker for customer calls powerpoint images. This is a three stage process. The stages in this process are successful, no answer, call busy, disconnected, wrong number, unavailable, disconnected, demo booked.
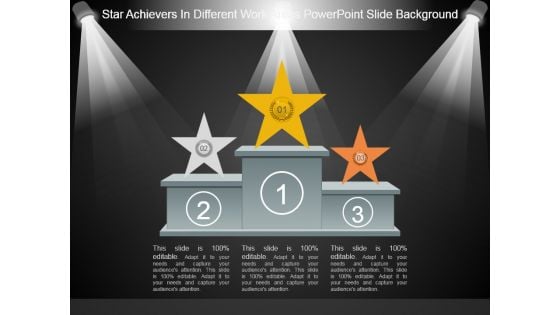
Star Achievers In Different Work Areas Powerpoint Slide Background
This is a star achievers in different work areas powerpoint slide background. This is a three stage process. The stages in this process are winner podium, success, business, achievement, ranking.
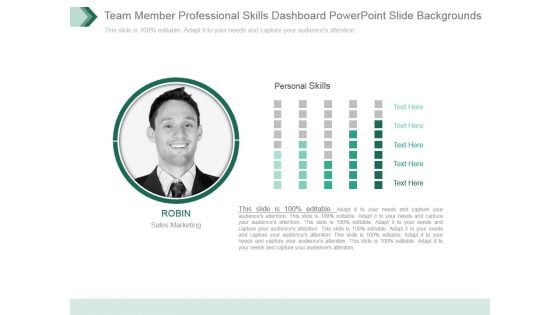
Team Member Professional Skills Dashboard Powerpoint Slide Backgrounds
This is a team member professional skills dashboard powerpoint slide backgrounds. This is a one stage process. The stages in this process are personal skills, sales marketing, business, management, presentation.
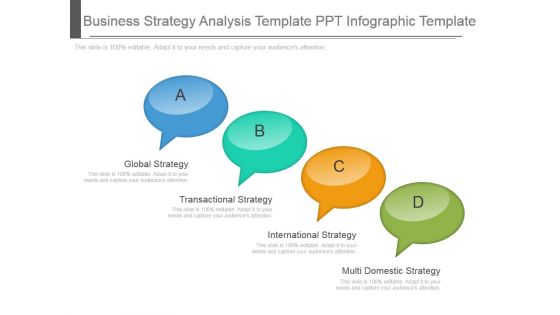
Business Strategy Analysis Template Ppt Infographic Template
This is a business strategy analysis template ppt infographic template. This is a four stage process. The stages in this process are global strategy, transactional strategy, international strategy, multi domestic strategy.

Consumer Behavior Building Marketing Strategy Ppt Slides Examples
This is a consumer behavior building marketing strategy ppt slides examples. This is a five stage process. The stages in this process are consumer behavior, purchasing power, brand knowledge, marketing program, consumer preferences.
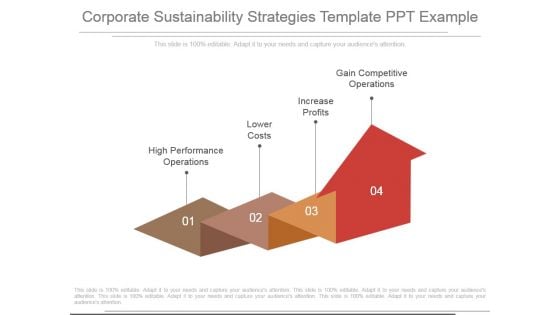
Corporate Sustainability Strategies Template Ppt Example
This is a corporate sustainability strategies template ppt example. This is a four stage process. The stages in this process are high performance operations, lower costs, increase profits, gain competitive operations.
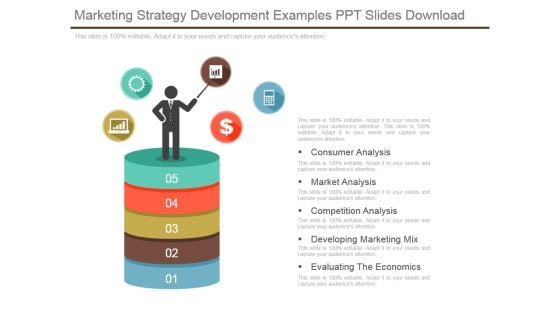
Marketing Strategy Development Examples Ppt Slides Download
This is a marketing strategy development examples ppt slides download. This is a five stage process. The stages in this process are consumer analysis, market analysis, competition analysis, developing marketing mix, evaluating the economics.
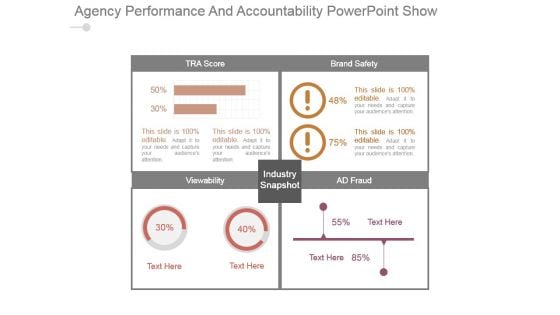
Agency Performance And Accountability Powerpoint Show
This is a agency performance and accountability powerpoint show. This is a four stage process. The stages in this process are tra score, brand safety, view ability, ad fraud, industry snapshot.

Agency Performance Dashboard Sample Of Ppt
This is a agency performance dashboard sample of ppt. This is a four stage process. The stages in this process are tra score, brand safety, view ability, ad fraud, industry snapshot.
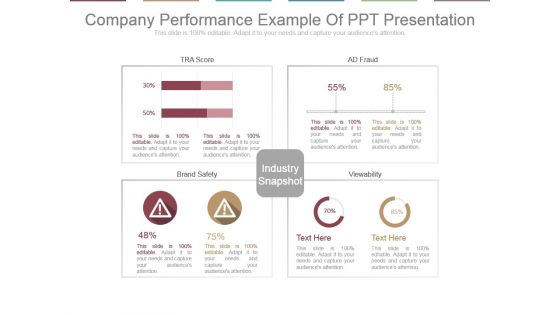
Company Performance Example Of Ppt Presentation
This is a company performance example of ppt presentation. This is a four stage process. The stages in this process are tra score, ad fraud, brand safety, view ability, industry snapshot.
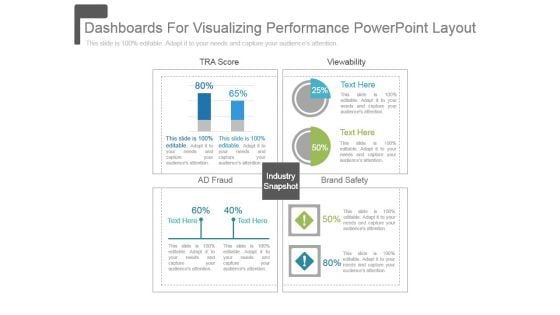
Dashboards For Visualizing Performance Powerpoint Layout
This is a dashboards for visualizing performance powerpoint layout. This is a four stage process. The stages in this process are tra score, view ability, ad fraud, brand safety, industry snapshot.
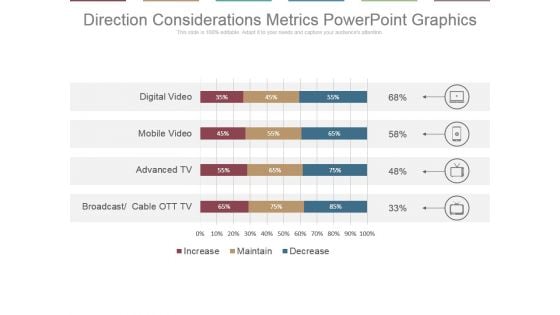
Direction Considerations Metrics Powerpoint Graphics
This is a direction considerations metrics powerpoint graphics. This is a four stage process. The stages in this process are digital video, mobile video, advanced tv, broadcast, cable ott tv.
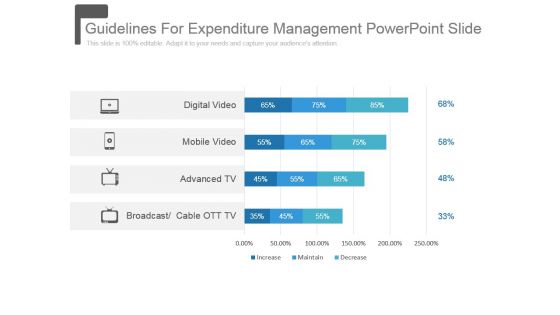
Guidelines For Expenditure Management Powerpoint Slide
This is a guidelines for expenditure management powerpoint slide. This is a four stage process. The stages in this process are digital video, mobile video, advanced tv, broadcast, cable ott tv.
Spending Directions For Media Channels Ppt Icon
This is a spending directions for media channels ppt icon. This is a four stage process. The stages in this process are digital video, mobile video, advanced tv, broadcast, cable ott tv.

Omni Channel Marketing To Reach Customers Powerpoint Slide Information
This is a omni channel marketing to reach customers powerpoint slide information. This is a two stage process. The stages in this process are which marketing channel is growing fastest, influencer engagement use cases.
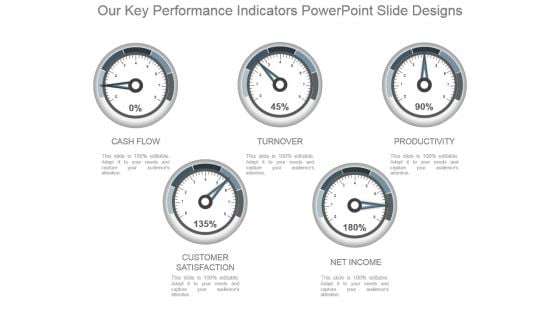
Our Key Performance Indicators Powerpoint Slide Designs
This is a our key performance indicators powerpoint slide designs. This is a five stage process. The stages in this process are cash flow, turnover, productivity, customer satisfaction, net income.
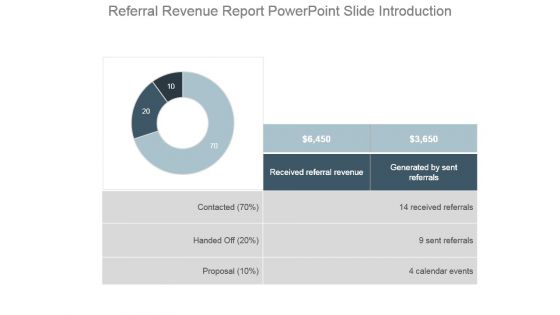
Referral Revenue Report Powerpoint Slide Introduction
This is a referral revenue report powerpoint slide introduction. This is a three stage process. The stages in this process are contacted, handed off, proposal, received referral revenue, generated by sent referrals, received referrals, sent referrals, calendar events.
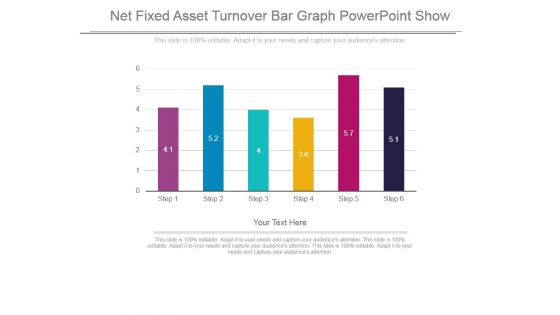
Net Fixed Asset Turnover Bar Graph Powerpoint Show
This is a net fixed asset turnover bar graph powerpoint show. This is a six stage process. The stages in this process are bar graph, presentation, strategy, business, management.
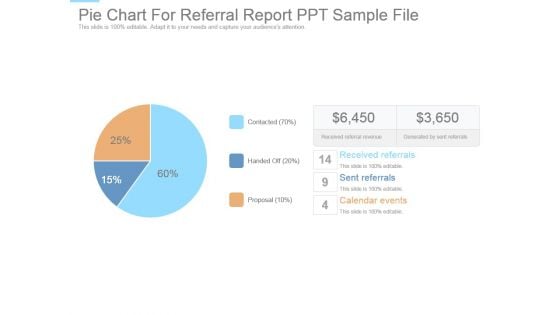
Pie Chart For Referral Report Ppt Sample File
This is a pie chart for referral report ppt sample file. This is a three stage process. The stages in this process are received referrals, sent referrals, calendar events, proposal, handed off, contacted, received referral revenue, generated by sent referrals.
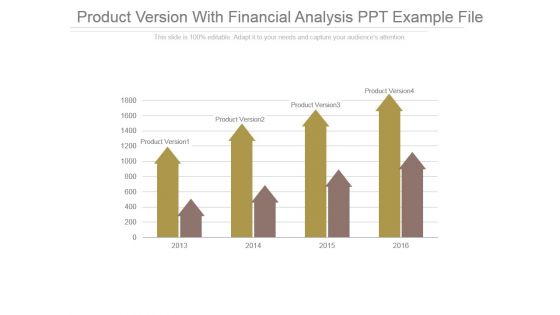
Product Version With Financial Analysis Ppt Example File
This is a product version with financial analysis ppt example file. This is a four stage process. The stages in this process are product version, business, finance, strategy, presentation.

Profit After Tax Pat Growth Chart Powerpoint Slide Designs Download
This is a profit after tax pat growth chart powerpoint slide designs download. This is a five stage process. The stages in this process are growth, success, business, strategy, marketing.
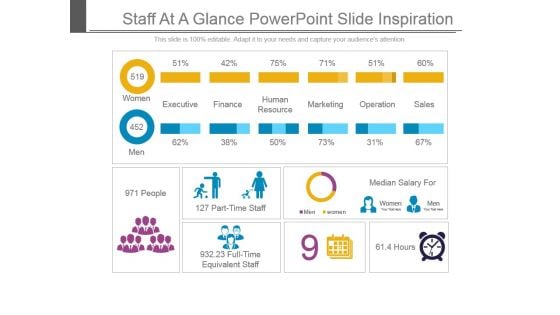
Staff At A Glance Powerpoint Slide Inspiration
This is a staff at a glance powerpoint slide inspiration. This is a six stage process. The stages in this process are executive, finance, human resource, marketing, operations, sales, part time staff, full time equivalent staff.

Stakeholders Fund And Market Analysis Bar Graph Powerpoint Slide Information
This is a stakeholders fund and market analysis bar graph powerpoint slide information. This is a five stage process. The stages in this process are shareholders funds, market capitalization, market capitalization as a percentage of cse market capitalization.
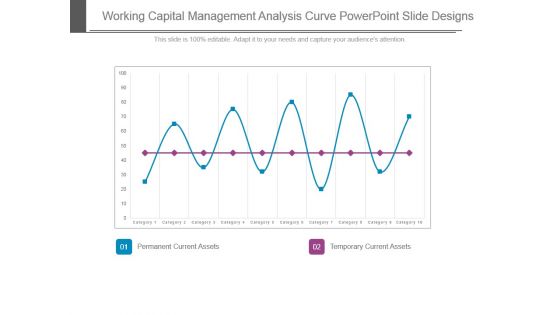
Working Capital Management Analysis Curve Powerpoint Slide Designs
This is a working capital management analysis curve powerpoint slide designs. This is a ten stage process. The stages in this process are permanent current assets, temporary current assets.
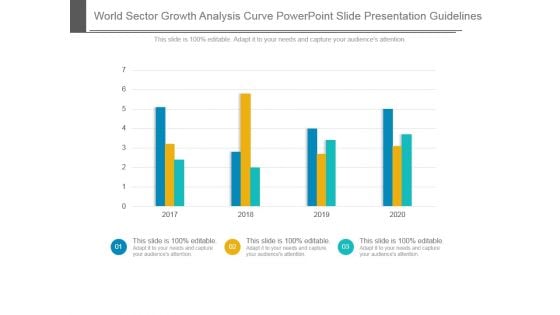
World Sector Growth Analysis Curve Powerpoint Slide Presentation Guidelines
This is a world sector growth analysis curve powerpoint slide presentation guidelines. This is a four stage process. The stages in this process are chart, business, presentation, strategy, presentation.
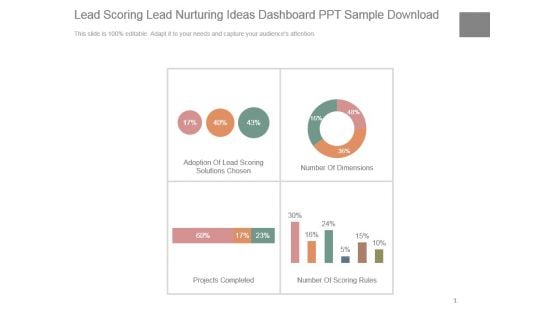
Lead Scoring Lead Nurturing Ideas Dashboard Ppt Sample Download
This is a lead scoring lead nurturing ideas dashboard ppt sample download. This is a four stage process. The stages in this process are adoption of lead scoring solutions chosen, number of dimensions, projects completed, number of scoring rules.
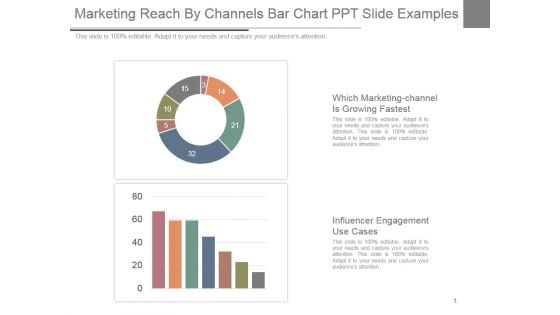
Marketing Reach By Channels Bar Chart Ppt Slide Examples
This is a marketing reach by channels bar chart ppt slide examples. This is a two stage process. The stages in this process are which marketing-channel is growing fastest, influencer engagement use cases.
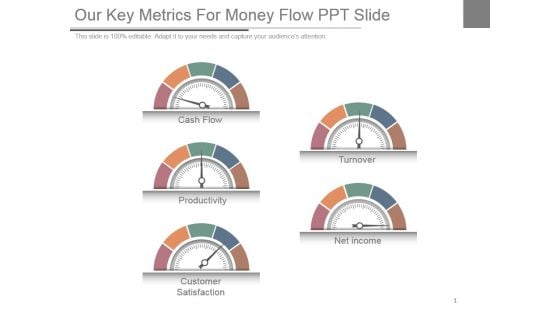
Our Key Metrics For Money Flow Ppt Slide
This is a our key metrics for money flow ppt slide. This is a five stage process. The stages in this process are cash flow, productivity, customer satisfaction, turnover, net income.
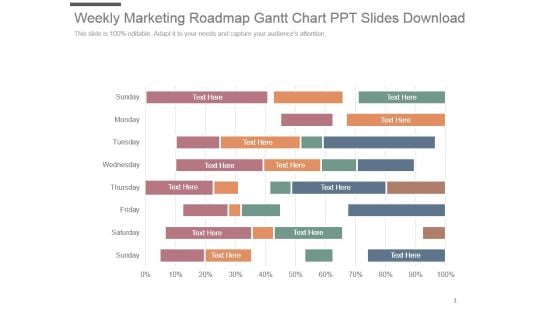
Weekly Marketing Roadmap Gantt Chart Ppt Slides Download
This is a weekly marketing roadmap gantt chart ppt slides download. This is a eight stage process. The stages in this process are sunday, monday, tuesday, wednesday, thursday, friday, saturday, Sunday.


 Continue with Email

 Home
Home


