Outline
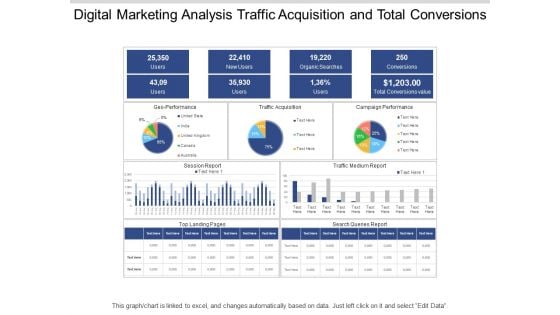
Digital Marketing Analysis Traffic Acquisition And Total Conversions Ppt PowerPoint Presentation Pictures Layouts
This is a digital marketing analysis traffic acquisition and total conversions ppt powerpoint presentation pictures layouts. This is a three stage process. The stages in this process are digital analytics, digital dashboard, marketing.
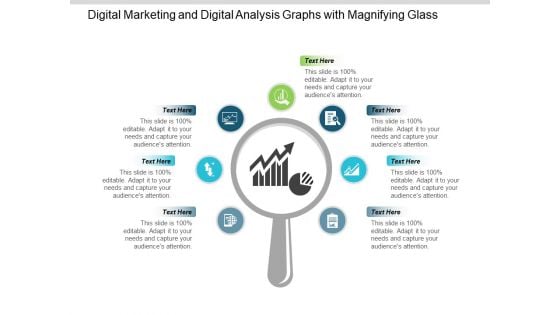
Digital Marketing And Digital Analysis Graphs With Magnifying Glass Ppt PowerPoint Presentation Portfolio Show
This is a digital marketing and digital analysis graphs with magnifying glass ppt powerpoint presentation portfolio show. This is a seven stage process. The stages in this process are digital analytics, digital dashboard, marketing.
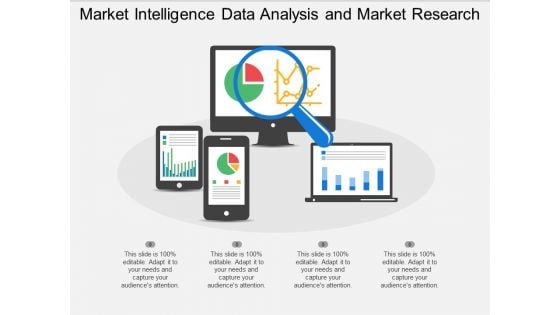
Market Intelligence Data Analysis And Market Research Ppt PowerPoint Presentation Professional Templates
This is a market intelligence data analysis and market research ppt powerpoint presentation professional templates. This is a four stage process. The stages in this process are digital analytics, digital dashboard, marketing.
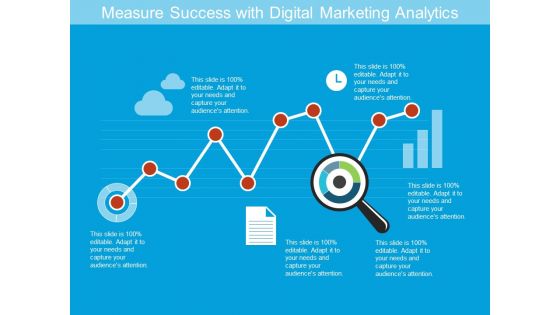
Measure Success With Digital Marketing Analytics Ppt PowerPoint Presentation Gallery Infographics
This is a measure success with digital marketing analytics ppt powerpoint presentation gallery infographics. This is a five stage process. The stages in this process are digital analytics, digital dashboard, marketing.
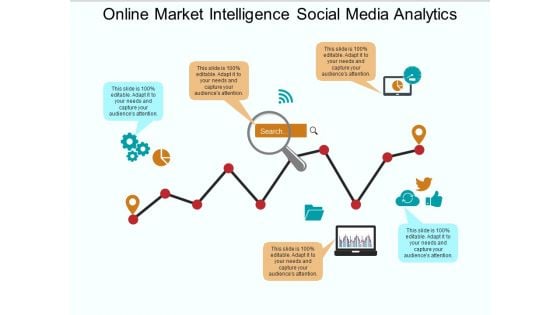
Online Market Intelligence Social Media Analytics Ppt PowerPoint Presentation Infographics Themes
This is a online market intelligence social media analytics ppt powerpoint presentation infographics themes. This is a five stage process. The stages in this process are digital analytics, digital dashboard, marketing.
Web Analytics Charts Visits Bounce Rate Page Views Ppt PowerPoint Presentation Icon Layouts
This is a web analytics charts visits bounce rate page views ppt powerpoint presentation icon layouts. This is a six stage process. The stages in this process are digital analytics, digital dashboard, marketing.
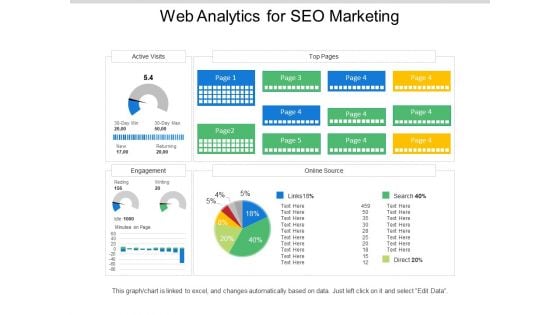
Web Analytics For Seo Marketing Ppt PowerPoint Presentation Examples
This is a web analytics for seo marketing ppt powerpoint presentation examples. This is a five stage process. The stages in this process are digital analytics, digital dashboard, marketing.
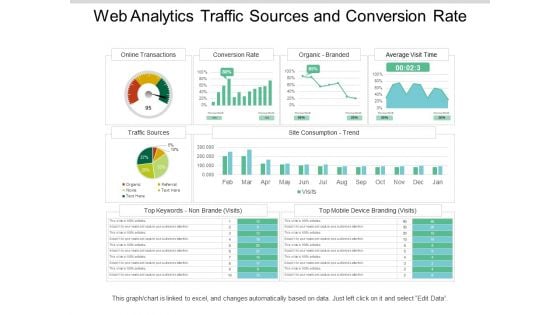
Web Analytics Traffic Sources And Conversion Rate Ppt PowerPoint Presentation Picture
This is a web analytics traffic sources and conversion rate ppt powerpoint presentation picture. This is a four stage process. The stages in this process are digital analytics, digital dashboard, marketing.
Web Marketing Analytics Bounce Rate Goal Conversion Ppt PowerPoint Presentation Inspiration Icon
This is a web marketing analytics bounce rate goal conversion ppt powerpoint presentation inspiration icon. This is a six stage process. The stages in this process are digital analytics, digital dashboard, marketing.
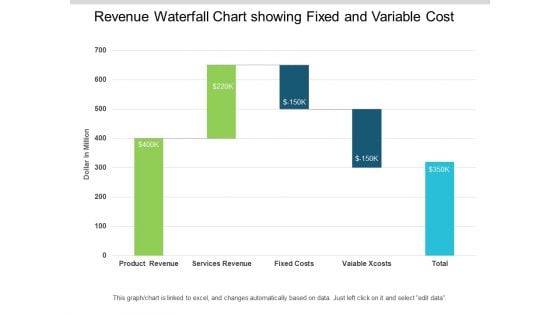
Revenue Waterfall Chart Showing Fixed And Variable Cost Ppt PowerPoint Presentation Infographic Template Images
This is a revenue waterfall chart showing fixed and variable cost ppt powerpoint presentation infographic template images. This is a five stage process. The stages in this process are sales waterfall, waterfall chart, business.
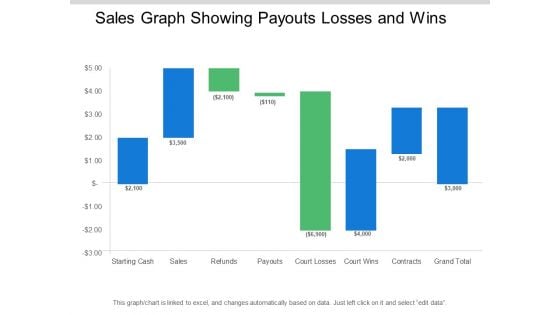
Sales Graph Showing Payouts Losses And Wins Ppt PowerPoint Presentation Pictures Designs Download
This is a sales graph showing payouts losses and wins ppt powerpoint presentation pictures designs download. This is a eight stage process. The stages in this process are sales waterfall, waterfall chart, business.
Waterfall Chart Showing Effective Pricing And Profitability Insight Ppt PowerPoint Presentation Icon Graphics
This is a waterfall chart showing effective pricing and profitability insight ppt powerpoint presentation icon graphics. This is a seven stage process. The stages in this process are sales waterfall, waterfall chart, business.
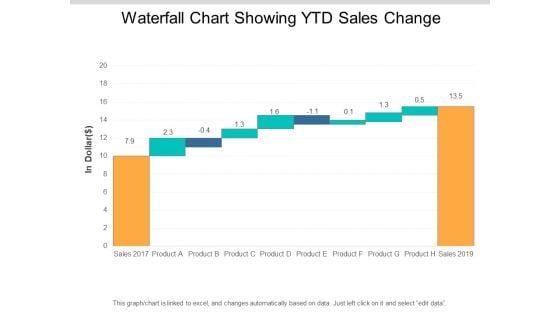
Waterfall Chart Showing Ytd Sales Change Ppt PowerPoint Presentation Professional Format
This is a waterfall chart showing ytd sales change ppt powerpoint presentation professional format. This is a ten stage process. The stages in this process are sales waterfall, waterfall chart, business.
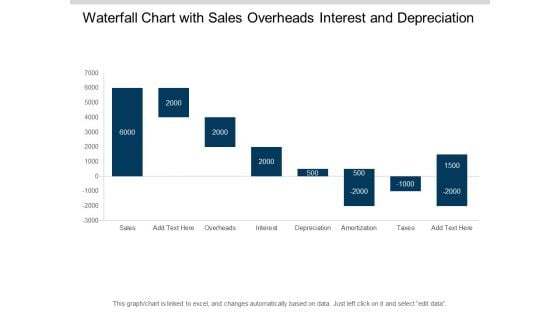
Waterfall Chart With Sales Overheads Interest And Depreciation Ppt PowerPoint Presentation File Display
This is a waterfall chart with sales overheads interest and depreciation ppt powerpoint presentation file display. This is a eight stage process. The stages in this process are sales waterfall, waterfall chart, business.
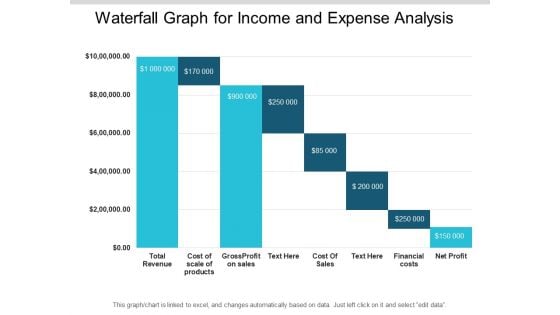
Waterfall Graph For Income And Expense Analysis Ppt PowerPoint Presentation File Deck
This is a waterfall graph for income and expense analysis ppt powerpoint presentation file deck. This is a eight stage process. The stages in this process are sales waterfall, waterfall chart, business.
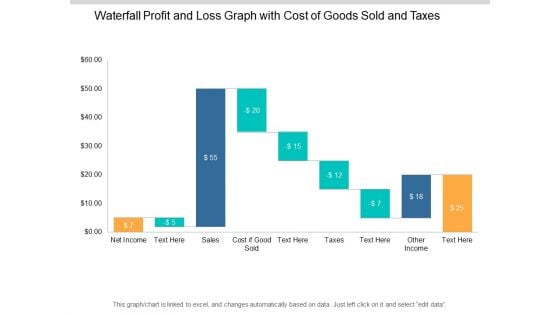
Waterfall Profit And Loss Graph With Cost Of Goods Sold And Taxes Ppt PowerPoint Presentation Show Slideshow
This is a waterfall profit and loss graph with cost of goods sold and taxes ppt powerpoint presentation show slideshow. This is a nine stage process. The stages in this process are sales waterfall, waterfall chart, business.
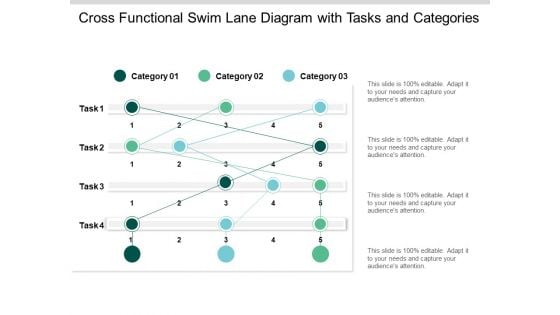
Cross Functional Swim Lane Diagram With Tasks And Categories Ppt PowerPoint Presentation Ideas Grid
This is a cross functional swim lane diagram with tasks and categories ppt powerpoint presentation ideas grid. This is a three stage process. The stages in this process are swim lane diagram, flowchart, management.
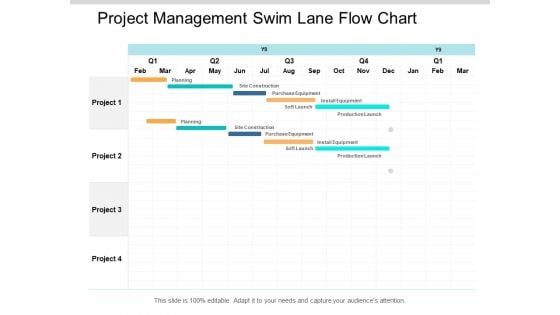
Project Management Swim Lane Flow Chart Ppt PowerPoint Presentation Pictures Brochure
This is a project management swim lane flow chart ppt powerpoint presentation pictures brochure. This is a four stage process. The stages in this process are swim lane diagram, flowchart, management.
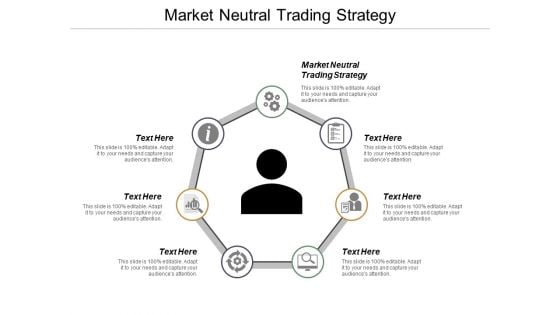
Market Neutral Trading Strategy Ppt PowerPoint Presentation Infographic Template Brochure Cpb
This is a market neutral trading strategy ppt powerpoint presentation infographic template brochure cpb. This is a seven stage process. The stages in this process are market neutral trading strategy.

Project Program Portfolio Management Ppt PowerPoint Presentation Ideas Smartart Cpb
This is a project program portfolio management ppt powerpoint presentation ideas smartart cpb. This is a three stage process. The stages in this process are project program portfolio management.
Promotion Effectiveness Modeling Ppt PowerPoint Presentation Infographic Template Layout Ideas Cpb
This is a promotion effectiveness modeling ppt powerpoint presentation infographic template layout ideas cpb. This is a two stage process. The stages in this process are promotion effectiveness modeling.
Small Business Loan Ppt PowerPoint Presentation Infographic Template Design Inspiration Cpb
This is a small business loan ppt powerpoint presentation infographic template design inspiration cpb. This is a three stage process. The stages in this process are small business loan.

Strategies Effective Consumer Relations Ppt PowerPoint Presentation Pictures Designs Cpb
This is a strategies effective consumer relations ppt powerpoint presentation pictures designs cpb. This is a four stage process. The stages in this process are strategies effective consumer relations.
Supply Chain Logistics Strategy Ppt PowerPoint Presentation Slides Clipart Cpb
This is a supply chain logistics strategy ppt powerpoint presentation slides clipart cpb. This is a four stage process. The stages in this process are supply chain logistics strategy.
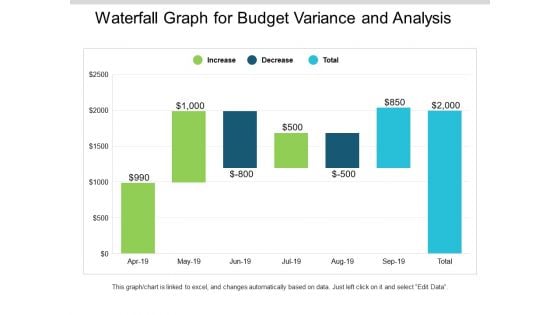
Waterfall Graph For Budget Variance And Analysis Ppt PowerPoint Presentation Slides Mockup
This is a waterfall graph for budget variance and analysis ppt powerpoint presentation slides mockup. This is a three stage process. The stages in this process are profit and loss, balance sheet, income statement, benefit and loss.
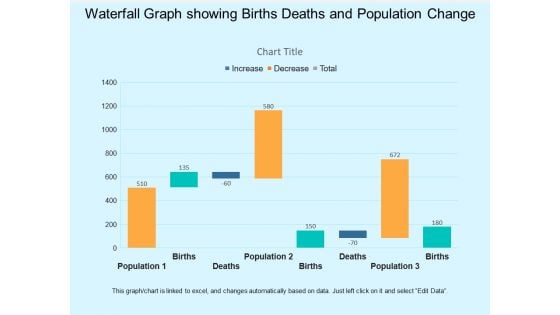
Waterfall Graph Showing Births Deaths And Population Change Ppt PowerPoint Presentation Infographic Template Visual Aids
This is a waterfall graph showing births deaths and population change ppt powerpoint presentation infographic template visual aids. This is a three stage process. The stages in this process are profit and loss, balance sheet, income statement, benefit and loss.
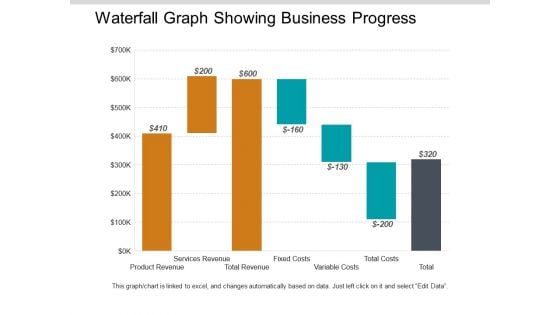
Waterfall Graph Showing Business Progress Ppt PowerPoint Presentation Styles Model
This is a waterfall graph showing business progress ppt powerpoint presentation styles model. This is a three stage process. The stages in this process are profit and loss, balance sheet, income statement, benefit and loss.
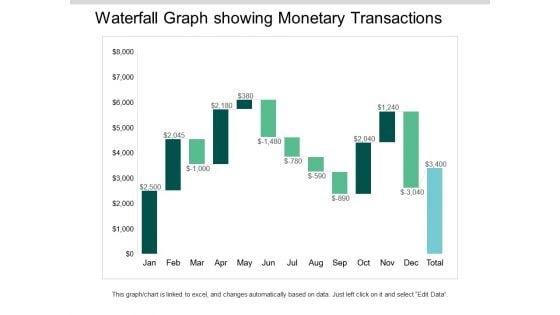
Waterfall Graph Showing Monetary Transactions Ppt PowerPoint Presentation Ideas Visuals
This is a waterfall graph showing monetary transactions ppt powerpoint presentation ideas visuals. This is a three stage process. The stages in this process are profit and loss, balance sheet, income statement, benefit and loss.
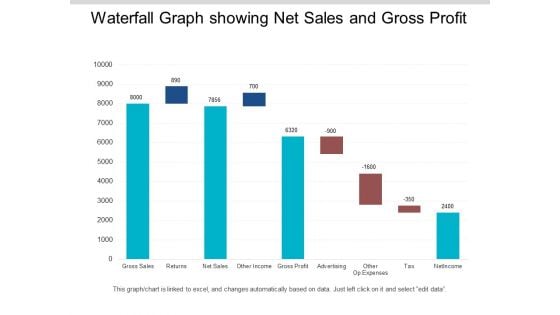
Waterfall Graph Showing Net Sales And Gross Profit Ppt PowerPoint Presentation Infographics Format
This is a waterfall graph showing net sales and gross profit ppt powerpoint presentation infographics format. This is a three stage process. The stages in this process are profit and loss, balance sheet, income statement, benefit and loss.
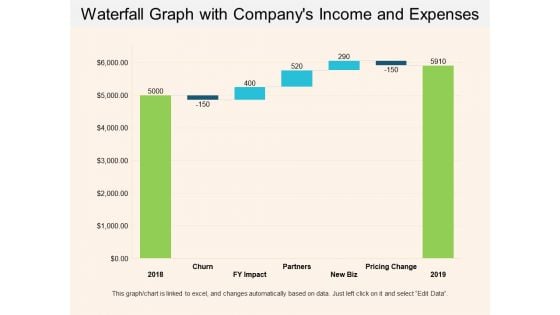
Waterfall Graph With Companys Income And Expenses Ppt PowerPoint Presentation Show Example Introduction
This is a waterfall graph with companys income and expenses ppt powerpoint presentation show example introduction. This is a three stage process. The stages in this process are profit and loss, balance sheet, income statement, benefit and loss.
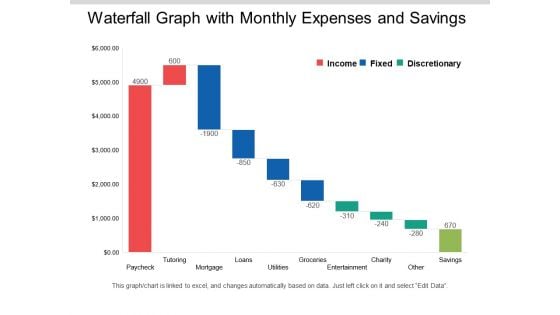
Waterfall Graph With Monthly Expenses And Savings Ppt PowerPoint Presentation Layouts Clipart Images
This is a waterfall graph with monthly expenses and savings ppt powerpoint presentation layouts clipart images. This is a three stage process. The stages in this process are profit and loss, balance sheet, income statement, benefit and loss.

Agile Marketing Value Proposition Ppt PowerPoint Presentation Infographic Template Information
This is a agile marketing value proposition ppt powerpoint presentation infographic template information. This is a four stage process. The stages in this process are visibility, adaptability, business value, risk, traditional development.

Area Chart Finance Ppt PowerPoint Presentation Professional File Formats
This is a area chart finance ppt powerpoint presentation professional file formats . This is a three stage process. The stages in this process are area chart, finance, marketing, management, investment.
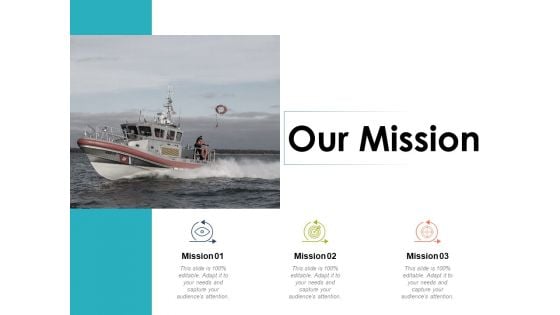
Our Mission Vision Goal Ppt PowerPoint Presentation Model Ideas
This is a our mission vision goal ppt powerpoint presentation model ideas. This is a three stage process. The stages in this process are our mission, vision, goal, marketing, strategy.
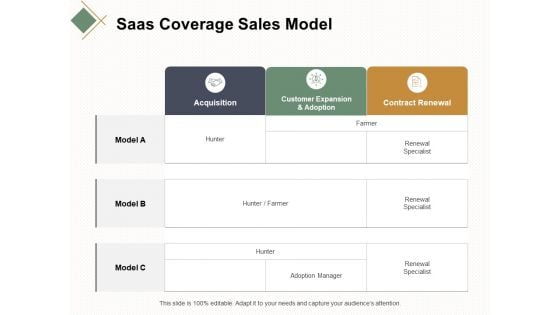
Saas Coverage Sales Model Ppt Powerpoint Presentation Infographic Template Graphics Template
This is a saas coverage sales model ppt powerpoint presentation infographic template graphics template. This is a three stage process. The stages in this process are contract renewal, customer expansion, business, marketing.
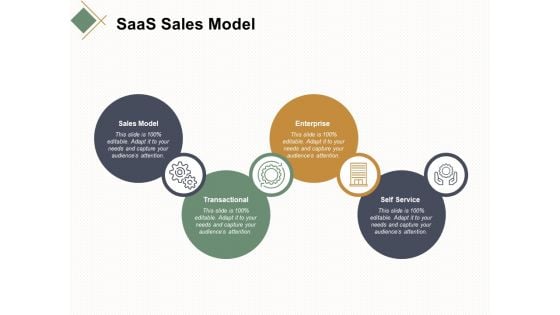
Saas Sales Model Transactional Ppt Powerpoint Presentation Show Model
This is a saas sales model transactional ppt powerpoint presentation show model. This is a four stage process. The stages in this process are sales model, transactional, enterprise, business, management.
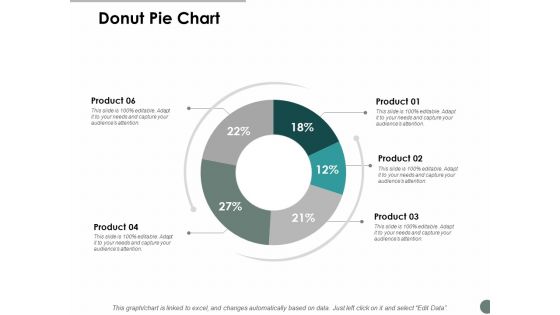
Donut Pie Chart Marketing Ppt Powerpoint Presentation Infographic Template Graphics Template
This is a donut pie chart marketing ppt powerpoint presentation infographic template graphics template. This is a six stage process. The stages in this process are finance, marketing, management, investment, analysis.

Loyalty Program Performance Dashboard Ppt Powerpoint Presentation Professional Templates
This is a loyalty program performance dashboard ppt powerpoint presentation professional templates. This is a six stage process. The stages in this process are finance, marketing, management, investment, analysis.
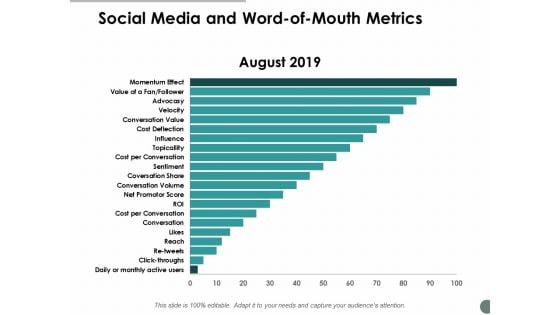
Social Media And Word Of Mouth Metrics Ppt Powerpoint Presentation Show Example Introduction
This is a social media and word of mouth metrics ppt powerpoint presentation show example introduction. This is a two stage process. The stages in this process are finance, marketing, management, investment, analysis.

About Us Value Client Ppt PowerPoint Presentation Infographic Template Backgrounds
This is a about us value client ppt powerpoint presentation infographic template backgrounds. This is a three stage process. The stages in this process are about us, target audiences, preferred by many, values client, strategy.
Business Performance Report Template Ppt PowerPoint Presentation Layouts Influencers Cpb
This is a business performance report template ppt powerpoint presentation layouts influencers cpb. This is a three stage process. The stages in this process are business performance report template.
Business Performance Reports Ppt PowerPoint Presentation Infographic Template File Formats Cpb
This is a business performance reports ppt powerpoint presentation infographic template file formats cpb. This is a five stage process. The stages in this process are business performance reports.
Business Value Data Visualization Ppt PowerPoint Presentation Infographic Template Background Images Cpb
This is a business value data visualization ppt powerpoint presentation infographic template background images cpb. This is a three stage process. The stages in this process are business value data visualization.
Employee Financial Education Ppt PowerPoint Presentation Infographic Template Format Ideas Cpb
This is a employee financial education ppt powerpoint presentation infographic template format ideas cpb. This is a five stage process. The stages in this process are employee financial education.
Key Performance Indicators Employees Ppt PowerPoint Presentation Icon Samples Cpb
This is a key performance indicators employees ppt powerpoint presentation icon samples cpb. This is a two stage process. The stages in this process are key performance indicators employees.
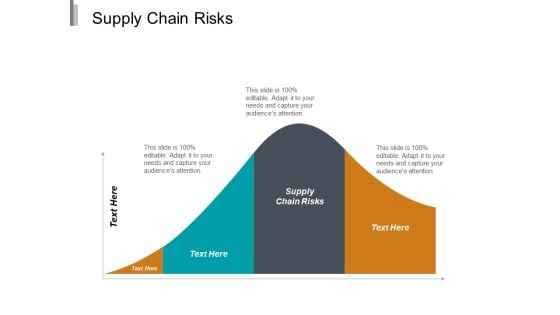
Supply Chain Risks Ppt PowerPoint Presentation Infographic Template File Formats Cpb
This is a supply chain risks ppt powerpoint presentation infographic template file formats cpb. This is a four stage process. The stages in this process are supply chain risks.
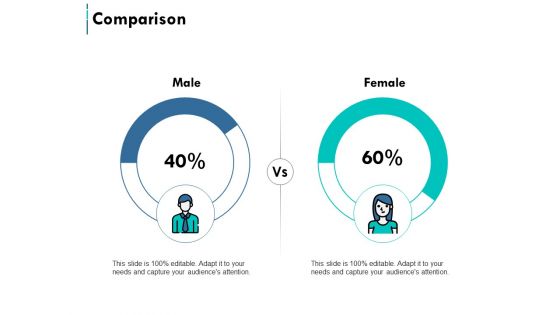
Comparison Male And Female Ppt PowerPoint Presentation Styles Infographic Template
This is a comparison male and female ppt powerpoint presentation styles infographic template. This is a two stage process. The stages in this process are business, management, marketing, comparison.
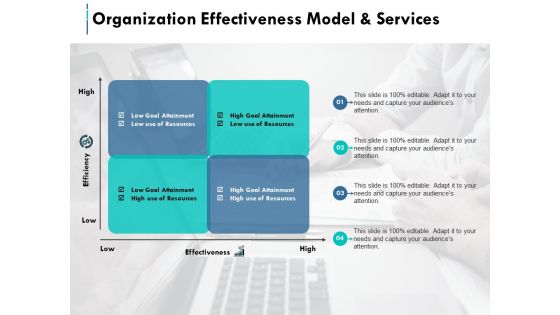
Organization Effectiveness Model And Services Slide Ppt PowerPoint Presentation Styles Good
This is a organization effectiveness model and services slide ppt powerpoint presentation styles good. This is a four stage process. The stages in this process are business, management, marketing.
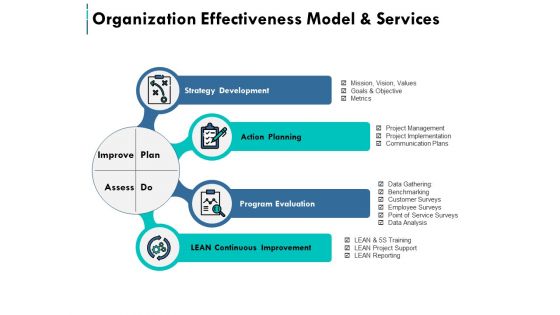
Organization Effectiveness Model And Services Ppt PowerPoint Presentation Show Graphics Example
This is a organization effectiveness model and services ppt powerpoint presentation show graphics example. This is a four stage process. The stages in this process are business, management, marketing.
Thank You Organizational Efficacy Ppt PowerPoint Presentation Portfolio Graphics Design
This is a thank you organizational efficacy ppt powerpoint presentation portfolio graphics design. This is a one stage process. The stages in this process are thank you, word, greeting.
Vision Our Mission Ppt PowerPoint Presentation Icon Outfit
This is a vision our mission ppt powerpoint presentation icon outfit. This is a two stage process. The stages in this process are our mission, vision, goal, marketing, strategy.
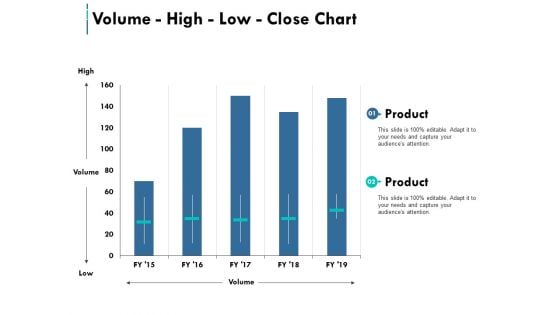
Volume High Low Close Chart Ppt PowerPoint Presentation Pictures Graphics Example
This is a volume high low close chart ppt powerpoint presentation pictures graphics example. This is a two stage process. The stages in this process are marketing, business, management.

Organizational Potency Ppt PowerPoint Presentation Complete Deck With Slides
This is a organizational potency ppt powerpoint presentation complete deck with slides. This is a one stage process. The stages in this process are organizational potency, marketing, business, management, strategy.
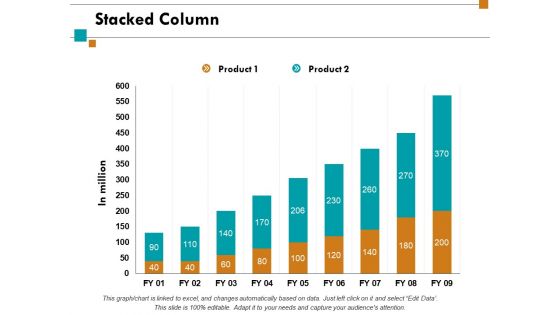
Stacked Column Investment Ppt Powerpoint Presentation Styles Graphics Example
This is a stacked column investment ppt powerpoint presentation styles graphics example. This is a two stage process. The stages in this process are financial, minimum, maximum, marketing, strategy.
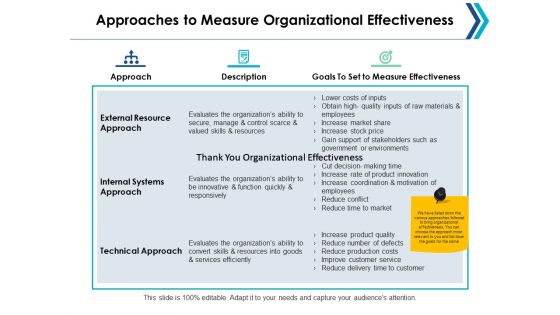
Approaches To Measure Organizational Effectiveness Ppt Powerpoint Presentation Model Show
This is a approaches to measure organizational effectiveness ppt powerpoint presentation model show. This is a three stage process. The stages in this process are comparison, male, female, marketing, strategy.
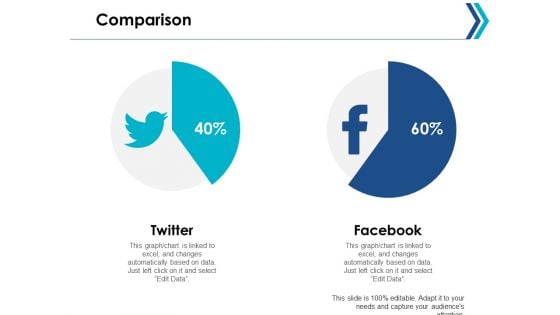
Comparison Marketing Strategy Ppt Powerpoint Presentation Infographic Template Design Ideas
This is a comparison marketing strategy ppt powerpoint presentation infographic template design ideas. This is a two stage process. The stages in this process are comparison, male, female, marketing, strategy.
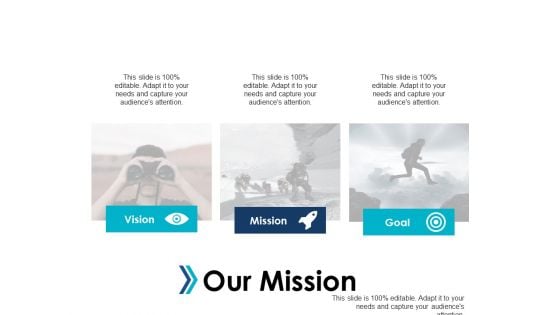
Our Mission Vision Goal Strategy Ppt Powerpoint Presentation Professional
This is a our mission vision goal strategy ppt powerpoint presentation professional. This is a three stage process. The stages in this process are vision, goal, marketing, strategy, mission.
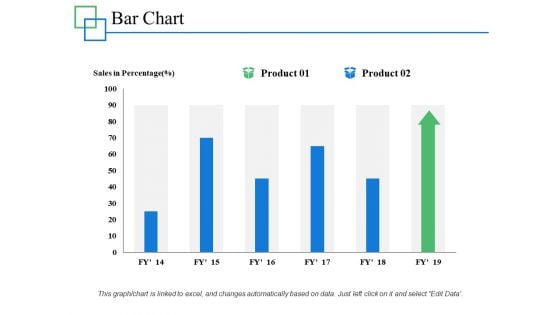
Bar Chart Percentage Product Ppt PowerPoint Presentation Layouts Designs Download
This is a bar chart percentage product ppt powerpoint presentation layouts designs download. This is a two stage process. The stages in this process are percentage, product, business, management.
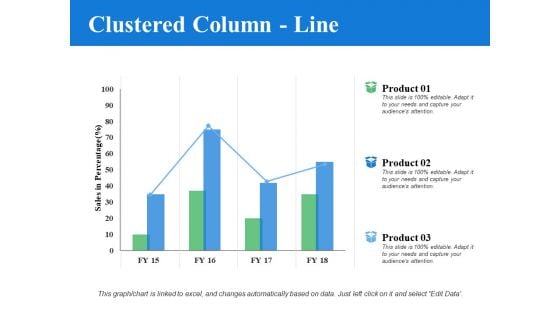
Clustered Column Line Analysis Ppt PowerPoint Presentation Layouts Visual Aids
This is a clustered column line analysis ppt powerpoint presentation layouts visual aids. This is a three stage process. The stages in this process are percentage, product, business, management.
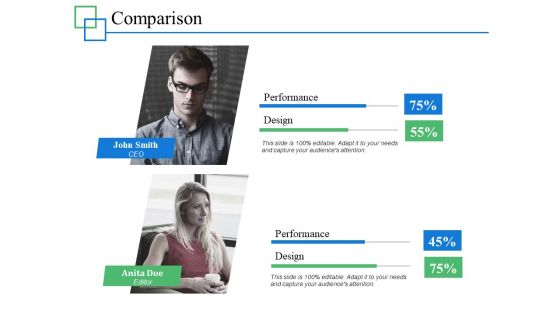
Comparison Male And Female Ppt PowerPoint Presentation Gallery Skills
This is a comparison male and female ppt powerpoint presentation gallery skills. This is a two stage process. The stages in this process are comparison, male, female, marketing, strategy.


 Continue with Email

 Home
Home


