Percentage Comparison
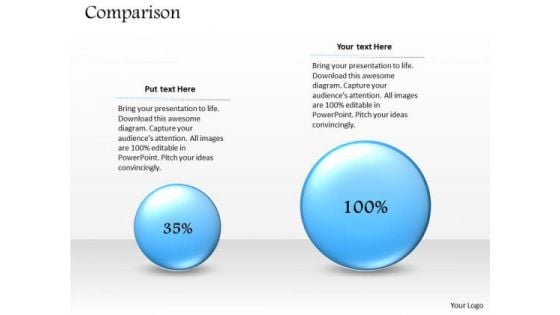
Strategic Management Percentage Comparison Business Layout Business Diagram
Knock On The Door To Success With Our Strategic Management Percentage Comparison Business Layout Business Diagram Powerpoint Templates. Be Assured Of Gaining Entry.
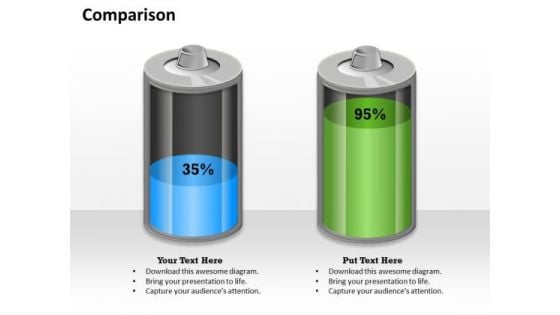
Business Cycle Diagram Percentage Comparison Business Design Strategy Diagram
Get Out Of The Dock With Our Business Cycle Diagram Percentage Comparison Business Design Strategy Diagram Powerpoint Templates. Your Mind Will Be Set Free.

Four Vertical Columns For Percentage Comparison Ppt PowerPoint Presentation Introduction
This is a four vertical columns for percentage comparison ppt powerpoint presentation introduction. This is a four stage process. The stages in this process are business, marketing, success, management, presentation.
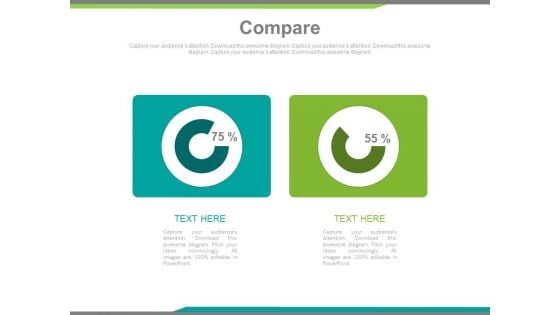
Two Percentage Values Comparison Charts Powerpoint Slides
This PowerPoint template has been designed with two percentage values You may download this PPT slide to use as comparison chart. Add this slide to your presentation and impress your superiors.
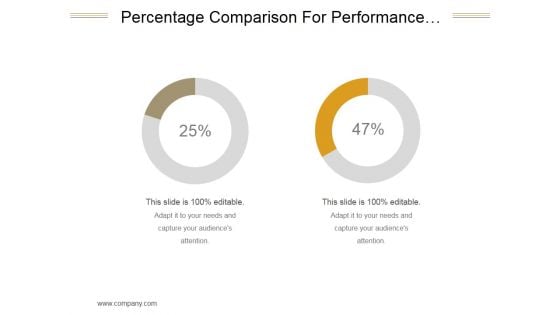
Percentage Comparison For Performance Evaluation With Circles Ppt PowerPoint Presentation Topics
This is a percentage comparison for performance evaluation with circles ppt powerpoint presentation topics. This is a two nstage process. The stages in this process are percentage, comparisons, performance, business, management.
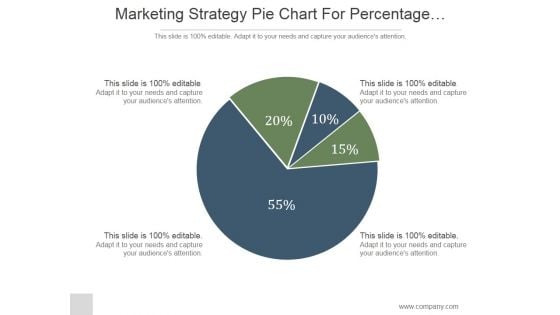
Marketing Strategy Pie Chart For Percentage Comparison Ppt PowerPoint Presentation Ideas
This is a marketing strategy pie chart for percentage comparison ppt powerpoint presentation ideas. This is a four stage process. The stages in this process are marketing, pie, strategy, finance, percentage.
Automobile Sales Scorecard Yoy Percentage Comparison For Auto Sales Icons PDF
This graph or chart is linked to excel, and changes automatically based on data. Just left click on it and select Edit Data.Deliver and pitch your topic in the best possible manner with this Automobile Sales Scorecard Yoy Percentage Comparison For Auto Sales Icons PDF. Use them to share invaluable insights on Electric Vehicle Full, Hybrid Electric Vehicle, Ybrid Electric Vehicle, 2020 TO 2021 and impress your audience. This template can be altered and modified as per your expectations. So, grab it now.
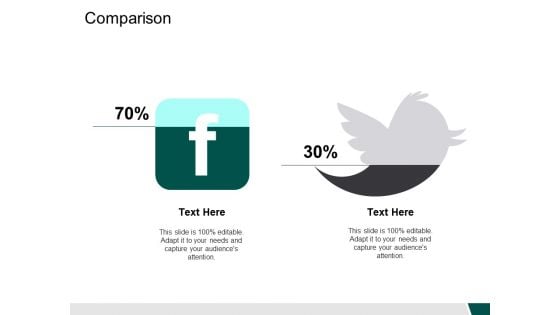
Comparison Percentage Ppt PowerPoint Presentation Outline Layout
This is a comparison percentage ppt powerpoint presentation outline layout. This is a two stage process. The stages in this process are comparison, management, strategy, analysis, marketing.
Comparison Percentage Ppt PowerPoint Presentation Model Icon
Presenting this set of slides with name comparison percentage ppt powerpoint presentation model icon. This is a two stage process. The stages in this process are comparison, male, female, marketing, strategy. This is a completely editable PowerPoint presentation and is available for immediate download. Download now and impress your audience.
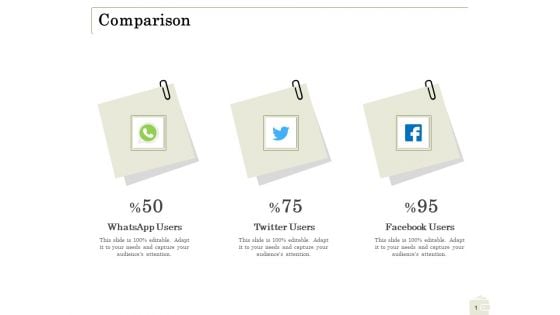
Percentage Share Customer Expenditure Comparison Background PDF
Presenting this set of slides with name percentage share customer expenditure comparison background pdf. This is a three stage process. The stages in this process are whatsapp users, twitter users, facebook users. This is a completely editable PowerPoint presentation and is available for immediate download. Download now and impress your audience.
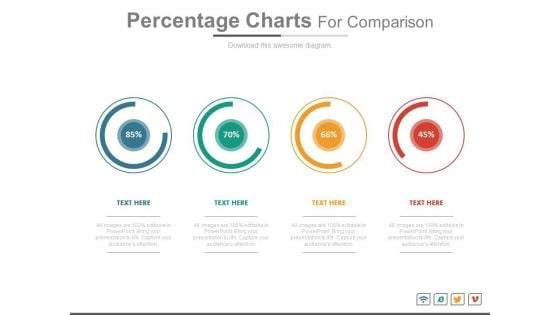
Percentage Charts For Statistical Comparison Powerpoint Slides
This PowerPoint template has been chart of percentage values. You may download this diagram for statistical comparison and analysis. Add this PPT slide to your presentation and impress your superiors.
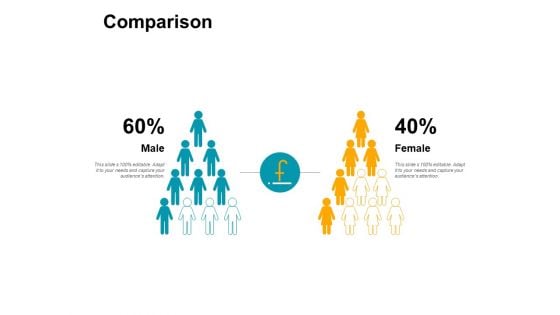
Comparison Percentages Ppt PowerPoint Presentation Show Good
Presenting this set of slides with name comparison percentages ppt powerpoint presentation show good. This is a two stage process. The stages in this process are comparison, male, female, marketing, strategy . This is a completely editable PowerPoint presentation and is available for immediate download. Download now and impress your audience.
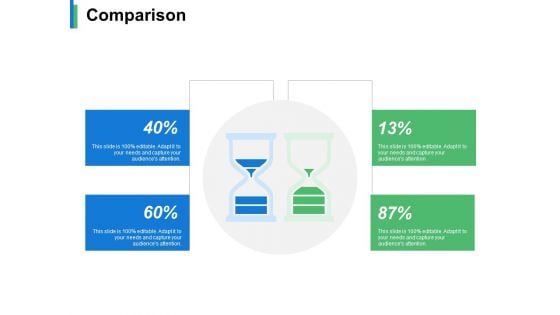
Comparison Percentage Ppt PowerPoint Presentation Infographic Template Slides
This is a comparison percentage ppt powerpoint presentation infographic template slides. This is a two stage process. The stages in this process are business, management, comparison, strategy, analysis.
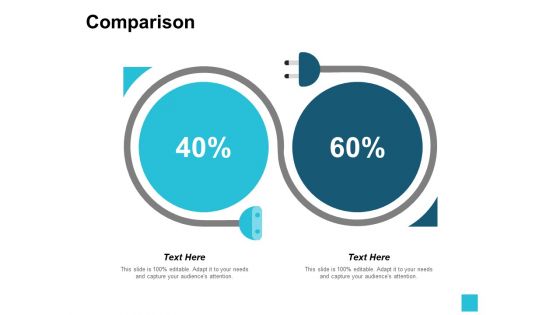
Comparison Percentage Ppt PowerPoint Presentation Ideas Example Introduction
This is a comparison percentage ppt powerpoint presentation ideas example introduction. This is a two stage process. The stages in this process are compare, business, management, strategy, analysis.
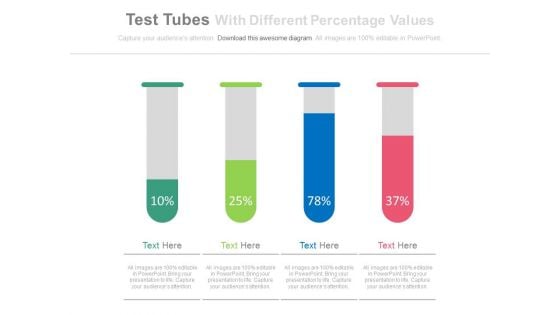
Test Tubes With Percentage Data For Comparison Powerpoint Slides
This PowerPoint template has been designed with test tubes and percentage data. You may download this PPT slide to display data comparison and analysis. Add this slide to your presentation and impress your superiors.
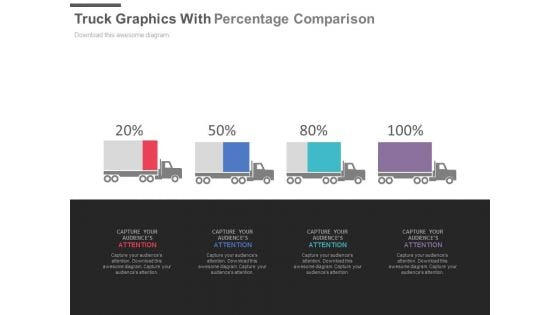
Four Trucks With Percentage Values For Comparison Powerpoint Slides
This PPT slide displays graphics of four trucks with percentage values. Use this PPT design to display logistics compare chart. This PowerPoint template can be customized as per requirements of business presentation.
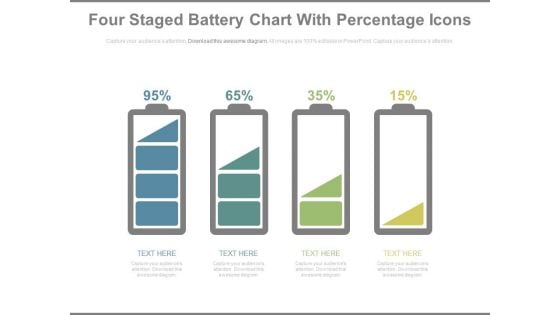
Battery Chart With Percentage Values For Comparison PowerPoint Slides
This year?s sales has matched up with your expectations. Now match this slide with your presentation to show the same. Show your company?s performance or business growth with this four staged battery chart PowerPoint template. With this slide, you can easily convince your colleagues how your company gave a tremendous growth over the years or months. Perfect illustration to show that the targets are achieved. This PPT template is easy to edit. You can choose the color of your choice. Your colleagues are already impressed with the sales growth. Now impress others and choose this PPT innovative designed template.
Percentage Value Comparison Pie Chart Icon Ppt PowerPoint Presentation Model Clipart Images
This is a percentage value comparison pie chart icon ppt powerpoint presentation model clipart images. This is a three stage process. The stages in this process are percentage icon, dividend icon, portion icon.
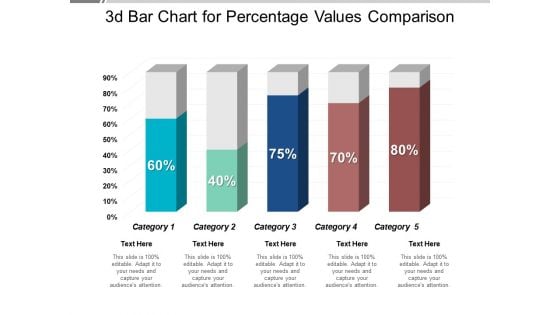
3D Bar Chart For Percentage Values Comparison Ppt PowerPoint Presentation Professional Visual Aids
This is a 3d bar chart for percentage values comparison ppt powerpoint presentation professional visual aids. This is a five stage process. The stages in this process are art, colouring, paint brush.
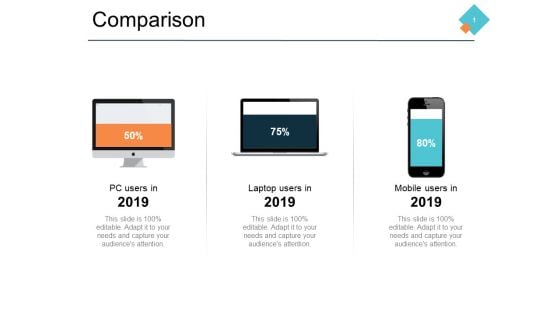
Comparison Business Percentage Ppt PowerPoint Presentation Infographic Template Elements
This is a comparison business percentage ppt powerpoint presentation infographic template elements. This is a three stage process. The stages in this process are compare, management, strategy, analysis, marketing.

Website Data Yearly Comparison With Percentage Change Formats PDF
This slide showcases yearly comparison table that can help organization to identify the change in current year website statistics as compared to previous year. Its key metrics are total traffic, conversion rate, pages or session, pageviews and bounce rate. Pitch your topic with ease and precision using this Website Data Yearly Comparison With Percentage Change Formats PDF. This layout presents information on Website Data Yearly Comparison With Percentage Change. It is also available for immediate download and adjustment. So, changes can be made in the color, design, graphics or any other component to create a unique layout.

Comparison Percentages Ppt PowerPoint Presentation Styles Clipart Images
Presenting this set of slides with name comparison percentages ppt powerpoint presentation styles clipart images. This is a three stage process. The stages in this process are compare, marketing, business, management, planning. This is a completely editable PowerPoint presentation and is available for immediate download. Download now and impress your audience.
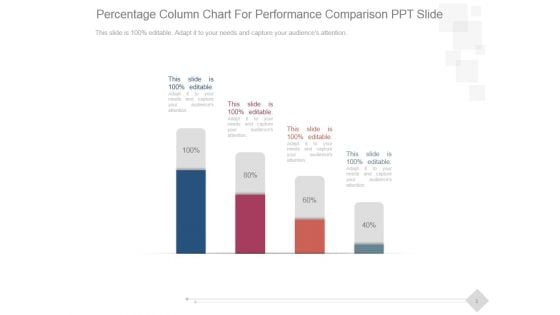
Percentage Column Chart For Performance Comparison Ppt PowerPoint Presentation Good
This is a percentage column chart for performance comparison ppt powerpoint presentation good. This is a four stage process. The stages in this process are business, marketing, technology, presentation, management.
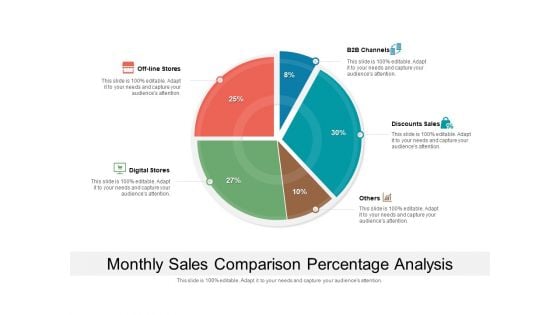
Monthly Sales Comparison Percentage Analysis Ppt PowerPoint Presentation File Infographic Template PDF
Pitch your topic with ease and precision using this monthly sales comparison percentage analysis ppt powerpoint presentation file infographic template pdf. This layout presents information on monthly sales comparison percentage analysis. It is also available for immediate download and adjustment. So, changes can be made in the color, design, graphics or any other component to create a unique layout.
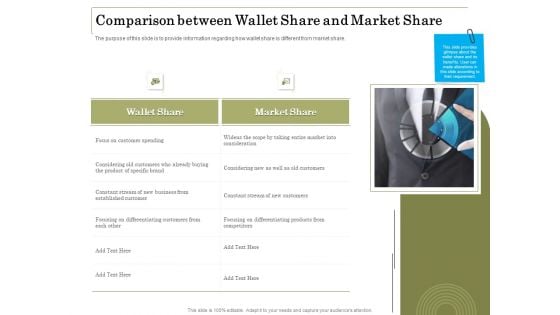
Percentage Share Customer Expenditure Comparison Between Wallet Share And Market Share Information PDF
Presenting this set of slides with name percentage share customer expenditure comparison between wallet share and market share information pdf. This is a two stage process. The stages in this process are wallet share, market share. This is a completely editable PowerPoint presentation and is available for immediate download. Download now and impress your audience.
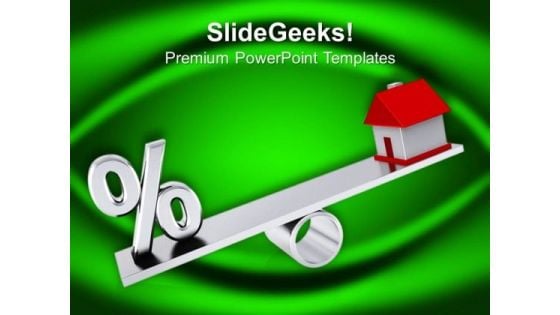
Comparison Between Percentage And Real Estate PowerPoint Templates Ppt Backgrounds For Slides 0213
We present our Comparison Between Percentage And Real Estate PowerPoint Templates PPT Backgrounds For Slides 0213.Download our Real estate PowerPoint Templates because Your ideas provide food for thought. Our PowerPoint Templates and Slides will help you create a dish to tickle the most discerning palate. Download our Finance PowerPoint Templates because Our PowerPoint Templates and Slides help you meet the demand of the Market. Just browse and pick the slides that appeal to your intuitive senses. Download and present our Business PowerPoint Templates because Our PowerPoint Templates and Slides will let you Clearly mark the path for others to follow. Download and present our Success PowerPoint Templates because It will Give impetus to the hopes of your colleagues. Our PowerPoint Templates and Slides will aid you in winning their trust. Download and present our Shapes PowerPoint Templates because Our PowerPoint Templates and Slides will weave a web of your great ideas. They are gauranteed to attract even the most critical of your colleagues.Use these PowerPoint slides for presentations relating to Real estate concept house shaped with percent symbol, real estate, finance, business, success, shapes. The prominent colors used in the PowerPoint template are Red, White, Green. Go on the lookout for something new. Explore away with our Comparison Between Percentage And Real Estate PowerPoint Templates Ppt Backgrounds For Slides 0213.
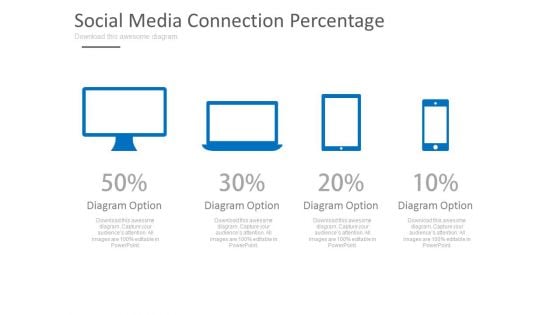
Computer Devices With Percentage Values Powerpoint Slides
This PPT slide displays graphics of computer, laptop, tablet and mobile. Use this PPT design to display comparison of computer devices. This PowerPoint template can be customized as per requirements of business education or any other theme.

65 Percentage Ppt PowerPoint Presentation Styles Designs
This is a 65 percentage ppt powerpoint presentation styles designs. This is a two stage process. The stages in this process are compare, business, analysis, strategy, marketing.
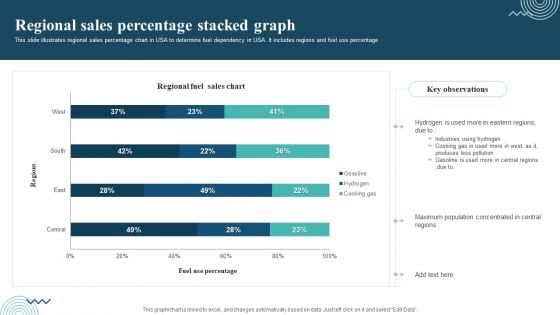
Regional Sales Percentage Stacked Graph Themes PDF
This slide illustrates regional sales percentage chart in USA to determine fuel dependency in USA. It includes regions and fuel use percentage. Pitch your topic with ease and precision using this Regional Sales Percentage Stacked Graph Themes PDF. This layout presents information on Regional Sales, Industries Using Hydrogen, Cooking Gas. It is also available for immediate download and adjustment. So, changes can be made in the color, design, graphics or any other component to create a unique layout.
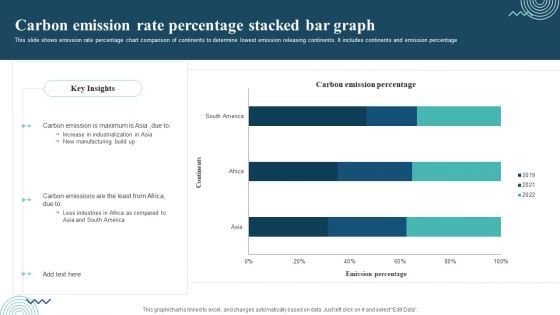
Carbon Emission Rate Percentage Stacked Bar Graph Rules PDF
This slide shows emission rate percentage chart comparison of continents to determine lowest emission releasing continents. It includes continents and emission percentage Showcasing this set of slides titled Carbon Emission Rate Percentage Stacked Bar Graph Rules PDF. The topics addressed in these templates are Carbon Emission, Increase In Industrialization, New Manufacturing. All the content presented in this PPT design is completely editable. Download it and make adjustments in color, background, font etc. as per your unique business setting.
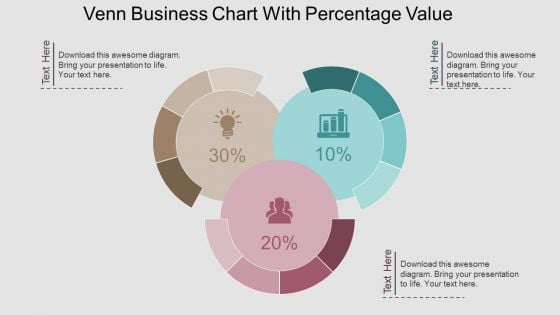
Venn Business Chart With Percentage Value Powerpoint Template
This PPT slide contains Venn business chart with percentage values. This PPT diagram is suitable to present data comparison and analysis. Enlighten others on the process with this innovative PowerPoint template.
Three Text Boxes With Percentage Values And Icons Powerpoint Slides
This PowerPoint template has been designed with text boxes and percentage data. You may download this PPT slide to display data comparison and analysis. Add this slide to your presentation and impress your superiors.
Online Shopping Survey Outcome In Percentage Icons PDF
The slide showcases percentage results to analyze experience of online shopping to identify areas for enhancing shopping experience. It includes key elements such as reasons for online shopping, elements considered by customers and shopping platforms. Pitch your topic with ease and precision using this Online Shopping Survey Outcome In Percentage Icons PDF. This layout presents information on Price Comparison, Product Information, Online Reviews. It is also available for immediate download and adjustment. So, changes can be made in the color, design, graphics or any other component to create a unique layout.
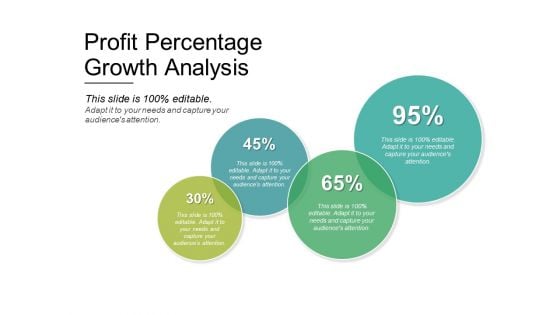
Profit Percentage Growth Analysis Ppt PowerPoint Presentation Layouts Graphics Tutorials
This is a profit percentage growth analysis ppt powerpoint presentation layouts graphics tutorials. This is a four stage process. The stages in this process are comparison chart, comparison table, comparison matrix.
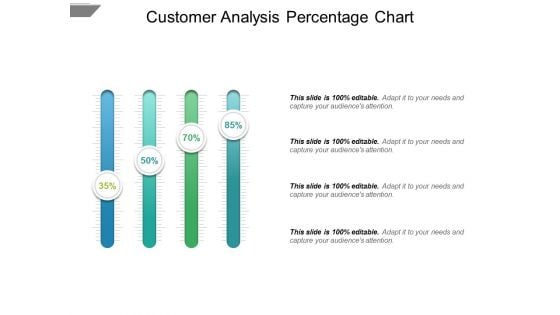
Customer Analysis Percentage Chart Ppt PowerPoint Presentation Infographics Master Slide
This is a customer analysis percentage chart ppt powerpoint presentation infographics master slide. This is a four stage process. The stages in this process are comparison chart, comparison table, comparison matrix.
Business Ownership Structure With Their Percentage Icon Ppt Outline PDF
The slide provides the comparison of revenue and operating expenses for the year 2015 to 2020 historical and 2021 to 2024 forecasted. Deliver an awe inspiring pitch with this creative business ownership structure with their percentage icon ppt outline pdf bundle. Topics like business ownership structure with their percentage can be discussed with this completely editable template. It is available for immediate download depending on the needs and requirements of the user.
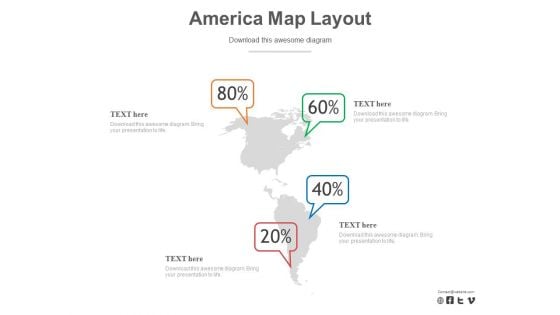
Map Of America With Percentage Data PowerPoint Slides
Nothing can explain locations better than a map itself. Then why not use it to make your PowerPoint presentation more visual, interesting and the one which leaves a good impression. If you have business around North and South America or your company or organization has clients or industries located in these 2 continents, then we have the perfect slide for you. You can effectively use this slide to show the distribution of clients or any other factor in percentage basis. The creatively designed map can also be used to show a comparison of your user?s location. This can also be an ideal slide to explain the travel and tourism trend prevailing in the continents. This slide is customizable and the icons can be placed anywhere on the map as per the need of the presentation.
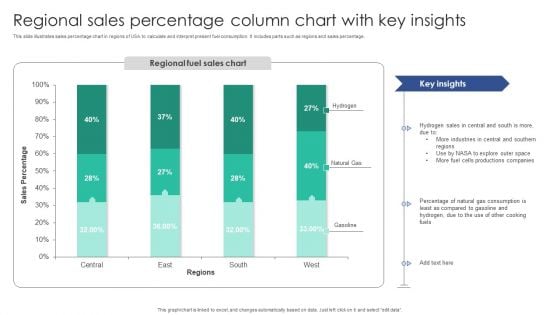
Regional Sales Percentage Column Chart With Key Insights Diagrams PDF
This slide illustrates sales percentage chart in regions of USA to calculate and interpret present fuel consumption. It includes parts such as regions and sales percentage.Pitch your topic with ease and precision using this Regional Sales Percentage Column Chart With Key Insights Diagrams PDF. This layout presents information on Industries Central, Sales Central, Productions Companies. It is also available for immediate download and adjustment. So, changes can be made in the color, design, graphics or any other component to create a unique layout.
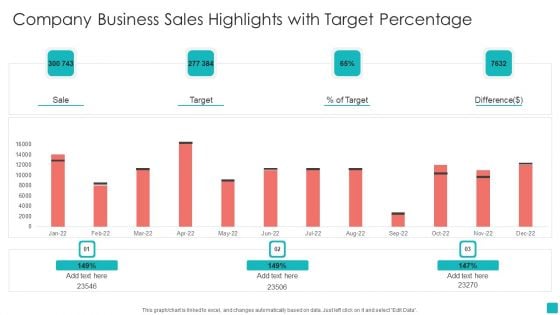
Company Business Sales Highlights With Target Percentage Background PDF
Pitch your topic with ease and precision using this Company Business Sales Highlights With Target Percentage Background PDF. This layout presents information on Company Business Sales Highlights, Target Percentage. It is also available for immediate download and adjustment. So, changes can be made in the color, design, graphics or any other component to create a unique layout.
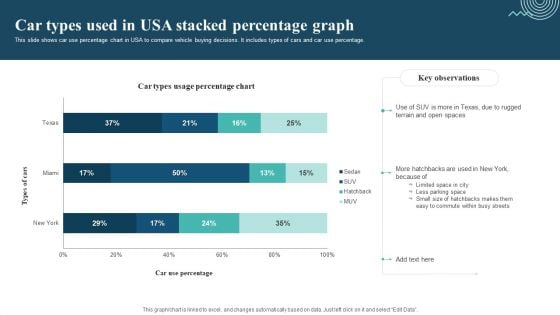
Car Types Used In Usa Stacked Percentage Graph Sample PDF
This slide shows car use percentage chart in USA to compare vehicle buying decisions. It includes types of cars and car use percentage. Pitch your topic with ease and precision using this Car Types Used In Usa Stacked Percentage Graph Sample PDF. This layout presents information on Limited Space In City, Less Parking Space, Easy To Commute. It is also available for immediate download and adjustment. So, changes can be made in the color, design, graphics or any other component to create a unique layout.
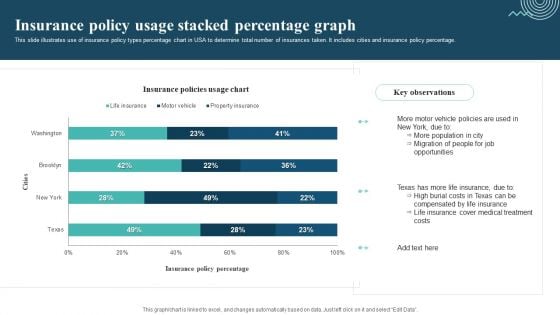
Insurance Policy Usage Stacked Percentage Graph Template PDF
This slide illustrates use of insurance policy types percentage chart in USA to determine total number of insurances taken. It includes cities and insurance policy percentage. Pitch your topic with ease and precision using this Insurance Policy Usage Stacked Percentage Graph Template PDF. This layout presents information on Motor Vehicle Policies, More Population, Migration Of People. It is also available for immediate download and adjustment. So, changes can be made in the color, design, graphics or any other component to create a unique layout.
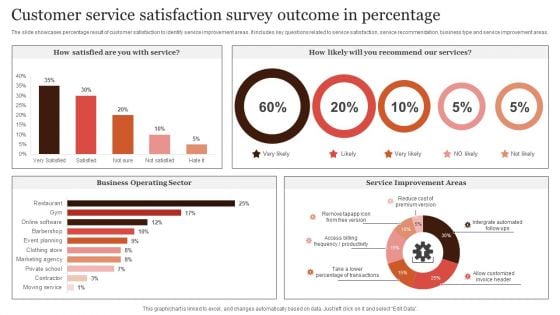
Customer Service Satisfaction Survey Outcome In Percentage Microsoft PDF
The slide showcases percentage result of customer satisfaction to identify service improvement areas. It includes key questions related to service satisfaction, service recommendation, business type and service improvement areas. Pitch your topic with ease and precision using this Customer Service Satisfaction Survey Outcome In Percentage Microsoft PDF. This layout presents information on Customer Service, Satisfaction Survey, Outcome In Percentage. It is also available for immediate download and adjustment. So, changes can be made in the color, design, graphics or any other component to create a unique layout.
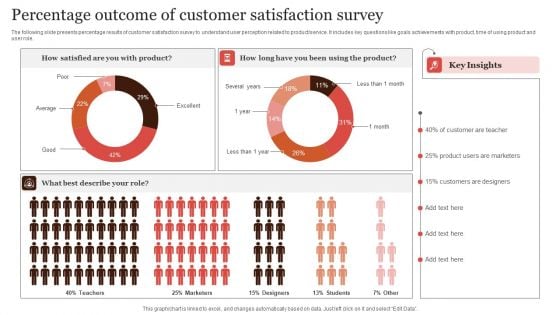
Percentage Outcome Of Customer Satisfaction Survey Infographics PDF
The following slide presents percentage results of customer satisfaction survey to understand user perception related to product or service. It includes key questions like goals achievements with product, time of using product and user role. Pitch your topic with ease and precision using this Percentage Outcome Of Customer Satisfaction Survey Infographics PDF. This layout presents information on Percentage Outcome, Customer Satisfaction Survey. It is also available for immediate download and adjustment. So, changes can be made in the color, design, graphics or any other component to create a unique layout.
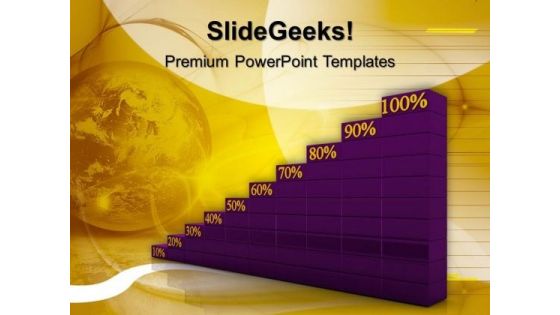
Percentage Graph Progress Business PowerPoint Templates And PowerPoint Themes 1012
Percentage Graph Progress Business PowerPoint Templates And PowerPoint Themes 1012-Using This Beautiful PowerPoint Template you will be able to illustrate the Growth, Progress, development, advancement, improvement, evolution, headway, steps forward, movement, evolvement etc. Our template will help pinpoint their viability. Refine them all as you take them through the numerous filtering stages of the funnel of your quality control process.-Percentage Graph Progress Business PowerPoint Templates And PowerPoint Themes 1012-This PowerPoint template can be used for presentations relating to-Graph Percent Going Up, Success, Business, Finance, Marketing, Money Your address will be the feature. Our Percentage Graph Progress Business PowerPoint Templates And PowerPoint Themes 1012 will ensure the cheers.

Compression Marketing Percentage Business Ppt PowerPoint Presentation Professional Design Ideas
This is a compression marketing percentage business ppt powerpoint presentation professional design ideas. This is a two stage process. The stages in this process are communication, business, management, strategy, analysis.
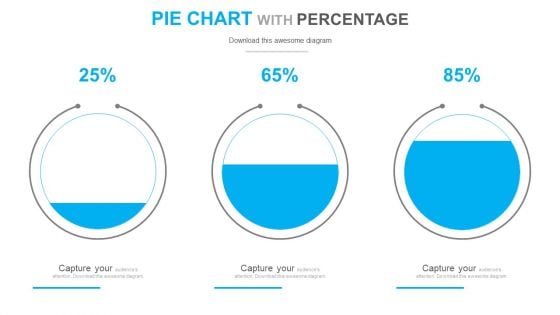
Circle Chart With Increasing Percentage Values PowerPoint Slides
Circle Chart with Increasing Percentage Values power point Slides: - Show your achievements and targets with the ideal background. Above is the diagram to display how your business has been growing or your achievements. The slide is of the three circles having water at different levels in them. Therefore it becomes easy to show that in the first circle, the growth is at this much percent, then the second one and in the last circle, completed 85% of the targets. This PowerPoint template is easy to use to show the progress, and comparisons. All icons are editable. Choose them as per your need.
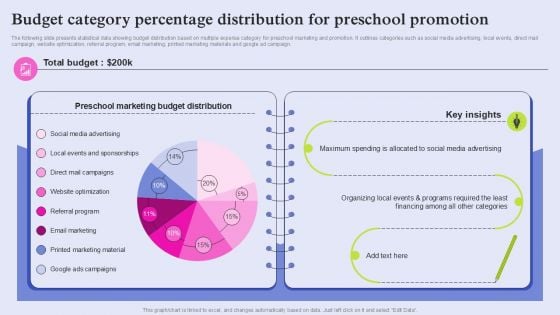
Budget Category Percentage Distribution For Preschool Promotion Graphics PDF
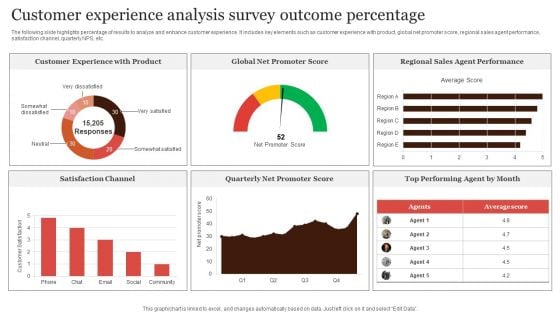
Customer Experience Analysis Survey Outcome Percentage Portrait PDF
The following slide highlights percentage of results to analyze and enhance customer experience. It includes key elements such as customer experience with product, global net promoter score, regional sales agent performance, satisfaction channel, quarterly NPS, etc. Pitch your topic with ease and precision using this Customer Experience Analysis Survey Outcome Percentage Portrait PDF. This layout presents information on Customer Experience, Promoter Score, Regional Sales. It is also available for immediate download and adjustment. So, changes can be made in the color, design, graphics or any other component to create a unique layout.
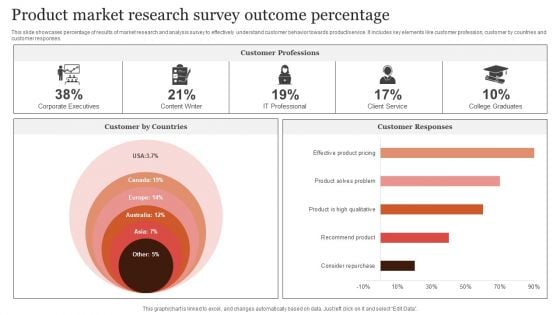
Product Market Research Survey Outcome Percentage Elements PDF
This slide showcases percentage of results of market research and analysis survey to effectively understand customer behavior towards product or service. It includes key elements like customer profession, customer by countries and customer responses. Pitch your topic with ease and precision using this Product Market Research Survey Outcome Percentage Elements PDF. This layout presents information on Customer By Countries, Customer Professions, Customer Responses. It is also available for immediate download and adjustment. So, changes can be made in the color, design, graphics or any other component to create a unique layout.
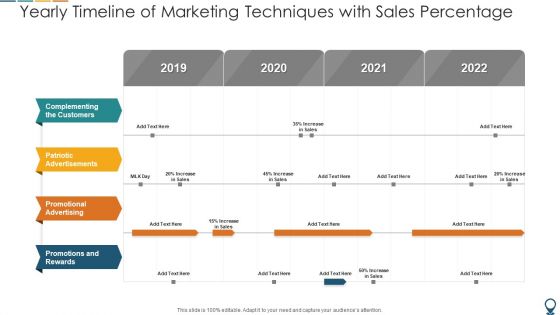
Yearly Timeline Of Marketing Techniques With Sales Percentage Sample PDF
Pitch your topic with ease and precision using this yearly timeline of marketing techniques with sales percentage sample pdf. This layout presents information on complementing the customers, patriotic advertisements, promotional advertising. It is also available for immediate download and adjustment. So, changes can be made in the color, design, graphics or any other component to create a unique layout.
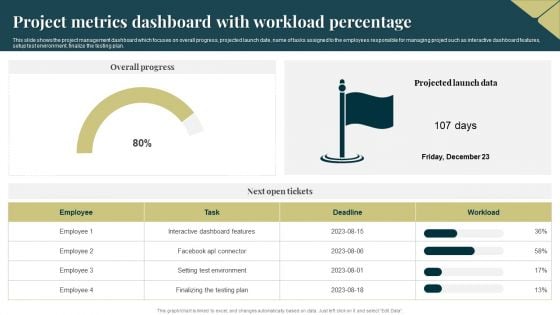
Project Metrics Dashboard With Workload Percentage Ideas PDF
This slide shows the project management dashboard which focuses on overall progress, projected launch date, name of tasks assigned to the employees responsible for managing project such as interactive dashboard features, setup test environment, finalize the testing plan. Showcasing this set of slides titled Project Metrics Dashboard With Workload Percentage Ideas PDF. The topics addressed in these templates are Environment, Plan, Dashboard. All the content presented in this PPT design is completely editable. Download it and make adjustments in color, background, font etc. as per your unique business setting.
Percentage Completion Status Ppt PowerPoint Presentation Complete Deck With Slides
Boost your confidence and team morale with this well-structured Percentage Completion Status Ppt PowerPoint Presentation Complete Deck With Slides. This prefabricated set gives a voice to your presentation because of its well-researched content and graphics. Our experts have added all the components very carefully, thus helping you deliver great presentations with a single click. Not only that, it contains a set of eleven slides that are designed using the right visuals, graphics, etc. Various topics can be discussed, and effective brainstorming sessions can be conducted using the wide variety of slides added in this complete deck. Apart from this, our PPT design contains clear instructions to help you restructure your presentations and create multiple variations. The color, format, design anything can be modified as deemed fit by the user. Not only this, it is available for immediate download. So, grab it now.
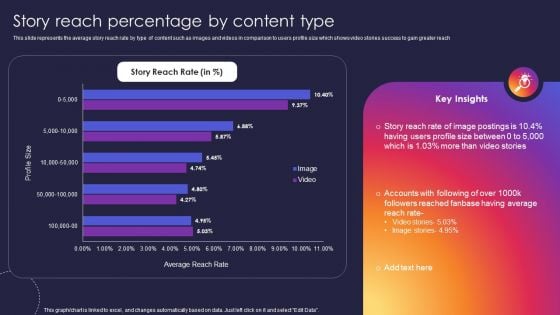
Instagram Company Details Story Reach Percentage By Content Type Rules PDF
This slide represents the average story reach rate by type of content such as images and videos in comparison to users profile size which shows video stories success to gain greater reach. Deliver and pitch your topic in the best possible manner with this Instagram Company Details Story Reach Percentage By Content Type Rules PDF. Use them to share invaluable insights on Story Reach Rate, Average Reach Rate and impress your audience. This template can be altered and modified as per your expectations. So, grab it now.
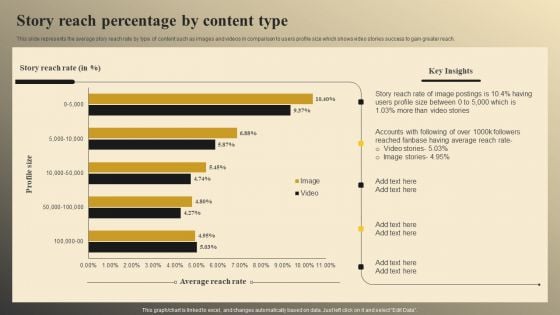
Online Video Model Company Profile Story Reach Percentage By Content Type Pictures PDF
This slide represents the average story reach rate by type of content such as images and videos in comparison to users profile size which shows video stories success to gain greater reach. Coming up with a presentation necessitates that the majority of the effort goes into the content and the message you intend to convey. The visuals of a PowerPoint presentation can only be effective if it supplements and supports the story that is being told. Keeping this in mind our experts created Online Video Model Company Profile Story Reach Percentage By Content Type Pictures PDF to reduce the time that goes into designing the presentation. This way, you can concentrate on the message while our designers take care of providing you with the right template for the situation.
Chart Showing Features Of Products With Percentage Values Ppt PowerPoint Presentation Icon Example File PDF
Showcasing this set of slides titled chart showing features of products with percentage values ppt powerpoint presentation icon example file pdf. The topics addressed in these templates are chart showing features of products with percentage values. All the content presented in this PPT design is completely editable. Download it and make adjustments in color, background, font etc. as per your unique business setting.
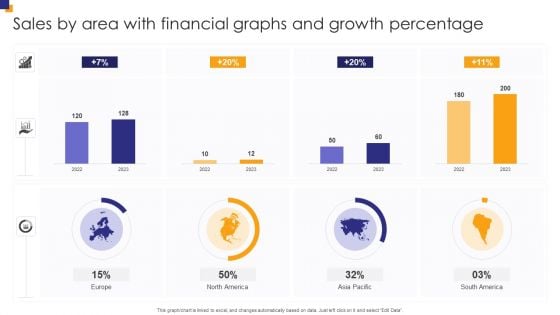
Sales By Area With Financial Graphs And Growth Percentage Inspiration PDF
Pitch your topic with ease and precision using this Sales By Area With Financial Graphs And Growth Percentage Inspiration PDF. This layout presents information on Sales Area, Financial Graphs, Growth Percentage. It is also available for immediate download and adjustment. So, changes can be made in the color, design, graphics or any other component to create a unique layout.
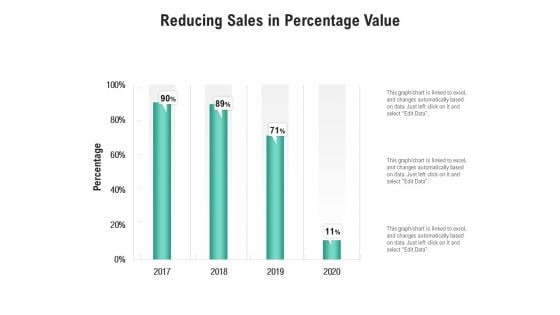
Reducing Sales In Percentage Value Ppt PowerPoint Presentation Outline Guide PDF
Pitch your topic with ease and precision using this reducing sales in percentage value ppt powerpoint presentation outline guide pdf. This layout presents information on reducing sales in percentage value, 2017 to 2020. It is also available for immediate download and adjustment. So, changes can be made in the color, design, graphics or any other component to create a unique layout.
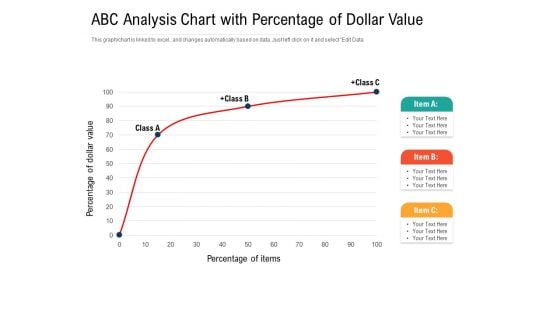
ABC Analysis Chart With Percentage Of Dollar Value Ppt PowerPoint Presentation Gallery Portfolio PDF
Pitch your topic with ease and precision using this abc analysis chart with percentage of dollar value ppt powerpoint presentation gallery portfolio pdf. This layout presents information on abc analysis chart with percentage of dollar value. It is also available for immediate download and adjustment. So, changes can be made in the color, design, graphics or any other component to create a unique layout.
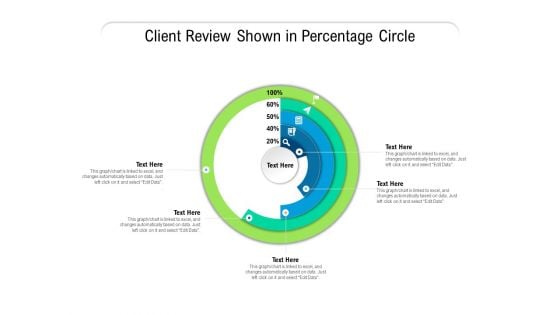
Client Review Shown In Percentage Circle Ppt PowerPoint Presentation File Background Designs PDF
Pitch your topic with ease and precision using this client review shown in percentage circle ppt powerpoint presentation file background designs pdf. This layout presents information on client review shown in percentage circle. It is also available for immediate download and adjustment. So, changes can be made in the color, design, graphics or any other component to create a unique layout.
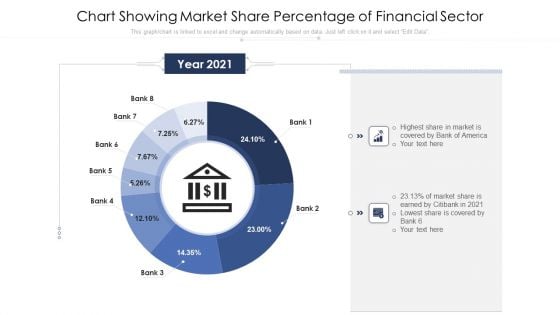
Chart Showing Market Share Percentage Of Financial Sector Ppt PowerPoint Presentation Show Guide PDF
Pitch your topic with ease and precision using this chart showing market share percentage of financial sector ppt powerpoint presentation show guide pdf. This layout presents information on chart showing market share percentage of financial sector. It is also available for immediate download and adjustment. So, changes can be made in the color, design, graphics or any other component to create a unique layout.


 Continue with Email

 Home
Home


