Percentage Icon
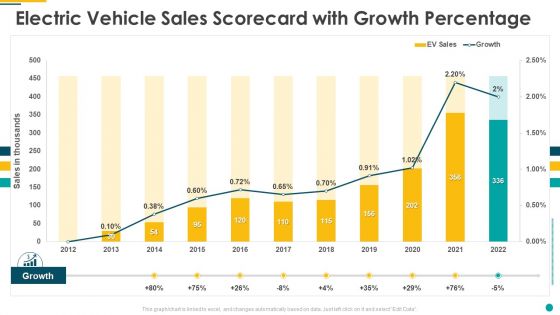
Electric Vehicle Sales Scorecard With Growth Percentage Portrait PDF
Deliver an awe inspiring pitch with this creative electric vehicle sales scorecard with growth percentage portrait pdf bundle. Topics like electric vehicle sales scorecard with growth percentage can be discussed with this completely editable template. It is available for immediate download depending on the needs and requirements of the user.
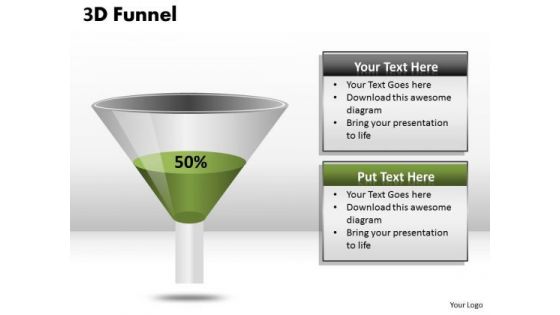
Business Framework Model 3d Funnel Diagram Representing Percentage Strategy Diagram
Our Business Framework Model 3D Funnel Diagram Representing Percentage Strategy Diagram Powerpoint Templates team are a dogged lot. They keep at it till they get it right. Dole it out with our Business Framework Model 3D Funnel Diagram Representing Percentage Strategy Diagram Powerpoint Templates. Your thoughts will get the right proportions.

Business Diagram Linear Process Three Percentage Diagram Presentation Template
This slide displays linear process three percentage presentation templates. This Power Point template has been designed with graphic of multicolored tags with three percentage values. This template is designed to display the linear process flow. Use this diagram for finance related presentations.
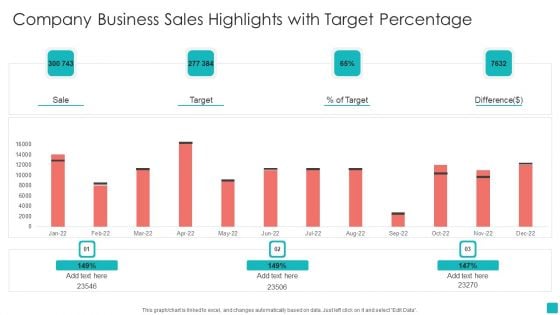
Company Business Sales Highlights With Target Percentage Background PDF
Pitch your topic with ease and precision using this Company Business Sales Highlights With Target Percentage Background PDF. This layout presents information on Company Business Sales Highlights, Target Percentage. It is also available for immediate download and adjustment. So, changes can be made in the color, design, graphics or any other component to create a unique layout.
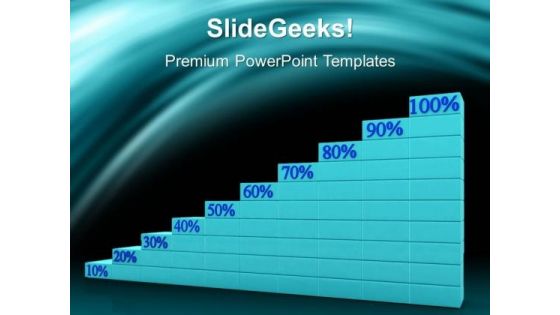
Percentage Graph Finance PowerPoint Templates And PowerPoint Themes 0512
Microsoft Powerpoint Templates and Background with growing percents-These templates can be used for presentations relating to-Growing percent sales, business, finance, marketing, money, success-Percentage Graph Finance PowerPoint Templates And PowerPoint Themes 0512 Keep them driven with our Percentage Graph Finance PowerPoint Templates And PowerPoint Themes 0512. You will come out on top.
Percentage Sign With Internet PowerPoint Templates And PowerPoint Themes 0812
Percentage Sign With Internet PowerPoint Templates And PowerPoint Themes 0812-Microsoft Powerpoint Templates and Background with cardboard box connected to a computer mouse Glue your slides together with our Percentage Sign With Internet PowerPoint Templates And PowerPoint Themes 0812. Try us out and see what a difference our templates make.
Percentage Symbol Finance PowerPoint Templates And PowerPoint Themes 0912
Percentage Symbol Finance PowerPoint Templates And PowerPoint Themes 0912-Microsoft Powerpoint Templates and Background with house model with percent sign-House model with percent sign, real estate, finance, business, signs Decide your own fate with our Percentage Symbol Finance PowerPoint Templates And PowerPoint Themes 0912. Create your destiny with your thoughts.
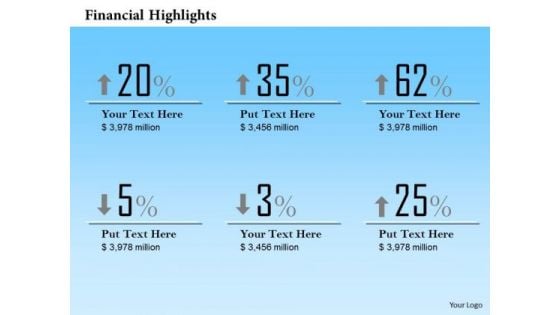
Mba Models And Frameworks Profit Percentage Analysis Diagram Strategic Management
Our MBA Models And Frameworks Profit Percentage Analysis Diagram Strategic Management Powerpoint Templates Abhor Doodling. They Never Let The Interest Flag. Our MBA Models And Frameworks Profit Percentage Analysis Diagram Strategic Management Powerpoint Templates Make Good Beasts Of Burden. Place All Your Demands On Them.
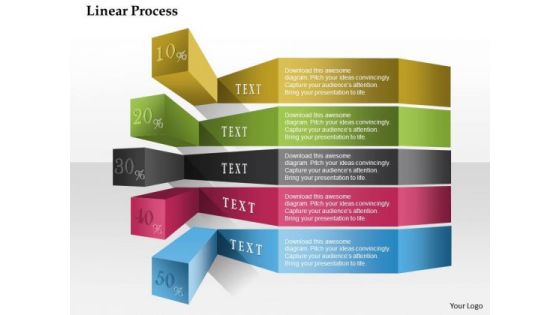
Business Diagram Linear Process Colorful Percentage Presentation Template
This slide displays linear process colorful percentage presentation template. This Power Point template has been designed with graphic of multicolored tags with percentage values. This template is designed to display the linear process flow. Use this diagram for finance related presentations.
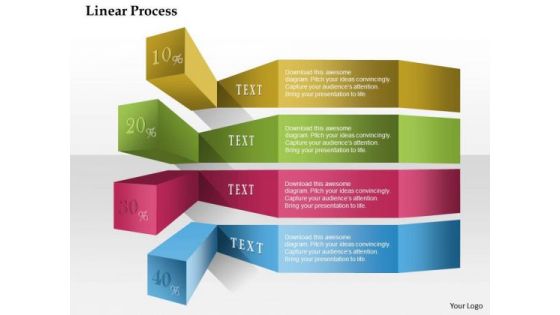
Business Diagram Linear Process Text Percentage Presentation Template
This slide displays linear process text percentage presentation template. This Power Point template has been designed with graphic of multicolored tags with percentage values. This template is designed to display the linear process flow. Use this diagram for finance related presentations.
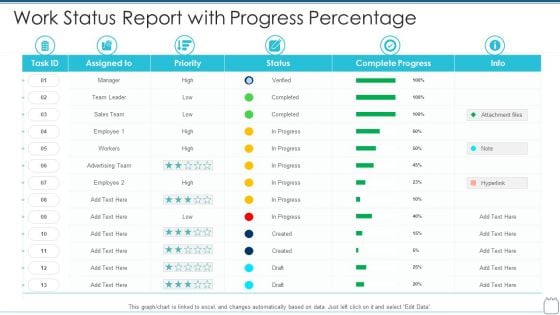
Work Status Report With Progress Percentage Structure PDF
Showcasing this set of slides titled work status report with progress percentage structure pdf . The topics addressed in these templates are work status report with progress percentage . All the content presented in this PPT design is completely editable. Download it and make adjustments in color, background, font etc. as per your unique business setting.
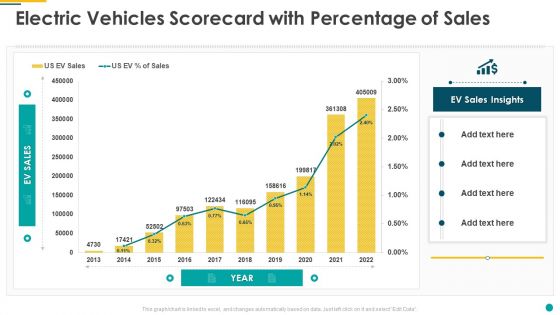
Electric Vehicles Scorecard With Percentage Of Sales Mockup PDF
Deliver and pitch your topic in the best possible manner with this electric vehicles scorecard with percentage of sales mockup pdf. Use them to share invaluable insights on electric vehicles scorecard with percentage of sales and impress your audience. This template can be altered and modified as per your expectations. So, grab it now.

Staffing Dashboard Showing Employees Salary Percentage Information PDF
Showcasing this set of slides titled Staffing Dashboard Showing Employees Salary Percentage Information PDF The topics addressed in these templates are Staffing Dashboard, Showing Employees, Salary Percentage All the content presented in this PPT design is completely editable. Download it and make adjustments in color, background, font etc. as per your unique business setting.

Directors Discussing About Targeted Enterprise Profit Percentage Sample PDF
Presenting Directors Discussing About Targeted Enterprise Profit Percentage Sample PDF to dispense important information. This template comprises Three stages. It also presents valuable insights into the topics including Directors Discussing About Targeted, Enterprise Profit Percentage. This is a completely customizable PowerPoint theme that can be put to use immediately. So, download it and address the topic impactfully.
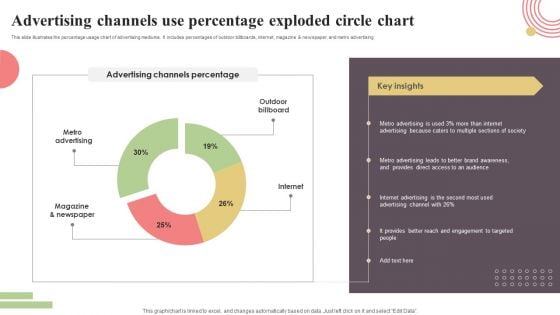
Advertising Channels Use Percentage Exploded Circle Chart Sample PDF
This slide illustrates the percentage usage chart of advertising mediums. It includes percentages of outdoor billboards, internet, magazine and newspaper, and metro advertising. Showcasing this set of slides titled Advertising Channels Use Percentage Exploded Circle Chart Sample PDF. The topics addressed in these templates are Metro Advertising, Magazine And Newspaper, Internet, Outdoor, Billboard. All the content presented in this PPT design is completely editable. Download it and make adjustments in color, background, font etc. as per your unique business setting.
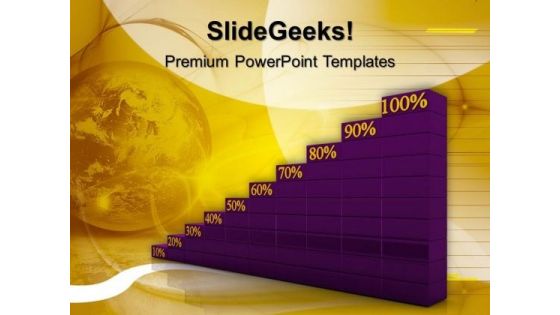
Percentage Graph Progress Business PowerPoint Templates And PowerPoint Themes 1012
Percentage Graph Progress Business PowerPoint Templates And PowerPoint Themes 1012-Using This Beautiful PowerPoint Template you will be able to illustrate the Growth, Progress, development, advancement, improvement, evolution, headway, steps forward, movement, evolvement etc. Our template will help pinpoint their viability. Refine them all as you take them through the numerous filtering stages of the funnel of your quality control process.-Percentage Graph Progress Business PowerPoint Templates And PowerPoint Themes 1012-This PowerPoint template can be used for presentations relating to-Graph Percent Going Up, Success, Business, Finance, Marketing, Money Your address will be the feature. Our Percentage Graph Progress Business PowerPoint Templates And PowerPoint Themes 1012 will ensure the cheers.
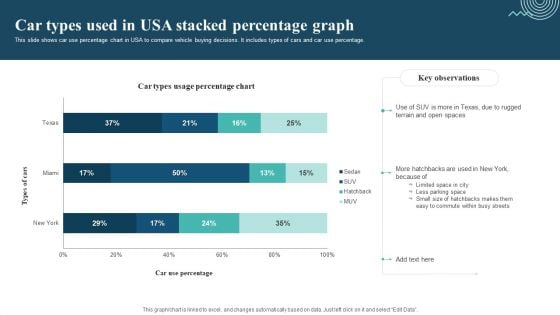
Car Types Used In Usa Stacked Percentage Graph Sample PDF
This slide shows car use percentage chart in USA to compare vehicle buying decisions. It includes types of cars and car use percentage. Pitch your topic with ease and precision using this Car Types Used In Usa Stacked Percentage Graph Sample PDF. This layout presents information on Limited Space In City, Less Parking Space, Easy To Commute. It is also available for immediate download and adjustment. So, changes can be made in the color, design, graphics or any other component to create a unique layout.
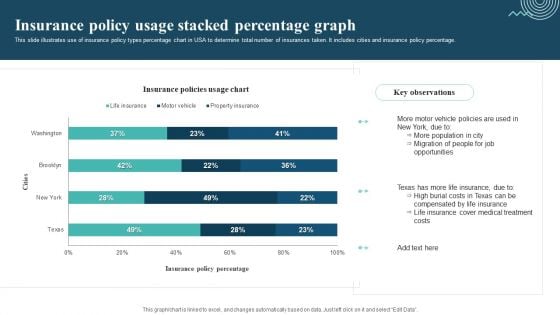
Insurance Policy Usage Stacked Percentage Graph Template PDF
This slide illustrates use of insurance policy types percentage chart in USA to determine total number of insurances taken. It includes cities and insurance policy percentage. Pitch your topic with ease and precision using this Insurance Policy Usage Stacked Percentage Graph Template PDF. This layout presents information on Motor Vehicle Policies, More Population, Migration Of People. It is also available for immediate download and adjustment. So, changes can be made in the color, design, graphics or any other component to create a unique layout.
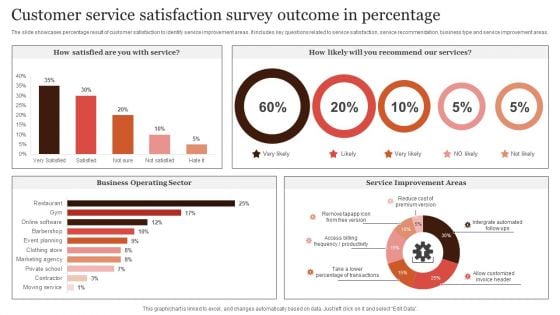
Customer Service Satisfaction Survey Outcome In Percentage Microsoft PDF
The slide showcases percentage result of customer satisfaction to identify service improvement areas. It includes key questions related to service satisfaction, service recommendation, business type and service improvement areas. Pitch your topic with ease and precision using this Customer Service Satisfaction Survey Outcome In Percentage Microsoft PDF. This layout presents information on Customer Service, Satisfaction Survey, Outcome In Percentage. It is also available for immediate download and adjustment. So, changes can be made in the color, design, graphics or any other component to create a unique layout.
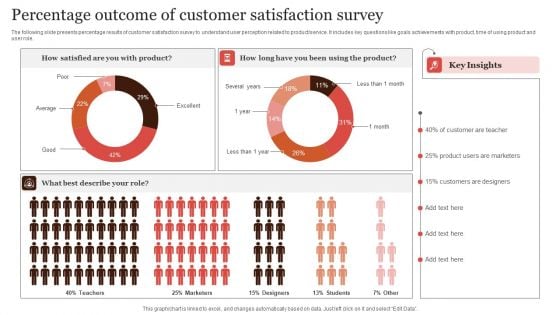
Percentage Outcome Of Customer Satisfaction Survey Infographics PDF
The following slide presents percentage results of customer satisfaction survey to understand user perception related to product or service. It includes key questions like goals achievements with product, time of using product and user role. Pitch your topic with ease and precision using this Percentage Outcome Of Customer Satisfaction Survey Infographics PDF. This layout presents information on Percentage Outcome, Customer Satisfaction Survey. It is also available for immediate download and adjustment. So, changes can be made in the color, design, graphics or any other component to create a unique layout.
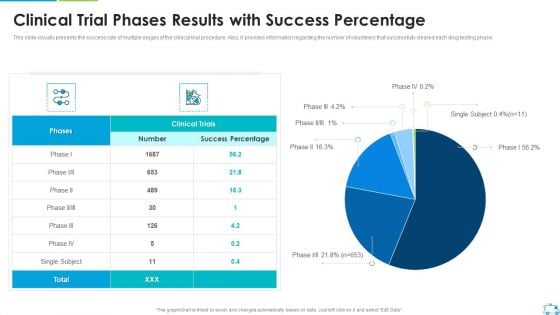
Clinical Trial Phases Results With Success Percentage Download PDF
This slide visually presents the success rate of multiple stages of the clinical trial procedure. Also, it provides information regarding the number of volunteers that successfully cleared each drug testing phase.Deliver an awe inspiring pitch with this creative Clinical Trial Phases Results With Success Percentage Download PDF bundle. Topics like Clinical Trial Phases Results With Success Percentage can be discussed with this completely editable template. It is available for immediate download depending on the needs and requirements of the user.
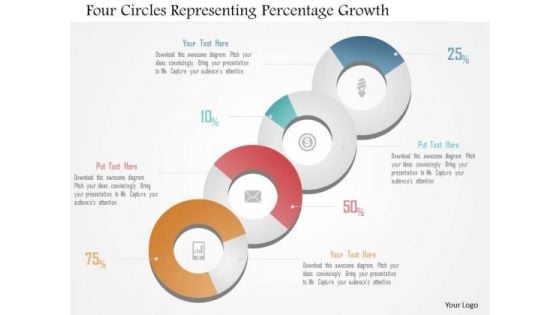
Business Diagram Four Circles Representing Percentage Growth Presentation Template
Our above slide displays four circles representing percentage growth. It helps to depict workflow or a process. This diagram offers a way for your audience to visually conceptualize the process.
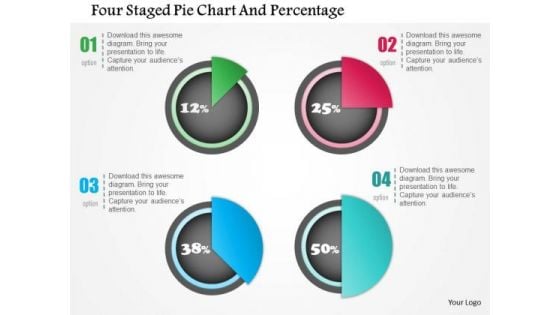
Business Diagram Four Staged Pie Chart And Percentage Presentation Template
Four staged pie chart and percentage values has been used to design this power point template. This PPT contains the concept of financial result analysis. Use this PPT for business and marketing related presentations.
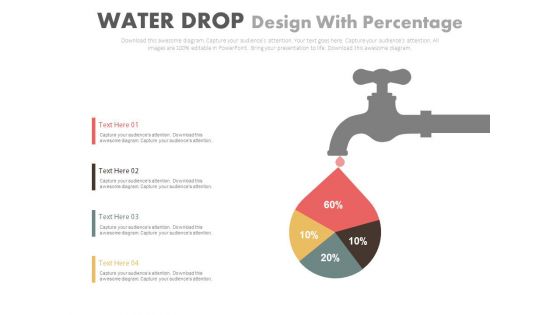
Water Drop Diagram With Percentage Chart Powerpoint Template
This PPT slide has been designed with graphics of water drop with percentage values. Download this PowerPoint template to depict business investments and savings. Imprint your concepts with this professional slide in your presentations.?
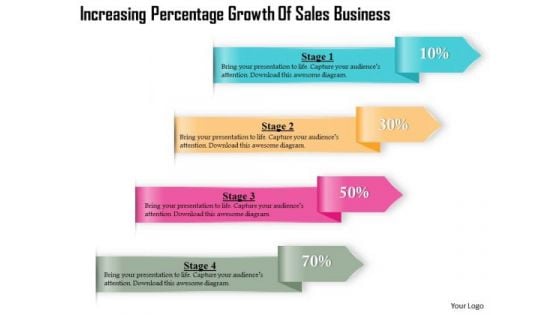
Consulting Slides Increasing Percentage Growth Of Sales Business Presentation
This diagram is designed with graphics of text boxes showing percentage growth. Use this diagram in presentations to display growth in sales or profit. This diagram is editable and can be easily adjusted.
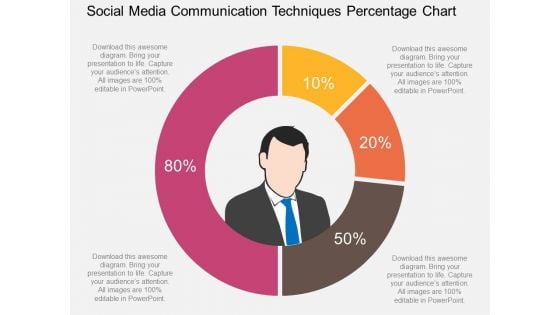
Social Media Communication Techniques Percentage Chart Powerpoint Template
This business slide displays percentage chart of social media communication techniques. Download this diagram to display information in visual manner. Visual effect of this diagram helps in maintaining the flow of the discussion and provides more clarity to the subject.

Three Person Tags With Skill Percentage Charts Powerpoint Slides
This PowerPoint template has been designed with three person?s tags with percentage values. This Info graphic diagram may be used to display team skill analysis. Download this impressive diagram to build unique presentations.
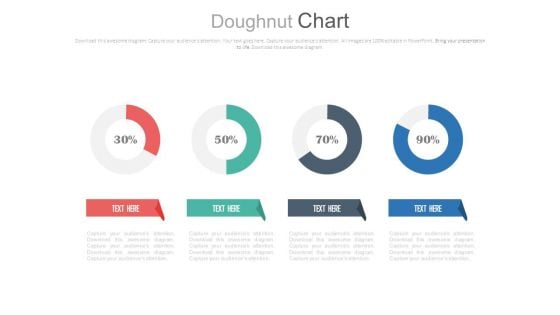
Four Circle Chart With Percentage Ratios Powerpoint Slides
This PowerPoint template has been designed with graphics of four circles and percentage ratios. You may use this dashboard slide design for topics like profit growth and financial planning. This PPT slide is powerful tool to describe your ideas.
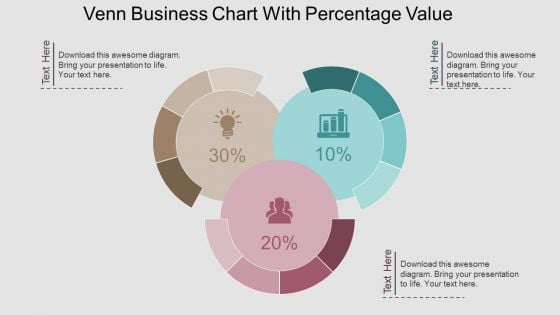
Venn Business Chart With Percentage Value Powerpoint Template
This PPT slide contains Venn business chart with percentage values. This PPT diagram is suitable to present data comparison and analysis. Enlighten others on the process with this innovative PowerPoint template.
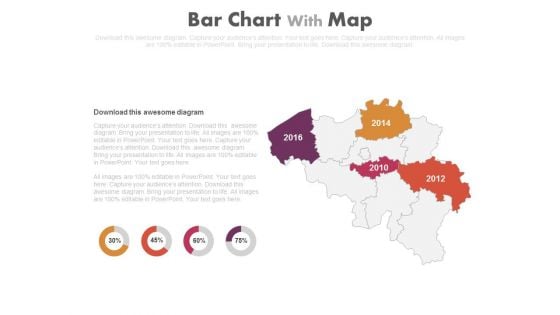
Map With Years And Percentage Charts Powerpoint Slides
This PowerPoint template displays map with years and percentage values. Our professionally designed map diagram is as an effective tool to display economic progress survey of particular areas. Above slide provide ideal backdrop to make business presentations.
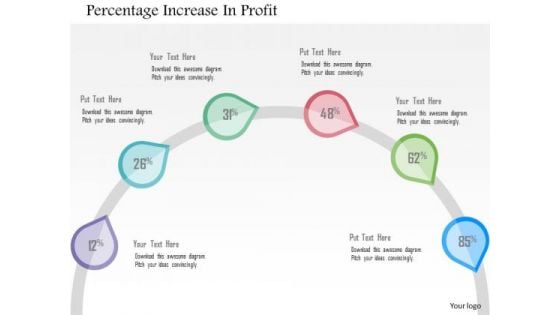
Business Diagram Percentage Increase In Profit Presentation Template
This business slide has been designed with semi circle line displaying percentage increase in business profit. Download this diagram for business and finance related topics. Deliver amazing presentations to mesmerize your audience.
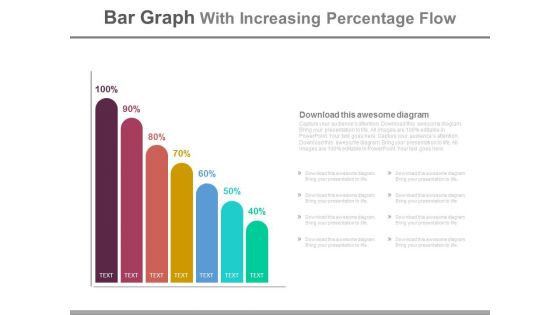
Bar Graph With Increasing Percentage Flow Powerpoint Slides
This PowerPoint slide has been designed with bar graph and increasing percentage values. This diagram slide may be used to display profit growth. Prove the viability of your ideas with this professional slide.
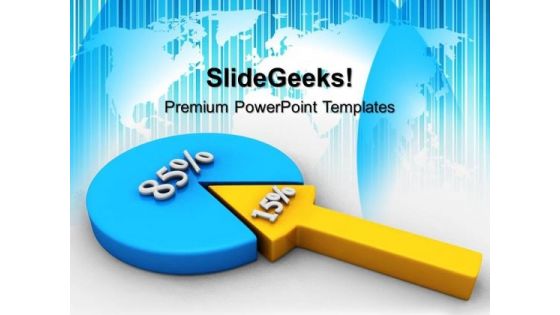
Percentage Pie Graph Marketing PowerPoint Templates And PowerPoint Themes 0412
Microsoft Powerpoint Templates and Background with percent proportion pie chart Enthuse your audience with your ideas. Our Percentage Pie Graph Marketing PowerPoint Templates And PowerPoint Themes 0412 will generate keenness.
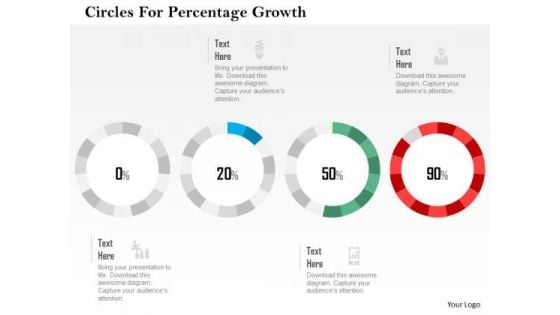
Business Diagram Circles For Percentage Growth Presentation Template
This business slide has been designed with graphics of circles. You may download this diagram to display percentage growth data. This template is innovatively designed to highlight your worthy views
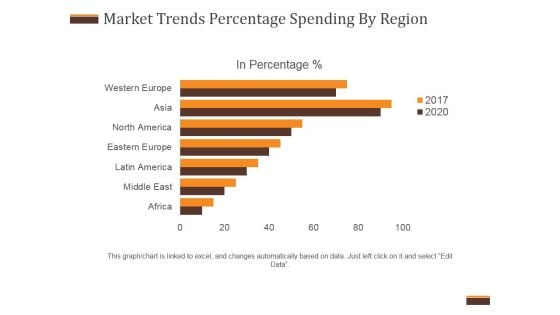
Market Trends Percentage Spending By Region Ppt PowerPoint Presentation Diagrams
This is a market trends percentage spending by region ppt powerpoint presentation diagrams. This is a seven stage process. The stages in this process are business, marketing, management, planning, finance.
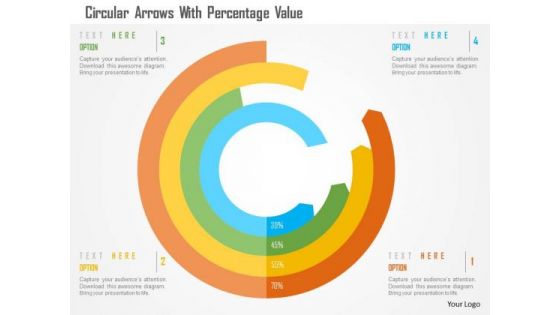
Business Diagram Circular Arrows With Percentage Value Presentation Template
This business slide has been designed with circular arrows. You may download this diagram to display percentage growth data. This template is innovatively designed to highlight your worthy views
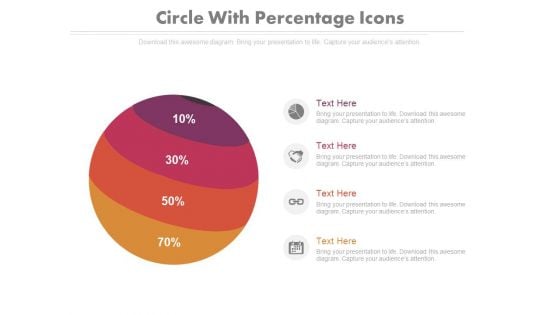
Four Parts Circle Chart With Percentage Ratio Powerpoint Slides
This PowerPoint template contains four parts circle chart with percentage ratio. You may download this PPT slide design to display your ideas in visual manner. You can easily customize this template to make it more unique as per your need.
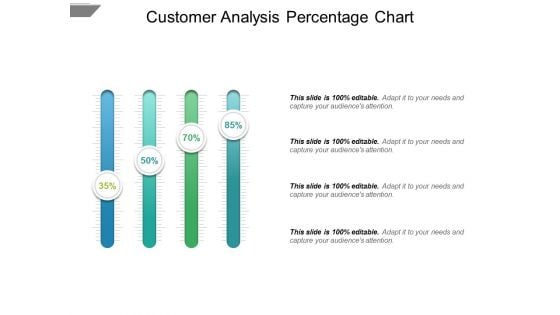
Customer Analysis Percentage Chart Ppt PowerPoint Presentation Infographics Master Slide
This is a customer analysis percentage chart ppt powerpoint presentation infographics master slide. This is a four stage process. The stages in this process are comparison chart, comparison table, comparison matrix.

Area Chart Product Percentage Ppt PowerPoint Presentation Infographic Template Slide
This is a area chart product percentage ppt powerpoint presentation infographic template slide. This is a four stage process. The stages in this process are area chart, finance, marketing, management, investment.

Area Chart Percentage Ppt PowerPoint Presentation Portfolio Pictures
This is a area chart percentage ppt powerpoint presentation portfolio pictures. This is a three stage process. The stages in this process are area chart, finance, marketing, management, investment.
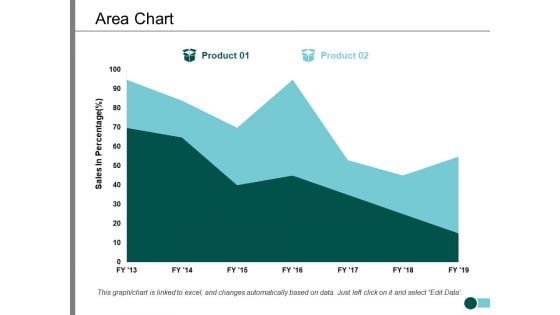
Area Chart Percentage Product Ppt PowerPoint Presentation Infographic Template Slide
This is a area chart percentage product ppt powerpoint presentation infographic template slide. This is a two stage process. The stages in this process are area chart, finance, marketing, management, investment.
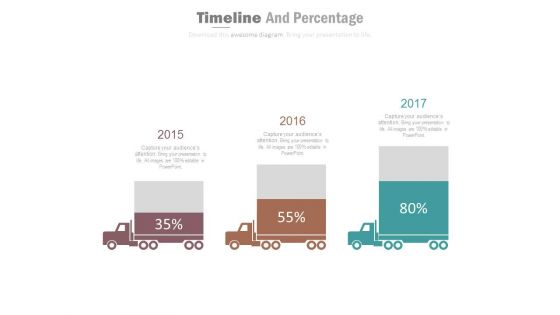
Three Trucks Timeline Diagram With Percentage Value Powerpoint Slides
This PowerPoint timeline template has been designed with three trucks with percentage values. This timeline template may be used to display three years growth planning. Download this PowerPoint timeline template to make impressive presentations.
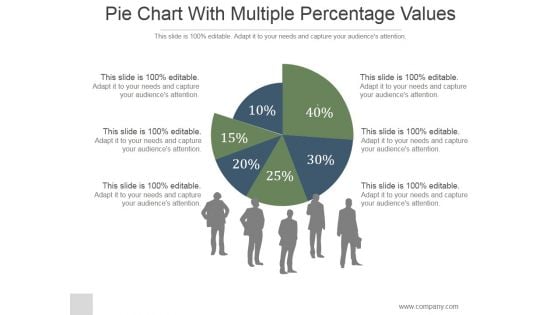
Pie Chart With Multiple Percentage Values Ppt PowerPoint Presentation Show
This is a pie chart with multiple percentage values ppt powerpoint presentation show. This is a six stage process. The stages in this process are pie, finance, people, silhouettes, communication.
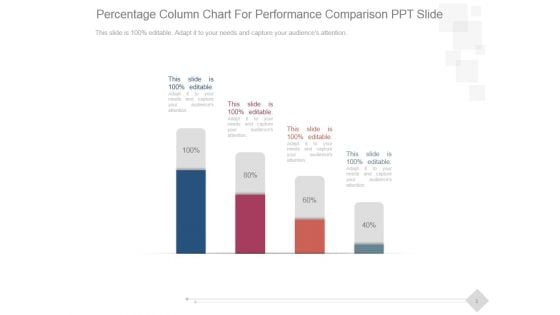
Percentage Column Chart For Performance Comparison Ppt PowerPoint Presentation Good
This is a percentage column chart for performance comparison ppt powerpoint presentation good. This is a four stage process. The stages in this process are business, marketing, technology, presentation, management.
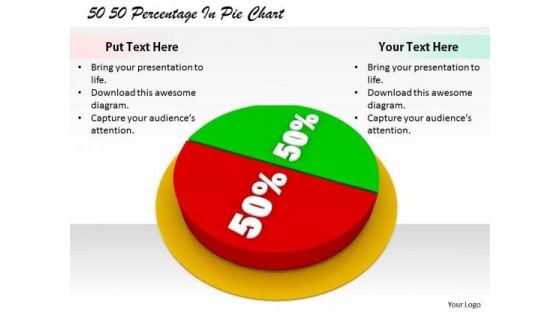
Stock Photo Corporate Business Strategy 50 Percentage Pie Chart Images
Extract admiration from the audience. Create a forceful impact with our stock photo corporate business strategy 50 percentage pie chart images. Force doors open with our finance. The audience will decide to let your thoughts enter.
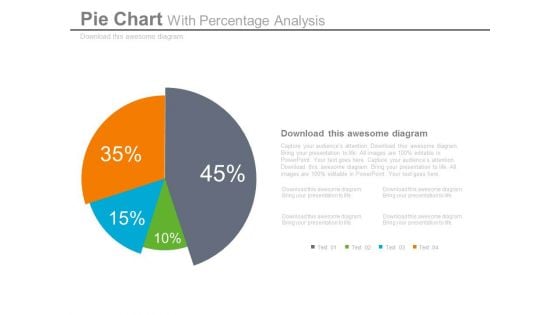
Pie Chart Dashboard Style For Percentage Analysis Powerpoint Slides
This dashboard PPT template contains graphics of pie chart. This dashboard PowerPoint template helps to display percentage analysis in a visual manner. Download this PPT slide for quick decision-making.
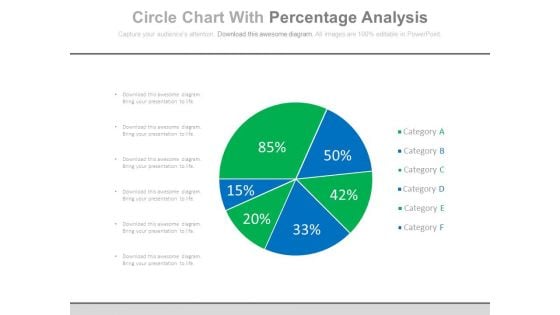
Percentage Chart For Good Marketing Strategy Powerpoint Slides
This PowerPoint template has been designed with pie chart and percentage values. The PowerPoint template has a high quality design. You can download this PowerPoint slide to make good marketing strategy and business plans.
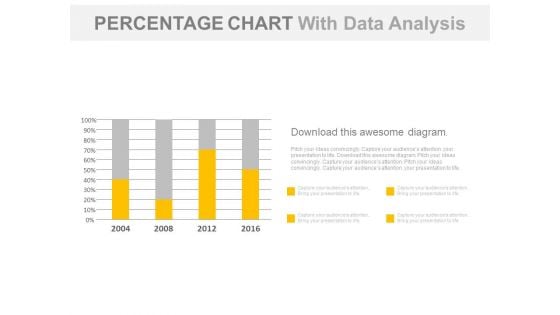
Year Based Chart With Percentage Data Analysis Powerpoint Slides
Our above business slide contains year based statistical chart. This PowerPoint template can be used to display percentage data analysis. Capture the attention of your audience with this slide.
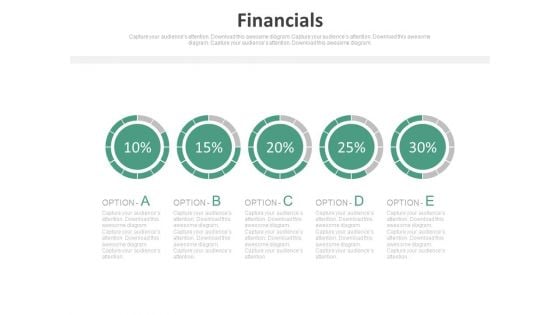
Pie Charts For Percentage Value Analysis Powerpoint Slides
Our above PPT slide displays graphics of Pie charts. This PowerPoint template may be used to display percentage value analysis. Download this template to leave permanent impression on your audience.
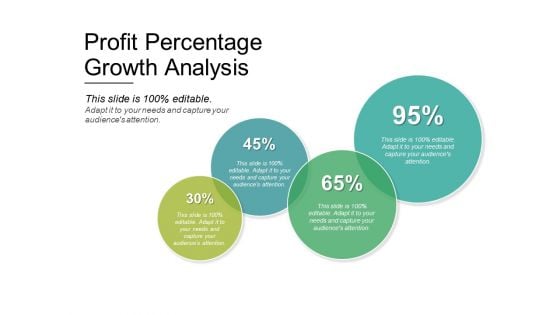
Profit Percentage Growth Analysis Ppt PowerPoint Presentation Layouts Graphics Tutorials
This is a profit percentage growth analysis ppt powerpoint presentation layouts graphics tutorials. This is a four stage process. The stages in this process are comparison chart, comparison table, comparison matrix.
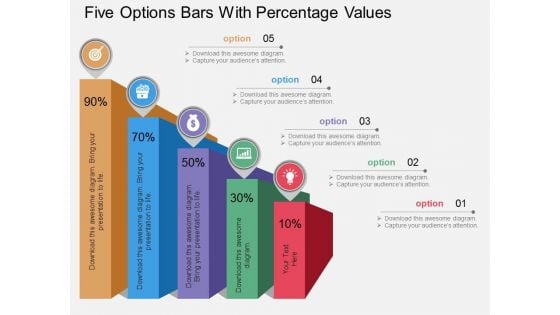
Five Options Bars With Percentage Values Powerpoint Template
Our professionally designed business diagram is as an effective tool for communicating ideas and planning. It contains five options bars with percentage values. Convey your views with this diagram slide. It will amplify the strength of your logic.
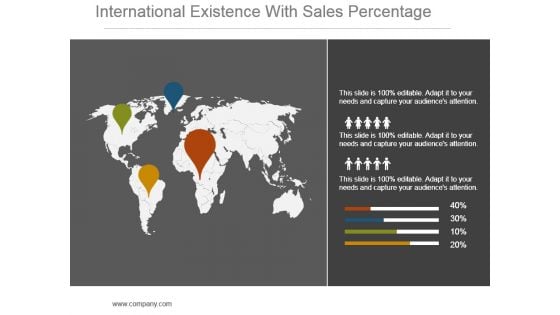
International Existence With Sales Percentage Powerpoint Slide Themes
This is a international existence with sales percentage powerpoint slide themes. This is a four stage process. The stages in this process are globe, finance, pointers, business, marketing, global.
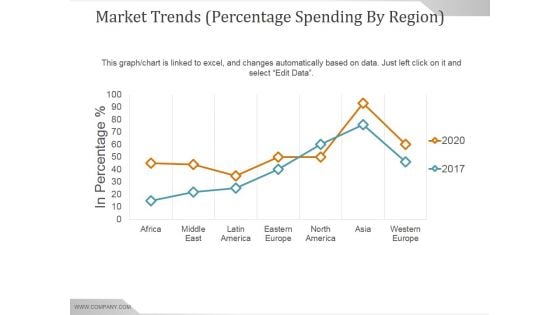
Market Trends Percentage Spending By Region Ppt PowerPoint Presentation Sample
This is a market trends percentage spending by region ppt powerpoint presentation sample. This is a seven stage process. The stages in this process are africa, middle east, latin america, eastern europe, north america, asia, western europe.
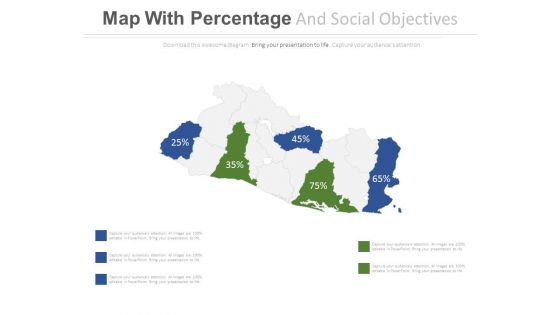
Map With Highlighted Areas And Percentage Values Powerpoint Slides
This PowerPoint template displays map diagram with highlighted areas and percentage values. You may use this PPT slide to exhibit area wise financial growth. Download this PowerPoint map diagram to build impressive presentations.
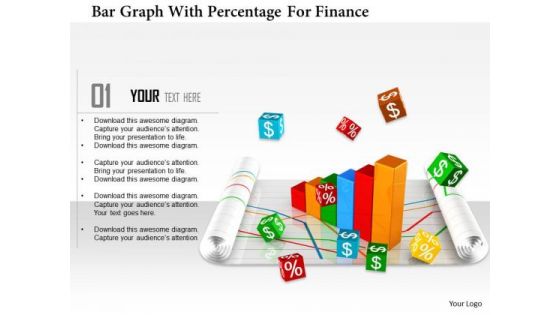
Stock Photo Bar Graph With Percentage For Finance PowerPoint Slide
This Power Point template has been designed with graphic of bar graph and percentage value. This image slide contains the concept of finance and accounting. Use this editable diagram for your business and finance related presentations.
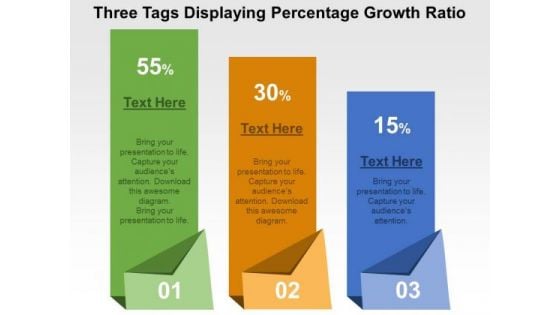
Three Tags Displaying Percentage Growth Ratio PowerPoint Template
Create dynamic presentations with our professional template containing three tags. This diagram is useful to display business percentage growth ratio. Download this template to leave permanent impression on your audience.
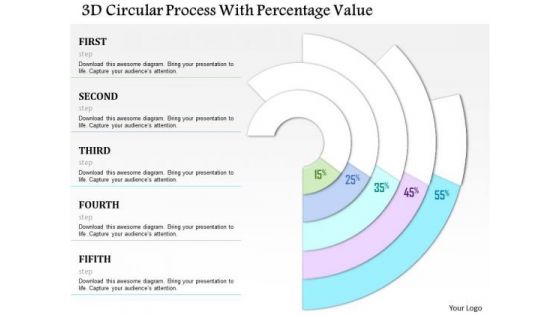
Business Diagram 3d Circular Process With Percentage Value Presentation Template
This power point template has been designed with graphic of 3d circular process and percentage value. This PPT contains the concept of business and marketing process flow. Use this PPT for your business and marketing presentations.
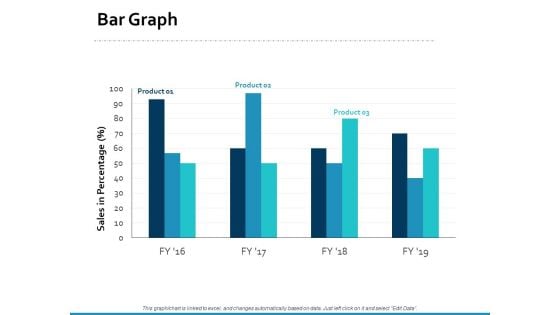
Bar Graph Percentage Product Ppt PowerPoint Presentation Styles Good
This is a bar graph percentage product ppt powerpoint presentation styles good. This is a three stage process. The stages in this process are area chart, finance, marketing, management, investment.
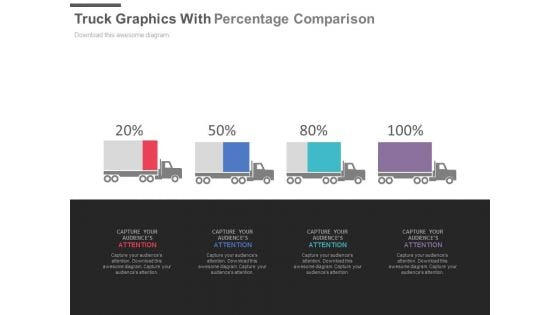
Four Trucks With Percentage Values For Comparison Powerpoint Slides
This PPT slide displays graphics of four trucks with percentage values. Use this PPT design to display logistics compare chart. This PowerPoint template can be customized as per requirements of business presentation.
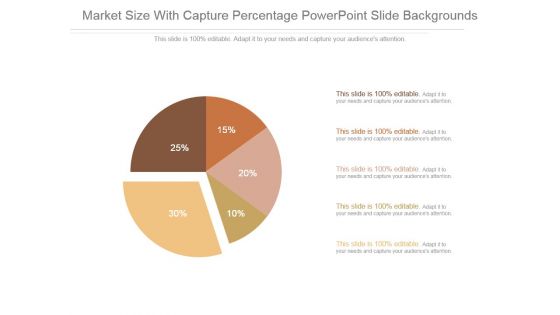
Market Size With Capture Percentage Powerpoint Slide Backgrounds
This is a market size with capture percentage powerpoint slide backgrounds. This is a five stage process. The stages in this process are finance, pie chart, business, marketing, management.

Four Vertical Columns For Percentage Comparison Ppt PowerPoint Presentation Introduction
This is a four vertical columns for percentage comparison ppt powerpoint presentation introduction. This is a four stage process. The stages in this process are business, marketing, success, management, presentation.

Five Yearly Sequential Timeline With Percentage Values Powerpoint Slides
This PowerPoint timeline slide design can be used to display timeline operations. It contains sequential timeline diagram with percentage values. This timeline template can be used in presentations where you need to display time planning and analysis.
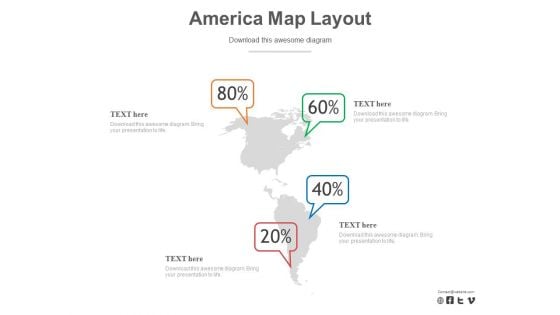
Map Of America With Percentage Data PowerPoint Slides
Nothing can explain locations better than a map itself. Then why not use it to make your PowerPoint presentation more visual, interesting and the one which leaves a good impression. If you have business around North and South America or your company or organization has clients or industries located in these 2 continents, then we have the perfect slide for you. You can effectively use this slide to show the distribution of clients or any other factor in percentage basis. The creatively designed map can also be used to show a comparison of your user?s location. This can also be an ideal slide to explain the travel and tourism trend prevailing in the continents. This slide is customizable and the icons can be placed anywhere on the map as per the need of the presentation.
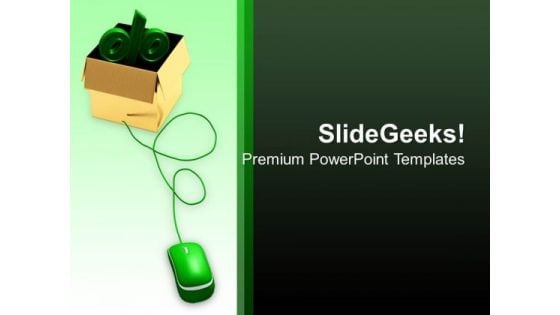
Percentage With Mouse Internet PowerPoint Templates And PowerPoint Themes 1112
Percentage With Mouse Internet PowerPoint Templates And PowerPoint Themes 1112-Create visually stunning and define your PPT Presentations in a unique and inspiring manner using our above template which contains a graphic of percent symbol in a cardboard box connected to a computer mouse. It imitates business, currency, finance, growth, internet, investment, sale, savings, selling, sign, symbol, tax, wealth. It is a useful captivating tool conceived to enable you to define your message in your Business PPT presentations. Deliver amazing presentations to mesmerize your audience.-Percentage With Mouse Internet PowerPoint Templates And PowerPoint Themes 1112-This PowerPoint template can be used for presentations relating to-Percentage sign connected to a computer mouse, Technology, Cables, Business, Symbol, Signs Award yourself with our Percentage With Mouse Internet PowerPoint Templates And PowerPoint Themes 1112. Your thoughts deserve the distinction.
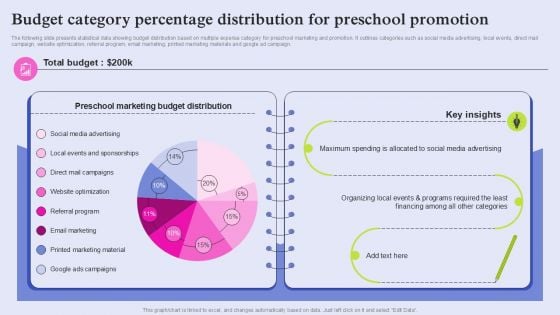
Budget Category Percentage Distribution For Preschool Promotion Graphics PDF
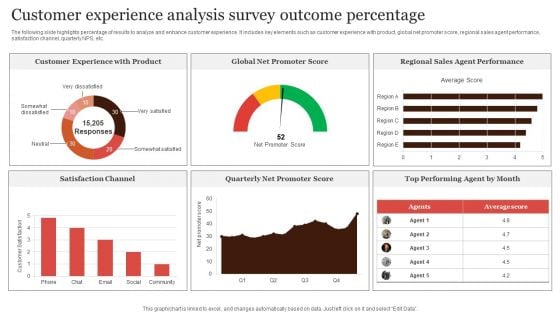
Customer Experience Analysis Survey Outcome Percentage Portrait PDF
The following slide highlights percentage of results to analyze and enhance customer experience. It includes key elements such as customer experience with product, global net promoter score, regional sales agent performance, satisfaction channel, quarterly NPS, etc. Pitch your topic with ease and precision using this Customer Experience Analysis Survey Outcome Percentage Portrait PDF. This layout presents information on Customer Experience, Promoter Score, Regional Sales. It is also available for immediate download and adjustment. So, changes can be made in the color, design, graphics or any other component to create a unique layout.
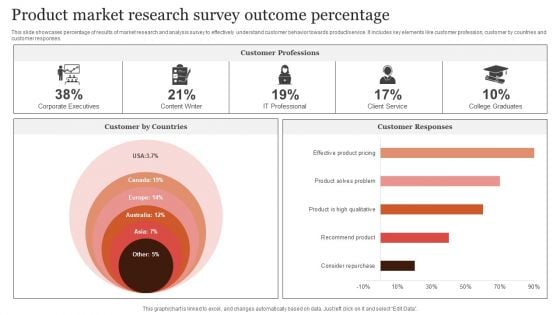
Product Market Research Survey Outcome Percentage Elements PDF
This slide showcases percentage of results of market research and analysis survey to effectively understand customer behavior towards product or service. It includes key elements like customer profession, customer by countries and customer responses. Pitch your topic with ease and precision using this Product Market Research Survey Outcome Percentage Elements PDF. This layout presents information on Customer By Countries, Customer Professions, Customer Responses. It is also available for immediate download and adjustment. So, changes can be made in the color, design, graphics or any other component to create a unique layout.

Pie Chart With Increasing Percentage Values Powerpoint Slides
This PowerPoint template has been designed with diagram of pie chart with increasing percentage values. This PPT slide can be used to prepare presentations for profit growth report and also for financial data analysis. You can download finance PowerPoint template to prepare awesome presentations.
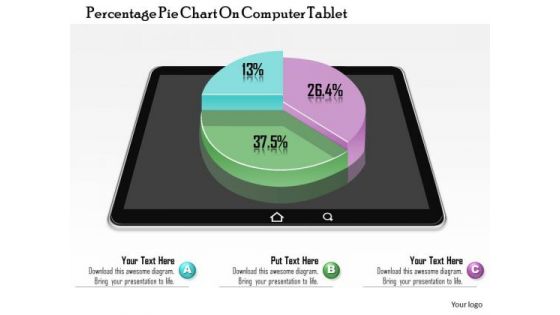
Business Diagram Percentage Pie Chart On Computer Tablet Presentation Template
This image slide displays business consulting diagram of percentage pie chart on computer tablet. This image has been made with 3d colorful graphic of pie chart on black tablet. Use this PowerPoint template, in your presentations to express various views like growth, achievements, success in business. This image slide will make your presentations outshine.
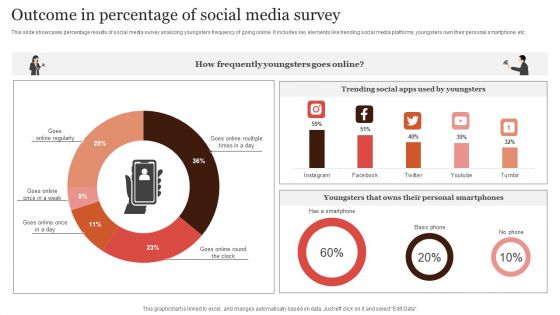
Outcome In Percentage Of Social Media Survey Demonstration PDF
This slide showcases percentage results of social media survey analyzing youngsters frequency of going online. It includes key elements like trending social media platforms, youngsters own their personal smartphone, etc. Showcasing this set of slides titled Outcome In Percentage Of Social Media Survey Demonstration PDF. The topics addressed in these templates are Frequently Youngsters, Trending Social Apps, Personal Smartphones. All the content presented in this PPT design is completely editable. Download it and make adjustments in color, background, font etc. as per your unique business setting.
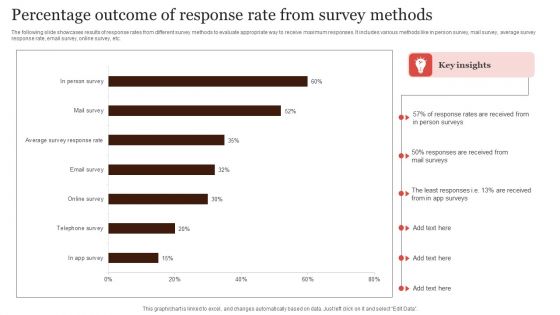
Percentage Outcome Of Response Rate From Survey Methods Guidelines PDF
The following slide showcases results of response rates from different survey methods to evaluate appropriate way to receive maximum responses. It includes various methods like in person survey, mail survey, average survey response rate, email survey, online survey, etc. Showcasing this set of slides titled Percentage Outcome Of Response Rate From Survey Methods Guidelines PDF. The topics addressed in these templates are Percentage Outcome, Response Rate, Survey Methods. All the content presented in this PPT design is completely editable. Download it and make adjustments in color, background, font etc. as per your unique business setting.
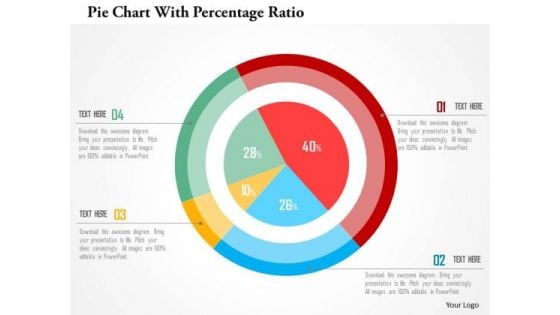
Business Diagram Pie Chart With Percentage Ratio Presentation Template
Our professionally designed business diagram is as an effective tool for communicating business ideas and strategies for corporate planning. It contains graphics of pie chart with percentage ratio. Convey your views with this diagram slide. It will amplify the strength of your logic.
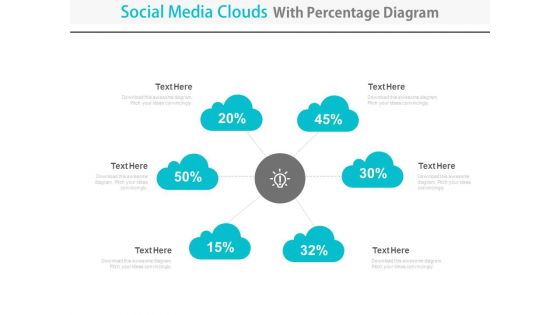
Cloud Network Diagram With Percentage Data Powerpoint Slides
This PowerPoint template contains graphics of cloud network diagram with percentage values. You may download this PPT slide design to display cloud network and financial strategy. You can easily customize this template to make it more unique as per your need.
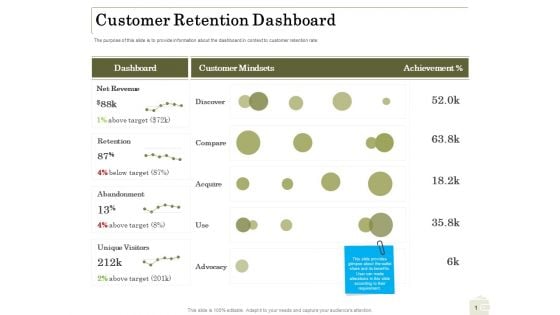
Percentage Share Customer Expenditure Customer Retention Dashboard Background PDF
Presenting this set of slides with name percentage share customer expenditure customer retention dashboard background pdf. The topics discussed in these slides are revenue, target, abandonment, retention, dashboard. This is a completely editable PowerPoint presentation and is available for immediate download. Download now and impress your audience.
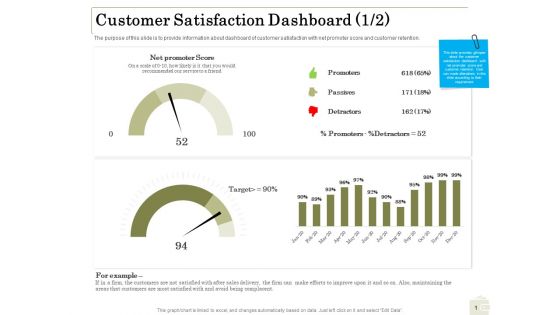
Percentage Share Customer Expenditure Customer Satisfaction Dashboard Areas Designs PDF
Presenting this set of slides with name percentage share customer expenditure customer satisfaction dashboard areas designs pdf. The topics discussed in these slides are promoters, passives, detractors, target. This is a completely editable PowerPoint presentation and is available for immediate download. Download now and impress your audience.
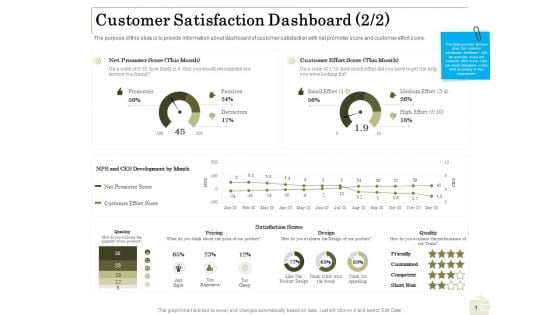
Percentage Share Customer Expenditure Customer Satisfaction Dashboard Score Mockup PDF
Presenting this set of slides with name percentage share customer expenditure customer satisfaction dashboard score mockup pdf. The topics discussed in these slides are design, pricing, quality, development. This is a completely editable PowerPoint presentation and is available for immediate download. Download now and impress your audience.
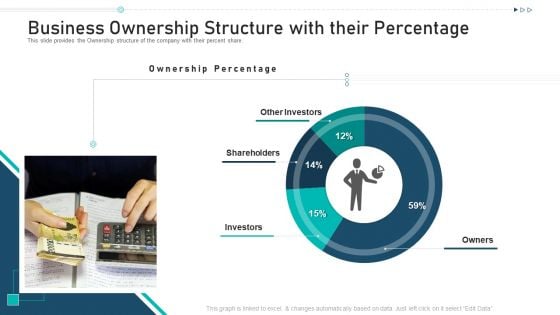
Business Ownership Structure With Their Percentage Ppt Slides Elements PDF
This slide provides the Ownership structure of the company with their percent share. Deliver an awe inspiring pitch with this creative business ownership structure with their percentage ppt slides elements pdf bundle. Topics like other investors, shareholders, investors, owners can be discussed with this completely editable template. It is available for immediate download depending on the needs and requirements of the user.
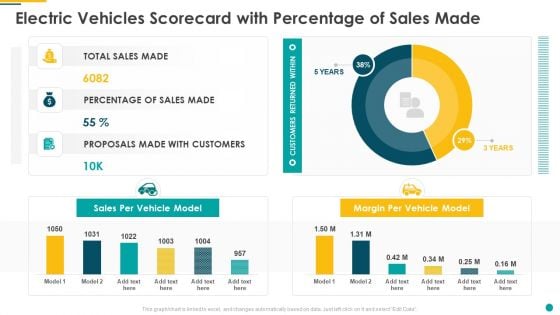
Electric Vehicles Scorecard With Percentage Of Sales Made Pictures PDF
Deliver an awe inspiring pitch with this creative electric vehicles scorecard with percentage of sales made pictures pdf bundle. Topics like sales per vehicle model, margin per vehicle model, customers returned within can be discussed with this completely editable template. It is available for immediate download depending on the needs and requirements of the user.
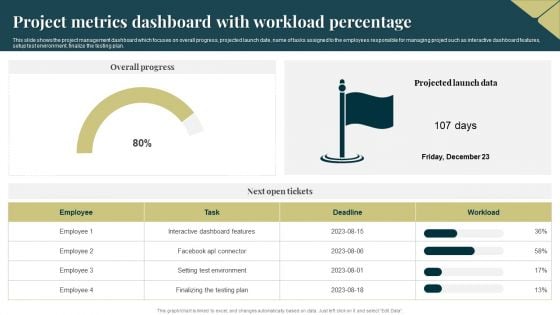
Project Metrics Dashboard With Workload Percentage Ideas PDF
This slide shows the project management dashboard which focuses on overall progress, projected launch date, name of tasks assigned to the employees responsible for managing project such as interactive dashboard features, setup test environment, finalize the testing plan. Showcasing this set of slides titled Project Metrics Dashboard With Workload Percentage Ideas PDF. The topics addressed in these templates are Environment, Plan, Dashboard. All the content presented in this PPT design is completely editable. Download it and make adjustments in color, background, font etc. as per your unique business setting.
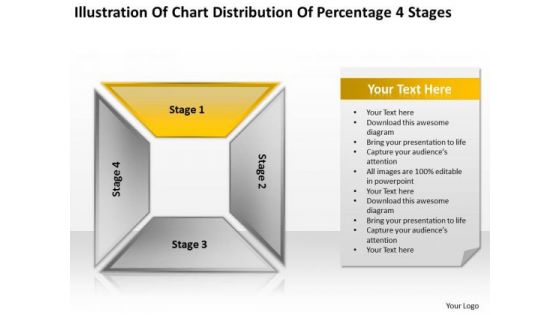
Chart Distribution Percentage 4 Stages Business Plan PowerPoint Templates
We present our chart distribution percentage 4 stages business plan PowerPoint templates.Use our Business PowerPoint Templates because Your audience will believe you are the cats whiskers. Download and present our Process and Flows PowerPoint Templates because Our PowerPoint Templates and Slides are focused like a searchlight beam. They highlight your ideas for your target audience. Use our Shapes PowerPoint Templates because They will bring a lot to the table. Their alluring flavours will make your audience salivate. Use our Success PowerPoint Templates because Our PowerPoint Templates and Slides ensures Effective communication. They help you put across your views with precision and clarity. Use our Marketing PowerPoint Templates because you should Experience excellence with our PowerPoint Templates and Slides. They will take your breath away.Use these PowerPoint slides for presentations relating to Shadow, square, rectangle, perspective, vector, template, shapes, graphic, multicolor, abstract, modern, box, illustration, geometric, backdrop, colors, design, architecture, shelves, backgrounds, banner, art, cabinet, space, wardrobe, structure, block. The prominent colors used in the PowerPoint template are Yellow, Gray, Black. Organize plans with our Chart Distribution Percentage 4 Stages Business Plan PowerPoint Templates. Download without worries with our money back guaranteee.
Percentage Circle Graph Ppt PowerPoint Presentation Complete With Slides
If designing a presentation takes a lot of your time and resources and you are looking for a better alternative, then this percentage circle graph ppt powerpoint presentation complete with slides is the right fit for you. This is a prefabricated set that can help you deliver a great presentation on the topic. All the ten slides included in this sample template can be used to present a birds-eye view of the topic. These slides are also fully editable, giving you enough freedom to add specific details to make this layout more suited to your business setting. Apart from the content, all other elements like color, design, theme are also replaceable and editable. This helps in designing a variety of presentations with a single layout. Not only this, you can use this PPT design in formats like PDF, PNG, and JPG once downloaded. Therefore, without any further ado, download and utilize this sample presentation as per your liking.
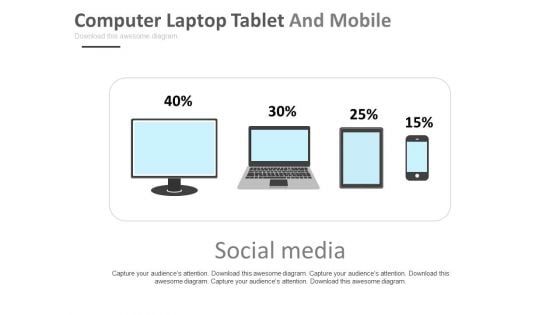
Computer Laptop Tablet And Mobile With Percentage Values Powerpoint Slides
This slide which shows a mobile, a tablet and a laptop / TV screen can be perfectly used to demonstrate compatibility of an application or a website on different kind of devices, operating systems and screen sizes. This slide can be used by business and organizations dealing with technology in any manner. The slide can be used to demonstrate the usage experience on different screen sizes. It can be used to demonstrate the number of users of a website or an app or a particular platform. It can also easily depict the ratio of users on the based on their usage patterns and preferences of devise. This can be an effective way to compare one gadget with another. The slide is customizable and can be used with different icons and colors as per the convenience and needs of the user.
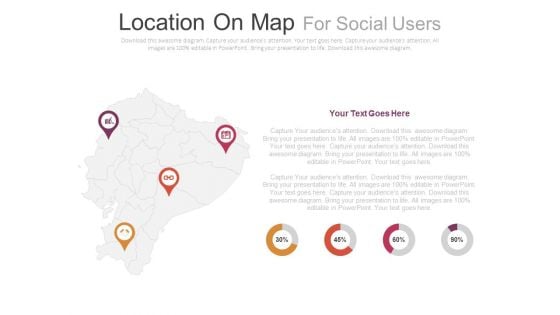
Four Locations On Map With Percentage Analysis Powerpoint Slides
This PowerPoint slide contains diagram of map with location pointers and icons. This professional slide helps to exhibit demographics of social media users. Use this PowerPoint template to make impressive presentations.
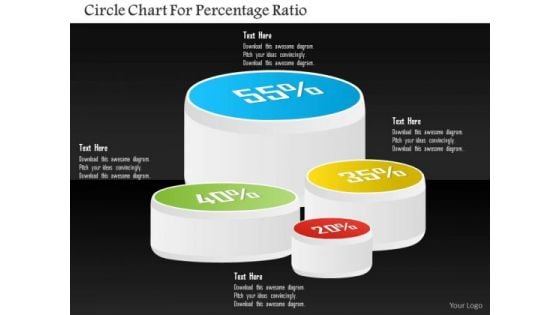
Business Diagram Circle Chart For Percentage Ratio Presentation Template
Four staged circular chart has been used to craft this PPT diagram. This PPT contains the concept of result analysis. Use this PPT in your business and sales presentation and display any kind of result analysis in a graphical way.
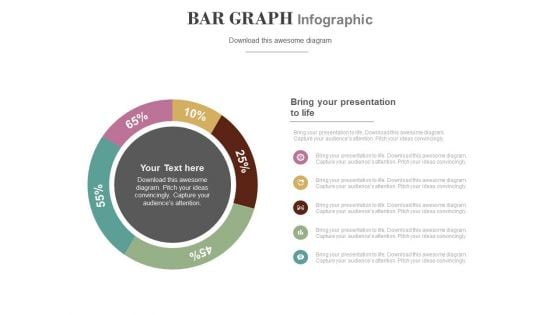
Circle Chart With Percentage Value Analysis Powerpoint Slides
This PowerPoint template has been designed with circular process diagram. This business diagram helps to exhibit financial process control and analysis. Use this diagram to visually support your content.
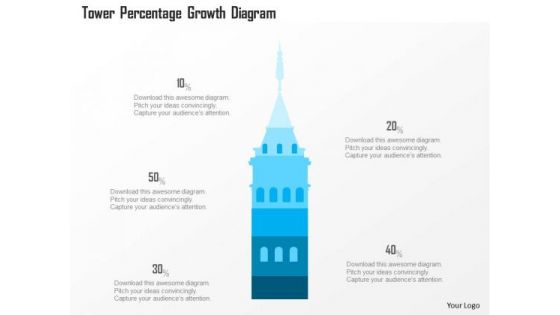
Business Diagram Tower Percentage Growth Diagram Presentation Template
This power point diagram slide has been crafted with graphic of 3d blue tower and text boxes. This PPT slide contains the concept of data and text representations. Use this PPT slide for your business and management related presentations.
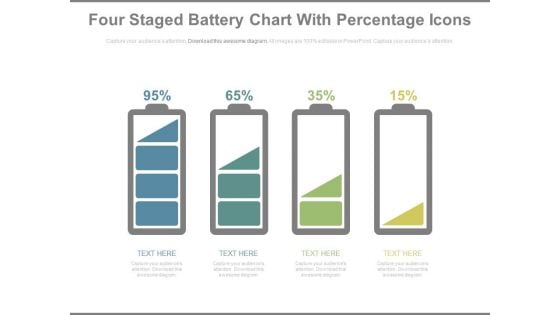
Battery Chart With Percentage Values For Comparison PowerPoint Slides
This year?s sales has matched up with your expectations. Now match this slide with your presentation to show the same. Show your company?s performance or business growth with this four staged battery chart PowerPoint template. With this slide, you can easily convince your colleagues how your company gave a tremendous growth over the years or months. Perfect illustration to show that the targets are achieved. This PPT template is easy to edit. You can choose the color of your choice. Your colleagues are already impressed with the sales growth. Now impress others and choose this PPT innovative designed template.
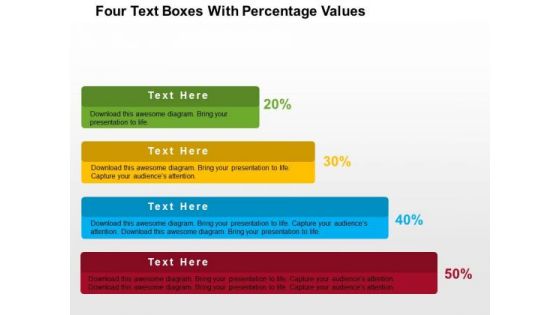
Four Text Boxes With Percentage Values PowerPoint Template
Growth analysis for business can be defined with this business diagram. This slide depicts text boxes in increasing flow. Present your views using this innovative slide and be assured of leaving a lasting impression
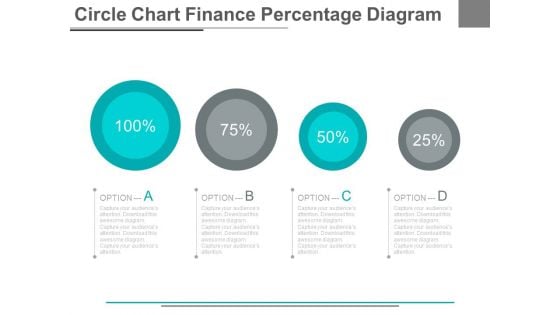
Four Options Circle Chart With Percentage Powerpoint Slides
This PowerPoint template has been designed with graphics of four options circle chart. This PowerPoint template may be used to display four steps of financial analysis. Prove the viability of your ideas using this impressive slide.
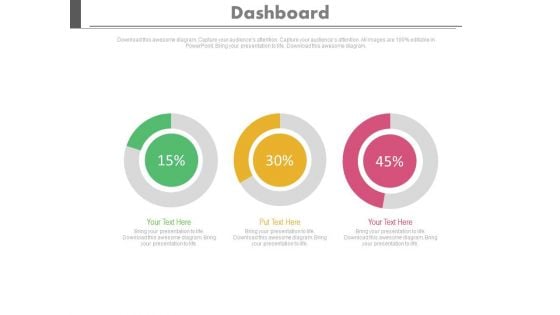
Three Dashboard With Percentage Value Growth Powerpoint Slides
This PowerPoint template has been designed with three dashboards. Use this PPT slide to depict rise in business profit. This professional diagram slide will help you express your views to target audience.
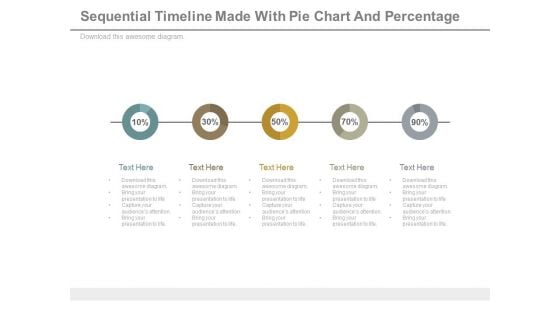
Sequential Timeline Diagram With Percentage Values Powerpoint Slides
This diagram contains graphics of linear circles timeline diagram. Download this diagram slide to display business planning and management. This diagram is editable you can edit text, color, shade and style as per you need.
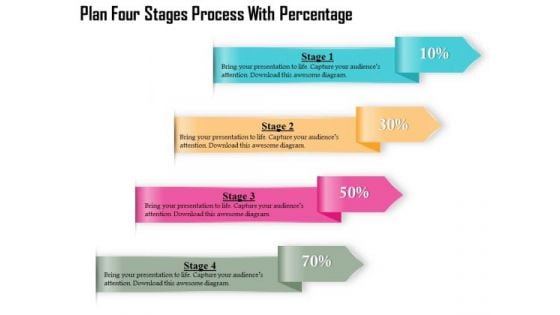
Business Diagram Four Stages Process With Percentage Presentation Template
Four multicolored tags in vertical order has been used to decorate this business diagram. This diagram contains the concept of financial data display with percent values. This diagram can be used for management and finance related presentations.

Business Diagram Three Stages Process Percentage Presentation Template
Three multicolored tags in vertical order has been used to decorate this business diagram. This diagram contains the concept of financial data display with percent values. This diagram can be used for management and finance related presentations.
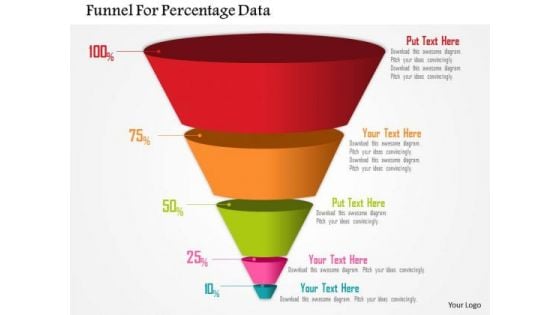
Business Diagram Funnel For Percentage Data Presentation Template
Four staged funnel diagram has been used to design this power point template. This diagram contains the concept of filtration. Present your views and ideas with this impressive image.
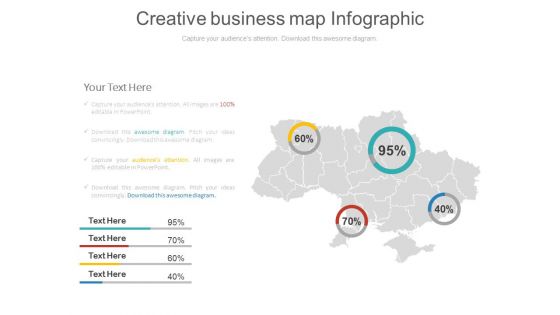
Business Area Map With Percentage Value Powerpoint Slides
This PowerPoint template has been designed with graphics of America map. You may use this map diagram to display sales territories, business and new office locations, travel planning etc in your presentations. Any text can be entered at any point in the PowerPoint map slide.
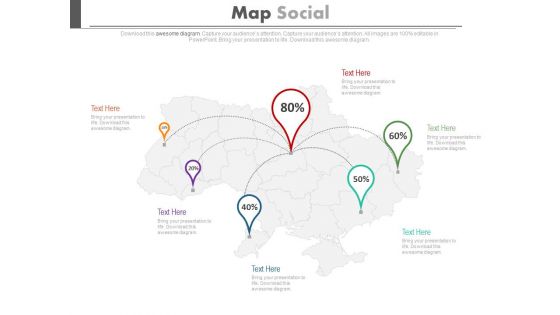
Map With Location Pointers And Percentage Ratios Powerpoint Slides
This PowerPoint map template has been carefully created by our professional team to display location and other geographic details. Each and every property of any region - color, size, shading etc can be modified to help you build an effective PowerPoint presentation. Use this map diagram to display sales territories, business and new office locations, travel planning etc.
Dollar And Percentage Sign On Scale Ppt PowerPoint Presentation Inspiration Guidelines
This is a dollar and percentage sign on scale ppt powerpoint presentation inspiration guidelines. This is a three stage process. The stages in this process are percentage icon, dividend icon, portion icon.
White Percentage Sign In Green Circle Ppt PowerPoint Presentation Outline Templates
This is a white percentage sign in green circle ppt powerpoint presentation outline templates. This is a three stage process. The stages in this process are percentage icon, dividend icon, portion icon.
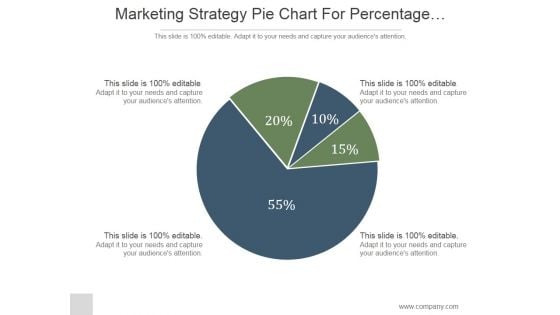
Marketing Strategy Pie Chart For Percentage Comparison Ppt PowerPoint Presentation Ideas
This is a marketing strategy pie chart for percentage comparison ppt powerpoint presentation ideas. This is a four stage process. The stages in this process are marketing, pie, strategy, finance, percentage.
Percentage Symbol And Real Estate PowerPoint Templates And PowerPoint Themes 0712
Percentage Symbol And Real Estate PowerPoint Templates And PowerPoint Themes 0712-Microsoft Powerpoint Templates and Background with percentage symbol and real estate Our Percentage Symbol And Real Estate PowerPoint Templates And PowerPoint Themes 0712 have a feel for it. They automatically create an ambience.
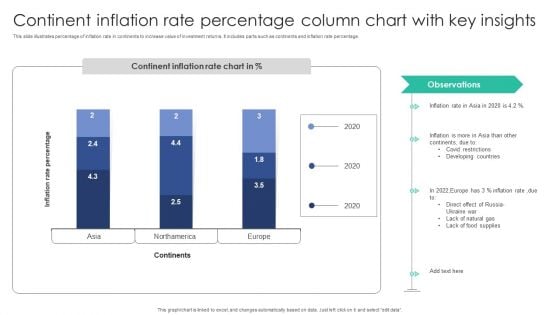
Continent Inflation Rate Percentage Column Chart With Key Insights Topics PDF
This slide illustrates percentage of inflation rate in continents to increase value of investment returns. It includes parts such as continents and inflation rate percentage.Showcasing this set of slides titled Continent Inflation Rate Percentage Column Chart With Key Insights Topics PDF. The topics addressed in these templates are Developing Countries, Covid Restrictions, Food Supplies. All the content presented in this PPT design is completely editable. Download it and make adjustments in color, background, font etc. as per your unique business setting.
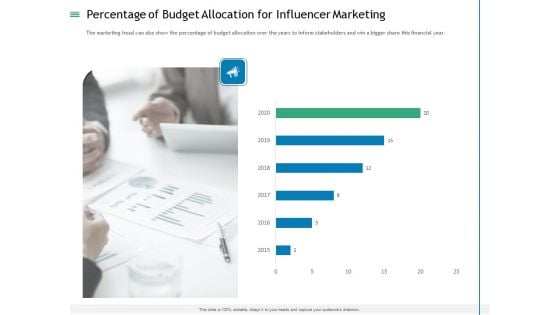
Measuring Influencer Marketing ROI Percentage Of Budget Allocation For Influencer Marketing Inspiration PDF
The marketing head can also show the percentage of budget allocation over the years to inform stakeholders and win a bigger share this financial year. Deliver and pitch your topic in the best possible manner with this measuring influencer marketing roi percentage of budget allocation for influencer marketing inspiration pdf. Use them to share invaluable insights on percentage of budget allocation for influencer marketing and impress your audience. This template can be altered and modified as per your expectations. So, grab it now.
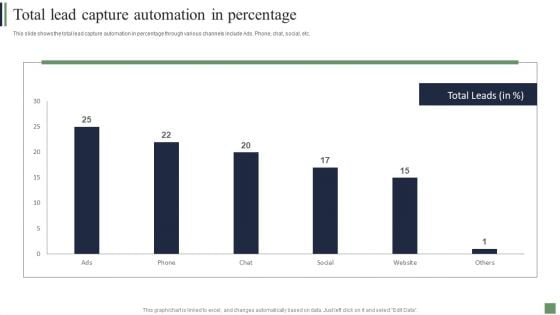
Customer Acquisition Strategies Total Lead Capture Automation In Percentage Summary PDF
This slide shows the total lead capture automation in percentage through various channels include Ads. Phone, chat, social, etc. Deliver and pitch your topic in the best possible manner with this Customer Acquisition Strategies Total Lead Capture Automation In Percentage Summary PDF. Use them to share invaluable insights on Lead Capture Automation, Percentage and impress your audience. This template can be altered and modified as per your expectations. So, grab it now.
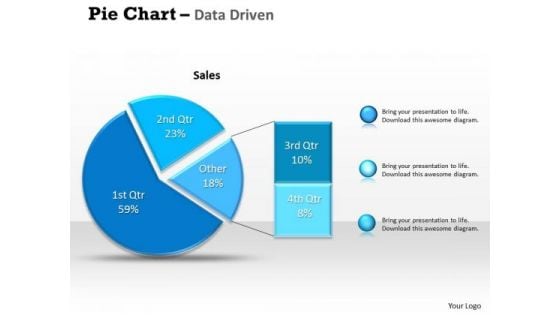
Data Analysis Excel Driven Percentage Breakdown Pie Chart PowerPoint Slides Templates
Be A Donor Of Great Ideas. Display Your Charity On Our data analysis excel driven percentage breakdown pie chart powerpoint slides Templates.
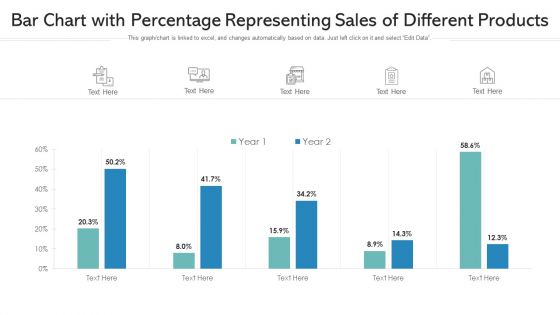
Bar Chart With Percentage Representing Sales Of Different Products Ppt PowerPoint Presentation Gallery Diagrams PDF
Showcasing this set of slides titled bar chart with percentage representing sales of different products ppt powerpoint presentation gallery diagrams pdf. The topics addressed in these templates are bar chart with percentage representing sales of different products. All the content presented in this PPT design is completely editable. Download it and make adjustments in color, background, font etc. as per your unique business setting.
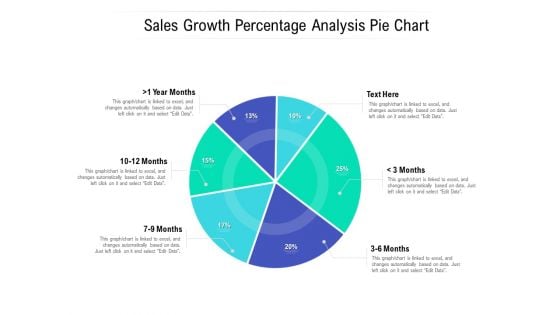
Sales Growth Percentage Analysis Pie Chart Ppt PowerPoint Presentation Summary Skills PDF
Presenting this set of slides with name sales growth percentage analysis pie chart ppt powerpoint presentation summary skills pdf. The topics discussed in these slide is sales growth percentage analysis pie chart. This is a completely editable PowerPoint presentation and is available for immediate download. Download now and impress your audience.
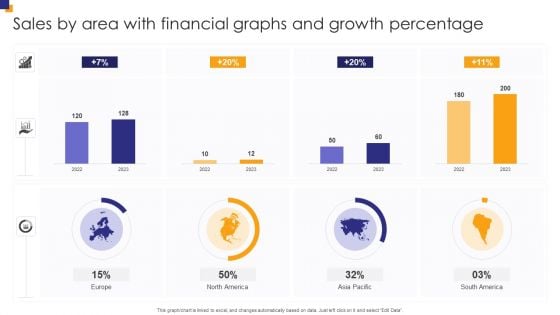
Sales By Area With Financial Graphs And Growth Percentage Inspiration PDF
Pitch your topic with ease and precision using this Sales By Area With Financial Graphs And Growth Percentage Inspiration PDF. This layout presents information on Sales Area, Financial Graphs, Growth Percentage. It is also available for immediate download and adjustment. So, changes can be made in the color, design, graphics or any other component to create a unique layout.
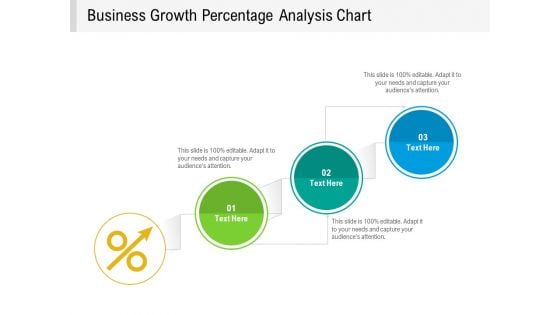
Business Growth Percentage Analysis Chart Ppt PowerPoint Presentation Gallery Pictures PDF
Presenting this set of slides with name business growth percentage analysis chart ppt powerpoint presentation gallery pictures pdf. This is a three stage process. The stages in this process are business growth percentage analysis chart. This is a completely editable PowerPoint presentation and is available for immediate download. Download now and impress your audience.
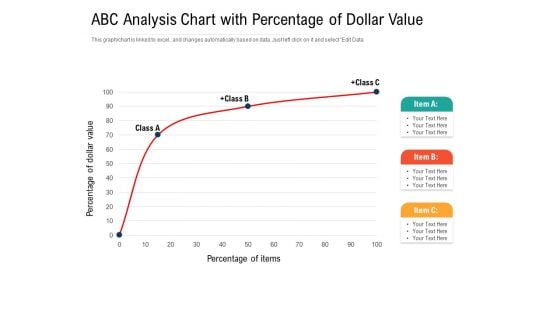
ABC Analysis Chart With Percentage Of Dollar Value Ppt PowerPoint Presentation Gallery Portfolio PDF
Pitch your topic with ease and precision using this abc analysis chart with percentage of dollar value ppt powerpoint presentation gallery portfolio pdf. This layout presents information on abc analysis chart with percentage of dollar value. It is also available for immediate download and adjustment. So, changes can be made in the color, design, graphics or any other component to create a unique layout.
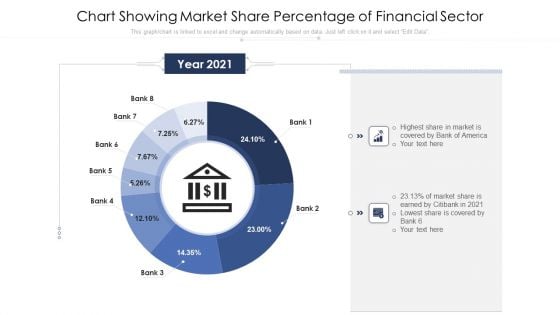
Chart Showing Market Share Percentage Of Financial Sector Ppt PowerPoint Presentation Show Guide PDF
Pitch your topic with ease and precision using this chart showing market share percentage of financial sector ppt powerpoint presentation show guide pdf. This layout presents information on chart showing market share percentage of financial sector. It is also available for immediate download and adjustment. So, changes can be made in the color, design, graphics or any other component to create a unique layout.
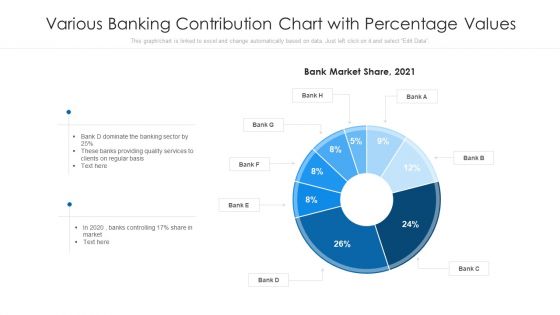
Various Banking Contribution Chart With Percentage Values Ppt PowerPoint Presentation Visual Aids Deck PDF
Pitch your topic with ease and precision using this various banking contribution chart with percentage values ppt powerpoint presentation visual aids deck pdf This layout presents information on various banking contribution chart with percentage values. It is also available for immediate download and adjustment. So, changes can be made in the color, design, graphics or any other component to create a unique layout.
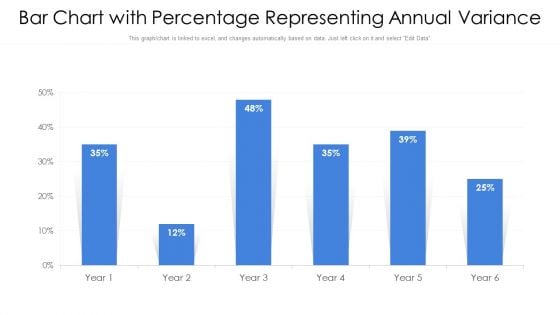
Bar Chart With Percentage Representing Annual Variance Ppt PowerPoint Presentation Gallery Portfolio PDF
Pitch your topic with ease and precision using this bar chart with percentage representing annual variance ppt powerpoint presentation gallery portfolio pdf. This layout presents information on bar chart with percentage representing annual variance. It is also available for immediate download and adjustment. So, changes can be made in the color, design, graphics or any other component to create a unique layout.

Bar Chart With Percentage Representing Inventory Ppt PowerPoint Presentation File Outfit PDF
Pitch your topic with ease and precision using this bar chart with percentage representing inventory ppt powerpoint presentation file outfit pdf. This layout presents information on bar chart with percentage representing inventory. It is also available for immediate download and adjustment. So, changes can be made in the color, design, graphics or any other component to create a unique layout.
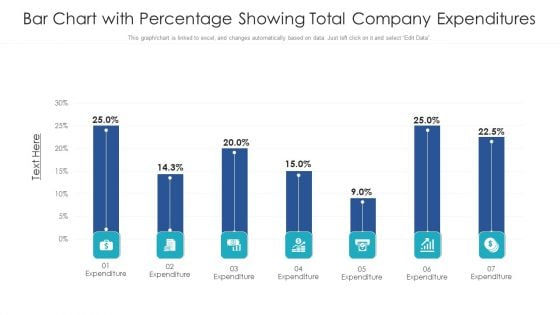
Bar Chart With Percentage Showing Total Company Expenditures Ppt PowerPoint Presentation File Background PDF
Pitch your topic with ease and precision using this bar chart with percentage showing total company expenditures ppt powerpoint presentation file background pdf. This layout presents information on bar chart with percentage showing total company expenditures. It is also available for immediate download and adjustment. So, changes can be made in the color, design, graphics or any other component to create a unique layout.
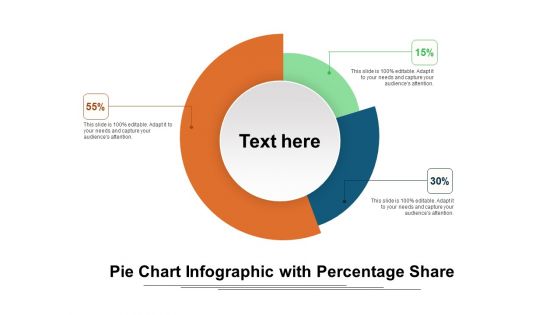
Pie Chart Infographic With Percentage Share Ppt Infographic Template Inspiration PDF
Presenting pie chart infographic with percentage share ppt infographic template inspiration pdf. to dispense important information. This template comprises three stages. It also presents valuable insights into the topics including pie chart infographic with percentage share. This is a completely customizable PowerPoint theme that can be put to use immediately. So, download it and address the topic impactfully.
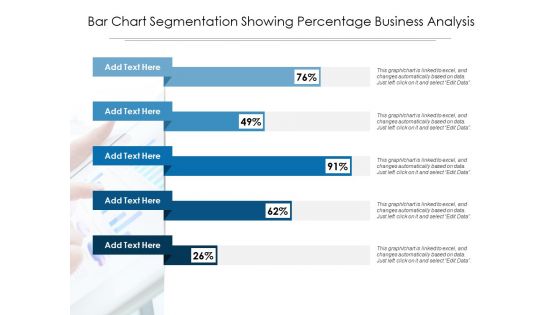
Bar Chart Segmentation Showing Percentage Business Analysis Ppt PowerPoint Presentation Portfolio Sample PDF
Presenting this set of slides with name bar chart segmentation showing percentage business analysis ppt powerpoint presentation portfolio sample pdf. The topics discussed in these slide is bar chart segmentation showing percentage business analysis. This is a completely editable PowerPoint presentation and is available for immediate download. Download now and impress your audience.
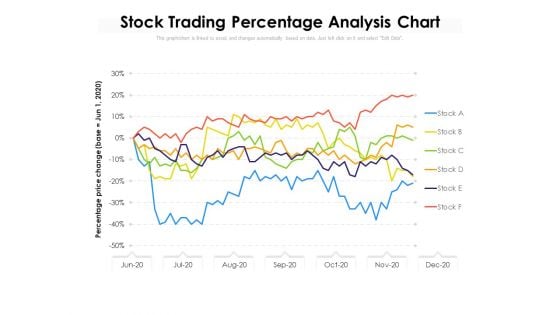
Stock Trading Percentage Analysis Chart Ppt PowerPoint Presentation Slides Files PDF
Presenting this set of slides with name stock trading percentage analysis chart ppt powerpoint presentation slides files pdf. The topics discussed in these slide is stock trading percentage analysis chart. This is a completely editable PowerPoint presentation and is available for immediate download. Download now and impress your audience.
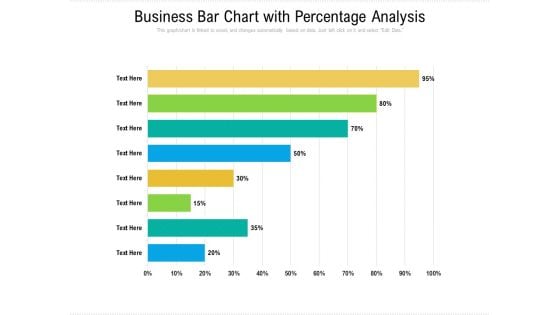
Business Bar Chart With Percentage Analysis Ppt PowerPoint Presentation File Outline PDF
Presenting this set of slides with name business bar chart with percentage analysis ppt powerpoint presentation file outline pdf. The topics discussed in these slide is business bar chart with percentage analysis. This is a completely editable PowerPoint presentation and is available for immediate download. Download now and impress your audience.
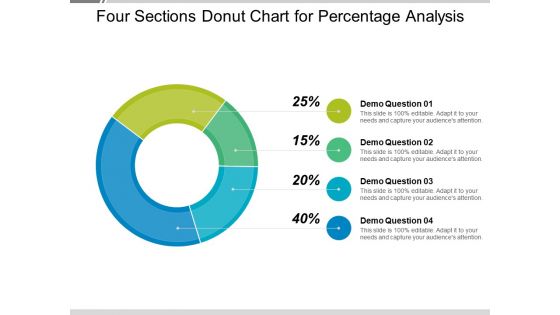
Four Sections Donut Chart For Percentage Analysis Ppt PowerPoint Presentation Styles Portrait PDF
Presenting this set of slides with name four sections donut chart for percentage analysis ppt powerpoint presentation styles portrait pdf. The topics discussed in these slide is four sections donut chart for percentage analysis. This is a completely editable PowerPoint presentation and is available for immediate download. Download now and impress your audience.
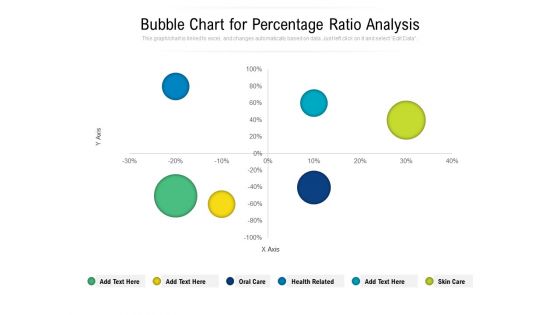
Bubble Chart For Percentage Ratio Analysis Ppt PowerPoint Presentation File Layout PDF
Presenting this set of slides with name bubble chart for percentage ratio analysis ppt powerpoint presentation file layout pdf. The topics discussed in these slide is bubble chart for percentage ratio analysis. This is a completely editable PowerPoint presentation and is available for immediate download. Download now and impress your audience.

 Home
Home