Percentage Icon
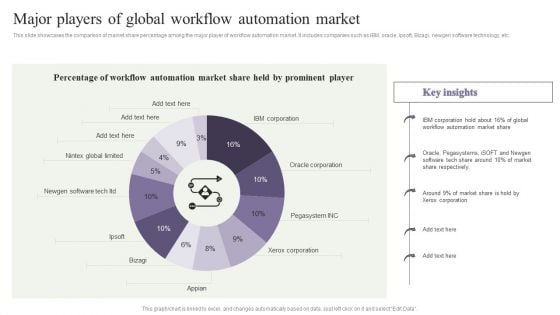
Deployment Of Process Automation To Increase Organisational Performance Major Players Of Global Workflow Themes PDF
This slide showcases the comparison of market share percentage among the major player of workflow automation market. It includes companies such as IBM, oracle, Ipsoft, Bizagi, newgen software technology, etc. Take your projects to the next level with our ultimate collection of Deployment Of Process Automation To Increase Organisational Performance Major Factors Of Implementing Workflow Information PDF. Slidegeeks has designed a range of layouts that are perfect for representing task or activity duration, keeping track of all your deadlines at a glance. Tailor these designs to your exact needs and give them a truly corporate look with your own brand colors they will make your projects stand out from the rest.
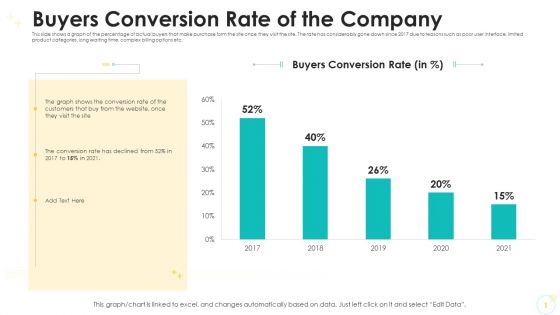
Buyers Conversion Rate Of The Company Themes PDF
This slide shows a graph of the percentage of actual buyers that make purchase form the site once they visit the site. The rate has considerably gone down since 2017 due to reasons such as poor user interface, limited product categories, long waiting time, complex billing options etc. Deliver an awe-inspiring pitch with this creative buyers conversion rate of the company themes pdf. bundle. Topics like buyers conversion rate, 2016 to 2021 can be discussed with this completely editable template. It is available for immediate download depending on the needs and requirements of the user.
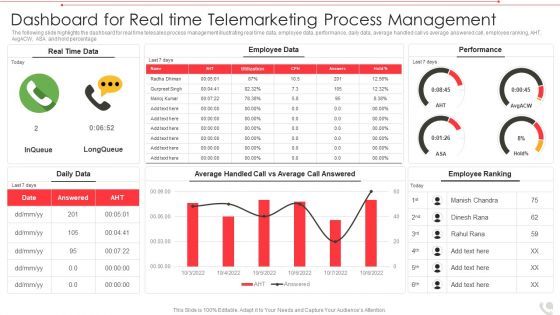
Dashboard For Real Time Telemarketing Process Management Themes PDF
The following slide highlights the dashboard for real time telesales process management illustrating real time data, employee data, performance, daily data, average handled call vs average answered call, employee ranking, AHT, AvgACW, ASA and hold percentage Showcasing this set of slides titled dashboard for real time telemarketing process management themes pdf The topics addressed in these templates are dashboard for real time telemarketing process management All the content presented in this PPT design is completely editable. Download it and make adjustments in color, background, font etc. as per your unique business setting.
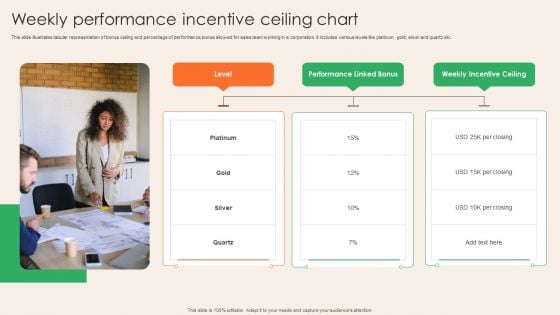
Weekly Performance Incentive Ceiling Chart Demonstration PDF
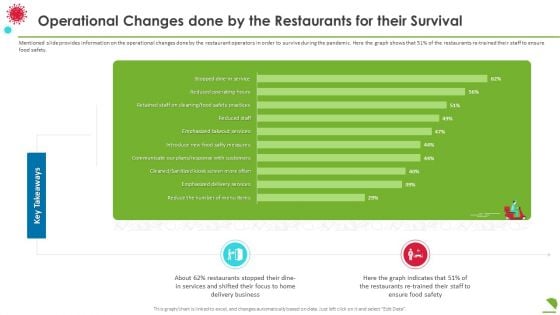
Operational Changes Done By The Restaurants For Their Survival Diagrams PDF
Mentioned slide provides information on the operational changes done by the restaurant operators in order to survive during the pandemic. Here the graph shows that 51 percentage of the restaurants re trained their staff to ensure food safety. Deliver an awe inspiring pitch with this creative operational changes done by the restaurants for their survival diagrams pdf bundle. Topics like business, services, key takeaways can be discussed with this completely editable template. It is available for immediate download depending on the needs and requirements of the user.
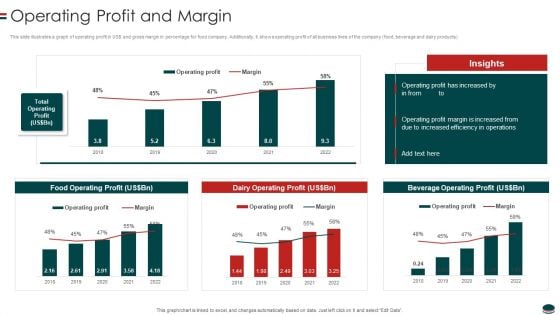
Instant Snacks And Food Firm Details Operating Profit And Margin Themes PDF
This slide illustrates a graph of operating profit in US and gross margin in percentage for food company. Additionally, it shows operating profit of all business lines of the company food, beverage and dairy products.Deliver an awe inspiring pitch with this creative Instant Snacks And Food Firm Details Operating Profit And Margin Themes PDF bundle. Topics like Operating Profit, Increased Efficiency, Beverage Operating can be discussed with this completely editable template. It is available for immediate download depending on the needs and requirements of the user.
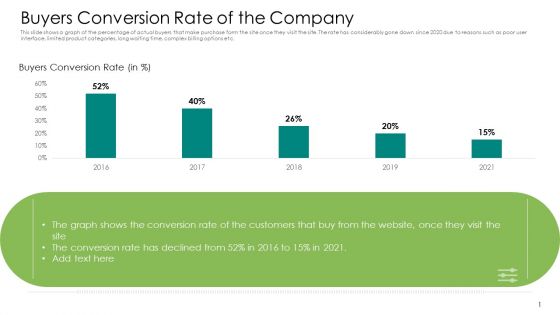
Buyers Conversion Rate Of The Company Diagrams PDF
This slide shows a graph of the percentage of actual buyers that make purchase form the site once they visit the site. The rate has considerably gone down since 2020 due to reasons such as poor user interface, limited product categories, long waiting time, complex billing options etc. Deliver an awe-inspiring pitch with this creative buyers conversion rate of the company diagrams pdf. bundle. Topics like buyers conversion rate, 2016 to 2021 can be discussed with this completely editable template. It is available for immediate download depending on the needs and requirements of the user.
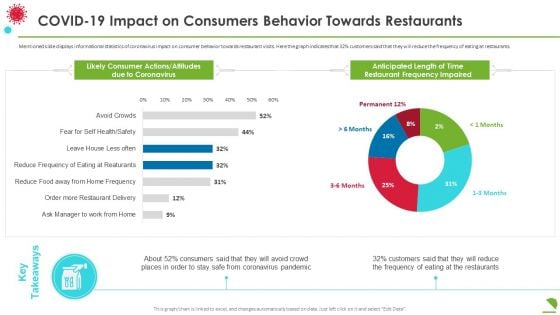
Covid19 Impact On Consumers Behavior Towards Restaurants Diagrams PDF
Mentioned slide displays informational statistics of coronavirus impact on consumer behavior towards restaurant visits. Here the graph indicates that 32 percentage customers said that they will reduce the frequency of eating at restaurants. Deliver an awe inspiring pitch with this creative covid19 impact on consumers behavior towards restaurants diagrams pdf bundle. Topics like covid 19 impact on consumers behavior towards restaurants can be discussed with this completely editable template. It is available for immediate download depending on the needs and requirements of the user.
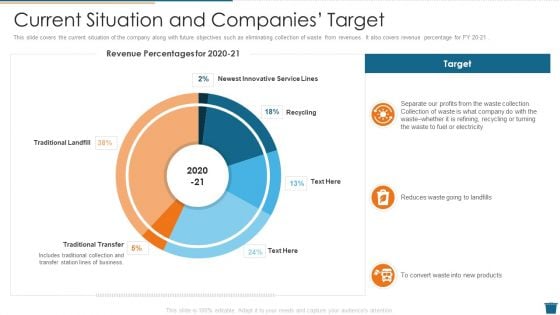
Factory Waste Management Current Situation And Companies Target Diagrams PDF
This slide covers the current situation of the company along with future objectives such as eliminating collection of waste from revenues. It also covers revenue percentage for FY 20 21 . Deliver and pitch your topic in the best possible manner with this factory waste management current situation and companies target diagrams pdf. Use them to share invaluable insights on current situation and companies target and impress your audience. This template can be altered and modified as per your expectations. So, grab it now.
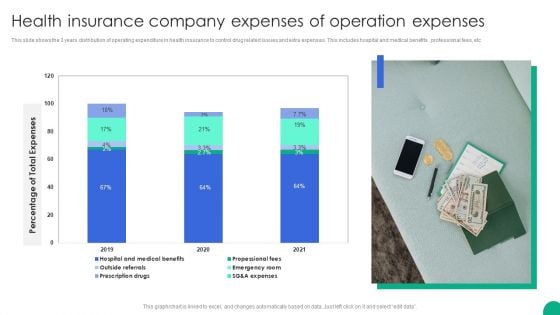
Health Insurance Company Expenses Of Operation Expenses Diagrams PDF
This slide shows the 3 years distribution of operating expenditure in health insurance to control drug related issues and extra expenses. This includes hospital and medical benefits , professional fees, etc.Showcasing this set of slides titled Health Insurance Company Expenses Of Operation Expenses Diagrams PDF. The topics addressed in these templates are Percentage Total Expenses, Propessional Fees, Emergency Room. All the content presented in this PPT design is completely editable. Download it and make adjustments in color, background, font etc. as per your unique business setting.
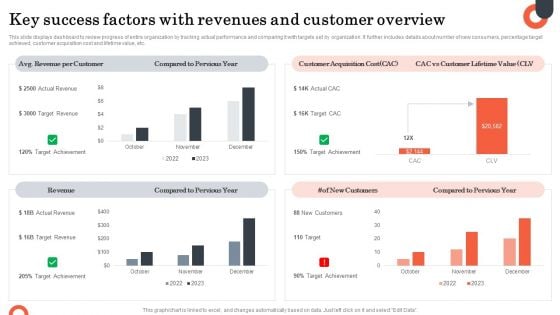
Key Success Factors With Revenues And Customer Overview Diagrams PDF
This slide displays dashboard to review progress of entire organization by tracking actual performance and comparing it with targets set by organization. It further includes details about number of new consumers, percentage target achieved, customer acquisition cost and lifetime value, etc. Showcasing this set of slides titled Key Success Factors With Revenues And Customer Overview Diagrams PDF. The topics addressed in these templates are Compared Pervious Year, Customer Acquisition Cost. All the content presented in this PPT design is completely editable. Download it and make adjustments in color, background, font etc. as per your unique business setting.
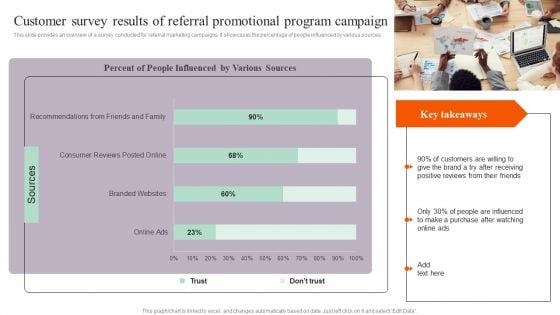
Customer Survey Results Of Referral Promotional Program Campaign Diagrams PDF
This slide provides an overview of a survey conducted for referral marketing campaigns. It showcases the percentage of people influenced by various sources. Slidegeeks is one of the best resources for PowerPoint templates. You can download easily and regulate Customer Survey Results Of Referral Promotional Program Campaign Diagrams PDF for your personal presentations from our wonderful collection. A few clicks is all it takes to discover and get the most relevant and appropriate templates. Use our Templates to add a unique zing and appeal to your presentation and meetings. All the slides are easy to edit and you can use them even for advertisement purposes.
Ppt 3d Men Standing On New Business PowerPoint Presentation Pie Chart Templates
PPT 3d men standing on new business powerpoint presentation pie chart Templates-This 3D Business PowerPoint Diagram consists of men standing on circle representing their percentage of work and growth individually. This Diagram will fit for Business Presentations.-PPT 3d men standing on new business powerpoint presentation pie chart Templates-Adult, Art, Background, Business, Career, Chart, Communication, Concept, Conference, Corporate, Creative, Design, Economy, Executive, Finance, Group, Growth, Idea, Illustration, Leadership, Meeting, New, Occupation, Office, People, Person, Progress, Silhouette, Space, Speaking, Standing, Success Our Ppt 3d Men Standing On New Business PowerPoint Presentation Pie Chart Templates epitomize your personality. They bring to life your firm beliefs.
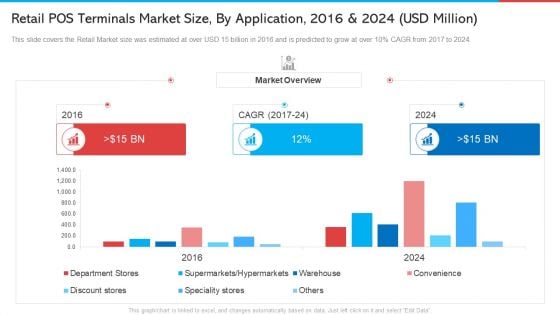
Retail POS Terminals Market Size By Application 2016 And 2024 USD Million Themes PDF
This slide covers the Retail Market size was estimated at over USD 15 billion in 2016 and is predicted to grow at over 10 percentage CAGR from 2017 to 2024. Deliver and pitch your topic in the best possible manner with this retail pos terminals market size by application 2016 and 2024 usd million themes pdf. Use them to share invaluable insights on retail pos terminals market size, by application, 2016 and 2024 usd million and impress your audience. This template can be altered and modified as per your expectations. So, grab it now.
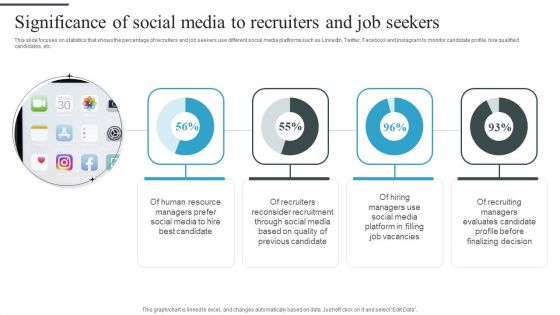
Tactical Process For Social Significance Of Social Media To Recruiters And Job Seekers Themes PDF
This slide focuses on statistics that shows the percentage of recruiters and job seekers use different social media platforms such as LinkedIn, Twitter, Facebook and Instagram to monitor candidate profile, hire qualified candidates, etc. Deliver an awe inspiring pitch with this creative Tactical Process For Social Significance Of Social Media To Recruiters And Job Seekers Themes PDF bundle. Topics like Human Resource, Best Candidate, Social Media can be discussed with this completely editable template. It is available for immediate download depending on the needs and requirements of the user.
Ppt Group Of World Business PowerPoint Slide Text People With 3d Pie Chart Templates
PPT group of world business powerpoint slide text people with 3d pie chart Templates-This 3D Business PowerPoint Diagram consists of group of people standing on circle representing the growth percentage of individual Business perspective. This Diagram will fit for Business Presentations.-PPT group of world business powerpoint slide text people with 3d pie chart Templates-Abstract, Arrow, Art, Artistic, Background, Business, Colorful, Communication, Computer-Graphics, Concept, Creation, Data, Decoration, Decorative, Design, Design-Element, Digital, Direction, Effect, Elegance, Element, Energy, Flow, Go, Idea, Illustration, Modern, Movement, Network, Symbol Some in your community may have fallen on bad times. Comfort them with our Ppt Group Of World Business PowerPoint Slide Text People With 3d Pie Chart Templates.
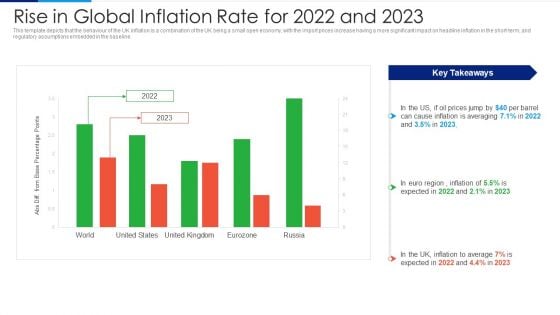
Russia Ukraine Conflict Effect Rise In Global Inflation Rate For 2022 And 2023 Diagrams PDF
This template depicts that the behaviour of the UK inflation is a combination of the UK being a small open economy, with the import prices increase having a more significant impact on headline inflation in the short-term, and regulatory assumptions embedded in the baseline. Deliver and pitch your topic in the best possible manner with this Russia Ukraine Conflict Effect Rise In Global Inflation Rate For 2022 And 2023 Diagrams PDF. Use them to share invaluable insights on Inflation To Average, 2022 To 2023, Abs Diff From Base Percentage Points and impress your audience. This template can be altered and modified as per your expectations. So, grab it now.
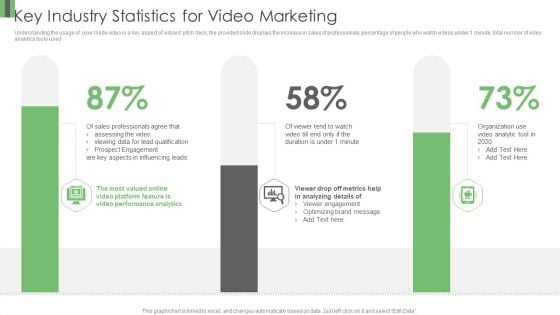
Vidyard Elevator Funding Key Industry Statistics For Video Marketing Ppt Show Diagrams PDF
Understanding the usage of user made video is a key aspect of vidyard pitch deck, the provided slide displays the increase in sales of professionals, percentage of people who watch videos under 1 minute, total number of video analytics tools used . Deliver an awe inspiring pitch with this creative Vidyard Elevator Funding Key Industry Statistics For Video Marketing Ppt Show Diagrams PDF bundle. Topics like Sales Professionals Agree, Prospect Engagement, Valued Online can be discussed with this completely editable template. It is available for immediate download depending on the needs and requirements of the user.
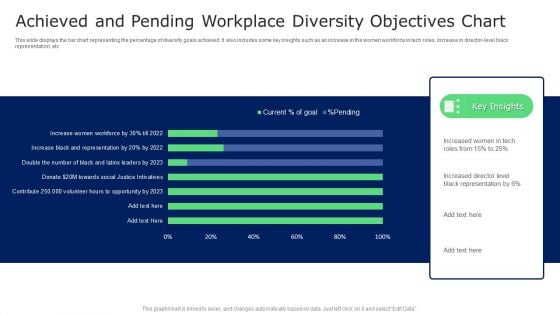
Achieved And Pending Workplace Diversity Objectives Chart Guidelines PDF
This slide displays the bar chart representing the percentage of diversity goals achieved. It also includes some key insights such as an increase in the women workforce in tech roles, increase in director level black representation, etc. Showcasing this set of slides titled Achieved And Pending Workplace Diversity Objectives Chart Guidelines PDF. The topics addressed in these templates are Achieved And Pending Workplace, Diversity Objectives Chart. All the content presented in this PPT design is completely editable. Download it and make adjustments in color, background, font etc. as per your unique business setting.
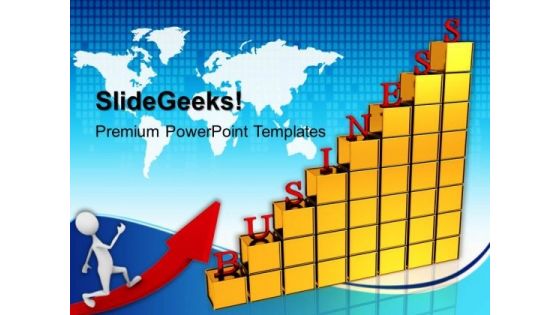
A Corporate Business Growth Graph PowerPoint Templates And PowerPoint Themes 1012
A Corporate Business Growth Graph PowerPoint Templates And PowerPoint Themes 1012-This PowerPoint Template shows the Bar Graph with increasing percentage which signifies the Financial or Business Growth. The Template signifies business concept. It signifies teamwork and team leader. Use this template for Global Business. The structure of our templates allows you to effectively highlight the key issues concerning the growth of your business.-A Corporate Business Growth Graph PowerPoint Templates And PowerPoint Themes 1012-This PowerPoint template can be used for presentations relating to-Business bar graph chart, technology, finance, arrows, business, success Our A Corporate Business Growth Graph PowerPoint Templates And PowerPoint Themes 1012 encourage an ethical approach. Exhort your team to stay above board.
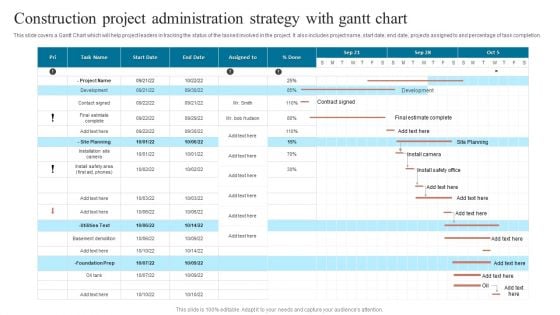
Construction Project Administration Strategy With Gantt Chart Topics PDF
This slide covers a Gantt Chart which will help project leaders in tracking the status of the tasked involved in the project. It also includes project name, start date, end date, projects assigned to and percentage of task completion.Pitch your topic with ease and precision using this Construction Project Administration Strategy With Gantt Chart Topics PDF. This layout presents information on Estimate Complete, Basement Demolition, Contract Signed. It is also available for immediate download and adjustment. So, changes can be made in the color, design, graphics or any other component to create a unique layout.
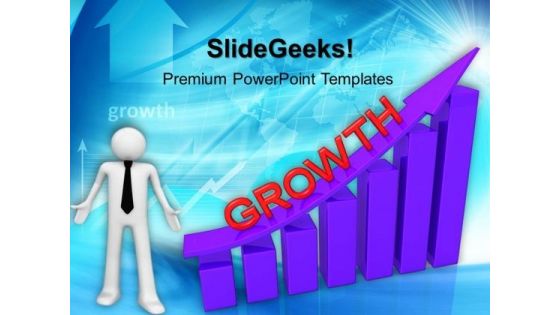
Growth Graph Moving Up PowerPoint Templates And PowerPoint Themes 1012
Growth Graph Moving Up PowerPoint Templates And PowerPoint Themes 1012-This PowerPoint Template shows the Bar Graph with increasing percentage which signifies the Financial Growth. The Template signifies the concept of Team Work, Team Leader etc. The structure of our templates allows you to effectively highlight the key issues concerning the growth of your business.-Growth Graph Moving Up PowerPoint Templates And PowerPoint Themes 1012-This PowerPoint template can be used for presentations relating to-Business graph with rising arrow, success, business, arrows, marketing, finance Our Growth Graph Moving Up PowerPoint Templates And PowerPoint Themes 1012 are clear to even the farthest. They are designed for distance.
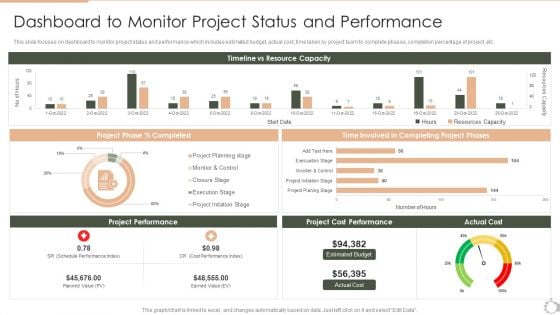
Techniques For Timely Project Dashboard To Monitor Project Status And Performance Microsoft PDF
This slide focuses on dashboard to monitor project status and performance which includes estimated budget, actual cost, time taken by project team to complete phases, completion percentage of project, etc. Deliver and pitch your topic in the best possible manner with this Techniques For Timely Project Dashboard To Monitor Project Status And Performance Microsoft PDF. Use them to share invaluable insights on Timeline vs, Resource Capacity, Project Phase, Time Involved and impress your audience. This template can be altered and modified as per your expectations. So, grab it now.
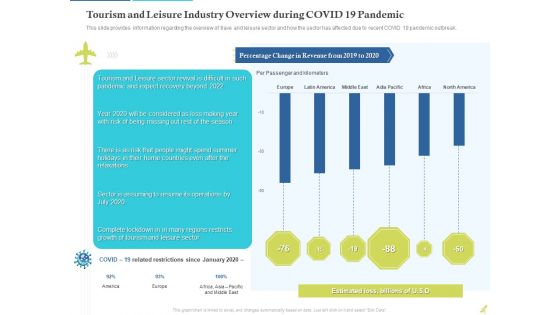
Rebuilding Travel Industry After COVID 19 Tourism And Leisure Industry Overview During COVID 19 Pandemic Diagrams PDF
This slide provides information regarding the overview of trave and leisure sector and how the sector has affected due to recent COVID 19 pandemic outbreak.Deliver an awe inspiring pitch with this creative rebuilding travel industry after COVID 19 tourism and leisure industry overview during covid 19 pandemic diagrams pdf. bundle. Topics like percentage change in revenue from 2019 to 2020, estimated loss, billions can be discussed with this completely editable template. It is available for immediate download depending on the needs and requirements of the user.
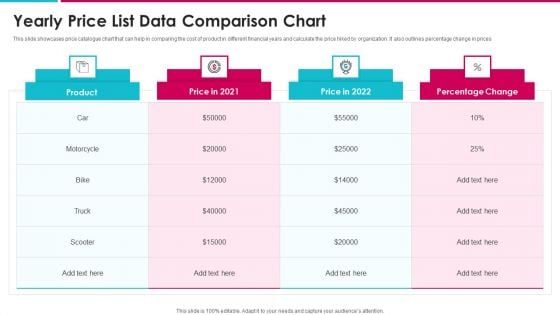
Yearly Price List Data Comparison Chart Structure PDF
This slide showcases price catalogue chart that can help in comparing the cost of product in different financial years and calculate the price hiked by organization. It also outlines percentage change in prices Showcasing this set of slides titled yearly price list data comparison chart structure pdf. The topics addressed in these templates are yearly price list data comparison chart. All the content presented in this PPT design is completely editable. Download it and make adjustments in color, background, font etc. as per your unique business setting.
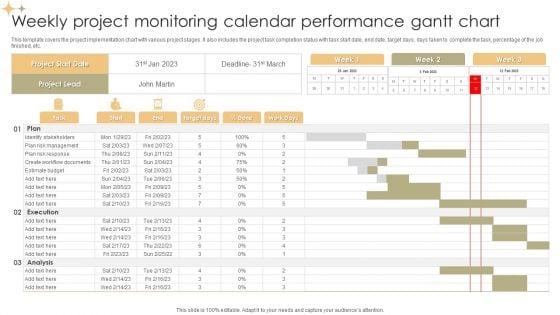
Weekly Project Monitoring Calendar Performance Gantt Chart Formats PDF
This template covers the project implementation chart with various project stages. It also includes the project task completion status with task start date, end date, target days, days taken to complete the task, percentage of the job finished, etc. Showcasing this set of slides titled Weekly Project Monitoring Calendar Performance Gantt Chart Formats PDF. The topics addressed in these templates are Plan, Execution, Analysis. All the content presented in this PPT design is completely editable. Download it and make adjustments in color, background, font etc. as per your unique business setting.
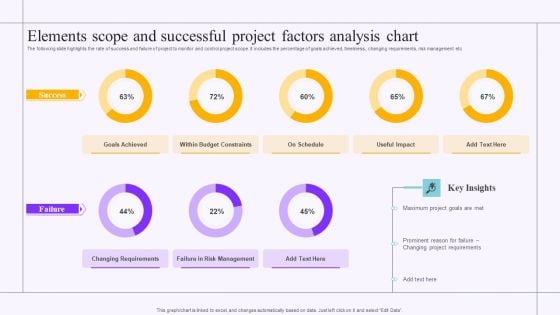
Elements Scope And Successful Project Factors Analysis Chart Sample PDF
The following slide highlights the rate of success and failure of project to monitor and control project scope. It includes the percentage of goals achieved, timeliness, changing requirements, risk management etc. Showcasing this set of slides titled Elements Scope And Successful Project Factors Analysis Chart Sample PDF. The topics addressed in these templates are Goals Achieved, Budget Constraints, Project Requirements. All the content presented in this PPT design is completely editable. Download it and make adjustments in color, background, font etc. as per your unique business setting.
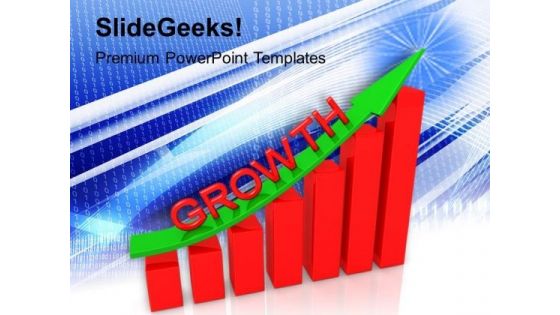
Business Graph Up PowerPoint Templates And PowerPoint Themes 1012
Business Graph Up PowerPoint Templates And PowerPoint Themes 1012-This PowerPoint Template shows the Bar Graph with increasing percentage which signifies the Financial Growth. The Template signifies the concept of Team Work, Team Leader etc. The structure of our templates allows you to effectively highlight the key issues concerning the growth of your business.-Business Graph Up PowerPoint Templates And PowerPoint Themes 1012-This PowerPoint template can be used for presentations relating to-Business graph, success, arrows, business, signs, shapes Disentangle the web with our Business Graph Up PowerPoint Templates And PowerPoint Themes 1012. Seperate the various strands of thought.
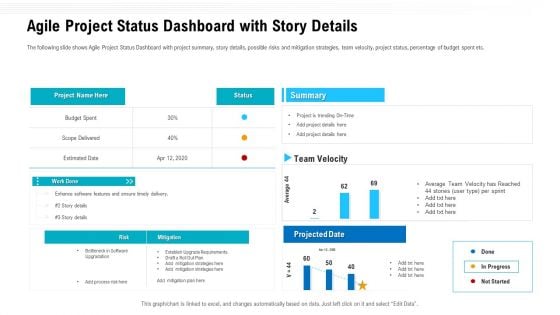
Team Performance Improvement Functional Optimization Through Agile Methodologies Agile Project Status Dashboard With Story Details Diagrams PDF
The following slide shows Agile Project Status Dashboard with project summary, story details, possible risks and mitigation strategies, team velocity, project status, percentage of budget spent etc. Deliver and pitch your topic in the best possible manner with this team performance improvement functional optimization through agile methodologies agile project status dashboard with story details diagrams pdf. Use them to share invaluable insights on agile project status dashboard with story details and impress your audience. This template can be altered and modified as per your expectations. So, grab it now.
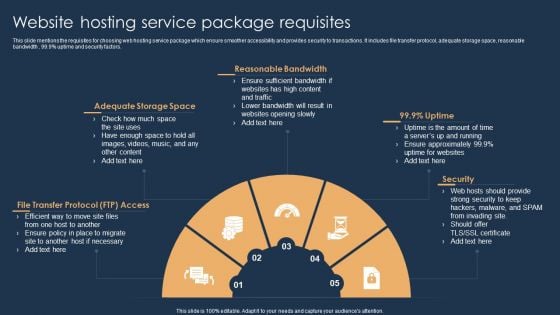
Website Hosting Service Package Requisites Themes PDF
This slide mentions the requisites for choosing web hosting service package which ensure smoother accessibility and provides security to transactions. It includes file transfer protocol, adequate storage space, reasonable bandwidth , 99.9 percentage uptime and security factors. Persuade your audience using this Website Hosting Service Package Requisites Themes PDF. This PPT design covers five stages, thus making it a great tool to use. It also caters to a variety of topics including Adequate Storage Space, Reasonable Bandwidth, Transfer Protocol. Download this PPT design now to present a convincing pitch that not only emphasizes the topic but also showcases your presentation skills.
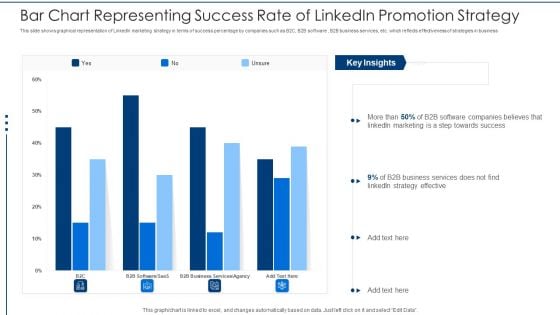
Bar Chart Representing Success Rate Of Linkedin Promotion Strategy Rules PDF
This slide shows graphical representation of LinkedIn marketing strategy in terms of success percentage by companies such as B2C, B2B software , B2B business services, etc. which reflects effectiveness of strategies in business Pitch your topic with ease and precision using this bar chart representing success rate of linkedin promotion strategy rules pdf. This layout presents information on bar chart representing success rate of linkedin promotion strategy. It is also available for immediate download and adjustment. So, changes can be made in the color, design, graphics or any other component to create a unique layout.
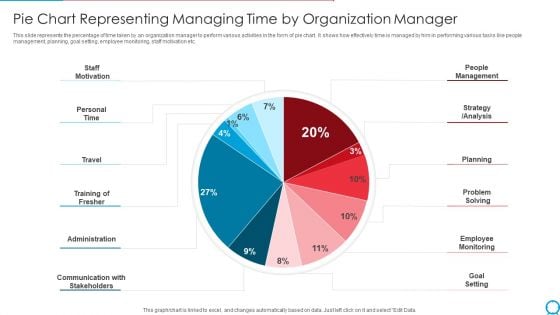
Pie Chart Representing Managing Time By Organization Manager Ppt PowerPoint Presentation Gallery Template PDF
This slide represents the percentage of time taken by an organization manager to perform various activities in the form of pie chart. It shows how effectively time is managed by him in performing various tasks like people management, planning, goal setting, employee monitoring, staff motivation etc. Pitch your topic with ease and precision using this pie chart representing managing time by organization manager ppt powerpoint presentation gallery template pdf. This layout presents information on staff motivation, personal time, travel training of fresher, administration. It is also available for immediate download and adjustment. So, changes can be made in the color, design, graphics or any other component to create a unique layout.
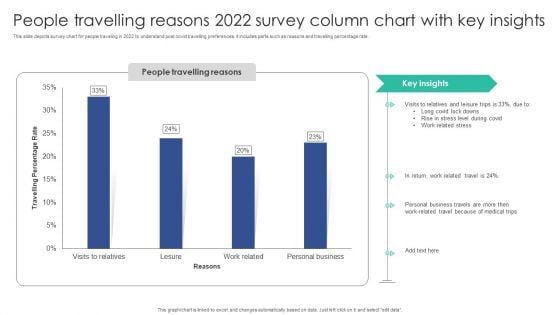
People Travelling Reasons 2022 Survey Column Chart With Key Insights Sample PDF
This slide depicts survey chart for people traveling in 2022 to understand post covid travelling preferences. It includes parts such as reasons and travelling percentage rate.Pitch your topic with ease and precision using this People Travelling Reasons 2022 Survey Column Chart With Key Insights Sample PDF. This layout presents information on Visits Relatives, Leisure Trips, Personal Business. It is also available for immediate download and adjustment. So, changes can be made in the color, design, graphics or any other component to create a unique layout.
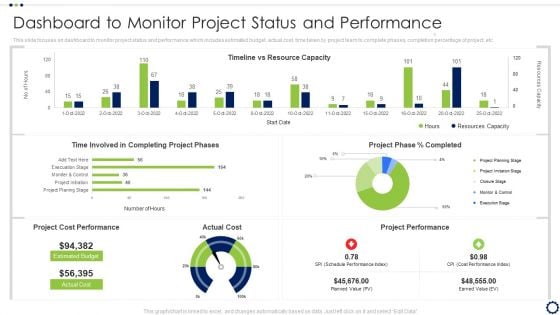
Coordinating Distinct Activities For Effective Project Time Management Dashboard To Monitor Project Portrait PDF
This slide focuses on dashboard to monitor project status and performance which includes estimated budget, actual cost, time taken by project team to complete phases, completion percentage of project, etc.Deliver and pitch your topic in the best possible manner with this Coordinating Distinct Activities For Effective Project Time Management Dashboard To Monitor Project Portrait PDF Use them to share invaluable insights on Project Performance, Cost Performance, Completing Project and impress your audience. This template can be altered and modified as per your expectations. So, grab it now.
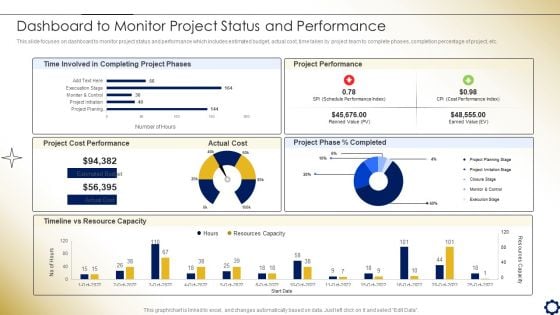
Project Time Management To Enhance Productivity Dashboard To Monitor Project Status And Performance Background PDF
This slide focuses on dashboard to monitor project status and performance which includes estimated budget, actual cost, time taken by project team to complete phases, completion percentage of project, etc.Deliver and pitch your topic in the best possible manner with this Project Time Management To Enhance Productivity Dashboard To Monitor Project Status And Performance Background PDF. Use them to share invaluable insights on Time Involved, Completing Project, Project Performance and impress your audience. This template can be altered and modified as per your expectations. So, grab it now.

Time Management Techniques For Successful Project Dashboard To Monitor Project Status And Performance Brochure PDF
This slide focuses on dashboard to monitor project status and performance which includes estimated budget, actual cost, time taken by project team to complete phases, completion percentage of project, etc.Deliver and pitch your topic in the best possible manner with this Time Management Techniques For Successful Project Dashboard To Monitor Project Status And Performance Brochure PDF. Use them to share invaluable insights on Project Performance, Cost Performance, Completing Project and impress your audience. This template can be altered and modified as per your expectations. So, grab it now.
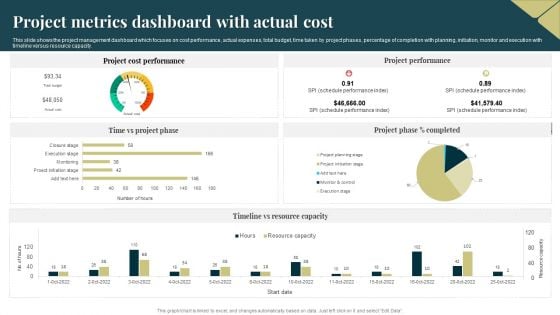
Project Metrics Dashboard With Actual Cost Background PDF
This slide shows the project management dashboard which focuses on cost performance, actual expenses, total budget, time taken by project phases, percentage of completion with planning, initiation, monitor and execution with timeline versus resource capacity. Showcasing this set of slides titled Project Metrics Dashboard With Actual Cost Background PDF. The topics addressed in these templates are Project Cost Performance, Project Performance, Resource Capacity. All the content presented in this PPT design is completely editable. Download it and make adjustments in color, background, font etc. as per your unique business setting.
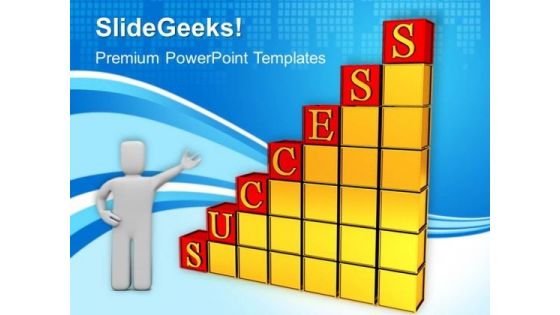
Business Success Graph PowerPoint Templates And PowerPoint Themes 1012
Business Success Graph PowerPoint Templates And PowerPoint Themes 1012-The PowerPoint Template shows the Growing Percentage Graph with each letter of Success on each step. This template portrays the concepts of winning, leadership, Finance, Success, competition, sports, business, shapes, people and abstract.-Business Success Graph PowerPoint Templates And PowerPoint Themes 1012-This PowerPoint template can be used for presentations relating to-Business graph showing growth, success, business, finance, marketing, stairs Soak in the energy our Business Success Graph PowerPoint Templates And PowerPoint Themes 1012 emit. Your thoughts will find them exhilirating.
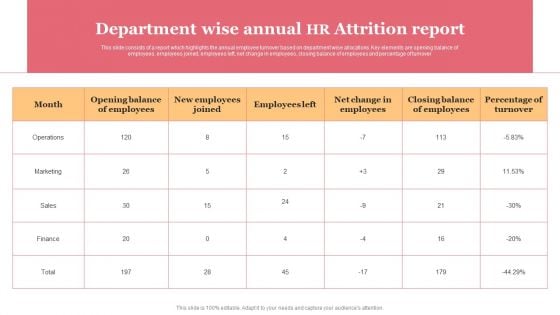
Department Wise Annual HR Attrition Report Themes PDF
This slide consists of a report which highlights the annual employee turnover based on department wise allocations. Key elements are opening balance of employees, employees joined, employees left, net change in employees, closing balance of employees and percentage of turnover. Pitch your topic with ease and precision using this Department Wise Annual HR Attrition Report Themes PDF. This layout presents information on Marketing, Operations, Finance, Sales. It is also available for immediate download and adjustment. So, changes can be made in the color, design, graphics or any other component to create a unique layout.
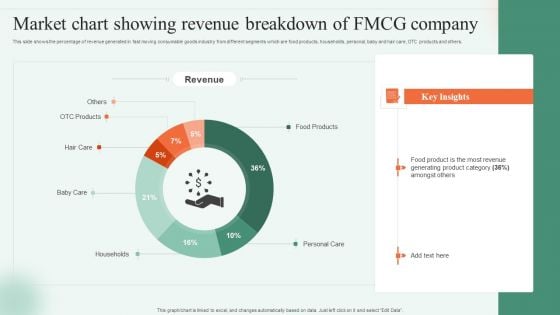
Market Chart Showing Revenue Breakdown Of FMCG Company Ppt Layouts Layouts PDF
This slide shows the percentage of revenue generated in fast moving consumable goods industry from different segments which are food products, households, personal, baby and hair care, OTC products and others. Showcasing this set of slides titled Market Chart Showing Revenue Breakdown Of FMCG Company Ppt Layouts Layouts PDF. The topics addressed in these templates are Food Products, Personal Care, Households. All the content presented in this PPT design is completely editable. Download it and make adjustments in color, background, font etc. as per your unique business setting.
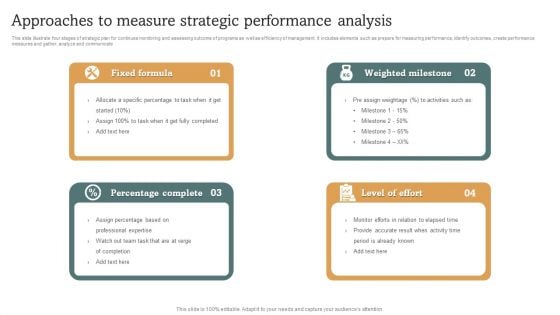
Approaches To Measure Strategic Performance Analysis Themes PDF
This slide illustrate four stages of strategic plan for continues monitoring and assessing outcome of programs as well as efficiency of management. It includes elements such as prepare for measuring performance, identify outcomes, create performance measures and gather, analyze and communicate. Presenting Approaches To Measure Strategic Performance Analysis Themes PDF to dispense important information. This template comprises four stages. It also presents valuable insights into the topics including Fixed Formula, Weighted Milestone, Level Of Effort, Percentage Complete. This is a completely customizable PowerPoint theme that can be put to use immediately. So, download it and address the topic impactfully.
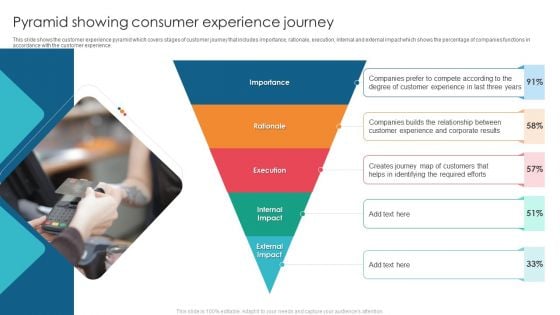
Pyramid Showing Consumer Experience Journey Diagrams PDF
This slide shows the customer experience pyramid which covers stages of customer journey that includes importance, rationale, execution, internal and external impact which shows the percentage of companies functions in accordance with the customer experience. Persuade your audience using this Pyramid Showing Consumer Experience Journey Diagrams PDF. This PPT design covers five stages, thus making it a great tool to use. It also caters to a variety of topics including Execution, Internal Impact, External Impact. Download this PPT design now to present a convincing pitch that not only emphasizes the topic but also showcases your presentation skills.
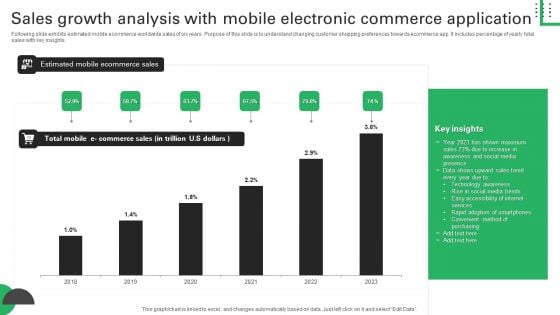
Sales Growth Analysis With Mobile Electronic Commerce Application Structure PDF
Following slide exhibits estimated mobile ecommerce worldwide sales of six years. Purpose of this slide is to understand changing customer shopping preferences towards ecommerce app. It includes percentage of yearly total sales with key insights. Pitch your topic with ease and precision using this Sales Growth Analysis With Mobile Electronic Commerce Application Structure PDF. This layout presents information on Shown Maximum, Awareness Social Media, Accessibility Internet. It is also available for immediate download and adjustment. So, changes can be made in the color, design, graphics or any other component to create a unique layout.
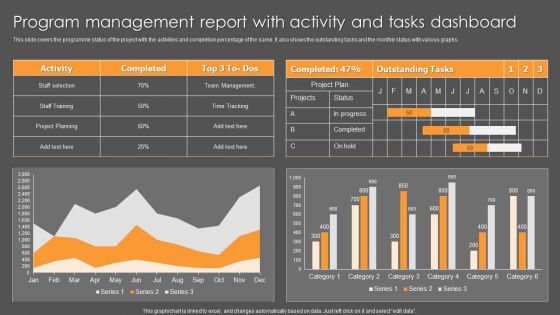
Program Management Report With Activity And Tasks Dashboard Ppt File Objects PDF
This slide covers the programme status of the project with the activities and completion percentage of the same. It also shows the outstanding tasks and the monthly status with various graphs. Pitch your topic with ease and precision using this Program Management Report With Activity And Tasks Dashboard Ppt File Objects PDF. This layout presents information on Activity, Team Management, Time Tracking. It is also available for immediate download and adjustment. So, changes can be made in the color, design, graphics or any other component to create a unique layout.
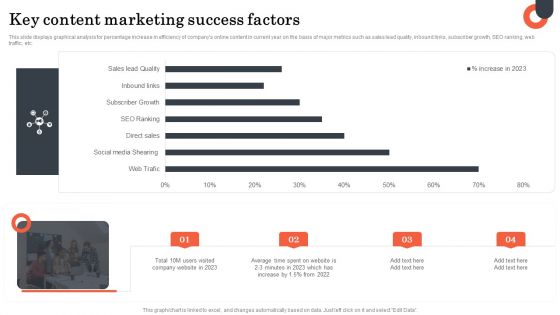
Key Content Marketing Success Factors Microsoft PDF
This slide displays graphical analysis for percentage increase in efficiency of companys online content in current year on the basis of major metrics such as sales lead quality, inbound links, subscriber growth, SEO ranking, web traffic, etc. Pitch your topic with ease and precision using this Key Content Marketing Success Factors Microsoft PDF. This layout presents information on Key Content, Marketing Success Factors. It is also available for immediate download and adjustment. So, changes can be made in the color, design, graphics or any other component to create a unique layout.
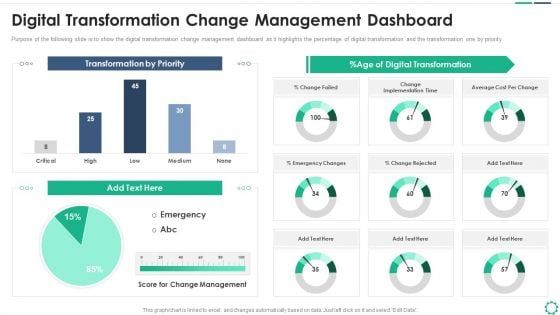
Digitalization Plan For Business Modernization Digital Transformation Change Management Dashboard Infographics PDF
Purpose of the following slide is to show the digital transformation change management dashboard as it highlights the percentage of digital transformation and the transformation one by priority. Deliver and pitch your topic in the best possible manner with this digitalization plan for business modernization digital transformation change management dashboard infographics pdf. Use them to share invaluable insights on transformation by priority, percent age of digital transformation and impress your audience. This template can be altered and modified as per your expectations. So, grab it now.
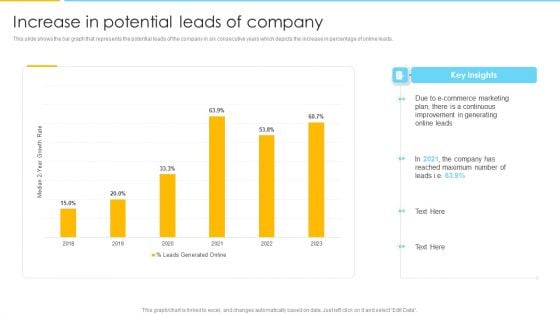
Optimizing Ecommerce Marketing Plan To Improve Sales Increase In Potential Leads Of Company Background PDF
This slide shows the bar graph that represents the potential leads of the company in six consecutive years which depicts the increase in percentage of online leads. Deliver an awe inspiring pitch with this creative Optimizing Ecommerce Marketing Plan To Improve Sales Increase In Potential Leads Of Company Background PDF bundle. Topics like E Commerce Marketing Plan, Potential Leads Of Company can be discussed with this completely editable template. It is available for immediate download depending on the needs and requirements of the user.
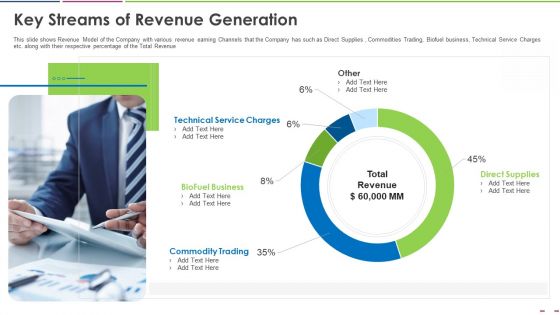
Investor Deck To Increase Grant Funds From Public Corporation Key Streams Of Revenue Generation Guidelines PDF
This slide shows Revenue Model of the Company with various revenue earning Channels that the Company has such as Direct Supplies , Commodities Trading, Biofuel business, Technical Service Charges etc. along with their respective percentage of the Total Revenue. Deliver an awe-inspiring pitch with this creative investor deck to increase grant funds from public corporation key streams of revenue generation guidelines pdf. bundle. Topics like technical service charges, biofuel business, commodity trading, direct supplies can be discussed with this completely editable template. It is available for immediate download depending on the needs and requirements of the user.
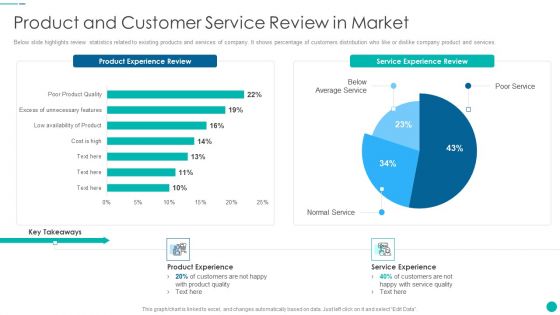
Tactical Procedure For Increasing Customer Intimacy Product And Customer Service Review In Market Microsoft PDF
Below slide highlights review statistics related to existing products and services of company. It shows percentage of customers distribution who like or dislike company product and services. Deliver and pitch your topic in the best possible manner with this tactical procedure for increasing customer intimacy product and customer service review in market microsoft pdf. Use them to share invaluable insights on service experience review, product experience review and impress your audience. This template can be altered and modified as per your expectations. So, grab it now.
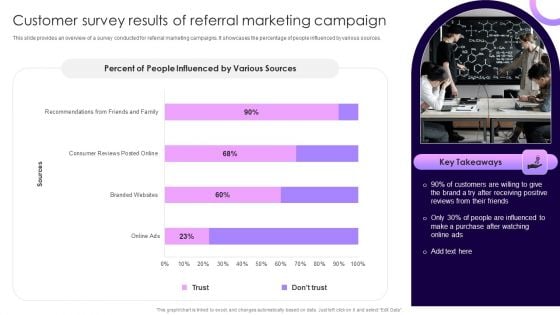
Traditional Marketing Guide To Increase Audience Engagement Customer Survey Results Of Referral Marketing Campaign Summary PDF
This slide provides an overview of a survey conducted for referral marketing campaigns. It showcases the percentage of people influenced by various sources. Take your projects to the next level with our ultimate collection of Traditional Marketing Guide To Increase Audience Engagement Customer Survey Results Of Referral Marketing Campaign Summary PDF. Slidegeeks has designed a range of layouts that are perfect for representing task or activity duration, keeping track of all your deadlines at a glance. Tailor these designs to your exact needs and give them a truly corporate look with your own brand colors they will make your projects stand out from the rest.
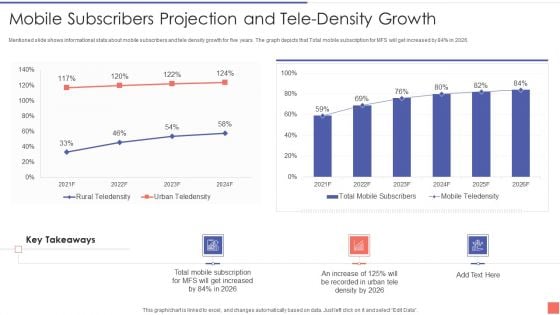
Providing Electronic Financial Services To Existing Consumers Mobile Subscribers Projection Demonstration PDF
Mentioned slide shows informational stats about mobile subscribers and tele density growth for five years. The graph depicts that Total mobile subscription for MFS will get increased by 84 percentage in 2026. Deliver an awe inspiring pitch with this creative Providing Electronic Financial Services To Existing Consumers Mobile Subscribers Projection Demonstration PDF bundle. Topics like Mobile Subscribers Projection And Tele Density Growth can be discussed with this completely editable template. It is available for immediate download depending on the needs and requirements of the user.

Key Challenges Faced By The Company At Each Stage Sales Funnel Management Strategies To Increase Sales Background PDF
This slide shows the major challenges faced by the company ate different stages of sales funnel. Key challenges mentioned in the slide are lengthy sales cycle, lack of qualified leads, low closing rate etc.Deliver an awe inspiring pitch with this creative Key Challenges Faced By The Company At Each Stage Sales Funnel Management Strategies To Increase Sales Background PDF bundle. Topics like Percentage Challenges, Faced Stage, Sales Pipeline can be discussed with this completely editable template. It is available for immediate download depending on the needs and requirements of the user.
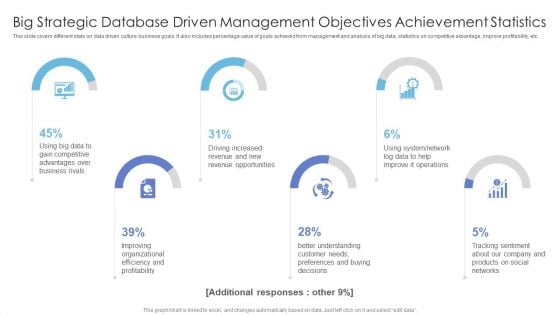
Big Strategic Database Driven Management Objectives Achievement Statistics Professional PDF
This slide covers different stats on data driven culture business goals. It also includes percentage value of goals achieved from management and analysis of big data, statistics on competitive advantage, improve profitability, etc.Showcasing this set of slides titled Big Strategic Database Driven Management Objectives Achievement Statistics Professional PDF. The topics addressed in these templates are Gain Competitive, Driving Increased, Revenue Opportunities. All the content presented in this PPT design is completely editable. Download it and make adjustments in color, background, font etc. as per your unique business setting.
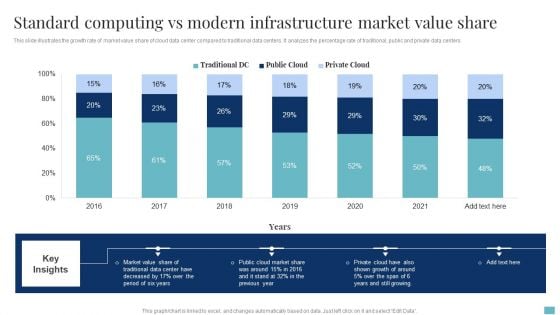
Standard Computing Vs Modern Infrastructure Market Value Share Brochure PDF
This slide illustrates the growth rate of market value share of cloud data center compared to traditional data centers. It analyzes the percentage rate of traditional, public and private data centers. Pitch your topic with ease and precision using this Standard Computing Vs Modern Infrastructure Market Value Share Brochure PDF. This layout presents information on Cloud Market Share, Market Value Share, Growth. It is also available for immediate download and adjustment. So, changes can be made in the color, design, graphics or any other component to create a unique layout.
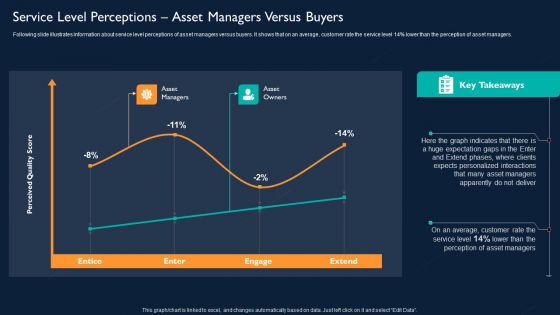
Technology Investment To Enhance Business Growth Service Level Perceptions Asset Managers Versus Buyers Topics PDF
Following slide illustrates information about service level perceptions of asset managers versus buyers. It shows that on an average, customer rate the service level 14 percentage lower than the perception of asset managers. Deliver and pitch your topic in the best possible manner with this Technology Investment To Enhance Business Growth Service Level Perceptions Asset Managers Versus Buyers Topics PDF. Use them to share invaluable insights on Service Level Perceptions, Asset Managers Versus Buyers and impress your audience. This template can be altered and modified as per your expectations. So, grab it now.
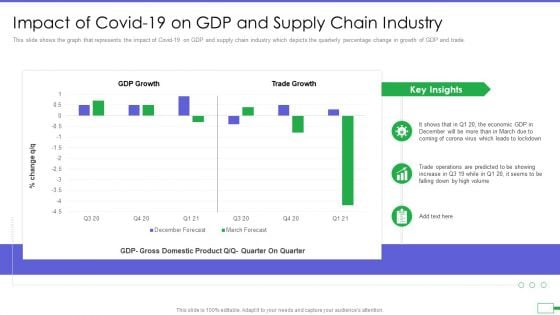
Iot And Digital Twin To Reduce Costs Post Covid Impact Of Covid 19 On Gdp And Supply Chain Industry Ideas PDF
This slide shows the graph that represents the impact of Covid 19 on GDP and supply chain industry which depicts the quarterly percentage change in growth of GDP and trade. Deliver an awe inspiring pitch with this creative iot and digital twin to reduce costs post covid impact of covid 19 on gdp and supply chain industry ideas pdf bundle. Topics like impact of covid 19 on gdp and supply chain industry can be discussed with this completely editable template. It is available for immediate download depending on the needs and requirements of the user.
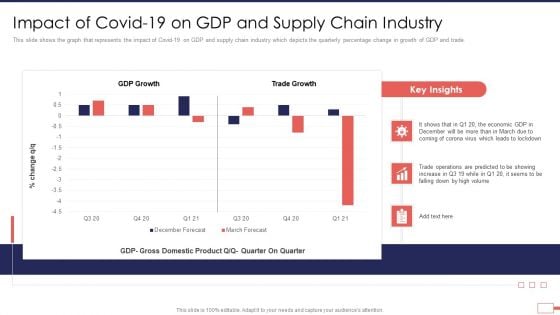
Iot Digital Twin Technology Post Covid Expenditure Management Impact Of Covid 19 On GDP And Supply Chain Industry Designs PDF
This slide shows the graph that represents the impact of Covid-19 on GDP and supply chain industry which depicts the quarterly percentage change in growth of GDP and trade. Deliver an awe inspiring pitch with this creative iot digital twin technology post covid expenditure management impact of covid 19 on gdp and supply chain industry designs pdf bundle. Topics like impact of covid 19 on gdp and supply chain industry can be discussed with this completely editable template. It is available for immediate download depending on the needs and requirements of the user.
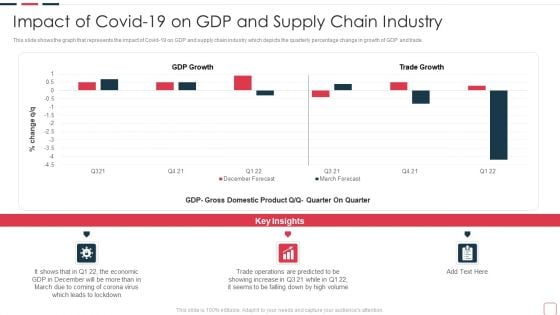
Price Benefit Internet Things Digital Twins Execution After Covid Impact Of Covid 19 On GDP Professional PDF
This slide shows the graph that represents the impact of Covid 19 on GDP and supply chain industry which depicts the quarterly percentage change in growth of GDP and trade. Deliver an awe inspiring pitch with this creative price benefit internet things digital twins execution after covid impact of covid 19 on gdp professional pdf bundle. Topics like impact of covid 19 on gdp and supply chain industry can be discussed with this completely editable template. It is available for immediate download depending on the needs and requirements of the user.
Purpose Digital Twin Internet Things Reducing Costs After COVID Era Impact Of Covid 19 On GDP Microsoft PDF
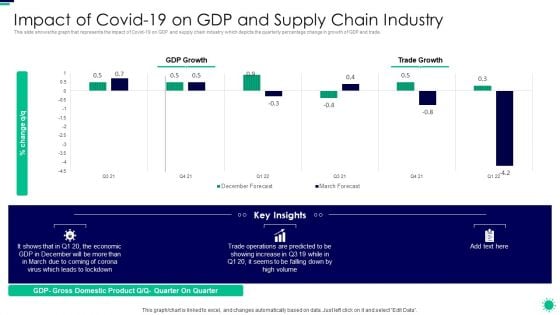
This slide shows the graph that represents the impact of Covid 19 on GDP and supply chain industry which depicts the quarterly percentage change in growth of GDP and trade. Deliver and pitch your topic in the best possible manner with this purpose digital twin internet things reducing costs after covid era impact of covid 19 on gdp microsoft pdf. Use them to share invaluable insights on impact of covid 19 on gdp and supply chain industry and impress your audience. This template can be altered and modified as per your expectations. So, grab it now.
Minimizing Operational Cost Through Iot Virtual Twins Implementation Impact Of Covid 19 On Healthcare Microsoft PDF
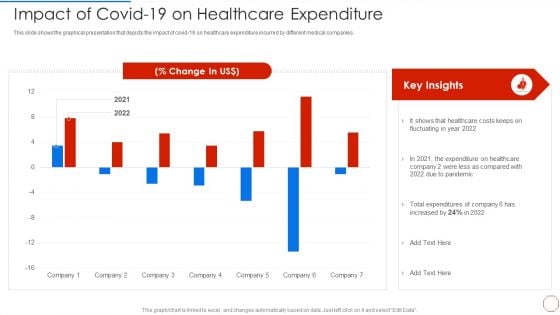
This slide shows the graph that represents the impact of Covid 19 on GDP and supply chain industry which depicts the quarterly percentage change in growth of GDP and trade. Deliver and pitch your topic in the best possible manner with this minimizing operational cost through iot virtual twins implementation impact of covid 19 on healthcare microsoft pdf. Use them to share invaluable insights on costs, pandemic, expenditures and impress your audience. This template can be altered and modified as per your expectations. So, grab it now.

 Home
Home