Percentage Icon
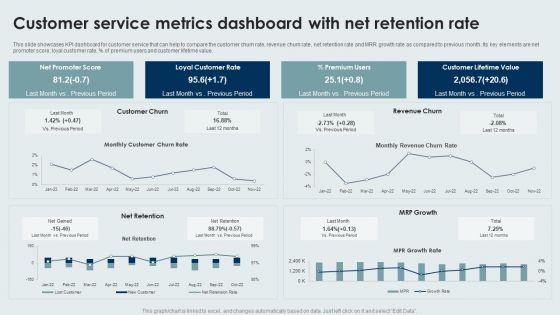
Customer Service Metrics Dashboard With Net Retention Rate Sample PDF
This slide showcases KPI dashboard for customer service that can help to compare the customer churn rate, revenue churn rate, net retention rate and MRR growth rate as compared to previous month. Its key elements are net promoter score, loyal customer rate, percentage of premium users and customer lifetime value. Pitch your topic with ease and precision using this Customer Service Metrics Dashboard With Net Retention Rate Sample PDF. This layout presents information on Loyal Customer Rate, Premium Users, Customer Lifetime Value. It is also available for immediate download and adjustment. So, changes can be made in the color, design, graphics or any other component to create a unique layout.
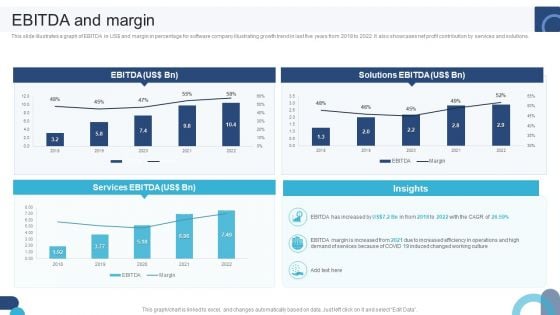
Digital Application Software Development Business Profile EBITDA And Margin Guidelines PDF
This slide illustrates a graph of EBITDA in US dollar and margin in percentage for software company illustrating growth trend in last five years from 2018 to 2022. It also showcases net profit contribution by services and solutions. If your project calls for a presentation, then Slidegeeks is your go-to partner because we have professionally designed, easy-to-edit templates that are perfect for any presentation. After downloading, you can easily edit Digital Application Software Development Business Profile EBITDA And Margin Guidelines PDF and make the changes accordingly. You can rearrange slides or fill them with different images. Check out all the handy templates

KPI Dashboard To Track Sales And Operations Process Of Manufacturing Enterprise Brochure PDF
This slide depicts a dashboard to track the key performance metrics in sales and operations process of a manufacturing enterprise to analyze deviations in the actual and planned output. The key performing indicators are percentage deviation, dollar deviation, inventory in hand etc.Pitch your topic with ease and precision using this KPI Dashboard To Track Sales And Operations Process Of Manufacturing Enterprise Brochure PDF. This layout presents information on Planned Output, Yearly Growth, Inventory Hand. It is also available for immediate download and adjustment. So, changes can be made in the color, design, graphics or any other component to create a unique layout.
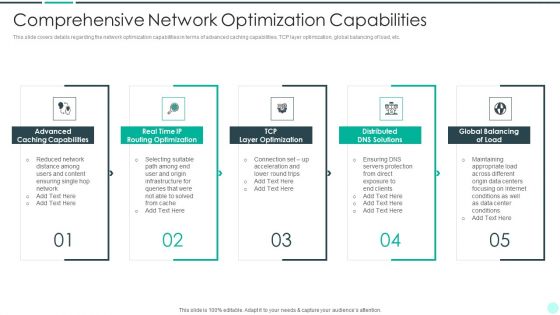
Executing Advance Data Analytics At Workspace Comprehensive Network Diagrams PDF
This slide helps in analyzing the performance of different executives representatives. It will help in tracking metrics such as cost per contact, percentage of tickets opened, etc. The staff performance will be assessed on various parameters such as cost, quality, productivity and service level. Deliver and pitch your topic in the best possible manner with this executing advance data analytics at workspace comprehensive network diagrams pdf. Use them to share invaluable insights on assessing staff performance on various parameters and impress your audience. This template can be altered and modified as per your expectations. So, grab it now.
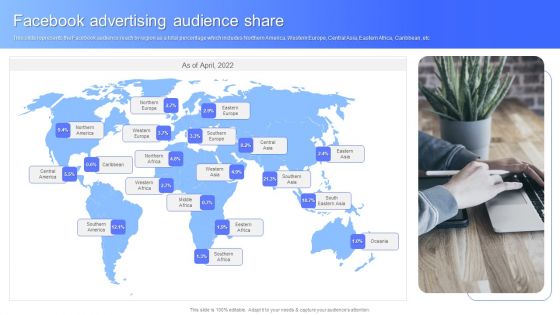
Facebook Advertising Audience Share Facebook Business Outline Diagrams PDF
This slide represents the Facebook audience reach by region as a total percentage which includes Northern America, Western Europe, Central Asia, Eastern Africa, Caribbean, etc. This is a Facebook Advertising Audience Share Facebook Business Outline Diagrams PDF template with various stages. Focus and dispense information on one stages using this creative set, that comes with editable features. It contains large content boxes to add your information on topics like Facebook Advertising Audience Share. You can also showcase facts, figures, and other relevant content using this PPT layout. Grab it now.
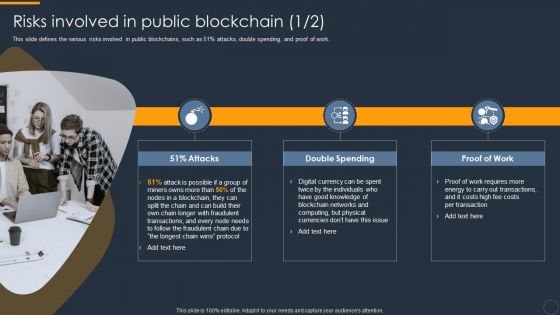
Cryptocurrency Ledger Risks Involved In Public Blockchain Diagrams PDF
This slide defines the various risks involved in public blockchains, such as 51 percentage attacks, double spending, and proof of work.This is a Cryptocurrency Ledger Risks Involved In Public Blockchain Diagrams PDF template with various stages. Focus and dispense information on three stages using this creative set, that comes with editable features. It contains large content boxes to add your information on topics like Protocol, Blockchain Networks, Costs. You can also showcase facts, figures, and other relevant content using this PPT layout. Grab it now.
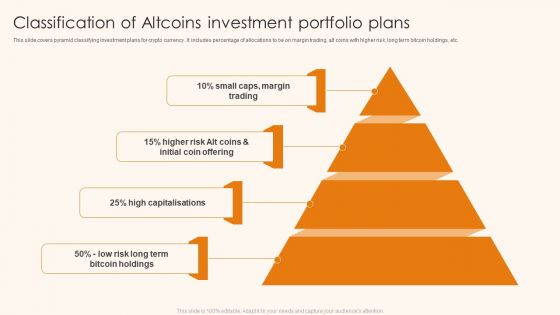
Classification Of Altcoins Investment Portfolio Plans Ppt Professional Diagrams PDF
This slide covers pyramid classifying investment plans for crypto currency. It includes percentage of allocations to be on margin trading, alt coins with higher risk, long term bitcoin holdings, etc. Persuade your audience using this Classification Of Altcoins Investment Portfolio Plans Ppt Professional Diagrams PDF. This PPT design covers four stages, thus making it a great tool to use. It also caters to a variety of topics including Initial Coin Offering, High Capitalisations, Bitcoin Holdings. Download this PPT design now to present a convincing pitch that not only emphasizes the topic but also showcases your presentation skills.
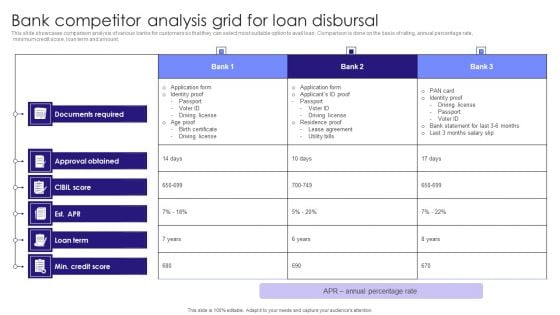
Bank Competitor Analysis Grid For Loan Disbursal Diagrams PDF
This slide showcases comparison analysis of various banks for customers so that they can select most suitable option to avail loan. Comparison is done on the basis of rating, annual percentage rate, minimum credit score, loan term and amount.Showcasing this set of slides titled Bank Competitor Analysis Grid For Loan Disbursal Diagrams PDF. The topics addressed in these templates are Documents Required, Approval Obtained, Residence Proof. All the content presented in this PPT design is completely editable. Download it and make adjustments in color, background, font etc. as per your unique business setting.
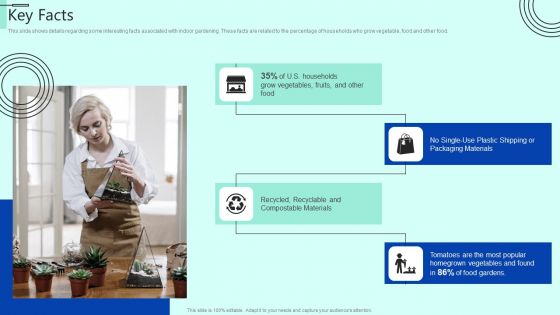
Indoor Horticulture Investor Fundraising Pitch Deck Key Facts Diagrams PDF
This slide shows details regarding some interesting facts associated with indoor gardening. These facts are related to the percentage of households who grow vegetable, food and other food. From laying roadmaps to briefing everything in detail, our templates are perfect for you. You can set the stage with your presentation slides. All you have to do is download these easy to edit and customizable templates. Indoor Horticulture Investor Fundraising Pitch Deck Key Facts Diagrams PDF will help you deliver an outstanding performance that everyone would remember and praise you for. Do download this presentation today.
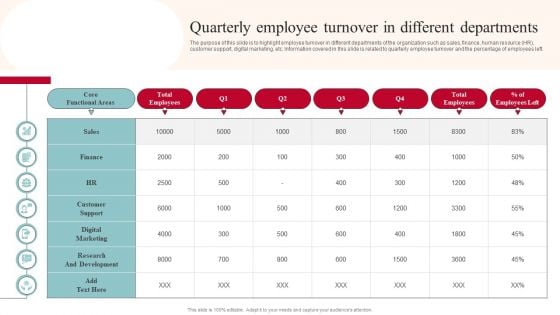
Quarterly Employee Turnover In Different Departments Diagrams PDF
The purpose of this slide is to highlight employee turnover in different departments of the organization such as sales, finance, human resource HR, customer support, digital marketing, etc. Information covered in this slide is related to quarterly employee turnover and the percentage of employees left. From laying roadmaps to briefing everything in detail, our templates are perfect for you. You can set the stage with your presentation slides. All you have to do is download these easy to edit and customizable templates. Quarterly Employee Turnover In Different Departments Diagrams PDF will help you deliver an outstanding performance that everyone would remember and praise you for. Do download this presentation today.
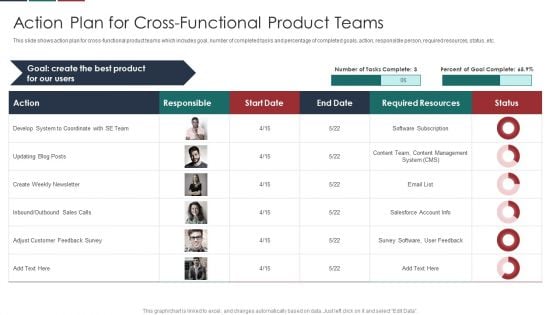
Deliver Efficiency Innovation Action Plan For Cross Functional Product Teams Introduction PDF
This slide shows action plan for cross-functional product teams which includes goal, number of completed tasks and percentage of completed goals, action, responsible person, required resources, status, etc. Deliver and pitch your topic in the best possible manner with this Deliver Efficiency Innovation Action Plan For Cross Functional Product Teams Introduction PDF. Use them to share invaluable insights on Updating Blog Posts, Create Weekly Newsletter, Inbound, Outbound Sales Calls, Adjust Customer Feedback Survey and impress your audience. This template can be altered and modified as per your expectations. So, grab it now.
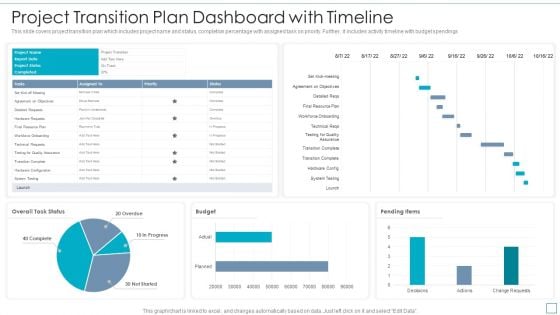
Project Transition Plan Dashboard With Timeline Topics PDF
This slide covers project transition plan which includes project name and status, completion percentage with assigned task on priority. Further, it includes activity timeline with budget spendings. Pitch your topic with ease and precision using this Project Transition Plan Dashboard With Timeline Topics PDF. This layout presents information on Budget, System Testing, Testing For Quality Assurance. It is also available for immediate download and adjustment. So, changes can be made in the color, design, graphics or any other component to create a unique layout.
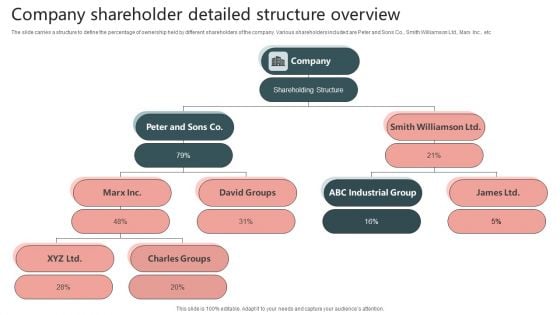
Company Shareholder Detailed Structure Overview Elements PDF
The slide carries a structure to define the percentage of ownership held by different shareholders of the company. Various shareholders included are Peter and Sons Co., Smith Williamson Ltd., Marx Inc., etc. Presenting Company Shareholder Detailed Structure Overview Elements PDF to dispense important information. This template comprises seven stages. It also presents valuable insights into the topics including Company Shareholder, Detailed Structure Overview. This is a completely customizable PowerPoint theme that can be put to use immediately. So, download it and address the topic impactfully.
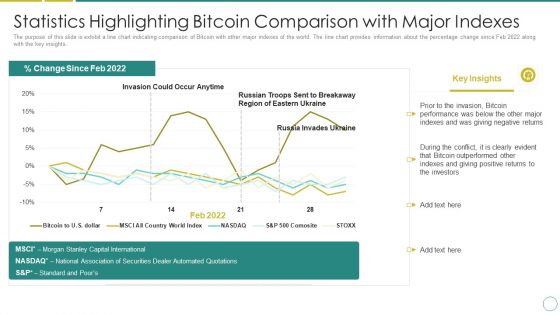
Russia Ukraine Statistics Highlighting Bitcoin Comparison With Major Indexes Mockup PDF
The purpose of this slide is exhibit a line chart indicating comparison of Bitcoin with other major indexes of the world. The line chart provides information about the percentage change since Feb 2022 along with the key insights. Deliver an awe inspiring pitch with this creative russia ukraine statistics highlighting bitcoin comparison with major indexes mockup pdf bundle. Topics like invasion could occur anytime, russia invades ukraine, bitcoin performance can be discussed with this completely editable template. It is available for immediate download depending on the needs and requirements of the user.
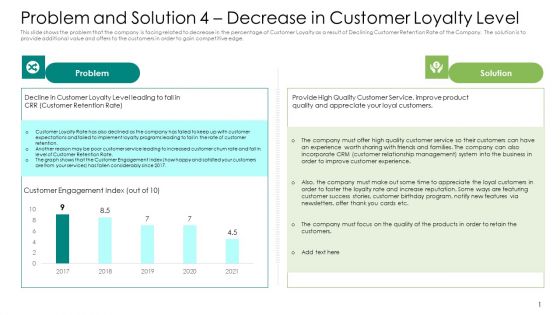
Problem And Solution 4 Decrease In Customer Loyalty Level Guidelines PDF
This slide shows the problem that the company is facing related to decrease in the percentage of Customer Loyalty as a result of Declining Customer Retention Rate of the Company. The solution is to provide additional value and offers to the customers in order to gain competitive edge.Deliver and pitch your topic in the best possible manner with this problem and solution 4 decrease in customer loyalty level guidelines pdf. Use them to share invaluable insights on problem, solution, 2017 to 2021 and impress your audience. This template can be altered and modified as per your expectations. So, grab it now.
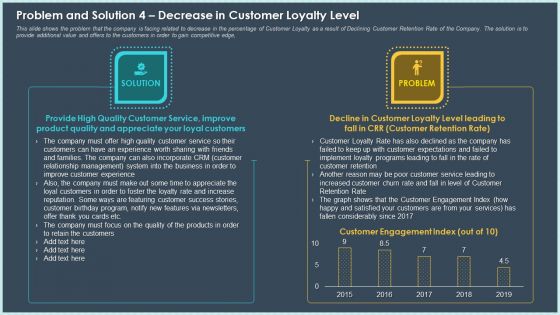
Problem And Solution 4 Decrease In Customer Loyalty Level Ppt Picture PDF
This slide shows the problem that the company is facing related to decrease in the percentage of Customer Loyalty as a result of Declining Customer Retention Rate of the Company. The solution is to provide additional value and offers to the customers in order to gain competitive edge, Deliver and pitch your topic in the best possible manner with this problem and solution 4 decrease in customer loyalty level ppt picture pdf. Use them to share invaluable insights on customer engagement, customer retention rate, customer relationship management and impress your audience. This template can be altered and modified as per your expectations. So, grab it now.
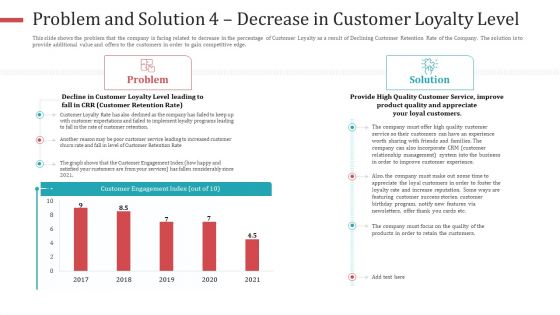
Problem And Solution 4 Decrease In Customer Loyalty Level Infographics PDF
This slide shows the problem that the company is facing related to decrease in the percentage of Customer Loyalty as a result of Declining Customer Retention Rate of the Company. The solution is to provide additional value and offers to the customers in order to gain competitive edge.Deliver an awe-inspiring pitch with this creative problem and solution 4 decrease in customer loyalty level infographics pdf. bundle. Topics like customer engagement index, 2017 to 2021 can be discussed with this completely editable template. It is available for immediate download depending on the needs and requirements of the user.
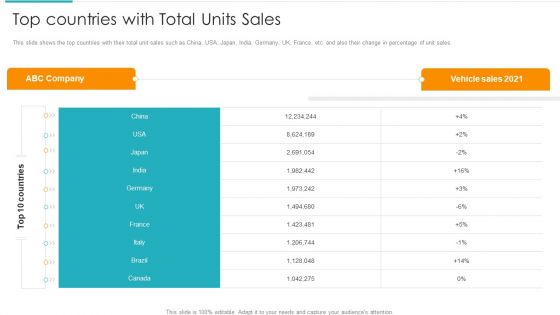
Inorganic Expansion Plan And Progression Top Countries With Total Units Sales Diagrams PDF
This slide shows the top countries with their total unit sales such as China, USA, Japan, India, Germany, UK, France, etc. and also their change in percentage of unit sales. Deliver and pitch your topic in the best possible manner with this inorganic expansion plan and progression top countries with total units sales diagrams pdf. Use them to share invaluable insights on top countries with total units sales and impress your audience. This template can be altered and modified as per your expectations. So, grab it now.
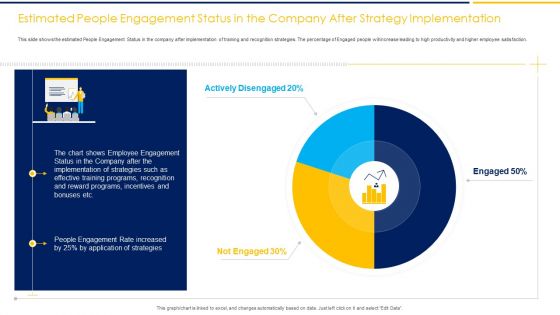
Estimated People Engagement Status In The Company After Strategy Implementation Ppt Layouts Graphic Images PDF
This slide shows the estimated People Engagement Status in the company after implementation of training and recognition strategies. The percentage of Engaged people will increase leading to high productivity and higher employee satisfaction.Deliver an awe-inspiring pitch with this creative estimated people engagement status in the company after strategy implementation ppt layouts graphic images pdf. bundle. Topics like actively disengaged 20 present, not engaged 30 present can be discussed with this completely editable template. It is available for immediate download depending on the needs and requirements of the user.

Estimated People Engagement Status In The Company After Strategy Implementation Ppt Layouts Model PDF
This slide shows the estimated People Engagement Status in the company after implementation of training and recognition strategies. The percentage of Engaged people will increase leading to high productivity and higher employee satisfaction. Deliver and pitch your topic in the best possible manner with this estimated people engagement status in the company after strategy implementation ppt layouts model pdf. Use them to share invaluable insights on implementation, reward programs, engagement rate, strategies and impress your audience. This template can be altered and modified as per your expectations. So, grab it now.
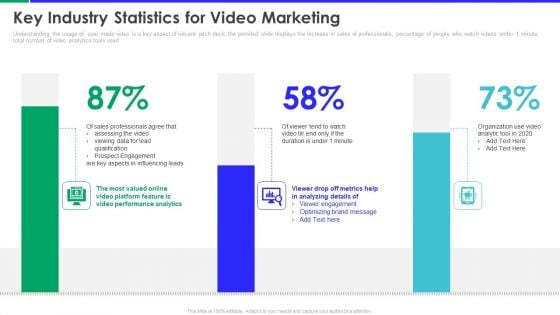
Vidyard Investor Capital Funding Elevator Pitch Deck Key Industry Statistics For Video Marketing Infographics PDF Mockup PDF
Understanding the usage of user made video is a key aspect of vidyard pitch deck, the provided slide displays the increase in sales of professionals, percentage of people who watch videos under 1 minute, total number of video analytics tools used. Deliver and pitch your topic in the best possible manner with this vidyard investor capital funding elevator pitch deck key industry statistics for video marketing infographics pdf mockup pdf. Use them to share invaluable insights on key industry statistics for video marketing and impress your audience. This template can be altered and modified as per your expectations. So, grab it now.
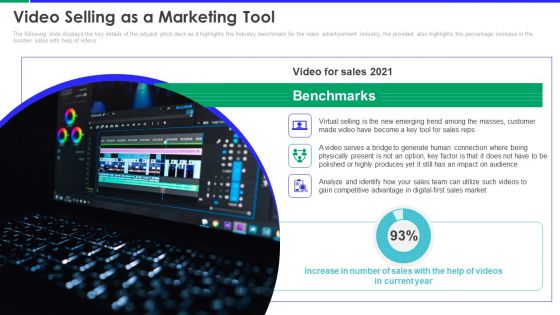
Vidyard Investor Capital Funding Elevator Pitch Deck Video Selling As A Marketing Tool Summary PDF Template PDF
The following slide displays the key details of the vidyard pitch deck as it highlights the Industry benchmark for the video advertisement industry, the provided also highlights the percentage increase in the number sales with help of videos. Deliver and pitch your topic in the best possible manner with this vidyard investor capital funding elevator pitch deck video selling as a marketing tool summary pdf template pdf. Use them to share invaluable insights on video selling as a marketing tool and impress your audience. This template can be altered and modified as per your expectations. So, grab it now.
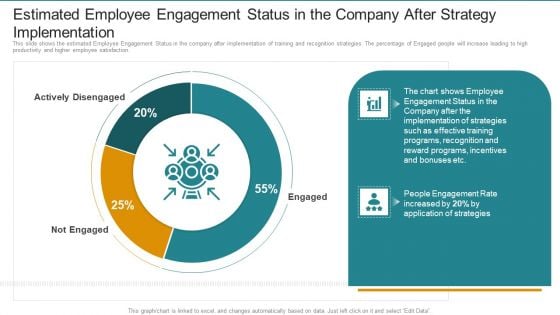
Estimated Employee Engagement Status In The Company After Strategy Implementation Introduction PDF
This slide shows the estimated Employee Engagement Status in the company after implementation of training and recognition strategies. The percentage of Engaged people will increase leading to high productivity and higher employee satisfaction. Deliver and pitch your topic in the best possible manner with this Estimated Employee Engagement Status In The Company After Strategy Implementation Introduction PDF. Use them to share invaluable insights on Training Programs, Recognition And Reward, Incentives And Bonuses and impress your audience. This template can be altered and modified as per your expectations. So, grab it now.
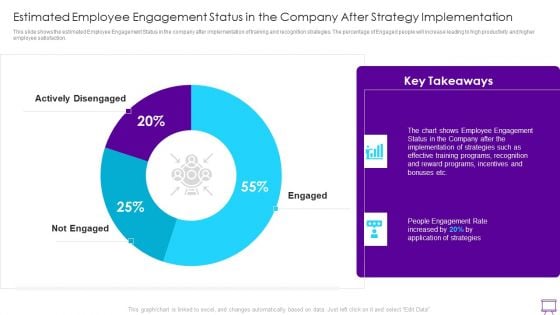
Strategies To Enhance Employee Engagement Estimated Employee Engagement Status Implementation Inspiration PDF
This slide shows the estimated Employee Engagement Status in the company after implementation of training and recognition strategies. The percentage of Engaged people will increase leading to high productivity and higher employee satisfaction.Deliver and pitch your topic in the best possible manner with this Strategies To Enhance Employee Engagement Estimated Employee Engagement Status Implementation Inspiration PDF Use them to share invaluable insights on Employee Engagement, Implementation Strategies, Effective Training and impress your audience. This template can be altered and modified as per your expectations. So, grab it now.
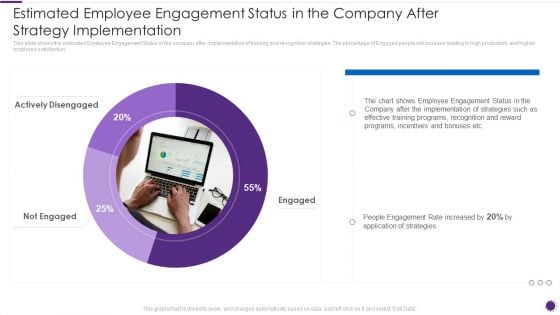
Complete Guide For Total Employee Involvement Strategic Approach Estimated Employee Engagement Statu Sample PDF
This slide shows the estimated Employee Engagement Status in the company after implementation of training and recognition strategies. The percentage of Engaged people will increase leading to high productivity and higher employee satisfaction.Deliver and pitch your topic in the best possible manner with this Complete Guide For Total Employee Involvement Strategic Approach Estimated Employee Engagement Statu Sample PDF Use them to share invaluable insights on Employee Engagement, Implementation Strategies, Training Programs and impress your audience. This template can be altered and modified as per your expectations. So, grab it now.

Instant Snacks And Food Firm Details Net Profit And Margin Microsoft PDF
This slide illustrates a graph of net profit in US and gross margin in percentage for food company. Additionally, it shows net profit of all business lines of the company food, beverage and dairy products.Deliver and pitch your topic in the best possible manner with this Instant Snacks And Food Firm Details Net Profit And Margin Microsoft PDF Use them to share invaluable insights on Profit Increased, Profit Margin, Disrupted Supply and impress your audience. This template can be altered and modified as per your expectations. So, grab it now.
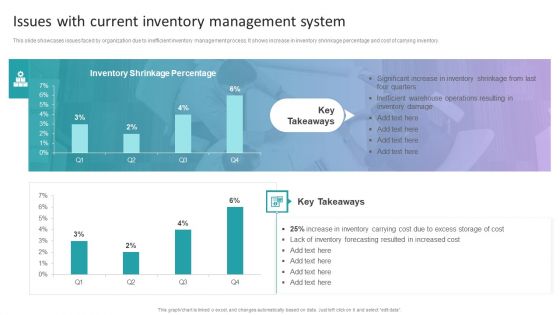
Stock Inventory Acquisition Issues With Current Inventory Management System Infographics PDF
This slide showcases issues faced by organization due to inefficient inventory management process. It shows increase in inventory shrinkage percentage and cost of carrying inventory. Slidegeeks is one of the best resources for PowerPoint templates. You can download easily and regulate Stock Inventory Acquisition Issues With Current Inventory Management System Infographics PDF for your personal presentations from our wonderful collection. A few clicks is all it takes to discover and get the most relevant and appropriate templates. Use our Templates to add a unique zing and appeal to your presentation and meetings. All the slides are easy to edit and you can use them even for advertisement purposes.
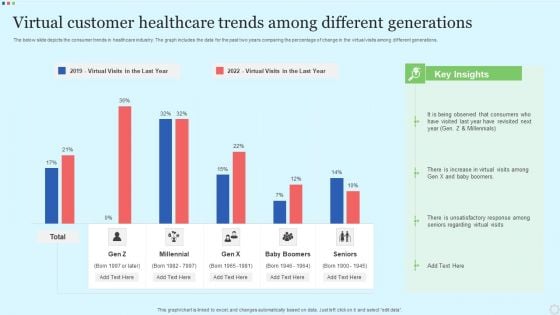
Virtual Customer Healthcare Trends Among Different Generations Professional PDF
The below slide depicts the consumer trends in healthcare industry. The graph includes the data for the past two years comparing the percentage of change in the virtual visits among different generations. Pitch your topic with ease and precision using this Virtual Customer Healthcare Trends Among Different Generations Professional PDF. This layout presents information on Millennial, Baby Boomers, Seniors. It is also available for immediate download and adjustment. So, changes can be made in the color, design, graphics or any other component to create a unique layout.
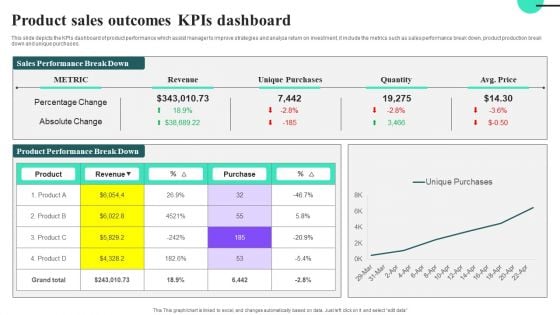
Product Sales Outcomes Kpis Dashboard Ideas PDF
This slide depicts the KPIs dashboard of product performance which assist manager to improve strategies and analyze return on investment, it include the metrics such as sales performance break down, product production break down and unique purchases.Showcasing this set of slides titled Product Sales Outcomes Kpis Dashboard Ideas PDF. The topics addressed in these templates are Percentage Change, Absolute Change. All the content presented in this PPT design is completely editable. Download it and make adjustments in color, background, font etc. as per your unique business setting.
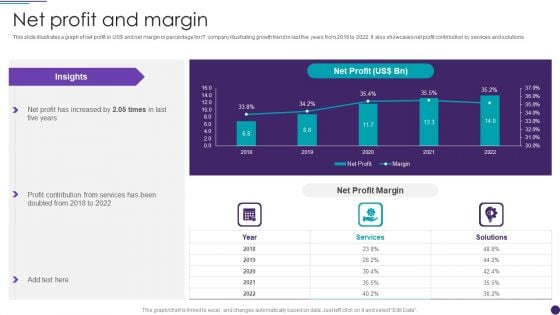
IT Services Business Profile Net Profit And Margin Sample PDF
This slide illustrates a graph of net profit in US doller and net margin in percentage for IT company illustrating growth trend in last five years from 2018 to 2022. It also showcases net profit contribution by services and solutions. Deliver and pitch your topic in the best possible manner with this IT Services Business Profile Net Profit And Margin Sample PDF. Use them to share invaluable insights on Services, Net Profit Margin and impress your audience. This template can be altered and modified as per your expectations. So, grab it now.
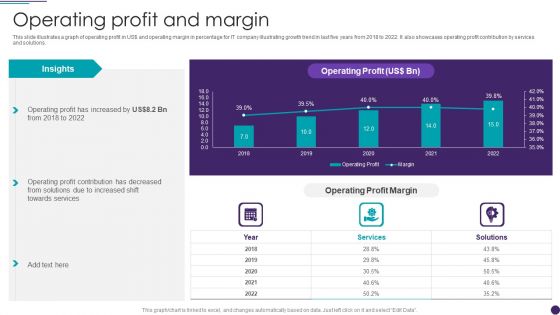
IT Services Business Profile Operating Profit And Margin Sample PDF
This slide illustrates a graph of operating profit in US doller and operating margin in percentage for IT company illustrating growth trend in last five years from 2018 to 2022. It also showcases operating profit contribution by services and solutions. Deliver an awe inspiring pitch with this creative IT Services Business Profile Operating Profit And Margin Sample PDF bundle. Topics like Operating Profit, Services can be discussed with this completely editable template. It is available for immediate download depending on the needs and requirements of the user.
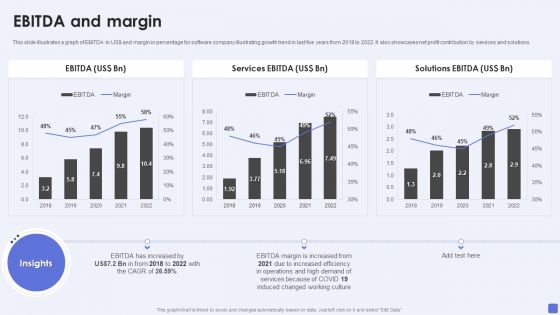
Software Services Business Profile EBITDA And Margin Ppt PowerPoint Presentation Gallery Slide Portrait PDF
This slide illustrates a graph of EBITDA in US dollar and margin in percentage for software company illustrating growth trend in last five years from 2018 to 2022. It also showcases net profit contribution by services and solutions. Deliver an awe inspiring pitch with this creative Software Services Business Profile EBITDA And Margin Ppt PowerPoint Presentation Gallery Slide Portrait PDF bundle. Topics like Services EB, Solutions EBITDA, EBITDA Margin can be discussed with this completely editable template. It is available for immediate download depending on the needs and requirements of the user.
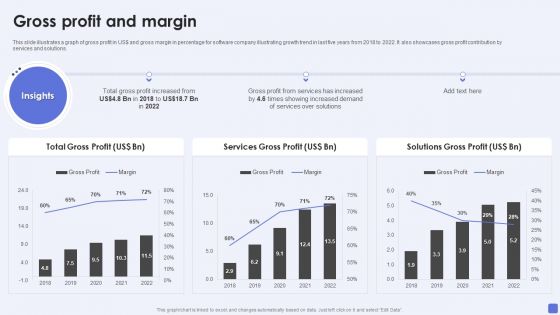
Software Services Business Profile Gross Profit And Margin Ppt PowerPoint Presentation Gallery Templates PDF
This slide illustrates a graph of gross profit in US dollar and gross margin in percentage for software company illustrating growth trend in last five years from 2018 to 2022. It also showcases gross profit contribution by services and solutions. Deliver an awe inspiring pitch with this creative Software Services Business Profile Gross Profit And Margin Ppt PowerPoint Presentation Gallery Templates PDF bundle. Topics like Total Gross Profit, Services Gross Profit, Solutions Gross Profit can be discussed with this completely editable template. It is available for immediate download depending on the needs and requirements of the user.
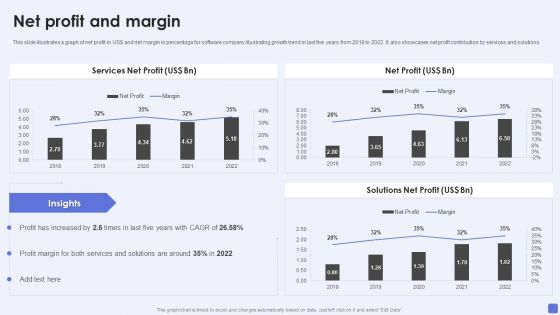
Software Services Business Profile Net Profit And Margin Ppt PowerPoint Presentation File Slides PDF
This slide illustrates a graph of net profit in US dollar and net margin in percentage for software company illustrating growth trend in last five years from 2018 to 2022. It also showcases net profit contribution by services and solutions. Deliver an awe inspiring pitch with this creative Software Services Business Profile Net Profit And Margin Ppt PowerPoint Presentation File Slides PDF bundle. Topics like Services Net Profit, Net Profit, Solutions Net Profit can be discussed with this completely editable template. It is available for immediate download depending on the needs and requirements of the user.
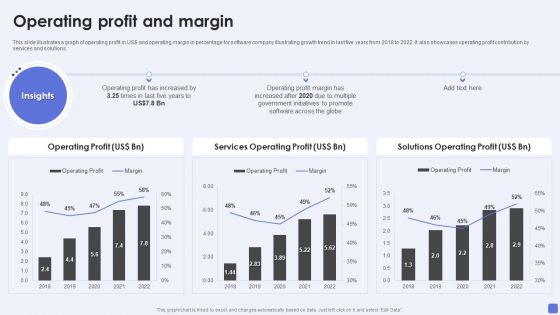
Software Services Business Profile Operating Profit And Margin Ppt PowerPoint Presentation Gallery Inspiration PDF
This slide illustrates a graph of operating profit in US dollar and operating margin in percentage for software company illustrating growth trend in last five years from 2018 to 2022. It also showcases operating profit contribution by services and solutions. Deliver and pitch your topic in the best possible manner with this Software Services Business Profile Operating Profit And Margin Ppt PowerPoint Presentation Gallery Inspiration PDF. Use them to share invaluable insights on Operating Profit, Services Operating Profit, Solutions Operating Profit and impress your audience. This template can be altered and modified as per your expectations. So, grab it now.
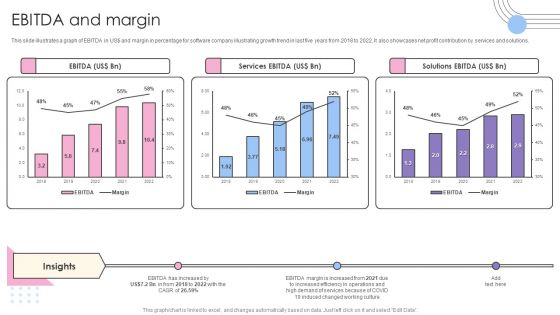
Software Products And Solutions Firm Details EBITDA And Margin Structure PDF
This slide illustrates a graph of EBITDA in US dollar and margin in percentage for software company illustrating growth trend in last five years from 2018 to 2022. It also showcases net profit contribution by services and solutions. Deliver an awe inspiring pitch with this creative Software Products And Solutions Firm Details EBITDA And Margin Structure PDF bundle. Topics like EBITDA, Services EBITDA, Solutions EBITDA, 2018 To 2022 can be discussed with this completely editable template. It is available for immediate download depending on the needs and requirements of the user.
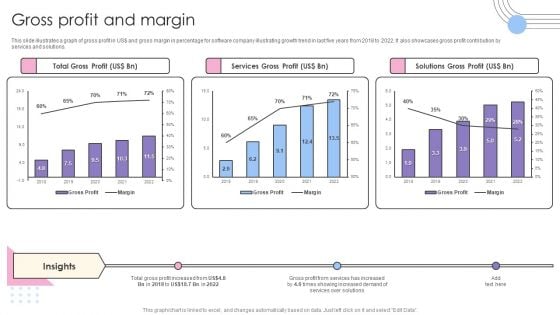
Software Products And Solutions Firm Details Gross Profit And Margin Pictures PDF
This slide illustrates a graph of gross profit in US dollar and gross margin in percentage for software company illustrating growth trend in last five years from 2018 to 2022. It also showcases gross profit contribution by services and solutions. Deliver and pitch your topic in the best possible manner with this Software Products And Solutions Firm Details Gross Profit And Margin Pictures PDF. Use them to share invaluable insights on Total Gross Profit, Services Gross Profit, Solutions Gross Profit and impress your audience. This template can be altered and modified as per your expectations. So, grab it now.
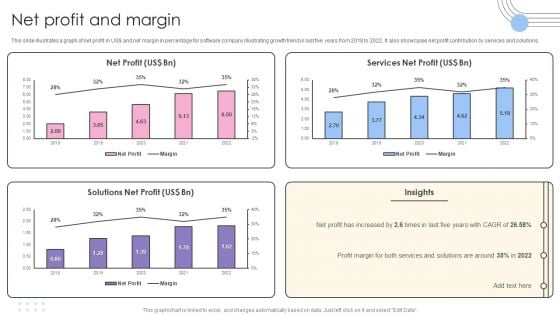
Software Products And Solutions Firm Details Net Profit And Margin Information PDF
This slide illustrates a graph of net profit in US dollar and net margin in percentage for software company illustrating growth trend in last five years from 2018 to 2022. It also showcases net profit contribution by services and solutions. Deliver and pitch your topic in the best possible manner with this Software Products And Solutions Firm Details Net Profit And Margin Information PDF. Use them to share invaluable insights on Net Profit, Services Net Profit, Solutions Net Profit and impress your audience. This template can be altered and modified as per your expectations. So, grab it now.

Software Products And Solutions Firm Details Operating Profit And Margin Mockup PDF
This slide illustrates a graph of operating profit in US dollar and operating margin in percentage for software company illustrating growth trend in last five years from 2018 to 2022. It also showcases operating profit contribution by services and solutions. Deliver an awe inspiring pitch with this creative Software Products And Solutions Firm Details Operating Profit And Margin Mockup PDF bundle. Topics like Operating Profit, Services Operating Profit, Solutions Operating Profit can be discussed with this completely editable template. It is available for immediate download depending on the needs and requirements of the user.
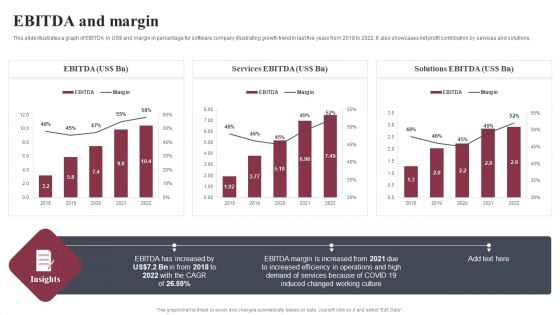
Business Software Development Company Profile EBITDA And Margin Summary PDF
This slide illustrates a graph of EBITDA in US dollar and margin in percentage for software company illustrating growth trend in last five years from 2018 to 2022. It also showcases net profit contribution by services and solutions. Deliver an awe inspiring pitch with this creative Business Software Development Company Profile EBITDA And Margin Summary PDF bundle. Topics like EBITDA, Services EBITDA, Solutions EBITDA can be discussed with this completely editable template. It is available for immediate download depending on the needs and requirements of the user.
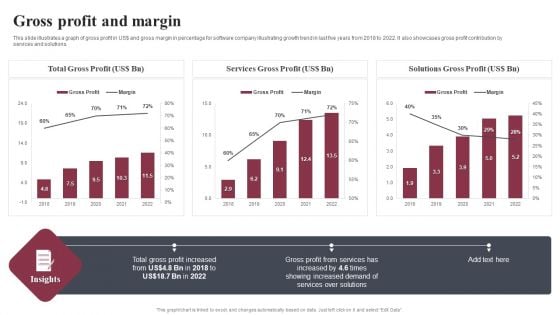
Business Software Development Company Profile Gross Profit And Margin Microsoft PDF
This slide illustrates a graph of gross profit in US dollar and gross margin in percentage for software company illustrating growth trend in last five years from 2018 to 2022. It also showcases gross profit contribution by services and solutions. Deliver and pitch your topic in the best possible manner with this Business Software Development Company Profile Gross Profit And Margin Microsoft PDF. Use them to share invaluable insights on Total Gross Profit, Services Gross Profit, Solutions Gross Profit and impress your audience. This template can be altered and modified as per your expectations. So, grab it now.
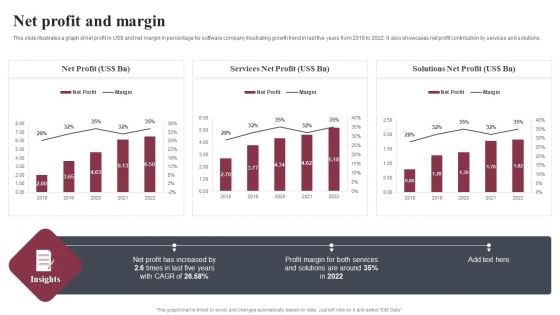
Business Software Development Company Profile Net Profit And Margin Mockup PDF
This slide illustrates a graph of net profit in US dollar and net margin in percentage for software company illustrating growth trend in last five years from 2018 to 2022. It also showcases net profit contribution by services and solutions. Deliver an awe inspiring pitch with this creative Business Software Development Company Profile Net Profit And Margin Mockup PDF bundle. Topics like Net Profit, Services Net Profit, Solutions Net Profit can be discussed with this completely editable template. It is available for immediate download depending on the needs and requirements of the user.
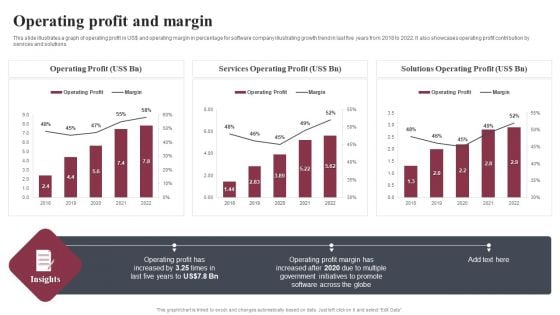
Business Software Development Company Profile Operating Profit And Margin Summary PDF
This slide illustrates a graph of operating profit in US dollar and operating margin in percentage for software company illustrating growth trend in last five years from 2018 to 2022. It also showcases operating profit contribution by services and solutions. Deliver and pitch your topic in the best possible manner with this Business Software Development Company Profile Operating Profit And Margin Summary PDF. Use them to share invaluable insights on Operating Profit, Services Operating Profit, Solutions Operating Profit and impress your audience. This template can be altered and modified as per your expectations. So, grab it now.
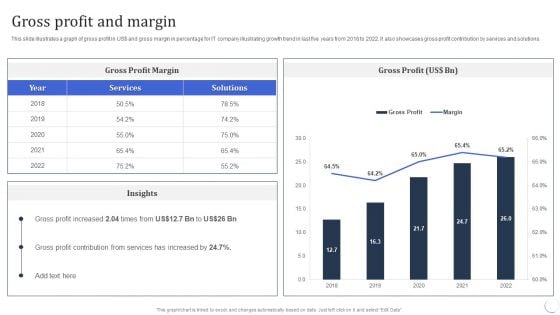
Infotech Solutions Research And Development Company Summary Gross Profit And Margin Ideas PDF
This slide illustrates a graph of gross profit in US dollar and gross margin in percentage for IT company illustrating growth trend in last five years from 2018 to 2022. It also showcases gross profit contribution by services and solutions. Deliver an awe inspiring pitch with this creative Infotech Solutions Research And Development Company Summary Gross Profit And Margin Ideas PDF bundle. Topics like Services, Gross Profit Margin can be discussed with this completely editable template. It is available for immediate download depending on the needs and requirements of the user.
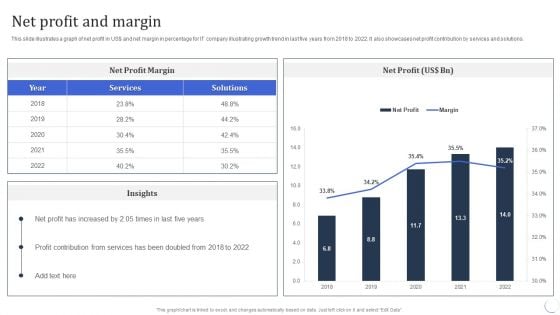
Infotech Solutions Research And Development Company Summary Net Profit And Margin Information PDF
This slide illustrates a graph of net profit in US dollar and net margin in percentage for IT company illustrating growth trend in last five years from 2018 to 2022. It also showcases net profit contribution by services and solutions. Deliver and pitch your topic in the best possible manner with this Infotech Solutions Research And Development Company Summary Net Profit And Margin Information PDF. Use them to share invaluable insights on Profit Contribution, Services, Net Profit and impress your audience. This template can be altered and modified as per your expectations. So, grab it now.
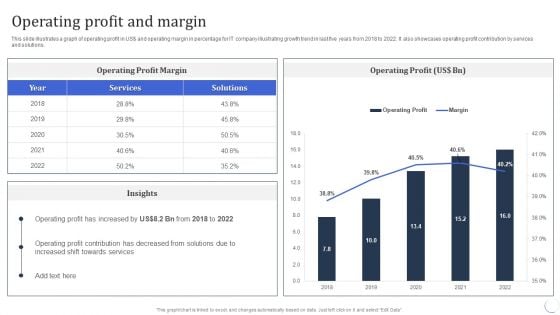
Infotech Solutions Research And Development Company Summary Operating Profit And Margin Download PDF
This slide illustrates a graph of operating profit in US dollar and operating margin in percentage for IT company illustrating growth trend in last five years from 2018 to 2022. It also showcases operating profit contribution by services and solutions. Deliver an awe inspiring pitch with this creative Infotech Solutions Research And Development Company Summary Operating Profit And Margin Download PDF bundle. Topics like Services, Operating Profit can be discussed with this completely editable template. It is available for immediate download depending on the needs and requirements of the user.
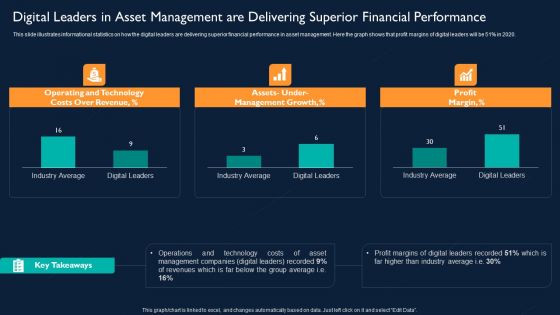
Digital Leaders In Asset Management Are Delivering Superior Financial Performance Designs PDF
This slide illustrates informational statistics on how the digital leaders are delivering superior financial performance in asset management. Here the graph shows that profit margins of digital leaders will be 51 percentage in 2020. Deliver and pitch your topic in the best possible manner with this Digital Leaders In Asset Management Are Delivering Superior Financial Performance Designs PDF. Use them to share invaluable insights on Operating And Technology Costs, Management Growth, Profit Margin and impress your audience. This template can be altered and modified as per your expectations. So, grab it now.
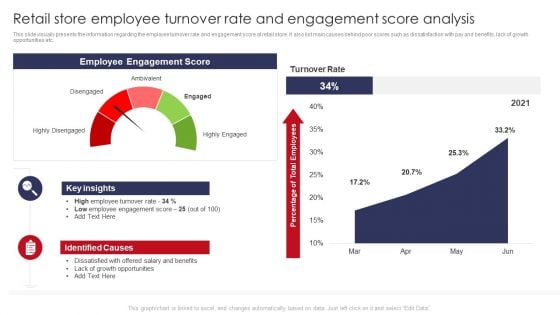
Retail Store Employee Turnover Rate And Engagement Score Analysis Retail Outlet Operations Elements PDF
This slide visually presents the information regarding the employee turnover rate and engagement score at retail store. It also list main causes behind poor scores such as dissatisfaction with pay and benefits, lack of growth opportunities etc.Deliver an awe inspiring pitch with this creative Retail Store Employee Turnover Rate And Engagement Score Analysis Retail Outlet Operations Elements PDF bundle. Topics like Employee Engagement, Identified Causes, Percentage Employees can be discussed with this completely editable template. It is available for immediate download depending on the needs and requirements of the user.
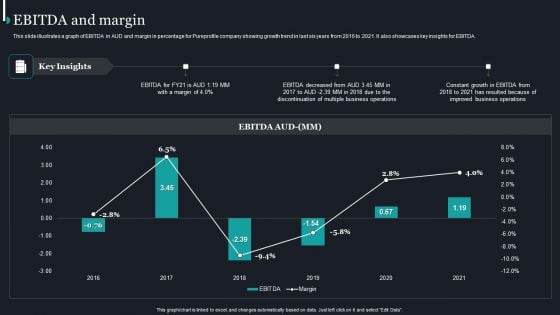
Pureprofile Business Overview EBITDA And Margin Ppt Gallery Sample PDF
This slide illustrates a graph of EBITDA in AUD and margin in percentage for Pureprofile company showing growth trend in last six years from 2016 to 2021. It also showcases key insights for EBITDA. Deliver and pitch your topic in the best possible manner with this Pureprofile Business Overview EBITDA And Margin Ppt Gallery Sample PDF. Use them to share invaluable insights on EBITDA Decreased, Business Operations, 2016 To 2021 and impress your audience. This template can be altered and modified as per your expectations. So, grab it now.
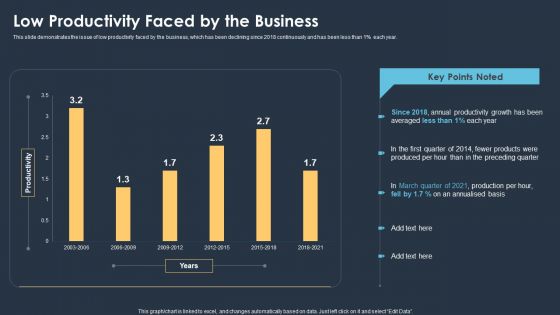
Six Sigma Methodologies For Process Optimization Low Productivity Faced By The Business Sample PDF
This slide demonstrates the issue of low productivity faced by the business, which has been declining since 2018 continuously and has been less than 1 percentage each year. Showcasing this set of slides titled Six Sigma Methodologies For Process Optimization Low Productivity Faced By The Business Sample PDF. The topics addressed in these templates are Annual Productivity Growth, Low Productivity Faced. All the content presented in this PPT design is completely editable. Download it and make adjustments in color, background, font etc. as per your unique business setting.
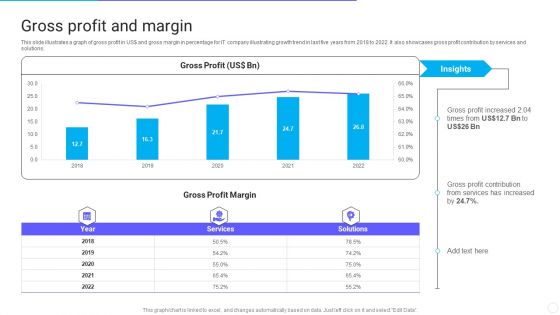
IT Application Services Company Outline Gross Profit And Margin Elements PDF
This slide illustrates a graph of gross profit in US dollar and gross margin in percentage for IT company illustrating growth trend in last five years from 2018 to 2022. It also showcases gross profit contribution by services and solutions. Deliver an awe inspiring pitch with this creative IT Application Services Company Outline Gross Profit And Margin Elements PDF bundle. Topics like Gross Profit Margin, Services can be discussed with this completely editable template. It is available for immediate download depending on the needs and requirements of the user.
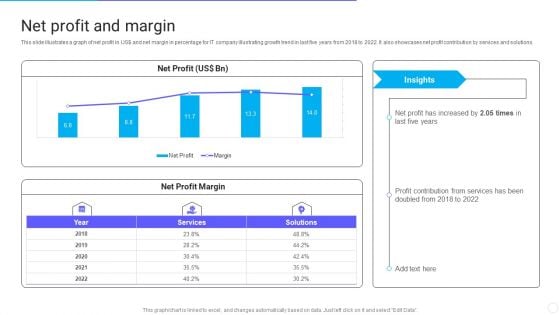
IT Application Services Company Outline Net Profit And Margin Structure PDF
This slide illustrates a graph of net profit in US dollar and net margin in percentage for IT company illustrating growth trend in last five years from 2018 to 2022. It also showcases net profit contribution by services and solutions. Deliver and pitch your topic in the best possible manner with this IT Application Services Company Outline Net Profit And Margin Structure PDF. Use them to share invaluable insights on Net Profit Margin, Services, Margin and impress your audience. This template can be altered and modified as per your expectations. So, grab it now.
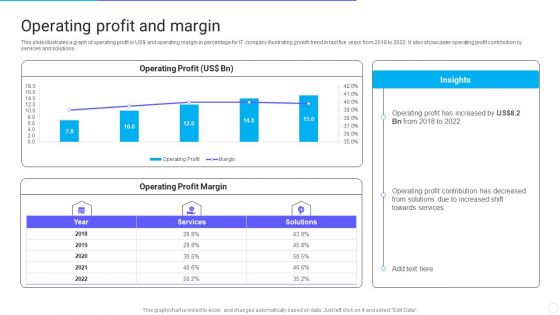
IT Application Services Company Outline Operating Profit And Margin Structure PDF
This slide illustrates a graph of operating profit in US dollar and operating margin in percentage for IT company illustrating growth trend in last five years from 2018 to 2022. It also showcases operating profit contribution by services and solutions. Deliver an awe inspiring pitch with this creative IT Application Services Company Outline Operating Profit And Margin Structure PDF bundle. Topics like Operating Profit And Margin can be discussed with this completely editable template. It is available for immediate download depending on the needs and requirements of the user.
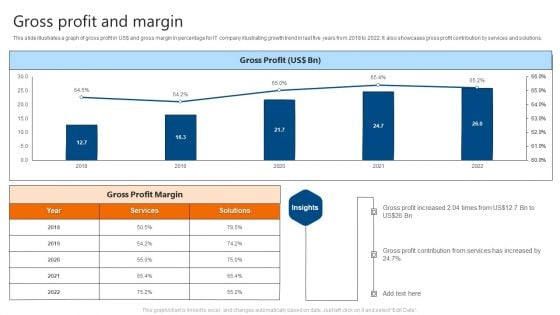
Gross Profit And Margin IT Software Development Company Profile Slides PDF
This slide illustrates a graph of gross profit in US doller and gross margin in percentage for IT company illustrating growth trend in last five years from 2018 to 2022. It also showcases gross profit contribution by services and solutions. Deliver and pitch your topic in the best possible manner with this Gross Profit And Margin IT Software Development Company Profile Slides PDF. Use them to share invaluable insights on Gross Profit, Margin and impress your audience. This template can be altered and modified as per your expectations. So, grab it now.
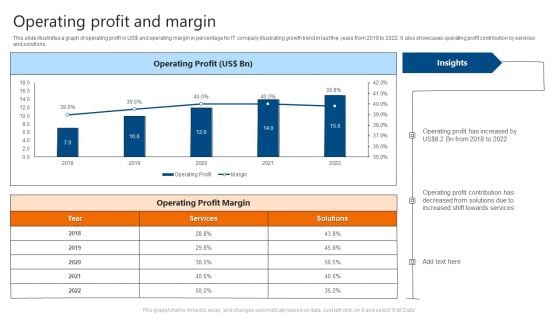
Operating Profit And Margin IT Software Development Company Profile Guidelines PDF
This slide illustrates a graph of operating profit in US doller and operating margin in percentage for IT company illustrating growth trend in last five years from 2018 to 2022. It also showcases operating profit contribution by services and solutions. Deliver and pitch your topic in the best possible manner with this Operating Profit And Margin IT Software Development Company Profile Guidelines PDF. Use them to share invaluable insights on Operating Profit, Operating Profit Margin and impress your audience. This template can be altered and modified as per your expectations. So, grab it now.
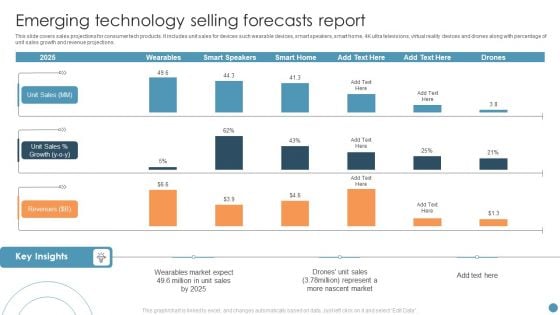
Emerging Technology Selling Forecasts Report Clipart PDF
This slide covers sales projections for consumer tech products. It includes unit sales for devices such wearable devices, smart speakers, smart home, 4K ultra televisions, virtual reality devices and drones along with percentage of unit sales growth and revenue projections. Showcasing this set of slides titled Emerging Technology Selling Forecasts Report Clipart PDF. The topics addressed in these templates are Emerging Technology Selling Forecasts, Market. All the content presented in this PPT design is completely editable. Download it and make adjustments in color, background, font etc. as per your unique business setting.
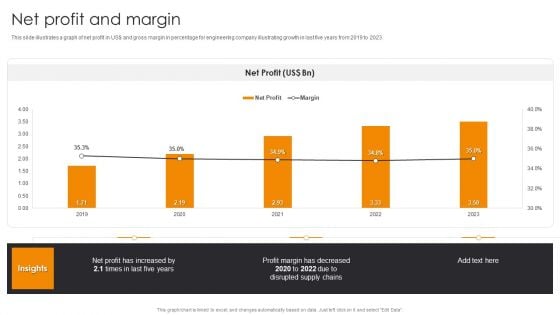
Net Profit And Margin Engineering Company Financial Analysis Report Background PDF
This slide illustrates a graph of net profit in US dollar and gross margin in percentage for engineering company illustrating growth in last five years from 2019 to 2023.Slidegeeks has constructed Net Profit And Margin Engineering Company Financial Analysis Report Background PDF after conducting extensive research and examination. These presentation templates are constantly being generated and modified based on user preferences and critiques from editors. Here, you will find the most attractive templates for a range of purposes while taking into account ratings and remarks from users regarding the content. This is an excellent jumping-off point to explore our content and will give new users an insight into our top-notch PowerPoint Templates.
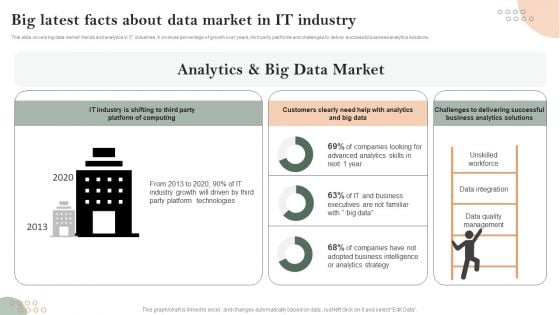
Big Latest Facts About Data Market In IT Industry Pictures PDF
This slide covers big data market trends and analytics in IT industries. It involves percentage of growth over years, third party platforms and challenges to deliver successful business analytics solutions. Showcasing this set of slides titled Big Latest Facts About Data Market In IT Industry Pictures PDF. The topics addressed in these templates are Unskilled Workforce, Data Integration, Data Quality Management. All the content presented in this PPT design is completely editable. Download it and make adjustments in color, background, font etc. as per your unique business setting.

Engineering Services Company Report Gross Profit And Margin Ppt PowerPoint Presentation File Show PDF
This slide illustrates a graph of gross profit in US dollar and gross margin in percentage for engineering company illustrating growth trend in last five years from 2018 to 2022. From laying roadmaps to briefing everything in detail, our templates are perfect for you. You can set the stage with your presentation slides. All you have to do is download these easy-to-edit and customizable templates. Engineering Services Company Report Gross Profit And Margin Ppt PowerPoint Presentation File Show PDF will help you deliver an outstanding performance that everyone would remember and praise you for. Do download this presentation today.
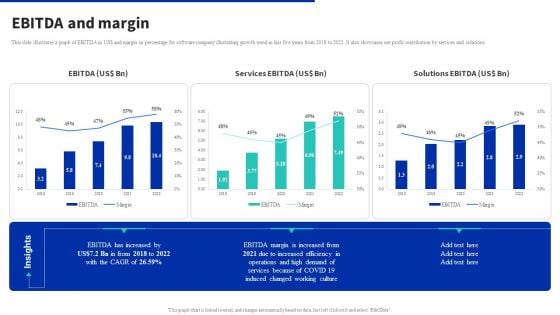
Digital Products Company Outline Ebitda And Margin Inspiration PDF
This slide illustrates a graph of EBITDA in US dollar and margin in percentage for software company illustrating growth trend in last five years from 2018 to 2022. It also showcases net profit contribution by services and solutions. Take your projects to the next level with our ultimate collection of Digital Products Company Outline Ebitda And Margin Inspiration PDF. Slidegeeks has designed a range of layouts that are perfect for representing task or activity duration, keeping track of all your deadlines at a glance. Tailor these designs to your exact needs and give them a truly corporate look with your own brand colors they will make your projects stand out from the rest.
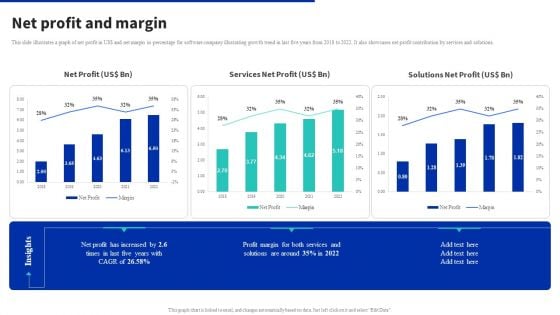
Digital Products Company Outline Net Profit And Margin Summary PDF
This slide illustrates a graph of net profit in US dollar and net margin in percentage for software company illustrating growth trend in last five years from 2018 to 2022. It also showcases net profit contribution by services and solutions. From laying roadmaps to briefing everything in detail, our templates are perfect for you. You can set the stage with your presentation slides. All you have to do is download these easy to edit and customizable templates. Digital Products Company Outline Net Profit And Margin Summary PDF will help you deliver an outstanding performance that everyone would remember and praise you for. Do download this presentation today.
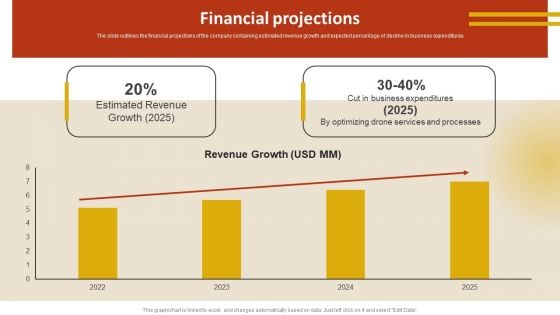
Drone Service Company Investor Funding Elevator Pitch Deck Financial Projections Structure PDF
The slide outlines the financial projections of the company containing estimated revenue growth and expected percentage of decline in business expenditures. This modern and well arranged Drone Service Company Investor Funding Elevator Pitch Deck Financial Projections Structure PDF provides lots of creative possibilities. It is very simple to customize and edit with the Powerpoint Software. Just drag and drop your pictures into the shapes. All facets of this template can be edited with Powerpoint no extra software is necessary. Add your own material, put your images in the places assigned for them, adjust the colors, and then you can show your slides to the world, with an animated slide included.
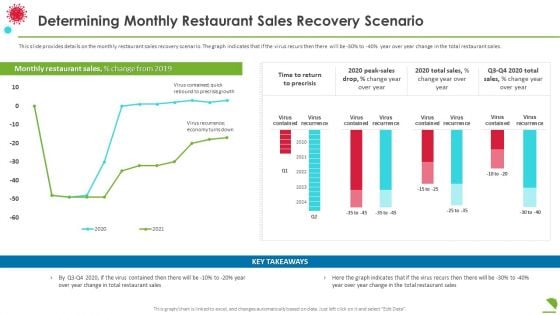
Determining Monthly Restaurant Sales Recovery Scenario Professional PDF
This slide provides details on the monthly restaurant sales recovery scenario. The graph indicates that if the virus recurs then there will be 30percentage to 40 percentage year over year change in the total restaurant sales. Deliver an awe inspiring pitch with this creative determining monthly restaurant sales recovery scenario professional pdf bundle. Topics like determining monthly restaurant sales recovery scenario can be discussed with this completely editable template. It is available for immediate download depending on the needs and requirements of the user.
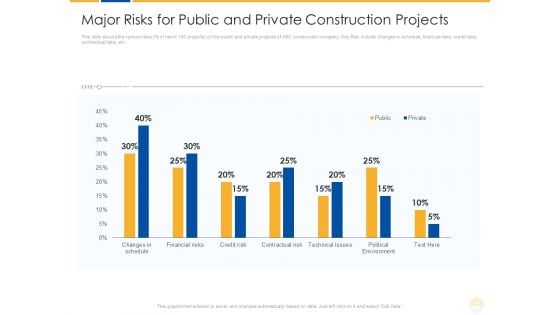
Major Risks For Public And Private Construction Projects Ppt Portfolio Deck PDF
This slide shows the various risks percentage of risk in 100 projects on the public and private projects of ABC construction company. Key Risk include changes in schedule, financial risks, credit risks, contractual risks, etc. Deliver an awe inspiring pitch with this creative major risks for public and private construction projects ppt portfolio deck pdf bundle. Topics like financial risks, technical, environment can be discussed with this completely editable template. It is available for immediate download depending on the needs and requirements of the user.

Russia Ukraine War Influence On Airline Sector Decrease In Booking Of Passenger Ticket Sales Topics PDF
This slide showcases graph about decrease in number of passenger ticket sales due to Russia Ukraine conflict. It can help to determine percentage change in ticket sales as compared to last year Deliver and pitch your topic in the best possible manner with this russia ukraine war influence on airline sector decrease in booking of passenger ticket sales topics pdf Use them to share invaluable insights on decrease in booking of passenger ticket sales and impress your audience. This template can be altered and modified as per your expectations. So, grab it now.
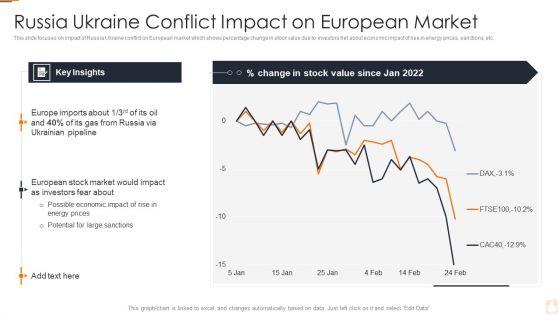
Ukraine Russia Conflict Effect On Petroleum Industry Russia Ukraine Conflict Impact Topics PDF
This slide focuses on impact of Russia Ukraine conflict on European market which shows percentage change in stock value due to investors fret about economic impact of rise in energy prices, sanctions, etc.Deliver an awe inspiring pitch with this creative Ukraine Russia Conflict Effect On Petroleum Industry Russia Ukraine Conflict Impact Topics PDF bundle. Topics like Russia Ukraine Conflict Impact On European Market can be discussed with this completely editable template. It is available for immediate download depending on the needs and requirements of the user.
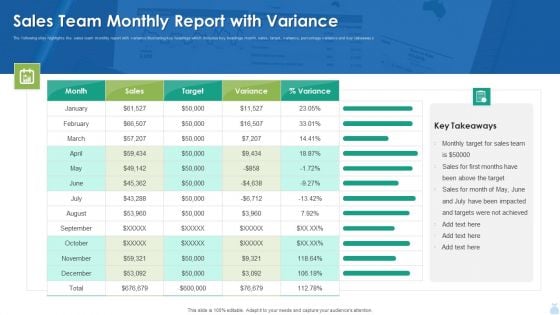
Sales Team Monthly Report With Variance Background PDF
The following slide highlights the sales team monthly report with variance illustrating key headings which includes key headings month, sales, target, variance, percentage variance and key takeaways. Pitch your topic with ease and precision using this Sales Team Monthly Report With Variance Background PDF. This layout presents information on Sales Team Monthly Report With Variance Background PDF. It is also available for immediate download and adjustment. So, changes can be made in the color, design, graphics or any other component to create a unique layout.
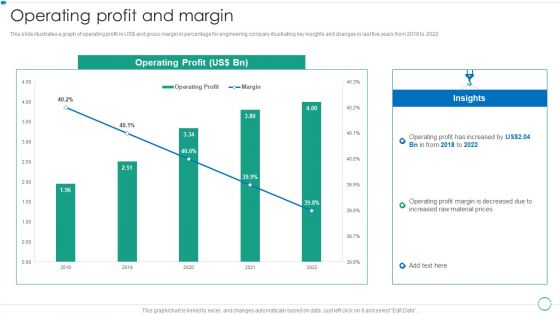
Real Estate Construction And Engineering Company Profile Operating Profit And Margin Designs PDF
This slide illustrates a graph of operating profit in US and gross margin in percentage for engineering company illustrating key insights and changes in last five years from 2018 to 2022.Deliver and pitch your topic in the best possible manner with this Real Estate Construction And Engineering Company Profile Operating Profit And Margin Designs PDF. Use them to share invaluable insights on Operating Profit, Insights, Material Prices and impress your audience. This template can be altered and modified as per your expectations. So, grab it now.
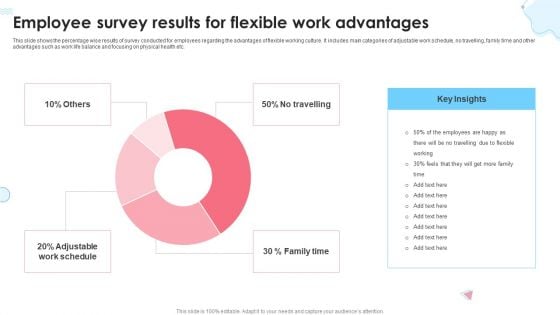
Employee Survey Results For Flexible Work Advantages Ppt Infographic Template Guidelines PDF
This slide shows the percentage wise results of survey conducted for employees regarding the advantages of flexible working culture. It includes main categories of adjustable work schedule, no travelling, family time and other advantages such as work life balance and focusing on physical health etc. Pitch your topic with ease and precision using this Employee Survey Results For Flexible Work Advantages Ppt Infographic Template Guidelines PDF. This layout presents information on Key Insights, Family Time, Adjustable Work Schedule, No Travelling. It is also available for immediate download and adjustment. So, changes can be made in the color, design, graphics or any other component to create a unique layout.
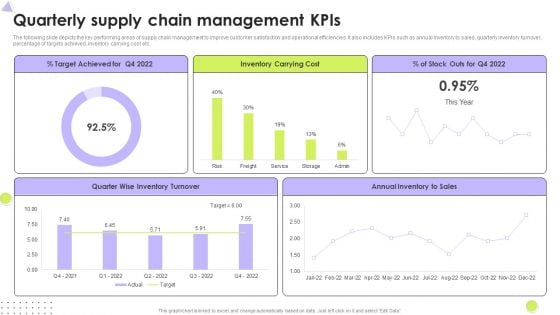
Quarterly Supply Chain Management Kpis Mockup PDF
The following slide depicts the key performing areas of supply chain management to improve customer satisfaction and operational efficiencies. It also includes KPIs such as annual inventory to sales, quarterly inventory turnover, percentage of targets achieved, inventory carrying cost etc. Pitch your topic with ease and precision using this Quarterly Supply Chain Management Kpis Mockup PDF. This layout presents information on Inventory Turnover, Inventory Carrying Cost, Target Achieved. It is also available for immediate download and adjustment. So, changes can be made in the color, design, graphics or any other component to create a unique layout.
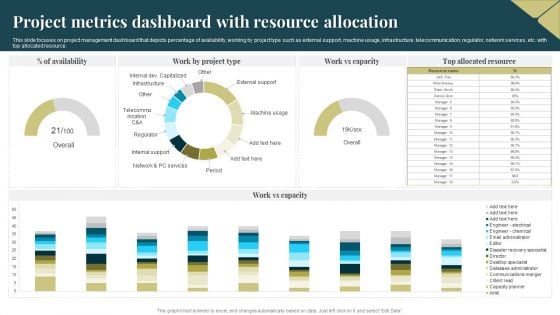
Project Metrics Dashboard With Resource Allocation Portrait PDF
This slide focuses on project management dashboard that depicts percentage of availability, working by project type such as external support, machine usage, infrastructure, telecommunication, regulator, network services, etc. with top allocated resource. Pitch your topic with ease and precision using this Project Metrics Dashboard With Resource Allocation Portrait PDF. This layout presents information on Project Metrics Dashboard, Resource Allocation. It is also available for immediate download and adjustment. So, changes can be made in the color, design, graphics or any other component to create a unique layout.
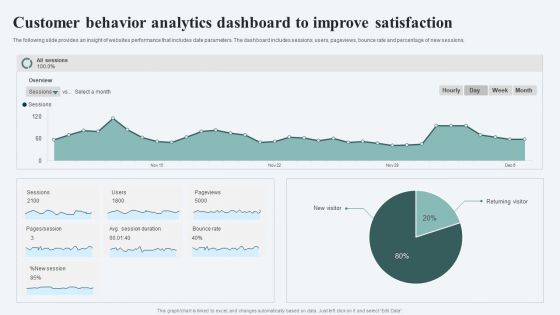
Customer Behavior Analytics Dashboard To Improve Satisfaction Ppt File Infographics PDF
The following slide provides an insight of websites performance that includes date parameters. The dashboard includes sessions, users, pageviews, bounce rate and percentage of new sessions. Pitch your topic with ease and precision using this Customer Behavior Analytics Dashboard To Improve Satisfaction Ppt File Infographics PDF. This layout presents information on Session, Avg Session Duration, Bounce Rate. It is also available for immediate download and adjustment. So, changes can be made in the color, design, graphics or any other component to create a unique layout.
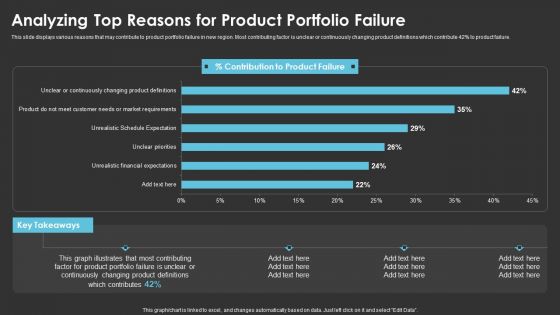
Analyzing Top Reasons For Product Portfolio Failure Designs PDF
This slide displays various reasons that may contribute to product portfolio failure in new region. Most contributing factor is unclear or continuously changing product definitions which contribute 42 percentage to product failure. Deliver and pitch your topic in the best possible manner with this Analyzing Top Reasons For Product Portfolio Failure Designs PDF. Use them to share invaluable insights on Product Portfolio, Analyzing Top Reasons and impress your audience. This template can be altered and modified as per your expectations. So, grab it now.
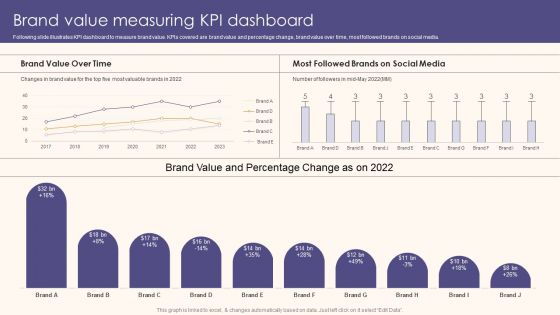
Brand Value Measuring KPI Dashboard Guide To Understand Evaluate And Enhance Brand Value Slides PDF
Following slide illustrates KPI dashboard to measure brand value. KPIs covered are brand value and percentage change, brand value over time, most followed brands on social media.Take your projects to the next level with our ultimate collection of Brand Value Measuring KPI Dashboard Guide To Understand Evaluate And Enhance Brand Value Slides PDF. Slidegeeks has designed a range of layouts that are perfect for representing task or activity duration, keeping track of all your deadlines at a glance. Tailor these designs to your exact needs and give them a truly corporate look with your own brand colors they all make your projects stand out from the rest
Tracking Goals Alignment KPI Dashboard Guidelines PDF
This slide showcases a tracking dashboard for determining the alignment and progress percentage of the assigned objectives. It also includes the objective evaluation KPIs such as active objectives, overall progress, total employees, objective as per employees, aligned, organizational and departmental objectives. Pitch your topic with ease and precision using this Tracking Goals Alignment KPI Dashboard Guidelines PDF. This layout presents information on Employee, Organizational Objectives, Departmental Objectives. It is also available for immediate download and adjustment. So, changes can be made in the color, design, graphics or any other component to create a unique layout.
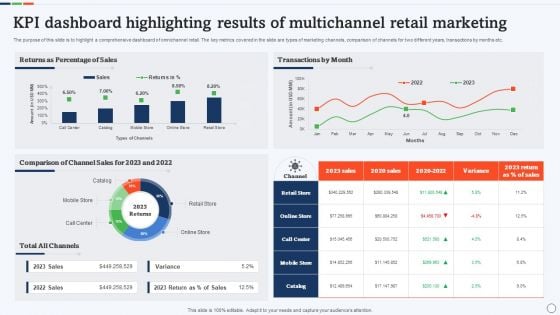
KPI Dashboard Highlighting Results Of Multichannel Retail Marketing Rules PDF
The purpose of this slide is to highlight a comprehensive dashboard of omnichannel retail. The key metrics covered in the slide are types of marketing channels, comparison of channels for two different years, transactions by months etc. Pitch your topic with ease and precision using this KPI Dashboard Highlighting Results Of Multichannel Retail Marketing Rules PDF. This layout presents information on Comparison Of Channel Sales, Percentage Of Sales, Transactions By Month. It is also available for immediate download and adjustment. So, changes can be made in the color, design, graphics or any other component to create a unique layout.
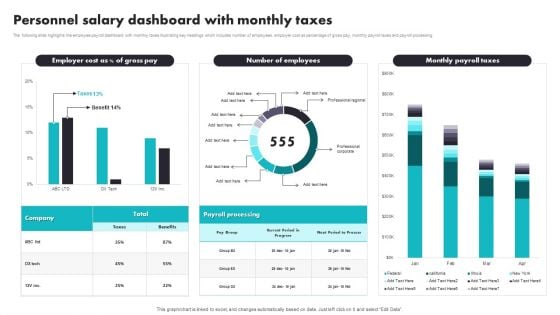
Personnel Salary Dashboard With Monthly Taxes Introduction PDF
The following slide highlights the employee payroll dashboard with monthly taxes illustrating key headings which includes number of employees, employer cost as percentage of gross pay, monthly payroll taxes and payroll processing. Pitch your topic with ease and precision using this Personnel Salary Dashboard With Monthly Taxes Introduction PDF. This layout presents information on Payroll Processing, Benefits. It is also available for immediate download and adjustment. So, changes can be made in the color, design, graphics or any other component to create a unique layout.
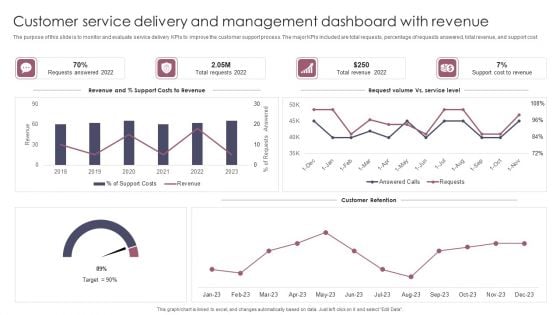
Customer Service Delivery And Management Dashboard With Revenue Brochure PDF
The purpose of this slide is to monitor and evaluate service delivery KPIs to improve the customer support process. The major KPIs included are total requests, percentage of requests answered, total revenue, and support cost. Pitch your topic with ease and precision using this Customer Service Delivery And Management Dashboard With Revenue Brochure PDF. This layout presents information on Customer Service Delivery, Management Dashboard With Revenue. It is also available for immediate download and adjustment. So, changes can be made in the color, design, graphics or any other component to create a unique layout.
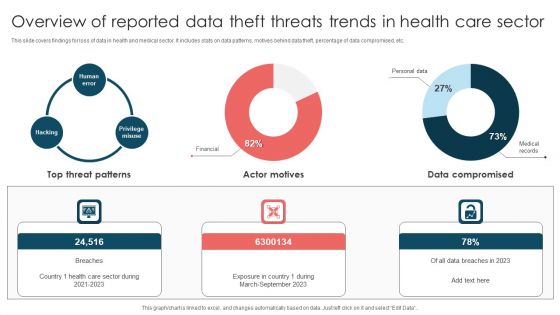
Overview Of Reported Data Theft Threats Trends In Health Care Sector Introduction PDF
This slide covers findings for loss of data in health and medical sector. It includes stats on data patterns, motives behind data theft, percentage of data compromised, etc. Pitch your topic with ease and precision using this Overview Of Reported Data Theft Threats Trends In Health Care Sector Introduction PDF. This layout presents information on Top Threat Patterns, Exposure Country, March To September 2023. It is also available for immediate download and adjustment. So, changes can be made in the color, design, graphics or any other component to create a unique layout.
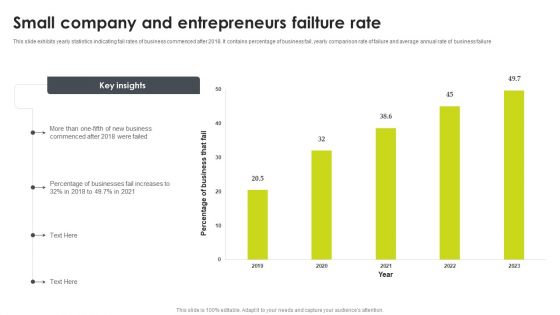
Small Company And Entrepreneurs Failture Rate Summary PDF
This slide exhibits yearly statistics indicating fail rates of business commenced after 2018. It contains percentage of business fail, yearly comparison rate of failure and average annual rate of business failure. Pitch your topic with ease and precision using this Small Company And Entrepreneurs Failture Rate Summary PDF. This layout presents information on Entrepreneurs Failture Rate, Business. It is also available for immediate download and adjustment. So, changes can be made in the color, design, graphics or any other component to create a unique layout.
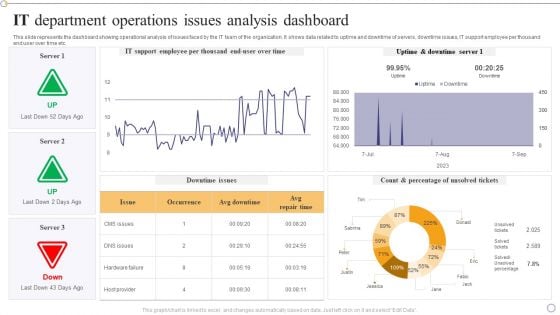
IT Department Operations Issues Analysis Dashboard Designs PDF
This slide represents the dashboard showing operational analysis of issues faced by the IT team of the organization. It shows data related to uptime and downtime of servers, downtime issues, IT support employee per thousand end user over time etc.Pitch your topic with ease and precision using this IT Department Operations Issues Analysis Dashboard Designs PDF. This layout presents information on Support Employee, Uptime Downtime, Percentage Unsolved. It is also available for immediate download and adjustment. So, changes can be made in the color, design, graphics or any other component to create a unique layout.
Project Tracking Planned Vs Actual Project Progress Tracker Pictures PDF
The following slide highlights the variations in the project progress to manage the its and ensure timely delivery. It includes KPIs such as completion percentage and the gap in the planned versus actual hours. Pitch your topic with ease and precision using this Project Tracking Planned Vs Actual Project Progress Tracker Pictures PDF. This layout presents information on Project Tracking Planned, Project Progress Tracker. It is also available for immediate download and adjustment. So, changes can be made in the color, design, graphics or any other component to create a unique layout.
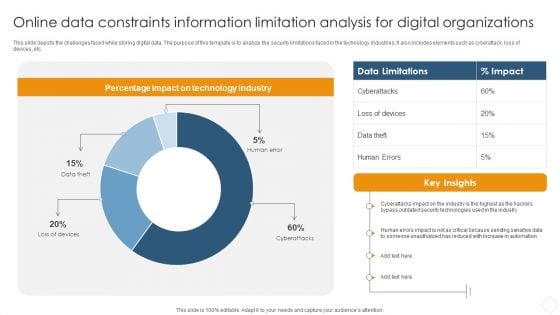
Online Data Constraints Information Limitation Analysis For Digital Organizations Information PDF
This slide depicts the challenges faced while storing digital data. The purpose of this template is to analyze the security limitations faced in the technology industries. It also includes elements such as cyberattack, loss of devices, etc.Pitch your topic with ease and precision using this Online Data Constraints Information Limitation Analysis For Digital Organizations Information PDF. This layout presents information on Percentage Impact, Technology Industry, Security Technologies. It is also available for immediate download and adjustment. So, changes can be made in the color, design, graphics or any other component to create a unique layout.
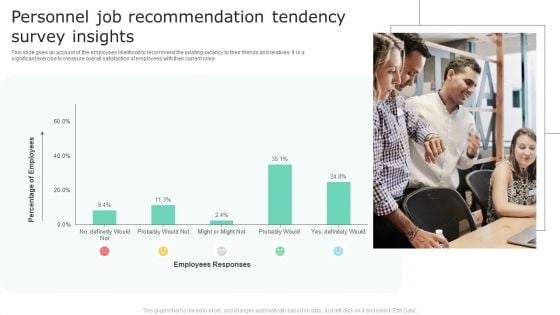
Personnel Job Recommendation Tendency Survey Insights Topics PDF
This slide gives an account of the employees likelihood to recommend the existing vacancy to their friends and relatives. It is a significant exercise to measure overall satisfaction of employees with their current roles. Pitch your topic with ease and precision using this Personnel Job Recommendation Tendency Survey Insights Topics PDF. This layout presents information on Percentage Of Employees, Employees Responses. It is also available for immediate download and adjustment. So, changes can be made in the color, design, graphics or any other component to create a unique layout.
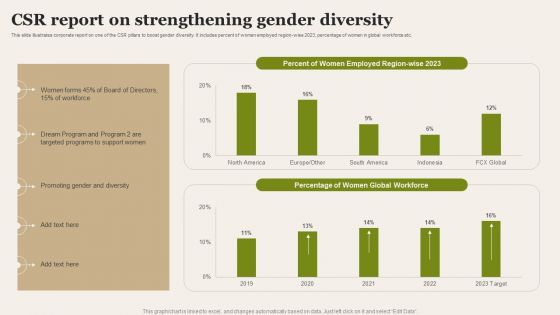
CSR Report On Strengthening Gender Diversity Introduction PDF
This slide illustrates corporate report on one of the CSR pillars to boost gender diversity. It includes percent of women employed region wise 2023, percentage of women in global workforce etc. Pitch your topic with ease and precision using this CSR Report On Strengthening Gender Diversity Introduction PDF. This layout presents information on Targeted Programs, Strengthening Gender Diversity. It is also available for immediate download and adjustment. So, changes can be made in the color, design, graphics or any other component to create a unique layout.
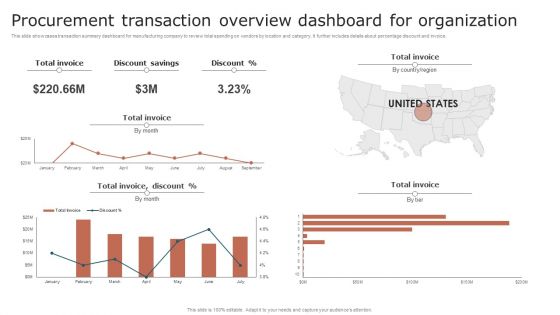
Procurement Transaction Overview Dashboard For Organization Background PDF
This slide showcases transaction summary dashboard for manufacturing company to review total spending on vendors by location and category. It further includes details about percentage discount and invoice. Pitch your topic with ease and precision using this Procurement Transaction Overview Dashboard For Organization Background PDF. This layout presents information on Procurement Transaction, Overview Dashboard For Organization. It is also available for immediate download and adjustment. So, changes can be made in the color, design, graphics or any other component to create a unique layout.
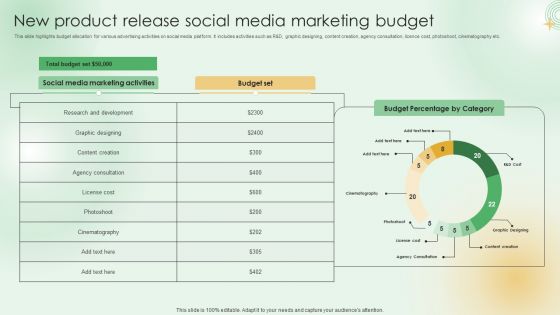
New Product Release Social Media Marketing Budget Clipart PDF
This slide highlights budget allocation for various advertising activities on social media platform. It includes activities such as R and D, graphic designing, content creation, agency consultation, licence cost, photoshoot, cinematography etc. Pitch your topic with ease and precision using this New Product Release Social Media Marketing Budget Clipart PDF. This layout presents information on Total Budget Set, Social Media Marketing Activities, Budget Percentage Category. It is also available for immediate download and adjustment. So, changes can be made in the color, design, graphics or any other component to create a unique layout.
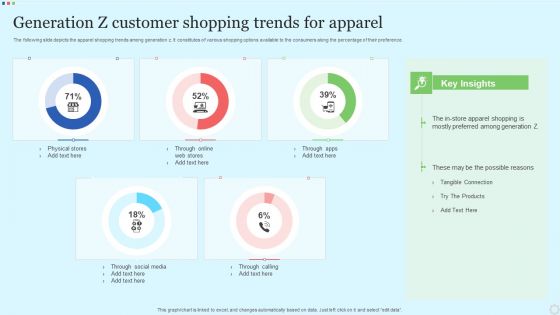
Generation Z Customer Shopping Trends For Apparel Designs PDF
The following slide depicts the apparel shopping trends among generation z. It constitutes of various shopping options available to the consumers along the percentage of their preference. Pitch your topic with ease and precision using this Generation Z Customer Shopping Trends For Apparel Designs PDF. This layout presents information on Physical Stores, Through Social Media, Through Calling. It is also available for immediate download and adjustment. So, changes can be made in the color, design, graphics or any other component to create a unique layout.

Quarterly Sales Performance Of Business Analysis With Key Insights Information PDF
In this slide sales performance of each product is recorded as their percentage share in total sales first quarter of company. The goods include headphones, joystick, mouse pad, bluetooth speaker, etc. Pitch your topic with ease and precision using this Quarterly Sales Performance Of Business Analysis With Key Insights Information PDF. This layout presents information on Wireless Mouse, Keyboard, Mouse Pad, Joystick, Headsets. It is also available for immediate download and adjustment. So, changes can be made in the color, design, graphics or any other component to create a unique layout.
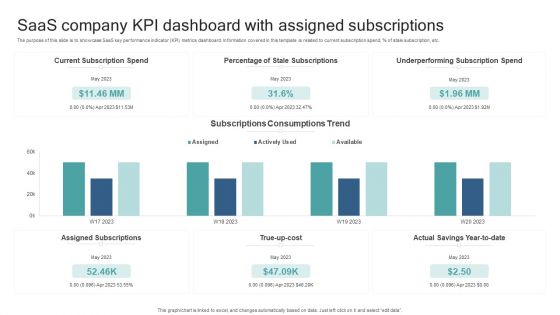
Saas Company KPI Dashboard With Assigned Subscriptions Formats PDF
The purpose of this slide is to showcase SaaS key performance indicator KPI metrics dashboard. Information covered in this template is related to current subscription spend, percent of stale subscription, etc. Pitch your topic with ease and precision using this Saas Company KPI Dashboard With Assigned Subscriptions Formats PDF. This layout presents information on Current Subscription Spend, Percentage Of Stale Subscriptions, True Up Cost, Underperforming Subscription Spend. It is also available for immediate download and adjustment. So, changes can be made in the color, design, graphics or any other component to create a unique layout.
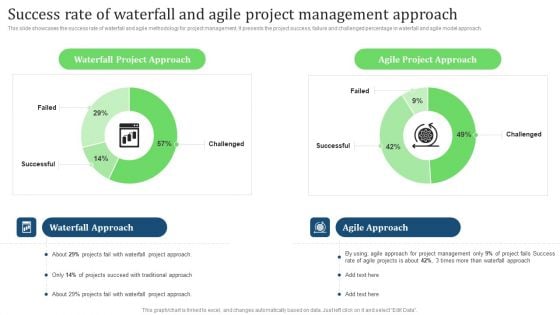
Success Rate Of Waterfall And Agile Project Management Approach Infographics PDF
This slide showcases the success rate of waterfall and agile methodology for project management. It presents the project success, failure and challenged percentage in waterfall and agile model approach. If your project calls for a presentation, then Slidegeeks is your go-to partner because we have professionally designed, easy-to-edit templates that are perfect for any presentation. After downloading, you can easily edit Success Rate Of Waterfall And Agile Project Management Approach Infographics PDF and make the changes accordingly. You can rearrange slides or fill them with different images. Check out all the handy templates
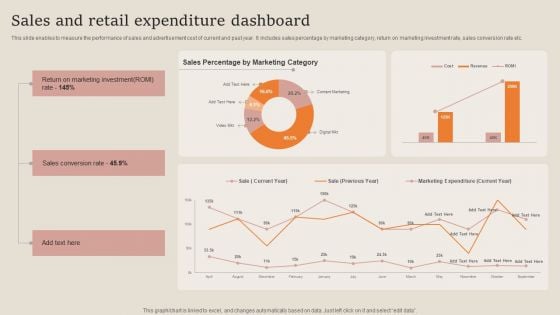
Sales And Retail Expenditure Dashboard Guidelines PDF
This slide enables to measure the performance of sales and advertisement cost of current and past year. It includes sales percentage by marketing category, return on marketing investment rate, sales conversion rate etc. Pitch your topic with ease and precision using this Sales And Retail Expenditure Dashboard Guidelines PDF. This layout presents information on Sales Conversion Rate, Marketing Investment. It is also available for immediate download and adjustment. So, changes can be made in the color, design, graphics or any other component to create a unique layout.

Dashboard To Measure Robotic Process Automation Bots Performance Structure PDF
This slide presents a dashboard to measure RPA bots performance in an organization. It includes utilization hours, bot types, average daily utilization, percentage of errors that occurred by bots, and occupied bots by business operations. If your project calls for a presentation, then Slidegeeks is your go-to partner because we have professionally designed, easy-to-edit templates that are perfect for any presentation. After downloading, you can easily edit Dashboard To Measure Robotic Process Automation Bots Performance Structure PDF and make the changes accordingly. You can rearrange slides or fill them with different images. Check out all the handy templates
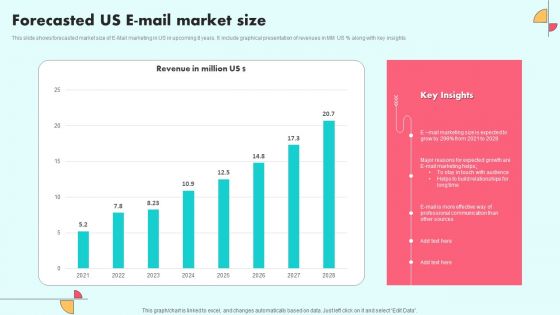
Forecasted Us E Mail Market Size Ideas PDF
This slide shows forecasted market size of E-Mail marketing in US in upcoming 8 years. It include graphical presentation of revenues in MM US percentage along with key insights. Pitch your topic with ease and precision using this Forecasted Us E Mail Market Size Ideas PDF. This layout presents information on E Mail Marketing, Sources, Communication. It is also available for immediate download and adjustment. So, changes can be made in the color, design, graphics or any other component to create a unique layout.
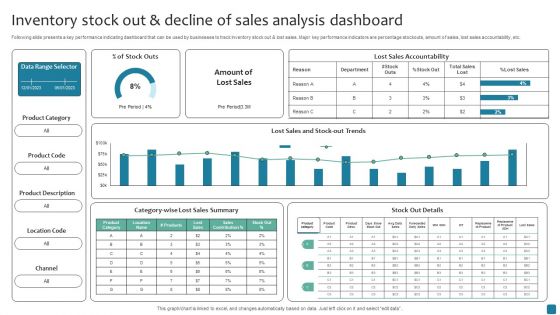
Inventory Stock Out And Decline Of Sales Analysis Dashboard Inspiration PDF
Following slide presents a key performance indicating dashboard that can be used by businesses to track Inventory stock out and lost sales. Major key performance indicators are percentage stockouts, amount of sales, lost sales accountability, etc. Pitch your topic with ease and precision using this Inventory Stock Out And Decline Of Sales Analysis Dashboard Inspiration PDF. This layout presents information on Lost Sales Summary, Stock Out Details It is also available for immediate download and adjustment. So, changes can be made in the color, design, graphics or any other component to create a unique layout.

Net Promoter Score Trends With Promoters Passives Detractors Background PDF
This slide presents NPS trend over time with percentage change in promoters, passives and detractors over four consecutive years. It includes total net promoter score for each year that highlights customer loyalty and benchmarks satisfaction level Showcasing this set of slides titled Net Promoter Score Trends With Promoters Passives Detractors Background PDF. The topics addressed in these templates are Trend, Detractors, Net. All the content presented in this PPT design is completely editable. Download it and make adjustments in color, background, font etc. as per your unique business setting.

Agile Group For Product Development Action Plan For Cross Functional Product Teams Ideas PDF
This slide shows action plan for cross functional product teams which includes goal, number of completed tasks and percentage of completed goals, action, responsible person, required resources, status, etc. Deliver an awe inspiring pitch with this creative agile group for product development action plan for cross functional product teams ideas pdf bundle. Topics like salesforce account info, software subscription, survey software can be discussed with this completely editable template. It is available for immediate download depending on the needs and requirements of the user.
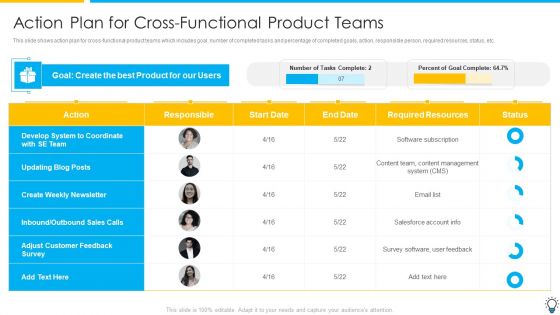
Assuring Management In Product Innovation To Enhance Processes Action Plan For Cross Functional Product Teams Formats PDF
This slide shows action plan for cross functional product teams which includes goal, number of completed tasks and percentage of completed goals, action, responsible person, required resources, status, etc.Deliver an awe inspiring pitch with this creative assuring management in product innovation to enhance processes action plan for cross functional product teams formats pdf bundle. Topics like create weekly newsletter, inbound or outbound, adjust customer can be discussed with this completely editable template. It is available for immediate download depending on the needs and requirements of the user.
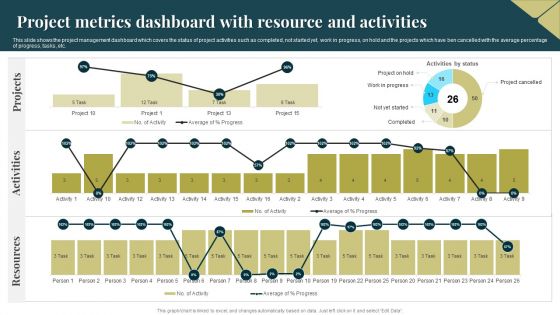
Project Metrics Dashboard With Resource And Activities Infographics PDF
This slide shows the project management dashboard which covers the status of project activities such as completed, not started yet, work in progress, on hold and the projects which have ben cancelled with the average percentage of progress, tasks, etc. Showcasing this set of slides titled Project Metrics Dashboard With Resource And Activities Infographics PDF. The topics addressed in these templates are Activities, Projects, Resources. All the content presented in this PPT design is completely editable. Download it and make adjustments in color, background, font etc. as per your unique business setting.
Multiple Projects Progress Tracking Report Tracking Report With Bar Graph Information PDF
This slide shows the status report of various projects in order to help the project manager to track their performance. It includes project names, no.of tasks, start and end date, days taken for completion, progress and remaining percentage of projects.Showcasing this set of slides titled Multiple Projects Progress Tracking Report Tracking Report With Bar Graph Information PDF. The topics addressed in these templates are Multiple Projects, Progress Tracking, Report Tracking Report. All the content presented in this PPT design is completely editable. Download it and make adjustments in color, background, font etc. as per your unique business setting.

Modal Transportation Share In United States Brochure PDF
The slide shows the pie chart presentation of percentage share of all modes of transportations Trains, Passenger cars, Other motor, buses etc., that travelers used to commute. Additionally, it provides key details related to companys strategic plan to attract new customers.Deliver and pitch your topic in the best possible manner with this modal transportation share in united states brochure pdf. Use them to share invaluable insights on transportation share 2021 and impress your audience. This template can be altered and modified as per your expectations. So, grab it now.
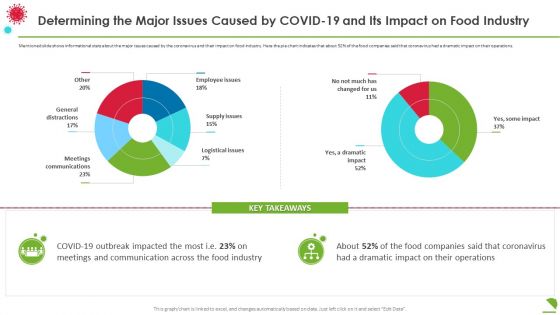
Determining The Major Issues Caused By Covid19 And Its Impact On Food Industry Demonstration PDF
Mentioned slide shows informational stats about the major issues caused by the coronavirus and their impact on food industry. Here the pie chart indicates that about 52 percentage of the food companies said that coronavirus had a dramatic impact on their operations. Deliver and pitch your topic in the best possible manner with this determining the major issues caused by covid19 and its impact on food industry demonstration pdf. Use them to share invaluable insights on communication, industry, dramatic and impress your audience. This template can be altered and modified as per your expectations. So, grab it now.
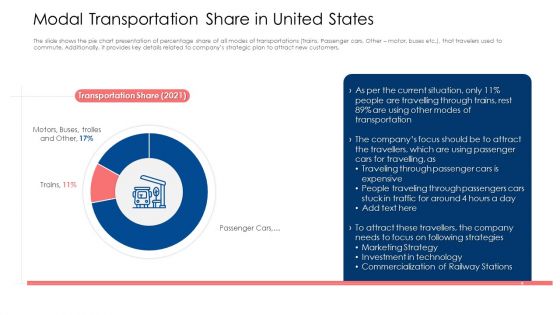
Modal Transportation Share In United States Ppt Inspiration Master Slide PDF
The slide shows the pie chart presentation of percentage share of all modes of transportations Trains, Passenger cars, Other motor, buses etc., that travelers used to commute. Additionally, it provides key details related to companys strategic plan to attract new customers. Deliver and pitch your topic in the best possible manner with this modal transportation share in united states ppt inspiration master slide pdf. Use them to share invaluable insights on marketing strategy, investment in technology, strategies and impress your audience. This template can be altered and modified as per your expectations. So, grab it now.
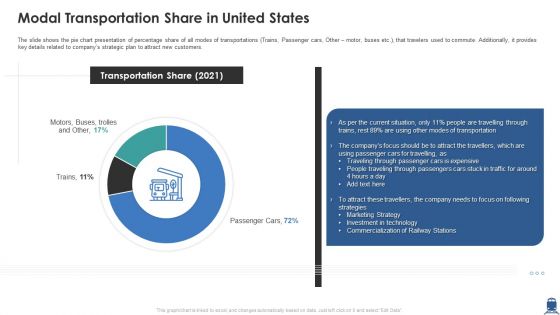
Modal Transportation Share In United States Sample PDF
The slide shows the pie chart presentation of percentage share of all modes of transportations Trains, Passenger cars, Other motor, buses etc. that travelers used to commute. Additionally, it provides key details related to companys strategic plan to attract new customers. Deliver and pitch your topic in the best possible manner with this modal transportation share in united states sample pdf. Use them to share invaluable insights on marketing strategy, investment technology, commercialization and impress your audience. This template can be altered and modified as per your expectations. So, grab it now.
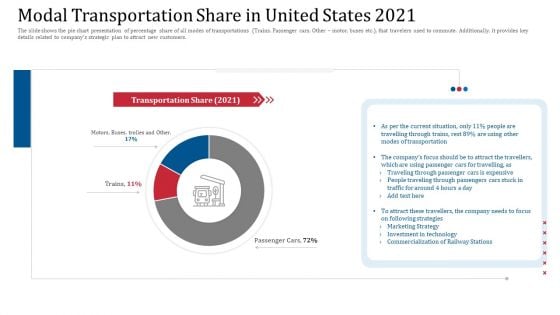
Modal Transportation Share In United States 2021 Introduction PDF
The slide shows the pie chart presentation of percentage share of all modes of transportations Trains, Passenger cars, Other motor, buses etc, that travelers used to commute. Additionally, it provides key details related to companys strategic plan to attract new customers.Deliver an awe inspiring pitch with this creative modal transportation share in united states 2021 introduction pdf bundle. Topics like modes of transportation, commercialization of railway, marketing strategy can be discussed with this completely editable template. It is available for immediate download depending on the needs and requirements of the user.
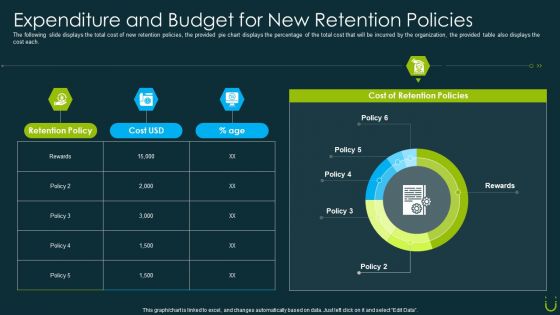
Staff Retention Plan Expenditure And Budget For New Retention Policies Ppt Ideas Graphics PDF
The following slide displays the total cost of new retention policies, the provided pie chart displays the percentage of the total cost that will be incurred by the organization, the provided table also displays the cost each. Deliver an awe inspiring pitch with this creative staff retention plan expenditure and budget for new retention policies ppt ideas graphics pdf bundle. Topics like expenditure and budget for new retention policies can be discussed with this completely editable template. It is available for immediate download depending on the needs and requirements of the user.
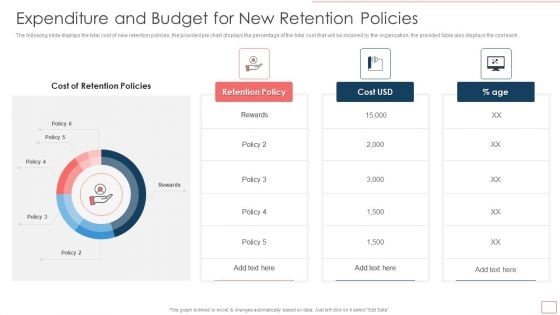
Strategic Human Resource Retention Management Expenditure And Budget Inspiration PDF
The following slide displays the total cost of new retention policies, the provided pie chart displays the percentage of the total cost that will be incurred by the organization, the provided table also displays the cost each. Deliver an awe inspiring pitch with this creative Strategic Human Resource Retention Management Expenditure And Budget Inspiration PDF bundle. Topics like Retention Policies, Rewards, Cost Of Retention can be discussed with this completely editable template. It is available for immediate download depending on the needs and requirements of the user.
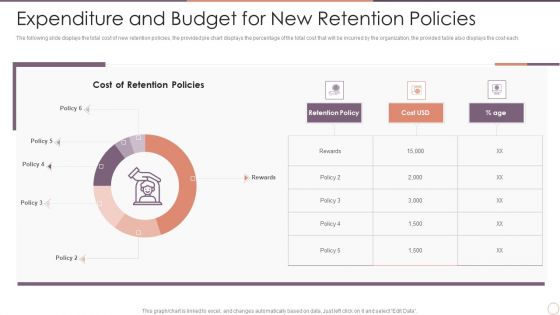
Managing Employee Turnover Expenditure And Budget For New Retention Policies Topics PDF
The following slide displays the total cost of new retention policies, the provided pie chart displays the percentage of the total cost that will be incurred by the organization, the provided table also displays the cost each. Deliver and pitch your topic in the best possible manner with this Managing Employee Turnover Expenditure And Budget For New Retention Policies Topics PDF. Use them to share invaluable insights on Expenditure And Budget, New Retention Policies and impress your audience. This template can be altered and modified as per your expectations. So, grab it now.
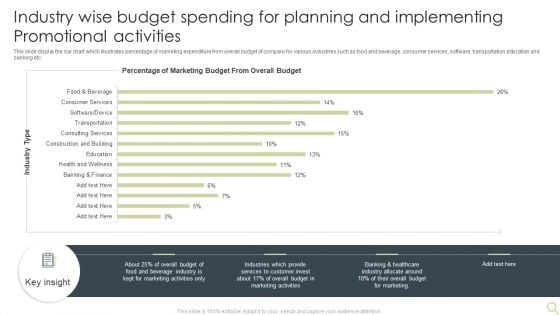
Industry Wise Budget Spending For Planning And Implementing Promotional Activities Introduction PDF
This slide display the bar chart which illustrates percentage of marketing expenditure from overall budget of company for various industries such as food and beverage, consumer services, software, transportation,education and banking etc. Showcasing this set of slides titled Industry Wise Budget Spending For Planning And Implementing Promotional Activities Introduction PDF. The topics addressed in these templates are Marketing, Beverage Industry, Budget. All the content presented in this PPT design is completely editable. Download it and make adjustments in color, background, font etc. as per your unique business setting.
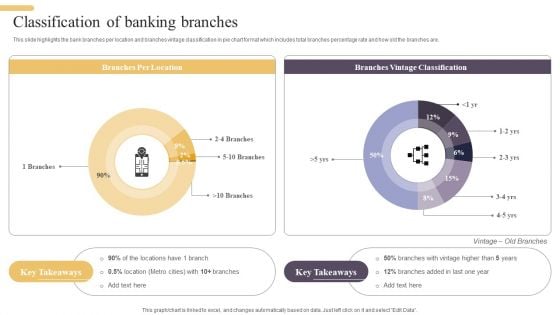
Improving Digital Banking Operations And Services Framework Classification Of Banking Branches Brochure PDF
This slide highlights the bank branches per location and branches vintage classification in pie chart format which includes total branches percentage rate and how old the branches are. Take your projects to the next level with our ultimate collection of Improving Digital Banking Operations And Services Framework Classification Of Banking Branches Brochure PDF. Slidegeeks has designed a range of layouts that are perfect for representing task or activity duration, keeping track of all your deadlines at a glance. Tailor these designs to your exact needs and give them a truly corporate look with your own brand colors they will make your projects stand out from the rest.
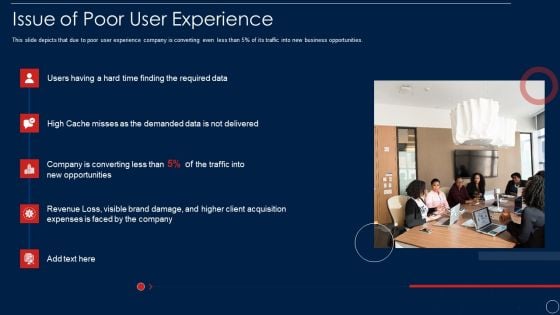
Redis Cache Data Structure IT Issue Of Poor User Experience Diagrams PDF
This slide depicts that due to poor user experience company is converting even less than 5 percentage of its traffic into new business opportunities. This is a redis cache data structure it issue of poor user experience diagrams pdf template with various stages. Focus and dispense information on five stages using this creative set, that comes with editable features. It contains large content boxes to add your information on topics like demanded, required, opportunities, expenses, revenue. You can also showcase facts, figures, and other relevant content using this PPT layout. Grab it now.

Sales Management Pipeline For Effective Lead Generation Measuring Sales Opportunities At Each Stage Diagrams PDF
This slide shows the status and completion percentage to each stage of pipeline to identify the sales pipeline opportunities. Presenting Sales Management Pipeline For Effective Lead Generation Measuring Sales Opportunities At Each Stage Diagrams PDF to provide visual cues and insights. Share and navigate important information on eight stages that need your due attention. This template can be used to pitch topics like Opportunity, Evaluate The Solution, Cost. In addtion, this PPT design contains high resolution images, graphics, etc, that are easily editable and available for immediate download.
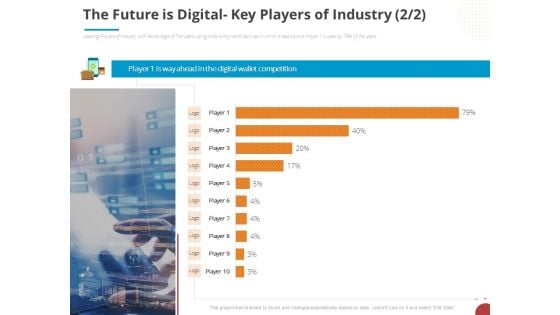
Online Settlement Revolution The Future Is Digital Key Players Of Industry Wallet Download PDF
Leading Players of Industry with Percentage of The Users Using Mobile Payments Services in which it depicts that Player 1 is used by 79 pervent of the users. Deliver and pitch your topic in the best possible manner with this online settlement revolution the future is digital key players of industry wallet download pdf. Use them to share invaluable insights on the future is digital- key players of industry and impress your audience. This template can be altered and modified as per your expectations. So, grab it now.

PPM Private Equity Key Streams Of Revenue Generation Ppt PowerPoint Presentation Infographic Template Show PDF
This slide shows Revenue Model of the Company with various revenue earning Channels that the Company has such as Online Stores, Product Sales, Subscription Fees etc. along with their respective percentage of the Total Revenue. Deliver an awe-inspiring pitch with this creative ppm private equity key streams of revenue generation ppt powerpoint presentation infographic template show pdf bundle. Topics like subscription fee technology, digital service, product sale, online sale, total revenue can be discussed with this completely editable template. It is available for immediate download depending on the needs and requirements of the user.
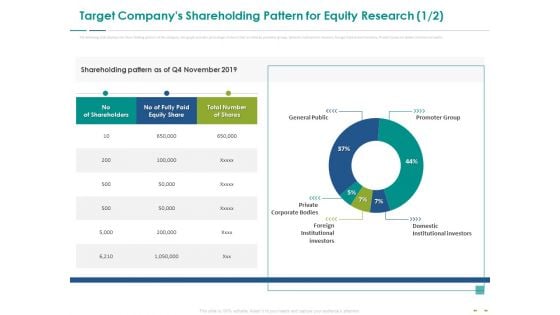
Stock Market Research Report Target Companys Shareholding Pattern For Equity Research Structure PDF
The following slide displays the share holding pattern of the company, the graph provides percentage of shares that are held by promotor groups, domestic institutional investors, foreign Institutional investors, Private Corporate Bodies and General public. Deliver an awe-inspiring pitch with this creative stock market research report target companys shareholding pattern for equity research structure pdf bundle. Topics like general public, promoter group, domestic institutional investors, private corporate bodies, foreign institutional investors can be discussed with this completely editable template. It is available for immediate download depending on the needs and requirements of the user.
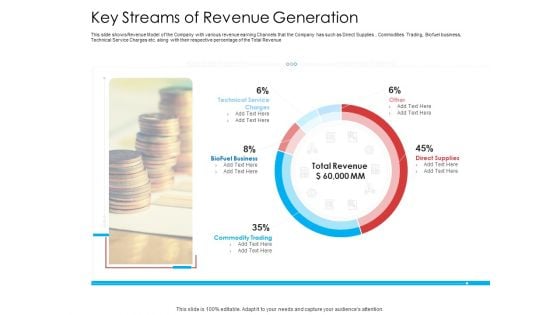
Key Streams Of Revenue Generation Clipart PDF
This slide shows Revenue Model of the Company with various revenue earning Channels that the Company has such as Direct Supplies, Commodities Trading, Biofuel business, Technical Service Charges etc. along with their respective percentage of the Total Revenue. Deliver and pitch your topic in the best possible manner with this key streams of revenue generation clipart pdf. Use them to share invaluable insights on direct supplies, commodity trading, technical service charges and impress your audience. This template can be altered and modified as per your expectations. So, grab it now.
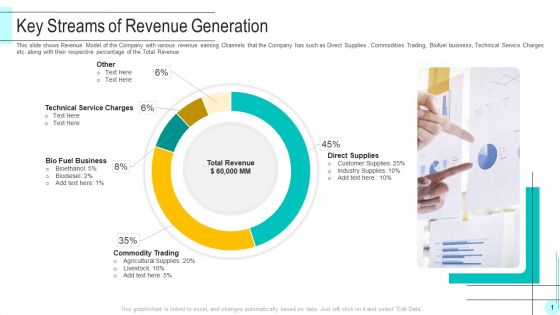
Funding Deck To Obtain Grant Facilities From Public Companies Key Streams Of Revenue Generation Graphics PDF
This slide shows Revenue Model of the Company with various revenue earning Channels that the Company has such as Direct Supplies , Commodities Trading, Biofuel business, Technical Service Charges etc. along with their respective percentage of the Total Revenue. Deliver an awe inspiring pitch with this creative funding deck to obtain grant facilities from public companies key streams of revenue generation graphics pdf bundle. Topics like technical service charges, bio fuel business, commodity trading, direct supplies can be discussed with this completely editable template. It is available for immediate download depending on the needs and requirements of the user.
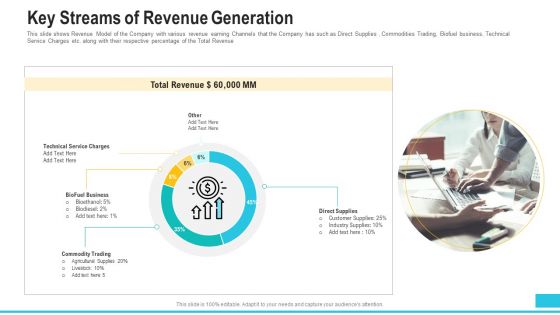
Funding Deck To Procure Funds From Public Enterprises Key Streams Of Revenue Generation Elements PDF
This slide shows Revenue Model of the Company with various revenue earning Channels that the Company has such as Direct Supplies , Commodities Trading, Biofuel business, Technical Service Charges etc. along with their respective percentage of the Total Revenue. Deliver and pitch your topic in the best possible manner with this funding deck to procure funds from public enterprises key streams of revenue generation elements pdf. Use them to share invaluable insights on technical service charges, biofuel business, commodity trading, direct supplies, total revenue and impress your audience. This template can be altered and modified as per your expectations. So, grab it now.
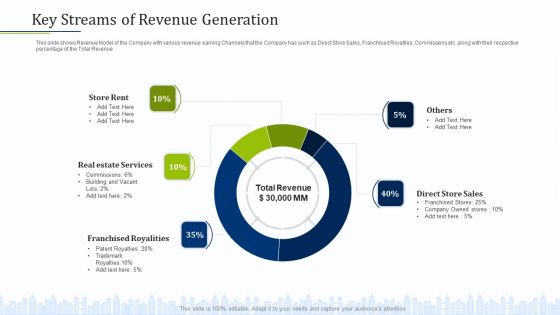
Pitch Deck To Draw External Capital From Commercial Banking Institution Key Streams Of Revenue Generation Microsoft PDF
This slide shows Revenue Model of the Company with various revenue earning Channels that the Company has such as Direct Store Sales, Franchised Royalties, Commissions etc. along with their respective percentage of the Total Revenue Deliver an awe-inspiring pitch with this creative pitch deck to draw external capital from commercial banking institution key streams of revenue generation microsoft pdf bundle. Topics like real estate services, franchised royalities, direct store sales can be discussed with this completely editable template. It is available for immediate download depending on the needs and requirements of the user.
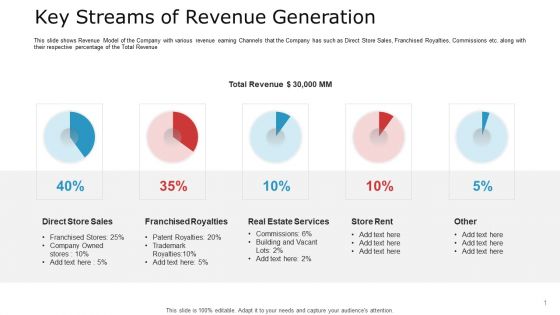
Pitch Deck To Raise Capital From Commercial Financial Institution Using Bonds Key Streams Of Revenue Generation Ideas PDF
This slide shows Revenue Model of the Company with various revenue earning Channels that the Company has such as Direct Store Sales, Franchised Royalties, Commissions etc. along with their respective percentage of the Total Revenue Deliver an awe inspiring pitch with this creative pitch deck to raise capital from commercial financial institution using bonds key streams of revenue generation ideas pdf bundle. Topics like direct store sales, franchised royalties, real estate services can be discussed with this completely editable template. It is available for immediate download depending on the needs and requirements of the user.

 Home
Home