Percentage Icon
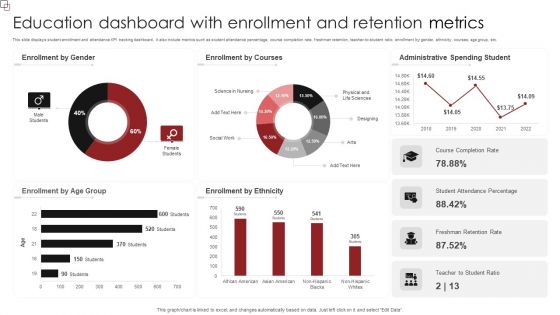
Education Dashboard With Enrollment And Retention Metrics Sample PDF
This slide displays student enrollment and attendance KPI tracking dashboard. It also include metrics such as student attendance percentage, course completion rate, freshman retention, teacher-to-student ratio, enrollment by gender, ethnicity, courses, age group, etc. Pitch your topic with ease and precision using this Education Dashboard With Enrollment And Retention Metrics Sample PDF. This layout presents information on Enrollment Gender, Enrollment Courses, Administrative Spending Student. It is also available for immediate download and adjustment. So, changes can be made in the color, design, graphics or any other component to create a unique layout.
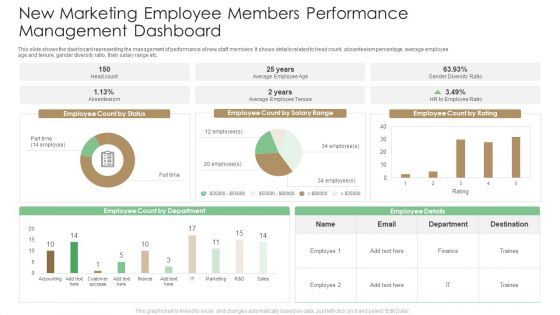
New Marketing Employee Members Performance Management Dashboard Summary PDF
This slide shows the dashboard representing the management of performance of new staff members. It shows details related to head count, absenteeism percentage, average employee age and tenure, gender diversity ratio, their salary range etc. Pitch your topic with ease and precision using this New Marketing Employee Members Performance Management Dashboard Summary PDF. This layout presents information on Employee Ratio, Average Employee Tenure. It is also available for immediate download and adjustment. So, changes can be made in the color, design, graphics or any other component to create a unique layout.
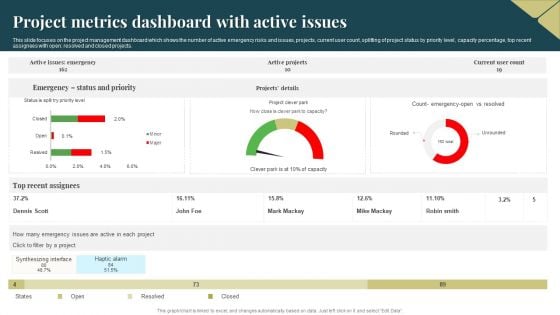
Project Metrics Dashboard With Active Issues Topics PDF
This slide focuses on the project management dashboard which shows the number of active emergency risks and issues, projects, current user count, splitting of project status by priority level, capacity percentage, top recent assignees with open, resolved and closed projects. Pitch your topic with ease and precision using this Project Metrics Dashboard With Active Issues Topics PDF. This layout presents information on Project Metrics, Dashboard With Active Issues. It is also available for immediate download and adjustment. So, changes can be made in the color, design, graphics or any other component to create a unique layout.
Cios Guide To Optimize Determine IT Project Portfolio Management Tracking Formats PDF
This slide provides information regarding IT project portfolio management tracking dashboard including details about allocated budget across portfolios, used budget percentage, estimated vs. actual cost, etc. If your project calls for a presentation, then Slidegeeks is your go-to partner because we have professionally designed, easy-to-edit templates that are perfect for any presentation. After downloading, you can easily edit Cios Guide To Optimize Determine IT Project Portfolio Management Tracking Formats PDF and make the changes accordingly. You can rearrange slides or fill them with different images. Check out all the handy templates.
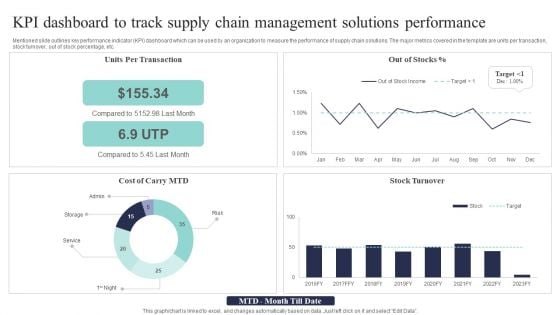
KPI Dashboard To Track Supply Chain Management Solutions Performance Background PDF
Mentioned slide outlines key performance indicator KPI dashboard which can be used by an organization to measure the performance of supply chain solutions. The major metrics covered in the template are units per transaction, stock turnover, out of stock percentage, etc. Pitch your topic with ease and precision using this KPI Dashboard To Track Supply Chain Management Solutions Performance Background PDF. This layout presents information on Per Transaction, Compared Last, Stock Turnover. It is also available for immediate download and adjustment. So, changes can be made in the color, design, graphics or any other component to create a unique layout.
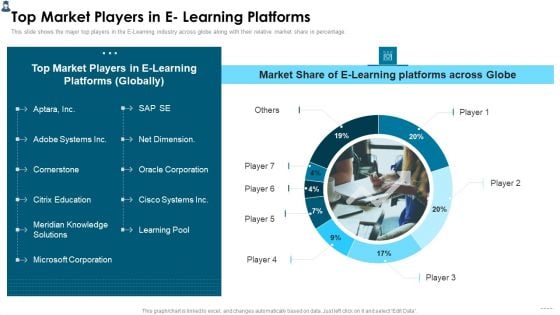
Online Learning Investor Pitch Deck Top Market Players In E Learning Platforms Diagrams PDF
This slide shows the major top players in the E Learning industry across globe along with their relative market share in percentage. Presenting Online Learning Investor Pitch Deck Top Market Players In E Learning Platforms Diagrams PDF to provide visual cues and insights. Share and navigate important information on eight stages that need your due attention. This template can be used to pitch topics like E Learning Platform, Market Share, Market Players. In addtion, this PPT design contains high resolution images, graphics, etc, that are easily editable and available for immediate download.
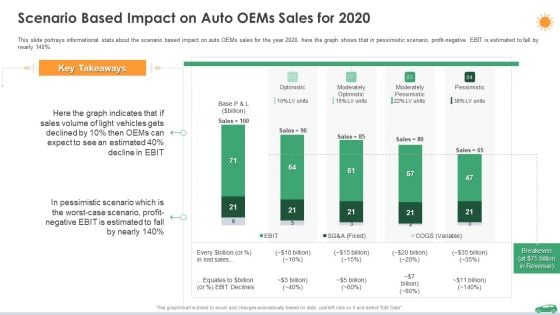
Scenario Based Impact On Auto Oems Sales For 2020 Ppt File Guidelines PDF
This slide portrays informational stats about the scenario based impact on auto OEMs sales for the year 2020. here the graph shows that in pessimistic scenario, profit-negative EBIT is estimated to fall by nearly 14 percentage. Deliver an awe inspiring pitch with this creative scenario based impact on auto oems sales for 2020 ppt file guidelines pdf bundle. Topics like sales, profit can be discussed with this completely editable template. It is available for immediate download depending on the needs and requirements of the user.
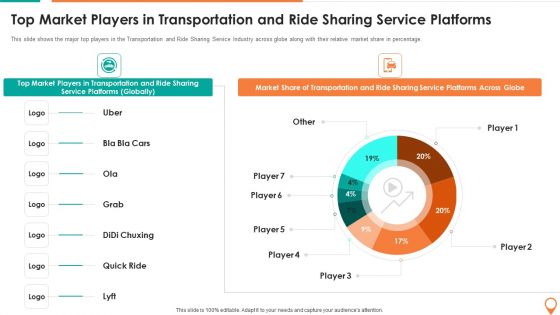
Transportation And Carpooling Services Investor Funding Pitch Deck Top Market Players In Transportation Microsoft PDF
This slide shows the major top players in the Transportation and Ride Sharing Service Industry across globe along with their relative market share in percentage. Deliver an awe inspiring pitch with this creative transportation and carpooling services investor funding pitch deck top market players in transportation microsoft pdf bundle. Topics like top market players in transportation and ride sharing service platforms economical and effective, commercial activities, growing populations, services can be discussed with this completely editable template. It is available for immediate download depending on the needs and requirements of the user.

Food Delivery Service Fundraising Top Market Players In On Demand Ppt Show Images PDF
This slide shows the major top players of the On Demand Online Food Delivery Service Industry across globe along with their relative market share in percentage. Deliver an awe inspiring pitch with this creative food delivery service fundraising top market players in on demand ppt show images pdf bundle. Topics like top market players in on demand online food delivery platforms can be discussed with this completely editable template. It is available for immediate download depending on the needs and requirements of the user.
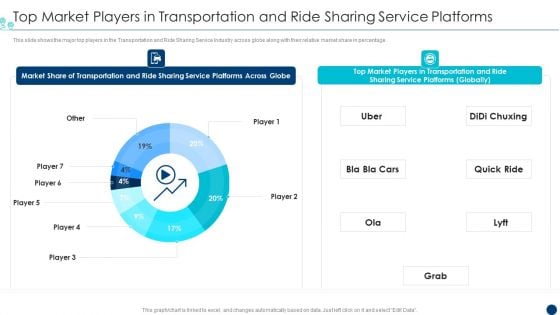
Shipment Services Pitch Deck Top Market Players In Transportation And Ride Sharing Service Platforms Introduction PDF
This slide shows the major top players in the Transportation and Ride Sharing Service Industry across globe along with their relative market share in percentage.Deliver and pitch your topic in the best possible manner with this shipment services pitch deck top market players in transportation and ride sharing service platforms introduction pdf Use them to share invaluable insights on top market players in transportation and ride sharing service platforms and impress your audience. This template can be altered and modified as per your expectations. So, grab it now.

Ride Sharing Service Capital Fundraising Pitch Deck Top Market Players In Transportation Introduction PDF
This slide shows the major top players in the Transportation and Ride Sharing Service Industry across globe along with their relative market share in percentage. Deliver and pitch your topic in the best possible manner with this ride sharing service capital fundraising pitch deck top market players in transportation introduction pdf. Use them to share invaluable insights on top market players in transportation and ride sharing service platforms and impress your audience. This template can be altered and modified as per your expectations. So, grab it now.
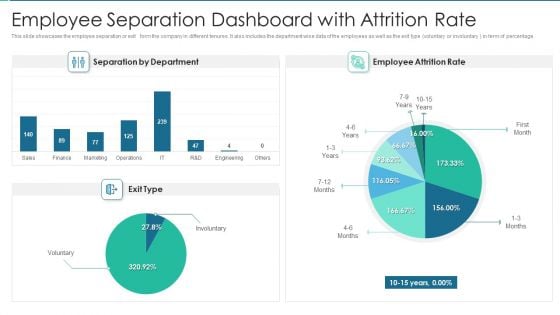
Employee Separation Dashboard With Attrition Rate Elements PDF
This slide showcases the employee separation or exit form the company in different tenures. It also includes the department wise data of the employees as well as the exit type voluntary or involuntary in term of percentage.Showcasing this set of slides titled Employee Separation Dashboard With Attrition Rate Elements PDF The topics addressed in these templates are Separation By Department, Employee Attrition Rate All the content presented in this PPT design is completely editable. Download it and make adjustments in color, background, font etc. as per your unique business setting.
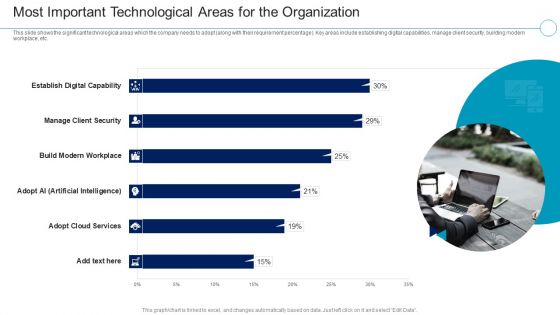
Financial Services Enterprise Transformation Most Important Technological Areas Portrait PDF
This slide shows the significant technological areas which the company needs to adopt along with their requirement percentage. Key areas include establishing digital capabilities, manage client security, building modern workplace, etc.Deliver and pitch your topic in the best possible manner with this Financial Services Enterprise Transformation Most Important Technological Areas Portrait PDF Use them to share invaluable insights on Adopt Cloud Services, Build Modern Workplace, Manage Client Security and impress your audience. This template can be altered and modified as per your expectations. So, grab it now.

Risk Assessment Software Dashboard For Cybersecurity Ppt PowerPoint Presentation Gallery Pictures PDF
This slide represents risk assessment software dashboard for cybersecurity. It includes risk percentage, number of risks, risk analysis progress, risk response progress, risk rating etc. Showcasing this set of slides titled Risk Assessment Software Dashboard For Cybersecurity Ppt PowerPoint Presentation Gallery Pictures PDF. The topics addressed in these templates are Risk Rating Breakdown, Action Plan Breakdown, Top 5 Entities Prone To Risk. All the content presented in this PPT design is completely editable. Download it and make adjustments in color, background, font etc. as per your unique business setting.
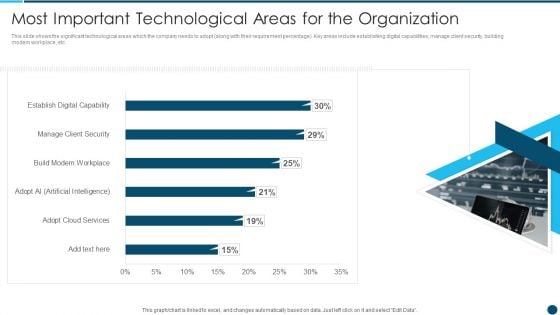
Digital Technology Adoption In Banking Industry Case Competition Most Important Portrait PDF
This slide shows the significant technological areas which the company needs to adopt along with their requirement percentage. Key areas include establishing digital capabilities, manage client security, building modern workplace, etc. Deliver an awe inspiring pitch with this creative Digital Technology Adoption In Banking Industry Case Competition Most Important Portrait PDF bundle. Topics like Adopt Cloud Services, Build Modern Workplace, Manage Client Security can be discussed with this completely editable template. It is available for immediate download depending on the needs and requirements of the user.
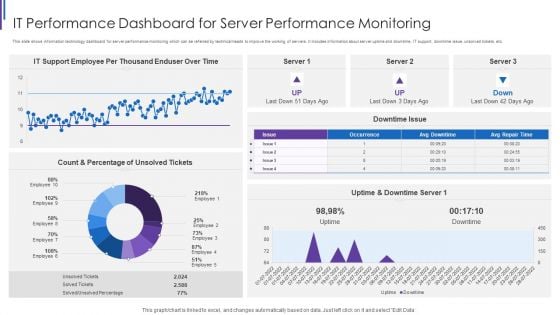
IT Performance Dashboard For Server Performance Monitoring Portrait PDF
This slide shows information technology dashboard for server performance monitoring which can be referred by technical heads to improve the working of servers. It includes information about server uptime and downtime, IT support, downtime issue, unsolved tickets, etc. Showcasing this set of slides titled IT Performance Dashboard For Server Performance Monitoring Portrait PDF. The topics addressed in these templates are IT Support Employee, Per Thousand Enduser, Uptime And Downtime, Count And Percentage. All the content presented in this PPT design is completely editable. Download it and make adjustments in color, background, font etc. as per your unique business setting.
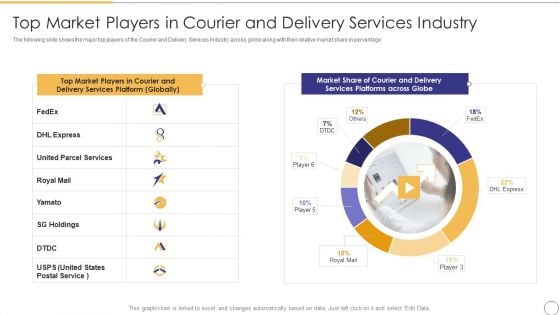
On Demand Parcel Delivery Top Market Players In Courier And Delivery Services Industry Sample PDF
The following slide shows the major top players of the Courier and Delivery Services Industry across globe along with their relative market share in percentage. Deliver and pitch your topic in the best possible manner with this On Demand Parcel Delivery Top Market Players In Courier And Delivery Services Industry Sample PDF. Use them to share invaluable insights on Market Share, Services Platforms, Across Globe and impress your audience. This template can be altered and modified as per your expectations. So, grab it now.
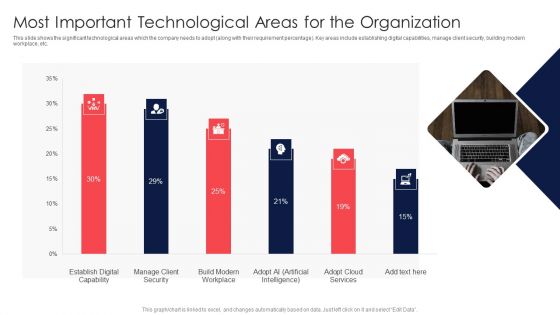
Digital Transformation Of Consumer Most Important Technological Areas For The Organization Sample PDF
This slide shows the significant technological areas which the company needs to adopt along with their requirement percentage. Key areas include establishing digital capabilities, manage client security, building modern workplace, etc. Deliver and pitch your topic in the best possible manner with this Digital Transformation Of Consumer Most Important Technological Areas For The Organization Sample PDF. Use them to share invaluable insights on Establish Digital, Manage Client, Build Modern and impress your audience. This template can be altered and modified as per your expectations. So, grab it now.
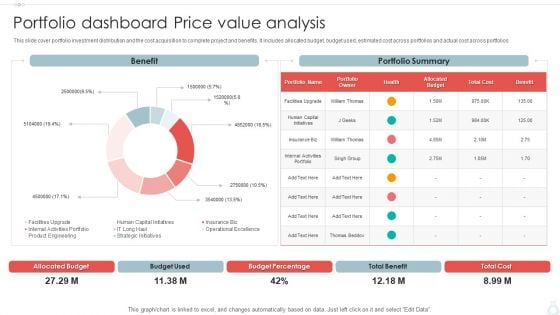
Portfolio Dashboard Price Value Analysis Ppt PowerPoint Presentation Gallery Model PDF
This slide cover portfolio investment distribution and the cost acquisition to complete project and benefits. It includes allocated budget, budget used, estimated cost across portfolios and actual cost across portfolios. Showcasing this set of slides titled Portfolio Dashboard Price Value Analysis Ppt PowerPoint Presentation Gallery Model PDF. The topics addressed in these templates are Portfolio Summary, Budget Percentage, Total Benefit, Total Cost. All the content presented in this PPT design is completely editable. Download it and make adjustments in color, background, font etc. as per your unique business setting.
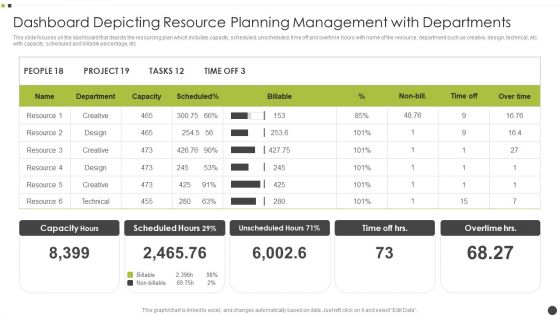
Dashboard Depicting Resource Planning Management With Departments Designs PDF
This slide focuses on the dashboard that depicts the resourcing plan which includes capacity, scheduled, unscheduled, time off and overtime hours with name of the resource, department such as creative, design, technical, etc. with capacity, scheduled and billable percentage, etc. Showcasing this set of slides titled Dashboard Depicting Resource Planning Management With Departments Designs PDF. The topics addressed in these templates are Resource, Design, Technical. All the content presented in this PPT design is completely editable. Download it and make adjustments in color, background, font etc. as per your unique business setting.
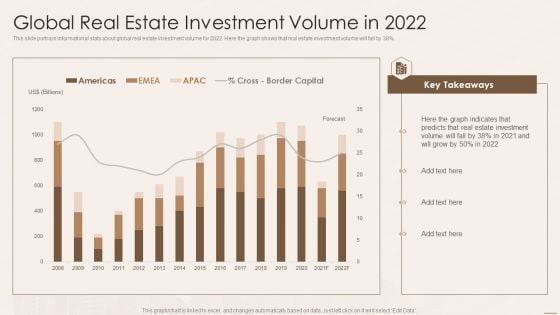
Real Estate Developers Funding Alternatives Global Real Estate Investment Volume In 2022 Brochure PDF
This slide portrays informational stats about global real estate investment volume for 2022. Here the graph shows that real estate investment volume will fall by 38 percentage. Deliver and pitch your topic in the best possible manner with this Real Estate Developers Funding Alternatives Global Real Estate Investment Volume In 2022 Brochure PDF. Use them to share invaluable insights on Real Estate Investment, Border Capital and impress your audience. This template can be altered and modified as per your expectations. So, grab it now.
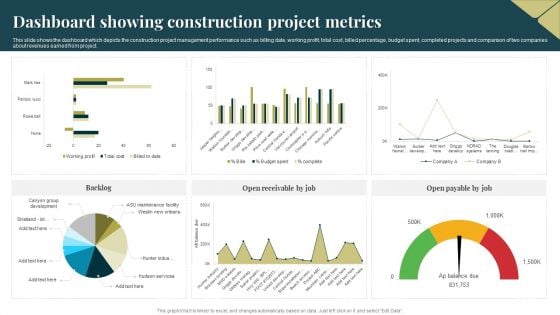
Dashboard Showing Construction Project Metrics Sample PDF
This slide shows the dashboard which depicts the construction project management performance such as billing date, working profit, total cost, billed percentage, budget spent, completed projects and comparison of two companies about revenues earned from project. Showcasing this set of slides titled Dashboard Showing Construction Project Metrics Sample PDF. The topics addressed in these templates are Dashboard, Construction Project Metrics. All the content presented in this PPT design is completely editable. Download it and make adjustments in color, background, font etc. as per your unique business setting.
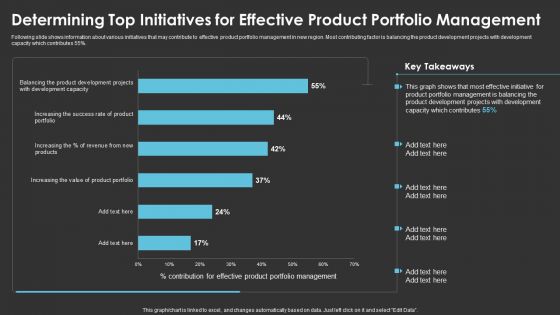
Determining Top Initiatives For Effective Product Portfolio Management Formats PDF
Following slide shows information about various initiatives that may contribute to effective product portfolio management in new region. Most contributing factor is balancing the product development projects with development capacity which contributes 55 percentage. Deliver and pitch your topic in the best possible manner with this Determining Top Initiatives For Effective Product Portfolio Management Formats PDF. Use them to share invaluable insights on Product Development, Management and impress your audience. This template can be altered and modified as per your expectations. So, grab it now.
Tracking Goals Dashboard With Progress Report Rules PDF
This slide showcases the progress report which helps to determine gaps in the objective achievement process and take corrective actions. It also includes objective details such as contributor, due date, and progress percentage. Showcasing this set of slides titled Tracking Goals Dashboard With Progress Report Rules PDF. The topics addressed in these templates are Immediate Action Required, Progress Update Required, Concise Goal Outcome Required. All the content presented in this PPT design is completely editable. Download it and make adjustments in color, background, font etc. as per your unique business setting.
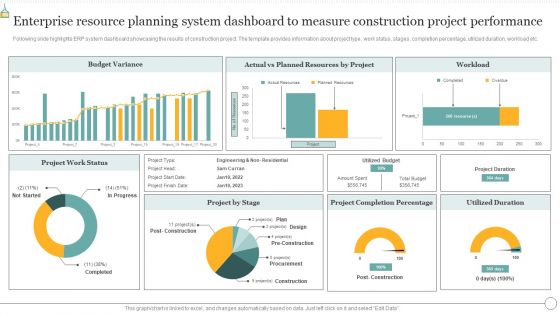
Enterprise Resource Planning System Dashboard To Measure Construction Project Performance Download PDF
Following slide highlights ERP system dashboard showcasing the results of construction project. The template provides information about project type, work status, stages, completion percentage, utilized duration, workload etc. Showcasing this set of slides titled Enterprise Resource Planning System Dashboard To Measure Construction Project Performance Download PDF. The topics addressed in these templates are Project By Stage, Project Completion, Planned Resources. All the content presented in this PPT design is completely editable. Download it and make adjustments in color, background, font etc. as per your unique business setting.
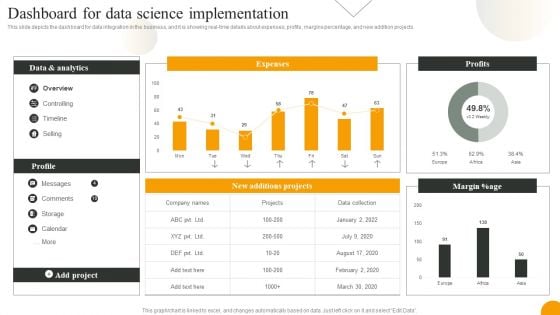
Using Data Science Technologies For Business Transformation Dashboard For Data Science Implementation Portrait PDF
This slide depicts the dashboard for data integration in the business, and it is showing real-time details about expenses, profits, margins percentage, and new addition projects. Take your projects to the next level with our ultimate collection of Using Data Science Technologies For Business Transformation Dashboard For Data Science Implementation Portrait PDF. Slidegeeks has designed a range of layouts that are perfect for representing task or activity duration, keeping track of all your deadlines at a glance. Tailor these designs to your exact needs and give them a truly corporate look with your own brand colors they will make your projects stand out from the rest.
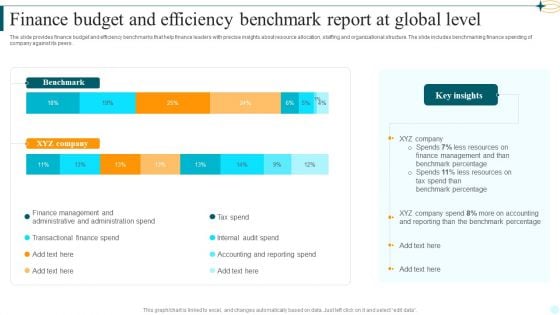
Finance Budget And Efficiency Benchmark Report At Global Level Template PDF
The slide provides finance budget and efficiency benchmarks that help finance leaders with precise insights about resource allocation, staffing and organizational structure. The slide includes benchmarking finance spending of company against its peers. Showcasing this set of slides titled Finance Budget And Efficiency Benchmark Report At Global Level Template PDF. The topics addressed in these templates are Benchmark, Key Insights, Benchmark Percentage. All the content presented in this PPT design is completely editable. Download it and make adjustments in color, background, font etc. as per your unique business setting.
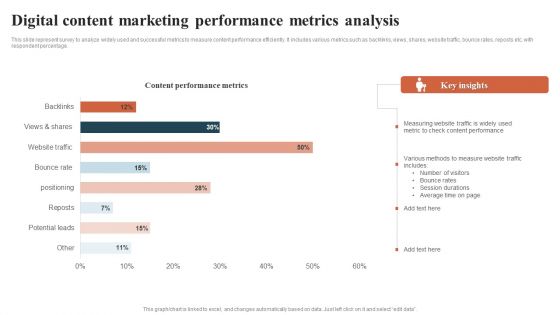
Digital Content Marketing Performance Metrics Analysis Introduction PDF
This slide represent survey to analyze widely used and successful metrics to measure content performance efficiently. It includes various metrics such as backlinks, views, shares, website traffic, bounce rates, reposts etc. with respondent percentage. Showcasing this set of slides titled Digital Content Marketing Performance Metrics Analysis Introduction PDF. The topics addressed in these templates are Digital Content Marketing, Performance Metrics Analysis. All the content presented in this PPT design is completely editable. Download it and make adjustments in color, background, font etc. as per your unique business setting.
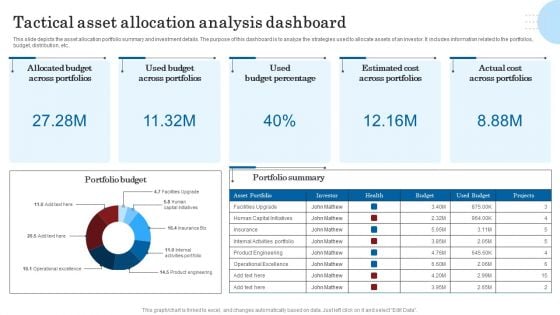
Tactical Asset Allocation Analysis Dashboard Designs PDF
This slide depicts the asset allocation portfolio summary and investment details. The purpose of this dashboard is to analyze the strategies used to allocate assets of an investor. It includes information related to the portfolios, budget, distribution, etc..Showcasing this set of slides titled Tactical Asset Allocation Analysis Dashboard Designs PDF. The topics addressed in these templates are Across Portfolios, Budget Percentage, Actual Cost. All the content presented in this PPT design is completely editable. Download it and make adjustments in color, background, font etc. as per your unique business setting.
Construction Project Tracking And Control KPI Dashboard Summary PDF
Mentioned slide displays construction project monitoring and control KPI dashboard which can be used by construction manager to track various metrics. Construction manager can track metrics like project work status, projects by stages, project completion percentage, utilized duration, budget variance , workload etc. Showcasing this set of slides titled Construction Project Tracking And Control KPI Dashboard Summary PDF. The topics addressed in these templates are Budget Variance, Resources By Project, Utilized Duration. All the content presented in this PPT design is completely editable. Download it and make adjustments in color, background, font etc. as per your unique business setting.
IT Cost Reduction Strategies Determine IT Project Portfolio Management Tracking Designs PDF
This slide provides information regarding IT project portfolio management tracking dashboard including details about allocated budget across portfolios, used budget percentage, estimated vs. actual cost, etc. From laying roadmaps to briefing everything in detail, our templates are perfect for you. You can set the stage with your presentation slides. All you have to do is download these easy-to-edit and customizable templates. IT Cost Reduction Strategies Determine IT Project Portfolio Management Tracking Designs PDF will help you deliver an outstanding performance that everyone would remember and praise you for. Do download this presentation today.
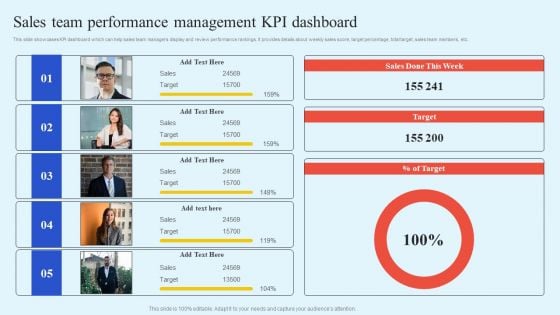
How Leaders Can Improve Team Effectiveness Sales Team Performance Management KPI Dashboard Infographics PDF
This slide showcases KPI dashboard which can help sales team managers display and review performance rankings. It provides details about weekly sales score, target percentage, total target, sales team members, etc. Unleash your creativity with our How Leaders Can Improve Team Effectiveness Sales Team Performance Management KPI Dashboard Infographics PDF single-slide PPT template. Whether you are a seasoned presenter or a newbie, our editable and visually-stunning template will make your presentations shine. This template is versatile and easy to use. Make your presentations unforgettable with our premium template and leave a lasting impression on your audience.
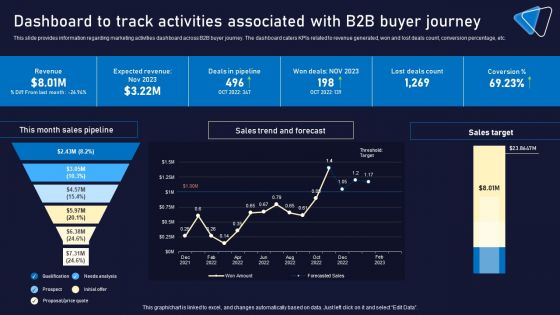
Dashboard To Track Activities Associated With B2B Buyer Journey Portrait PDF
This slide provides information regarding marketing activities dashboard across B2B buyer journey. The dashboard caters KPIs related to revenue generated, won and lost deals count, conversion percentage, etc. Make sure to capture your audiences attention in your business displays with our gratis customizable Dashboard To Track Activities Associated With B2B Buyer Journey Portrait PDF. These are great for business strategies, office conferences, capital raising or task suggestions. If you desire to acquire more customers for your tech business and ensure they stay satisfied, create your own sales presentation with these plain slides.
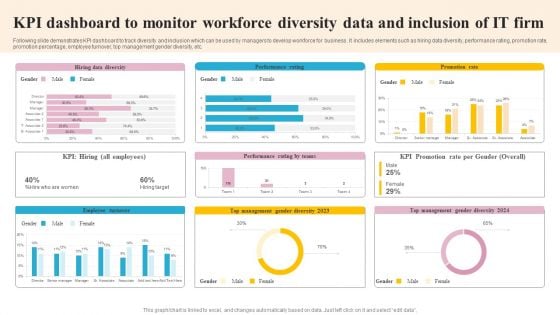
KPI Dashboard To Monitor Workforce Diversity Data And Inclusion Of IT Firm Slides PDF
Following slide demonstrates KPI dashboard to track diversity and inclusion which can be used by managers to develop workforce for business . It includes elements such as hiring data diversity, performance rating, promotion rate, promotion percentage, employee turnover, top management gender diversity, etc. Showcasing this set of slides titled KPI Dashboard To Monitor Workforce Diversity Data And Inclusion Of IT Firm Slides PDF. The topics addressed in these templates are Employee Turnover, Management, Promotion Rate. All the content presented in this PPT design is completely editable. Download it and make adjustments in color, background, font etc. as per your unique business setting.

Agile Techniques For Improving Tasks And Enhancing Team Performance Ppt PowerPoint Presentation Complete Deck With Slides
This complete deck acts as a great communication tool. It helps you in conveying your business message with personalized sets of graphics, icons etc. Comprising a set of fortynine slides, this complete deck can help you persuade your audience. It also induces strategic thinking as it has been thoroughly researched and put together by our experts. Not only is it easily downloadable but also editable. The color, graphics, theme any component can be altered to fit your individual needs. So grab it now.
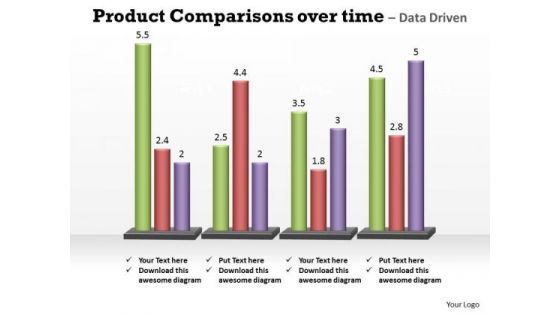
Business Marketing PowerPoint Templates Business Product Comparisons Over Time Ppt Slides
Business Marketing PowerPoint Templates Business product comparisons over time PPT Slides--This chart is useful for showing data changes over a period of time or for illustrating comparisons among items. -Business Marketing PowerPoint Templates Business product comparison over time PPT Slides-This ppt can be used for concepts relating to-chart,, graph, growth, investment, , market, percentage, , presentation report, results, statistics, stock, success and business. Continue growing with our Business Marketing PowerPoint Templates Business Product Comparisons Over Time Ppt Slides. Download without worries with our money back guaranteee.
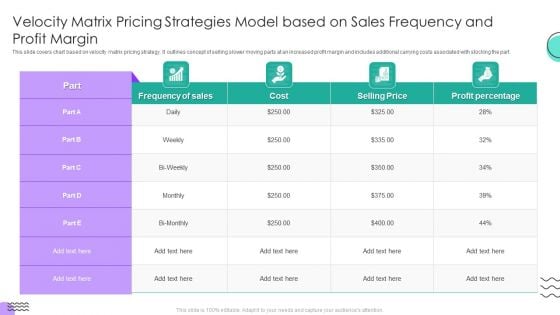
Velocity Matrix Pricing Strategies Model Based On Sales Frequency And Profit Margin Rules PDF
This slide covers chart based on velocity matrix pricing strategy. It outlines concept of selling slower moving parts at an increased profit margin and includes additional carrying costs associated with stocking the part.Pitch your topic with ease and precision using this Velocity Matrix Pricing Strategies Model Based On Sales Frequency And Profit Margin Rules PDF. This layout presents information on Frequency Sales, Selling Price, Profit Percentage. It is also available for immediate download and adjustment. So, changes can be made in the color, design, graphics or any other component to create a unique layout.

Project Management Equipment To Control Workload Tasks And Minimize Costs Ppt PowerPoint Presentation Complete Deck With Slides
This complete deck acts as a great communication tool. It helps you in conveying your business message with personalized sets of graphics, icons etc. Comprising a set of fiftytwo slides, this complete deck can help you persuade your audience. It also induces strategic thinking as it has been thoroughly researched and put together by our experts. Not only is it easily downloadable but also editable. The color, graphics, theme any component can be altered to fit your individual needs. So grab it now.
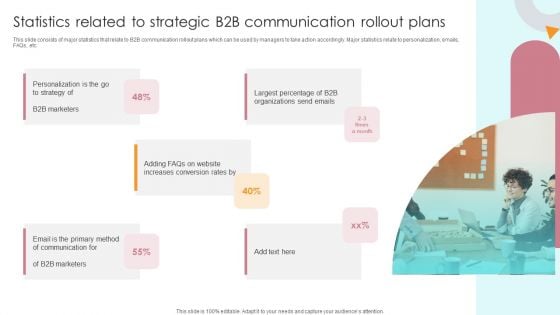
Statistics Related To Strategic B2B Communication Rollout Plans Structure PDF
This slide consists of major statistics that relate to B2B communication rollout plans which can be used by managers to take action accordingly. Major statistics relate to personalization, emails, FAQs, etc. Presenting Statistics Related To Strategic B2B Communication Rollout Plans Structure PDF to dispense important information. This template comprises five stages. It also presents valuable insights into the topics including Personalization, Largest Percentage, Increases Conversion Rates. This is a completely customizable PowerPoint theme that can be put to use immediately. So, download it and address the topic impactfully.
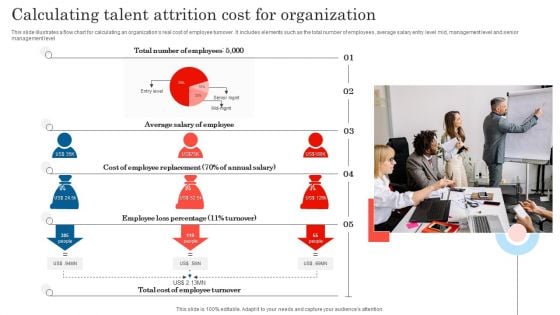
Calculating Talent Attrition Cost For Organization Summary PDF
This slide illustrates a flow chart for calculating an organizations real cost of employee turnover. It includes elements such as the total number of employees, average salary entry level mid, management level and senior management level. Persuade your audience using this Calculating Talent Attrition Cost For Organization Summary PDF. This PPT design covers one stages, thus making it a great tool to use. It also caters to a variety of topics including Average Salary Of Employee, Employee Loss Percentage, Cost Of Employee Replacement. Download this PPT design now to present a convincing pitch that not only emphasizes the topic but also showcases your presentation skills.
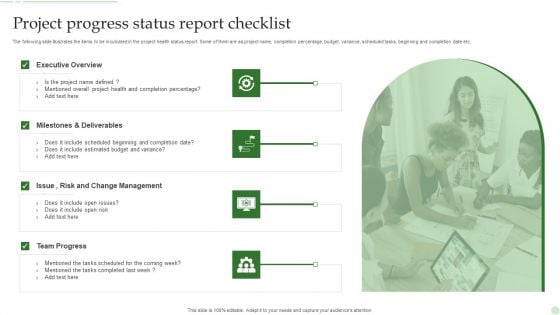
Project Progress Status Report Checklist Ppt PowerPoint Presentation Gallery Files PDF
The following slide illustrates the items to be inculcated in the project health status report. Some of them are as project name, completion percentage, budget, variance, scheduled tasks, beginning and completion date etc. Presenting Project Progress Status Report Checklist Ppt PowerPoint Presentation Gallery Files PDF to dispense important information. This template comprises four stages. It also presents valuable insights into the topics including Executive Overview, Milestones And Deliverables, Team Progress. This is a completely customizable PowerPoint theme that can be put to use immediately. So, download it and address the topic impactfully.
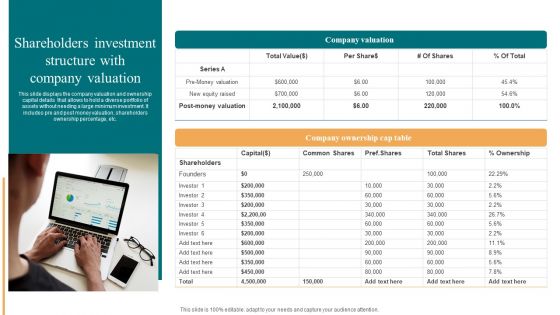
Shareholders Investment Structure With Company Valuation Topics PDF
This slide displays the company valuation and ownership capital details that allows to hold a diverse portfolio of assets without needing a large minimum investment. It includes pre and post money valuation, shareholders ownership percentage, etc. Presenting Shareholders Investment Structure With Company Valuation Topics PDF to dispense important information. This template comprises one stages. It also presents valuable insights into the topics including Company Valuation, Shareholders Investment Structure. This is a completely customizable PowerPoint theme that can be put to use immediately. So, download it and address the topic impactfully.
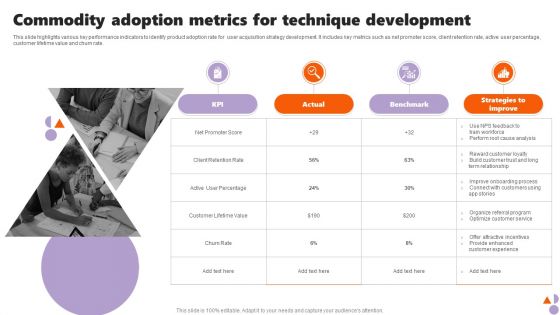
Commodity Adoption Metrics For Technique Development Microsoft PDF
This slide highlights various key performance indicators to identify product adoption rate for user acquisition strategy development. It includes key metrics such as net promoter score, client retention rate, active user percentage, customer lifetime value and churn rate. Presenting Commodity Adoption Metrics For Technique Development Microsoft PDF to dispense important information. This template comprises four stages. It also presents valuable insights into the topics including Build Customer, Onboarding Process, Analysis. This is a completely customizable PowerPoint theme that can be put to use immediately. So, download it and address the topic impactfully.
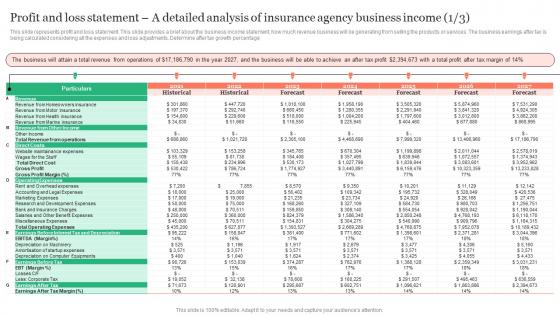
Profit And Loss Statement A Detailed Analysis Of A Insurance Business Plan Diagrams Pdf
This slide represents profit and loss statement. This slide provides a brief about the business income statement, how much revenue business will be generating from selling the products or services. The business earnings after tax is being calculated considering all the expenses and loss adjustments. Determine after tax growth percentage. Retrieve professionally designed Profit And Loss Statement A Detailed Analysis Of A Insurance Business Plan Diagrams Pdf to effectively convey your message and captivate your listeners. Save time by selecting pre-made slideshows that are appropriate for various topics, from business to educational purposes. These themes come in many different styles, from creative to corporate, and all of them are easily adjustable and can be edited quickly. Access them as PowerPoint templates or as Google Slides themes. You do not have to go on a hunt for the perfect presentation because Slidegeeks got you covered from everywhere. This slide represents profit and loss statement. This slide provides a brief about the business income statement, how much revenue business will be generating from selling the products or services. The business earnings after tax is being calculated considering all the expenses and loss adjustments. Determine after tax growth percentage.

Industry Synopsis Market Analysis Effect Of Covid 19 Pandemic On Life Coaches Introduction Pdf
The slide showcases the effects of COVID-19 pandemic on life coaches in percentage. Majority of the respondents highlighted reduced income as a major setback. Reduced working hours, temporary closure of practice, job loss etc. are also some of the effects. Create an editable Industry Synopsis Market Analysis Effect Of Covid 19 Pandemic On Life Coaches Introduction Pdf that communicates your idea and engages your audience. Whether you are presenting a business or an educational presentation, pre-designed presentation templates help save time. Industry Synopsis Market Analysis Effect Of Covid 19 Pandemic On Life Coaches Introduction Pdf is highly customizable and very easy to edit, covering many different styles from creative to business presentations. Slidegeeks has creative team members who have crafted amazing templates. So, go and get them without any delay. The slide showcases the effects of COVID-19 pandemic on life coaches in percentage. Majority of the respondents highlighted reduced income as a major setback. Reduced working hours, temporary closure of practice, job loss etc. are also some of the effects.
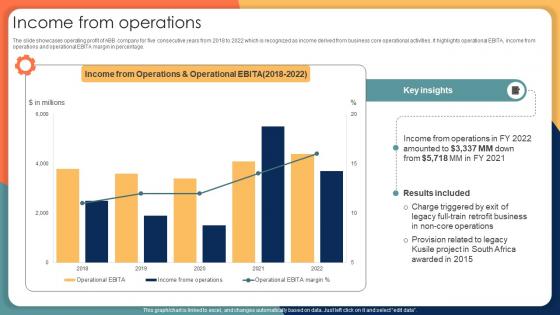
Income From Operations Engineering Solution Provider Company Profile CP SS V
The slide showcases operating profit of ABB company for five consecutive years from 2018 to 2022 which is recognized as income derived from business core operational activities. It highlights operational EBITA, income from operations and operational EBITA margin in percentage. Coming up with a presentation necessitates that the majority of the effort goes into the content and the message you intend to convey. The visuals of a PowerPoint presentation can only be effective if it supplements and supports the story that is being told. Keeping this in mind our experts created Income From Operations Engineering Solution Provider Company Profile CP SS V to reduce the time that goes into designing the presentation. This way, you can concentrate on the message while our designers take care of providing you with the right template for the situation. The slide showcases operating profit of ABB company for five consecutive years from 2018 to 2022 which is recognized as income derived from business core operational activities. It highlights operational EBITA, income from operations and operational EBITA margin in percentage.
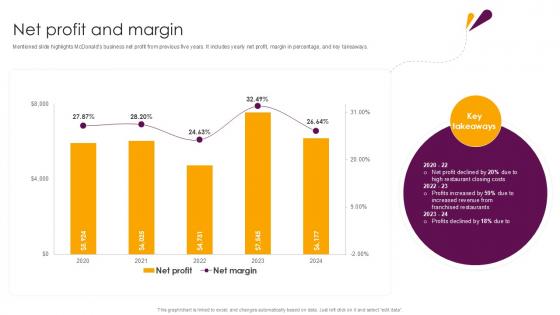
Net Profit And Margin Food And Beverages Company Profile Ppt Template CP SS V
Mentioned slide highlights McDonalds business net profit from previous five years. It includes yearly net profit, margin in percentage, and key takeaways. Presenting this PowerPoint presentation, titled Net Profit And Margin Food And Beverages Company Profile Ppt Template CP SS V with topics curated by our researchers after extensive research. This editable presentation is available for immediate download and provides attractive features when used. Download now and captivate your audience. Presenting this Net Profit And Margin Food And Beverages Company Profile Ppt Template CP SS V Our researchers have carefully researched and created these slides with all aspects taken into consideration. This is a completely customizable Net Profit And Margin Food And Beverages Company Profile Ppt Template CP SS V that is available for immediate downloading. Download now and make an impact on your audience. Highlight the attractive features available with our PPTs. Mentioned slide highlights McDonalds business net profit from previous five years. It includes yearly net profit, margin in percentage, and key takeaways.
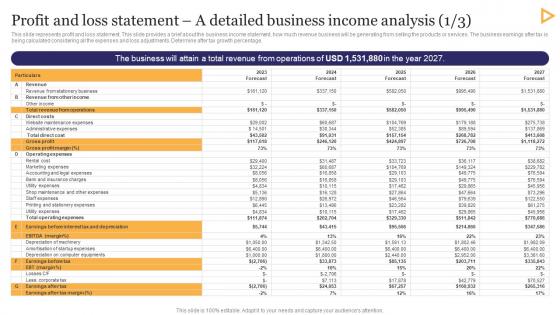
Profit And Loss Statement A Detailed Stationery Business Plan Go To Market Strategy Graphics Pdf
This slide represents profit and loss statement. This slide provides a brief about the business income statement, how much revenue business will be generating from selling the products or services. The business earnings after tax is being calculated considering all the expenses and loss adjustments. Determine after tax growth percentage. Are you searching for a Profit And Loss Statement A Detailed Stationery Business Plan Go To Market Strategy Graphics Pdf that is uncluttered, straightforward, and original Its easy to edit, and you can change the colors to suit your personal or business branding. For a presentation that expresses how much effort you have put in, this template is ideal With all of its features, including tables, diagrams, statistics, and lists, its perfect for a business plan presentation. Make your ideas more appealing with these professional slides. Download Profit And Loss Statement A Detailed Stationery Business Plan Go To Market Strategy Graphics Pdf from Slidegeeks today. This slide represents profit and loss statement. This slide provides a brief about the business income statement, how much revenue business will be generating from selling the products or services. The business earnings after tax is being calculated considering all the expenses and loss adjustments. Determine after tax growth percentage.
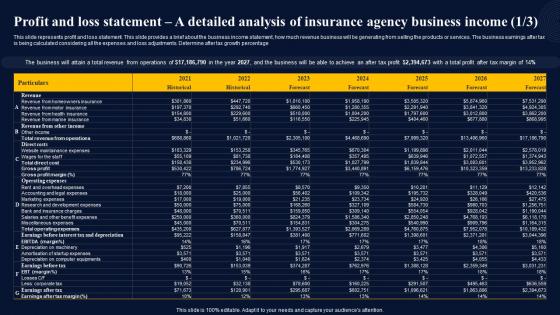
Profit And Loss Statement A Detailed Analysis Insurance Broker Business Plan Portrait Pdf
This slide represents profit and loss statement. This slide provides a brief about the business income statement, how much revenue business will be generating from selling the products or services. The business earnings after tax is being calculated considering all the expenses and loss adjustments. Determine after tax growth percentage.Retrieve professionally designed Profit And Loss Statement A Detailed Analysis Insurance Broker Business Plan Portrait Pdf to effectively convey your message and captivate your listeners. Save time by selecting pre-made slideshows that are appropriate for various topics, from business to educational purposes. These themes come in many different styles, from creative to corporate, and all of them are easily adjustable and can be edited quickly. Access them as PowerPoint templates or as Google Slides themes. You do not have to go on a hunt for the perfect presentation because Slidegeeks got you covered from everywhere. This slide represents profit and loss statement. This slide provides a brief about the business income statement, how much revenue business will be generating from selling the products or services. The business earnings after tax is being calculated considering all the expenses and loss adjustments. Determine after tax growth percentage.
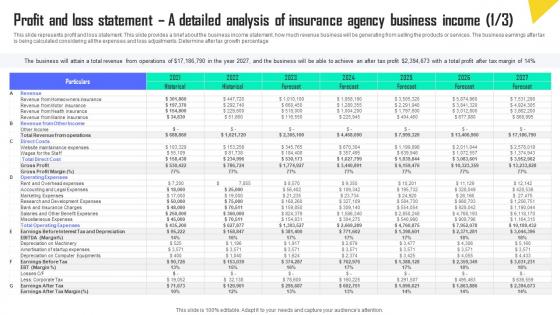
Profit And Loss Statement A Detailed Analysis Of Insurance Automobile Insurance Agency Rules Pdf
This slide represents profit and loss statement. This slide provides a brief about the business income statement, how much revenue business will be generating from selling the products or services. The business earnings after tax is being calculated considering all the expenses and loss adjustments. Determine after tax growth percentage. Retrieve professionally designed Profit And Loss Statement A Detailed Analysis Of Insurance Automobile Insurance Agency Rules Pdf to effectively convey your message and captivate your listeners. Save time by selecting pre-made slideshows that are appropriate for various topics, from business to educational purposes. These themes come in many different styles, from creative to corporate, and all of them are easily adjustable and can be edited quickly. Access them as PowerPoint templates or as Google Slides themes. You do not have to go on a hunt for the perfect presentation because Slidegeeks got you covered from everywhere. This slide represents profit and loss statement. This slide provides a brief about the business income statement, how much revenue business will be generating from selling the products or services. The business earnings after tax is being calculated considering all the expenses and loss adjustments. Determine after tax growth percentage.
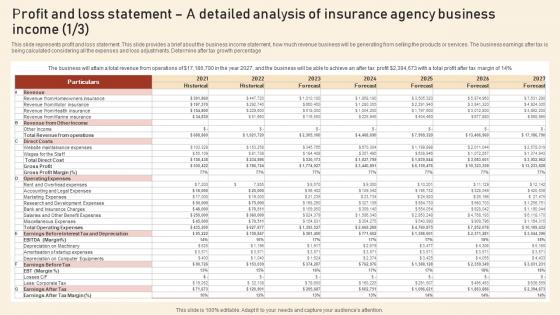
Profit And Loss Statement A Detailed Analysis Of Insurance Agency Assurant Insurance Agency Microsoft Pdf
This slide represents profit and loss statement. This slide provides a brief about the business income statement, how much revenue business will be generating from selling the products or services. The business earnings after tax is being calculated considering all the expenses and loss adjustments. Determine after tax growth percentage. Retrieve professionally designed Profit And Loss Statement A Detailed Analysis Of Insurance Agency Assurant Insurance Agency Microsoft Pdf to effectively convey your message and captivate your listeners. Save time by selecting pre-made slideshows that are appropriate for various topics, from business to educational purposes. These themes come in many different styles, from creative to corporate, and all of them are easily adjustable and can be edited quickly. Access them as PowerPoint templates or as Google Slides themes. You do not have to go on a hunt for the perfect presentation because Slidegeeks got you covered from everywhere. This slide represents profit and loss statement. This slide provides a brief about the business income statement, how much revenue business will be generating from selling the products or services. The business earnings after tax is being calculated considering all the expenses and loss adjustments. Determine after tax growth percentage.

Profit And Loss Statement A Detailed Business Income Fashion Business Plan Structure Pdf
This slide represents profit and loss statement. This slide provides a brief about the business income statement, how much revenue business will be generating from selling the products or services. The business earnings after tax is being calculated considering all the expenses and loss adjustments. Determine after tax growth percentage. Retrieve professionally designed Profit And Loss Statement A Detailed Business Income Fashion Business Plan Structure Pdf to effectively convey your message and captivate your listeners. Save time by selecting pre-made slideshows that are appropriate for various topics, from business to educational purposes. These themes come in many different styles, from creative to corporate, and all of them are easily adjustable and can be edited quickly. Access them as PowerPoint templates or as Google Slides themes. You do not have to go on a hunt for the perfect presentation because Slidegeeks got you covered from everywhere. This slide represents profit and loss statement. This slide provides a brief about the business income statement, how much revenue business will be generating from selling the products or services. The business earnings after tax is being calculated considering all the expenses and loss adjustments. Determine after tax growth percentage.

Assessing Annual Income Statement Of Brand How To Implement Product Background Pdf
This slide showcases analyses annual income statement of brand. It provides details about net sales, cost of goods sold, gross margin percentage, research and development, advertising, packaging, product line launch, contribution margin, etc. If you are looking for a format to display your unique thoughts, then the professionally designed Assessing Annual Income Statement Of Brand How To Implement Product Background Pdf is the one for you. You can use it as a Google Slides template or a PowerPoint template. Incorporate impressive visuals, symbols, images, and other charts. Modify or reorganize the text boxes as you desire. Experiment with shade schemes and font pairings. Alter, share or cooperate with other people on your work. Download Assessing Annual Income Statement Of Brand How To Implement Product Background Pdf and find out how to give a successful presentation. Present a perfect display to your team and make your presentation unforgettable. This slide showcases analyses annual income statement of brand. It provides details about net sales, cost of goods sold, gross margin percentage, research and development, advertising, packaging, product line launch, contribution margin, etc.
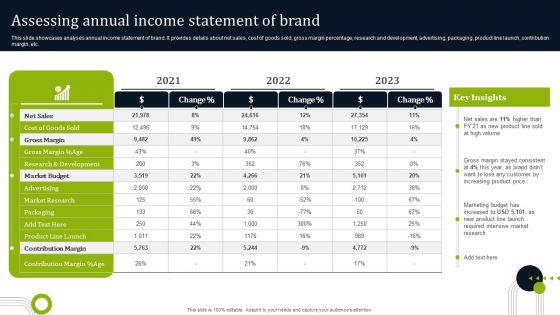
Introducing New Commodities Through Product Line Extension Assessing Annual Income Statement Diagrams PDF
This slide showcases analyses annual income statement of brand. It provides details about net sales, cost of goods sold, gross margin percentage, research and development, advertising, packaging, product line launch, contribution margin, etc. Slidegeeks is here to make your presentations a breeze with Introducing New Commodities Through Product Line Extension Assessing Annual Income Statement Diagrams PDF With our easy-to-use and customizable templates, you can focus on delivering your ideas rather than worrying about formatting. With a variety of designs to choose from, you are sure to find one that suits your needs. And with animations and unique photos, illustrations, and fonts, you can make your presentation pop. So whether you are giving a sales pitch or presenting to the board, make sure to check out Slidegeeks first.
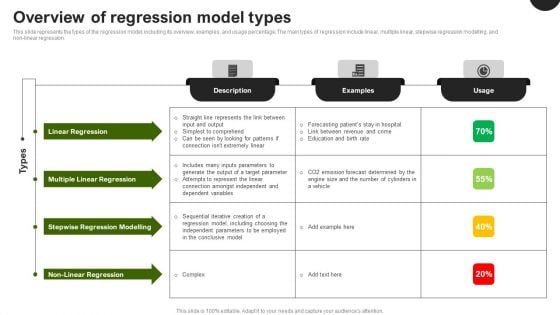
Predictive Analytics In The Age Of Big Data Overview Of Regression Model Types Diagrams PDF
This slide represents the types of the regression model, including its overview, examples, and usage percentage. The main types of regression include linear, multiple linear, stepwise regression modelling, and non-linear regression. If you are looking for a format to display your unique thoughts, then the professionally designed Predictive Analytics In The Age Of Big Data Overview Of Regression Model Types Diagrams PDF is the one for you. You can use it as a Google Slides template or a PowerPoint template. Incorporate impressive visuals, symbols, images, and other charts. Modify or reorganize the text boxes as you desire. Experiment with shade schemes and font pairings. Alter, share or cooperate with other people on your work. Download Predictive Analytics In The Age Of Big Data Overview Of Regression Model Types Diagrams PDF and find out how to give a successful presentation. Present a perfect display to your team and make your presentation unforgettable.
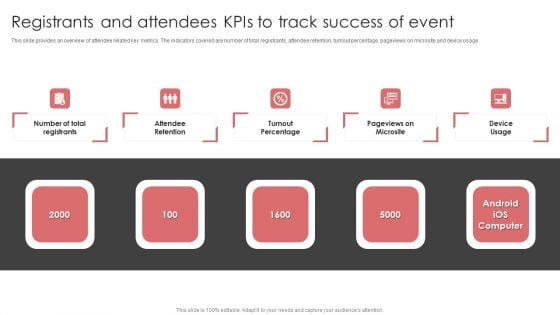
New Product Launch Event Management Activities Registrants And Attendees Kpis To Track Themes PDF
This slide provides an overview of attendee related key metrics. The indicators covered are number of total registrants, attendee retention, turnout percentage, pageviews on microsite and device usage.This New Product Launch Event Management Activities Registrants And Attendees Kpis To Track Themes PDF from Slidegeeks makes it easy to present information on your topic with precision. It provides customization options, so you can make changes to the colors, design, graphics, or any other component to create a unique layout. It is also available for immediate download, so you can begin using it right away. Slidegeeks has done good research to ensure that you have everything you need to make your presentation stand out. Make a name out there for a brilliant performance.
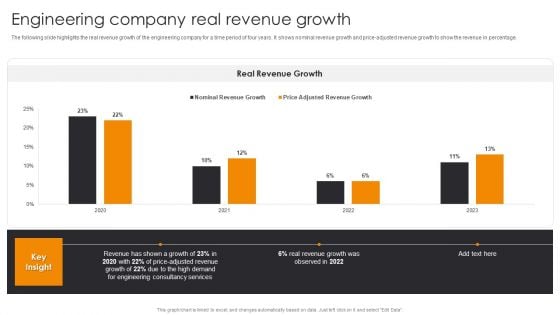
Engineering Company Real Revenue Growth Engineering Company Financial Analysis Report Structure PDF
The following slide highlights the real revenue growth of the engineering company for a time period of four years. It shows nominal revenue growth and price-adjusted revenue growth to show the revenue in percentage.Formulating a presentation can take up a lot of effort and time, so the content and message should always be the primary focus. The visuals of the PowerPoint can enhance the presenters message, so our Engineering Company Real Revenue Growth Engineering Company Financial Analysis Report Structure PDF was created to help save time. Instead of worrying about the design, the presenter can concentrate on the message while our designers work on creating the ideal templates for whatever situation is needed. Slidegeeks has experts for everything from amazing designs to valuable content, we have put everything into Engineering Company Real Revenue Growth Engineering Company Financial Analysis Report Structure PDF.

Nike Brand Expansion Assessing Annual Income Statement Of Brand Themes PDF
This slide showcases analyses annual income statement of brand. It provides details about net sales, cost of goods sold, gross margin percentage, research and development, advertising, packaging, product line launch, contribution margin, etc. Slidegeeks is one of the best resources for PowerPoint templates. You can download easily and regulate Nike Brand Expansion Assessing Annual Income Statement Of Brand Themes PDF for your personal presentations from our wonderful collection. A few clicks is all it takes to discover and get the most relevant and appropriate templates. Use our Templates to add a unique zing and appeal to your presentation and meetings. All the slides are easy to edit and you can use them even for advertisement purposes.
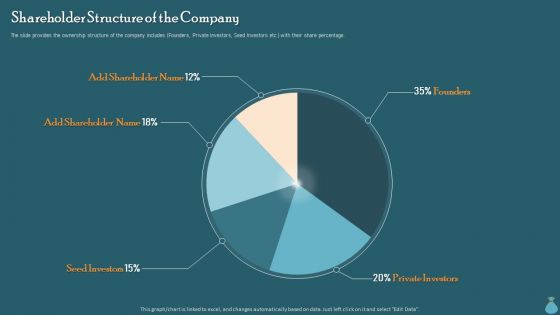
Financial Data Revelation To Varied Stakeholders Shareholder Structure Of The Company Microsoft PDF
The slide provides the ownership structure of the company includes Founders, Private Investors, Seed Investors etc. with their share percentage. Slidegeeks is here to make your presentations a breeze with Financial Data Revelation To Varied Stakeholders Shareholder Structure Of The Company Microsoft PDF With our easy to use and customizable templates, you can focus on delivering your ideas rather than worrying about formatting. With a variety of designs to choose from, you are sure to find one that suits your needs. And with animations and unique photos, illustrations, and fonts, you can make your presentation pop. So whether you are giving a sales pitch or presenting to the board, make sure to check out Slidegeeks first.
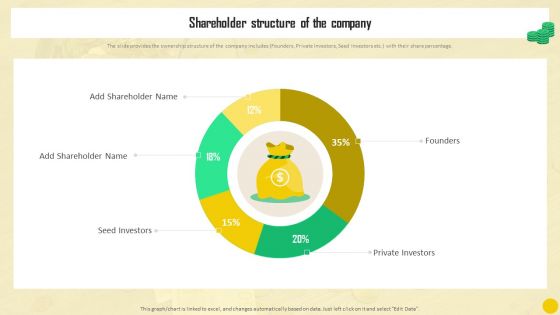
Financial Reporting To Analyze Shareholder Structure Of The Company Graphics PDF
The slide provides the ownership structure of the company includes Founders, Private Investors, Seed Investors etc. with their share percentage. Formulating a presentation can take up a lot of effort and time, so the content and message should always be the primary focus. The visuals of the PowerPoint can enhance the presenters message, so our Financial Reporting To Analyze Shareholder Structure Of The Company Graphics PDF was created to help save time. Instead of worrying about the design, the presenter can concentrate on the message while our designers work on creating the ideal templates for whatever situation is needed. Slidegeeks has experts for everything from amazing designs to valuable content, we have put everything into Financial Reporting To Analyze Shareholder Structure Of The Company Graphics PDF.

 Home
Home