Percentage Icon
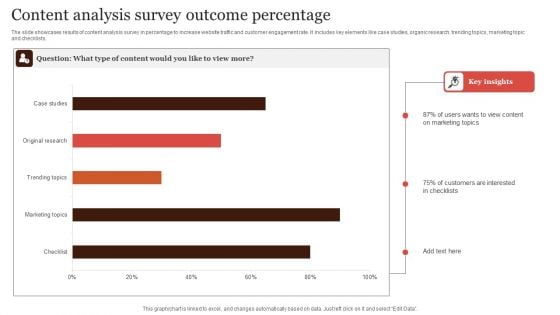
Content Analysis Survey Outcome Percentage Formats PDF
The slide showcases results of content analysis survey in percentage to increase website traffic and customer engagement rate. It includes key elements like case studies, organic research, trending topics, marketing topic and checklists. Showcasing this set of slides titled Content Analysis Survey Outcome Percentage Formats PDF. The topics addressed in these templates are Content Analysis, Survey Outcome Percentage. All the content presented in this PPT design is completely editable. Download it and make adjustments in color, background, font etc. as per your unique business setting.
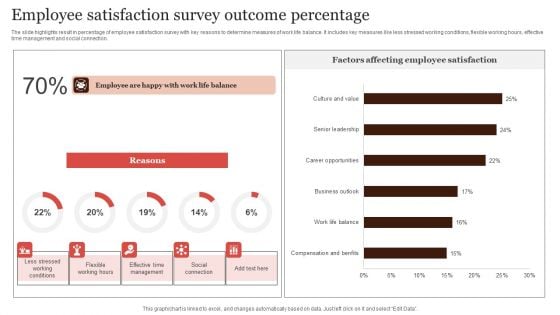
Employee Satisfaction Survey Outcome Percentage Graphics PDF
The slide highlights result in percentage of employee satisfaction survey with key reasons to determine measures of work life balance. It includes key measures like less stressed working conditions, flexible working hours, effective time management and social connection. Showcasing this set of slides titled Employee Satisfaction Survey Outcome Percentage Graphics PDF. The topics addressed in these templates are Factors Affecting, Employee Satisfaction, Survey Outcome Percentage. All the content presented in this PPT design is completely editable. Download it and make adjustments in color, background, font etc. as per your unique business setting.
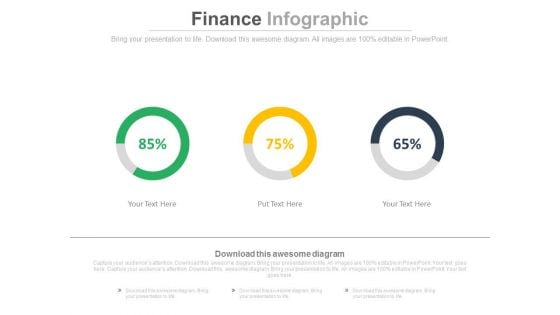
Linear Circles Percentage Analysis Charts Powerpoint Slides
This PowerPoint template has been designed with graphics of three circles and percentage ratios. You may use this dashboard slide design for topics like profit growth and financial planning. This PPT slide is powerful tool to describe your ideas.
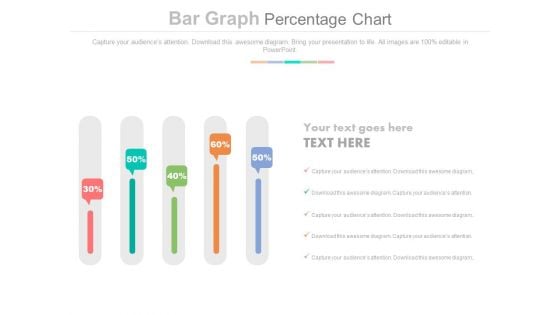
Sliders Percentage Data Chart Powerpoint Slides
This PowerPoint slide has been designed with slider chart and percentage data. This PPT diagram may be used to display business trends. This diagram slide can be used to make impressive presentations.
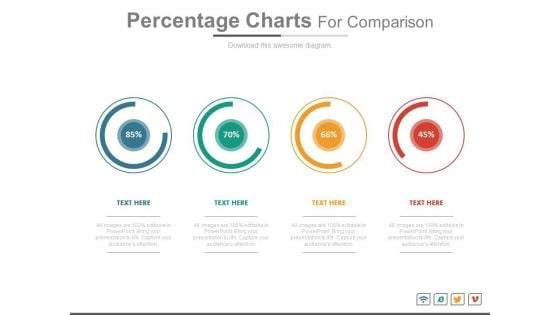
Percentage Charts For Statistical Comparison Powerpoint Slides
This PowerPoint template has been chart of percentage values. You may download this diagram for statistical comparison and analysis. Add this PPT slide to your presentation and impress your superiors.
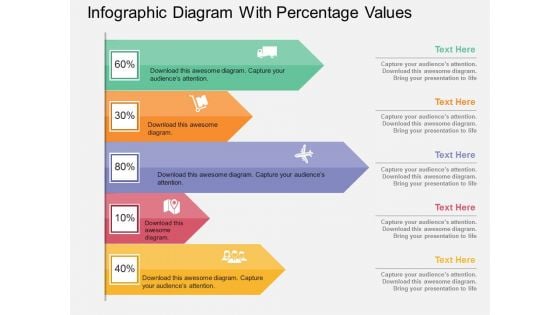
Infographic Diagram With Percentage Values Powerpoint Template
Visually support your presentation with our above template containing infographic diagram with percentage values. This diagram is excellent visual tools for explaining huge amounts of information where complex data needs to be explained immediately and clearly.
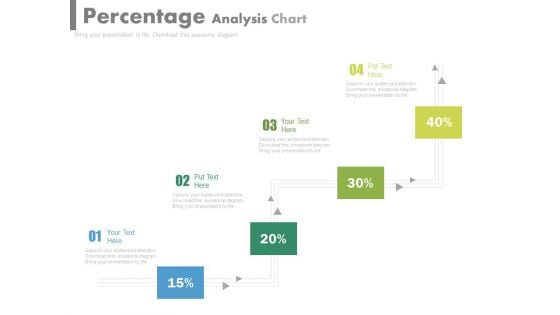
Pipeline Percentage Analysis Chart Powerpoint Slides
This PowerPoint template has been designed with pipeline percentage analysis chart. This PPT slide can be used to display business strategy plan. You can download finance PowerPoint template to prepare awesome presentations.
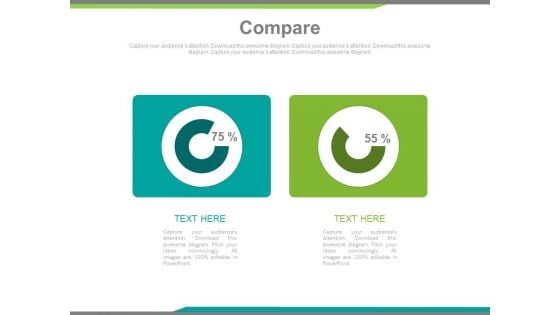
Two Percentage Values Comparison Charts Powerpoint Slides
This PowerPoint template has been designed with two percentage values You may download this PPT slide to use as comparison chart. Add this slide to your presentation and impress your superiors.
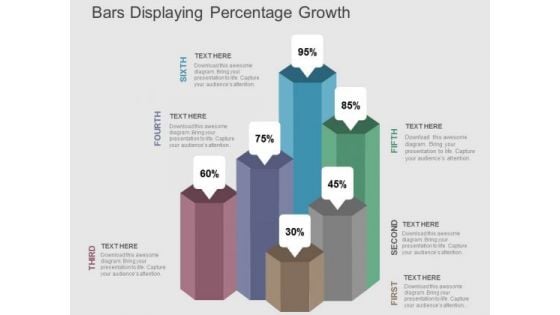
Bars Displaying Percentage Growth PowerPoint Templates
Our above PPT slide contains bar graph displaying percentage growth. This diagram of bar graph helps to depict statistical information. Use this diagram to impart more clarity to data and to create more sound impact on viewers.
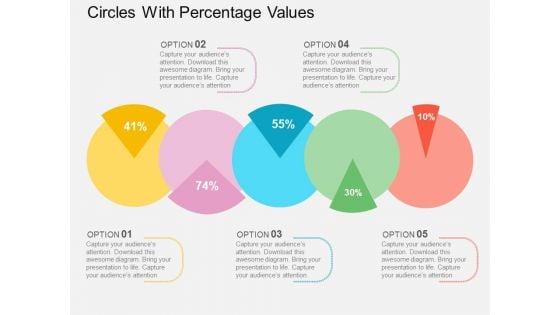
Circles With Percentage Values Powerpoint Templates
This PowerPoint template displays circles with percentage values. This business diagram is suitable for financial data analysis. Use this business diagram slide to highlight the key issues of your presentation.
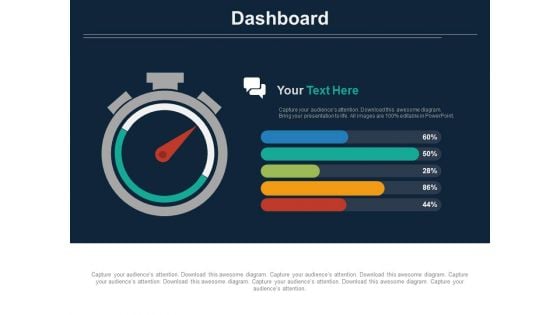
Stopwatch With Percentage Value Analysis Powerpoint Slides
The above template displays a diagram of stopwatch with percentage value. This diagram has been professionally designed to emphasize on time management. Grab center stage with this slide and capture the attention of your audience.
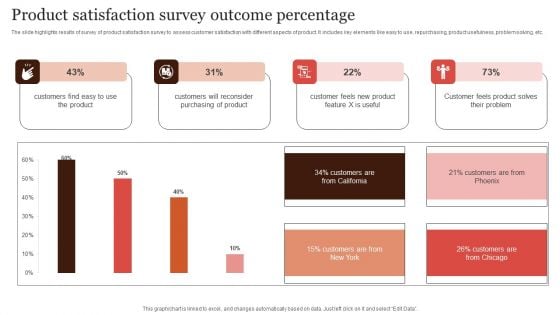
Product Satisfaction Survey Outcome Percentage Elements PDF
The slide highlights results of survey of product satisfaction survey to assess customer satisfaction with different aspects of product. It includes key elements like easy to use, repurchasing, product usefulness, problem solving, etc. Showcasing this set of slides titled Product Satisfaction Survey Outcome Percentage Elements PDF. The topics addressed in these templates are Customers Will Reconsider, Purchasing Of Product, Survey Outcome Percentage. All the content presented in this PPT design is completely editable. Download it and make adjustments in color, background, font etc. as per your unique business setting.
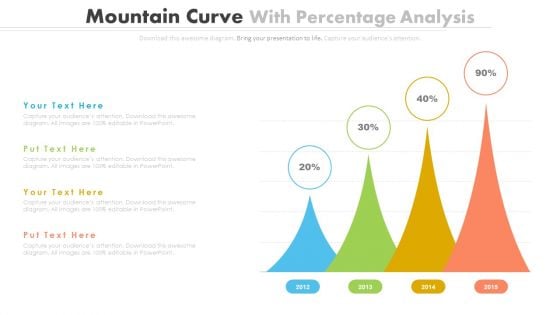
Percentage Data Growth Chart Powerpoint Slides
This PowerPoint template has been designed with percentage data growth chart. Download this PPT chart to depict financial ratio analysis. This PowerPoint slide is of great help in the business sector to make realistic presentations and provides effective way of presenting your newer thoughts.
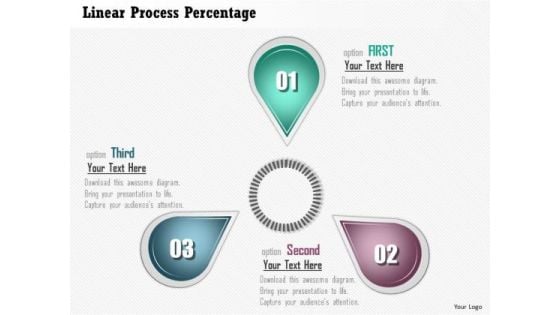
Business Diagram Linear Process Percentage Presentation Template
This slide contains linear process percentage diagram presentation template. This business diagram has been designed with graphic of three staged linear process diagram. This diagram has been crafted to display the concept of financial planning. Use this diagram for your finance and business related presentations.
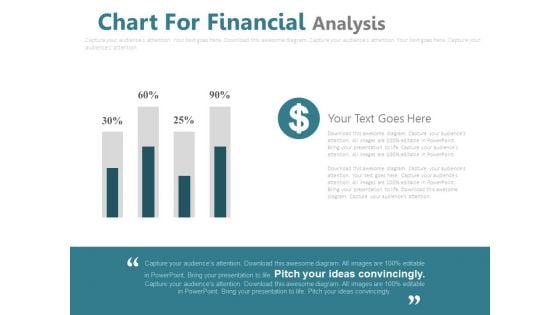
Chart For Financial Percentage Analysis Powerpoint Slides
This PowerPoint template has been designed with financial chart with dollar icon. This PPT slide may be used to display dollar value analysis chart. Download this slide to build unique presentation.
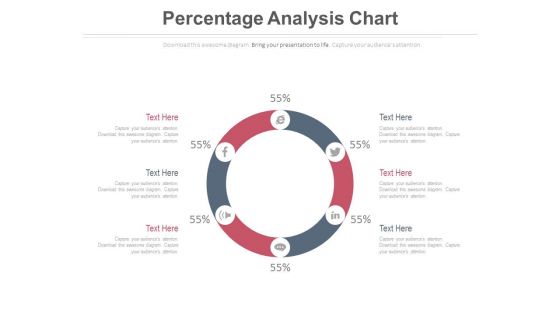
Circular Diagram For Percentage Analysis Powerpoint Slides
This PowerPoint slide has been designed with circular diagram with social media icons. This diagram slide may be used to display users of social media. Prove the viability of your ideas with this professional slide.
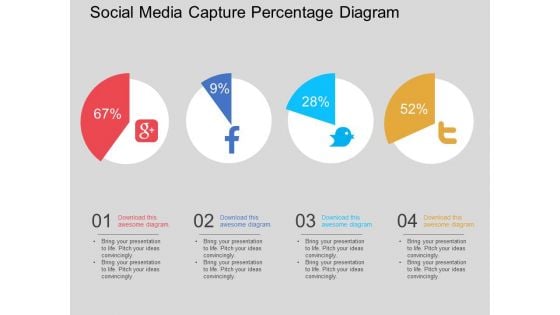
Social Media Capture Percentage Diagram Powerpoint Template
This PowerPoint template displays graphics of four circles with social media icons. This business diagram has been designed to exhibit ratios of social media users. Download this diagram slide to make impressive presentations.
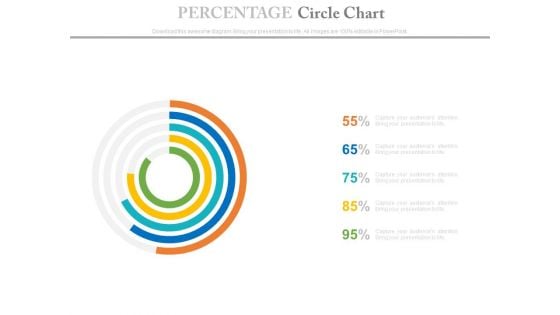
Percentage Data Circle Chart Powerpoint Slides
This PowerPoint template has been designed with circle chart. Download this PPT chart to depict financial ratio analysis. This PowerPoint slide is of great help in the business sector to make realistic presentations and provides effective way of presenting your newer thoughts.
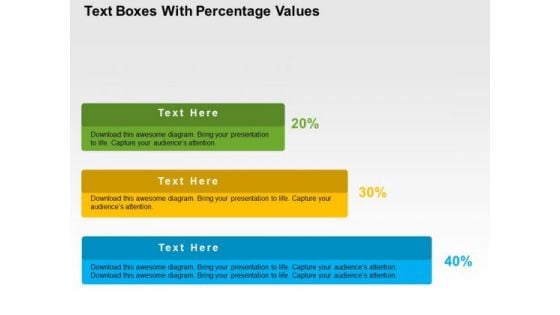
Text Boxes With Percentage Values PowerPoint Template
Growth analysis for business can be defined with this business diagram. This slide depicts text boxes in increasing flow. Present your views using this innovative slide and be assured of leaving a lasting impression
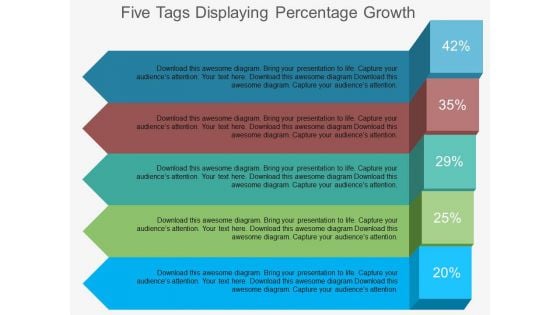
Five Tags Displaying Percentage Growth Powerpoint Template
This diagram contains colored tags infographic set. Download this diagram slide to display business planning and growth. This diagram is editable you can edit text, color, shade and style as per you need.
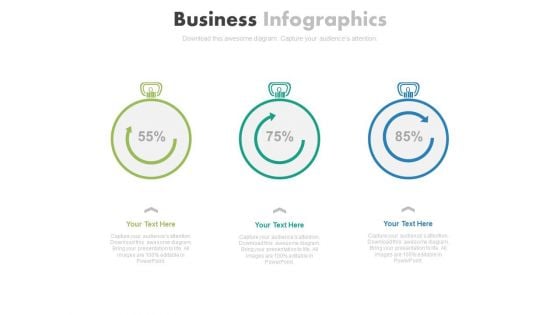
Three Stopwatches For Percentage Growth Powerpoint Slides
Three stopwatches have been displayed in this business slide. This business diagram helps to exhibit parameters of growth and development. Download this PowerPoint template to build an exclusive presentation.
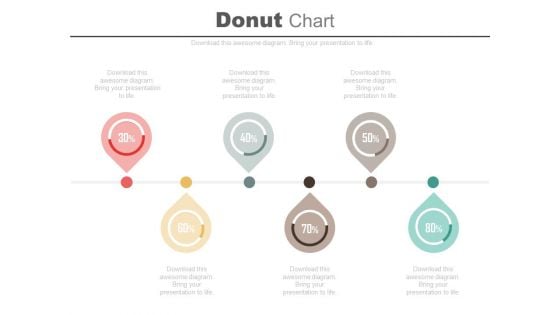
Six Pointers Percentage Timeline Diagram Powerpoint Slides
Profitability indicator ratios have been displayed this business slide. This PowerPoint template contains linear pointers timeline diagram. Use this professional diagram slide to build an exclusive presentation.
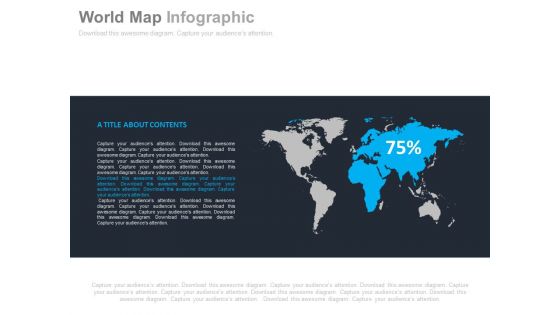
World Map With Percentage Value Powerpoint Slides
This professionally designed PowerPoint template displays diagram of world map. You can download this diagram to exhibit global business analysis. Above PPT slide is suitable for business presentation.
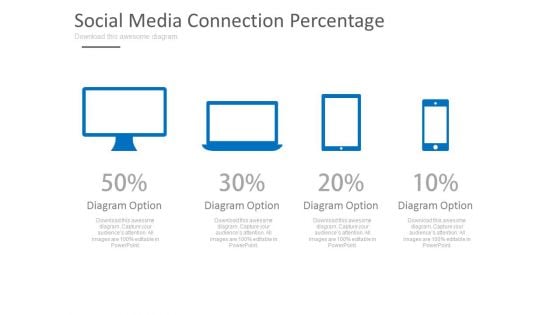
Computer Devices With Percentage Values Powerpoint Slides
This PPT slide displays graphics of computer, laptop, tablet and mobile. Use this PPT design to display comparison of computer devices. This PowerPoint template can be customized as per requirements of business education or any other theme.
Percentage Symbol With Text Holders Ppt PowerPoint Presentation Example 2015
This is a percentage symbol with text holders ppt powerpoint presentation example 2015. This is a three stage process. The stages in this process are percentage icon, dividend icon, portion icon.
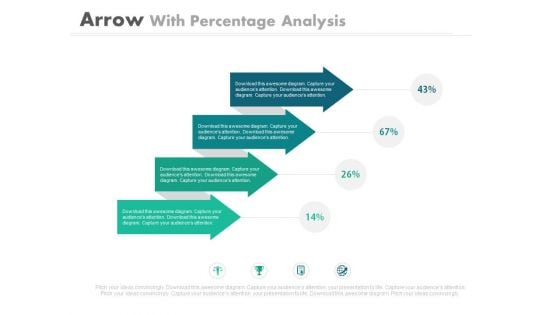
Four Arrows For Percentage Ratio Analysis Powerpoint Slides
This PowerPoint template has been designed with graphics of four arrows with icons. This professional template is suitable to display percentage ratio analysis. Use this diagram slide to build an exclusive presentation.
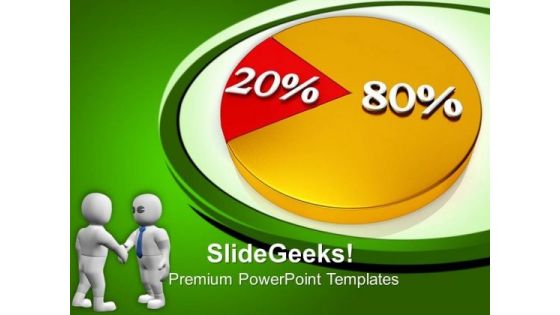
Percentage Pie Chart Business PowerPoint Templates And PowerPoint Themes 0812
Percentage Pie Chart Business PowerPoint Templates And PowerPoint Themes 0812-Microsoft Powerpoint Templates and Background with percentage pie chart Fight back gamely with our Percentage Pie Chart Business PowerPoint Templates And PowerPoint Themes 0812. Make adversity back off with your thoughts.

Loan Percentage Concept Symbol PowerPoint Templates And PowerPoint Themes 0712
Loan Percentage Concept Symbol PowerPoint Templates And PowerPoint Themes 0712-Microsoft Powerpoint Templates and Background with loan percentage Improve the efficiency of your factory. Our Loan Percentage Concept Symbol PowerPoint Templates And PowerPoint Themes 0712 make process assessment easier.
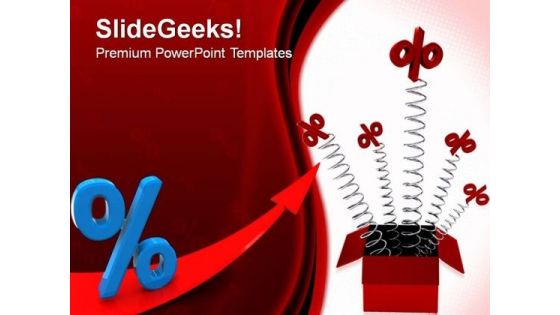
Percentage Improvement Teamwork PowerPoint Templates And PowerPoint Themes 0812
Percentage Improvement Teamwork PowerPoint Templates And PowerPoint Themes 0812-Microsoft Powerpoint Templates and Background with percentage improvement Fan audience aspirations with our Percentage Improvement Teamwork PowerPoint Templates And PowerPoint Themes 0812. Their confidence will flow from your thoughts.
Blue Percentage Business PowerPoint Templates And PowerPoint Themes 0812
Blue Percentage Business PowerPoint Templates And PowerPoint Themes 0812-Microsoft Powerpoint Templates and Background with blue percentage Drown doubts with our Blue Percentage Business PowerPoint Templates And PowerPoint Themes 0812. You will come out on top.
Housing Percentage Real Estate PowerPoint Templates And PowerPoint Themes 0812
Housing Percentage Real Estate PowerPoint Templates And PowerPoint Themes 0812-Microsoft Powerpoint Templates and Background with housing percentage The adaptability of our Housing Percentage Real Estate PowerPoint Templates And PowerPoint Themes 0812 is a fact. They will align with your bidding.
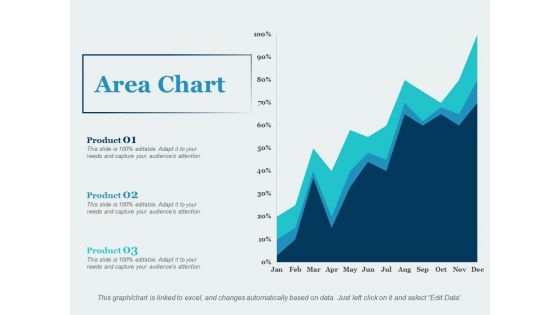
Area Chart Percentage Ppt PowerPoint Presentation Gallery Outline
This is a area chart percentage ppt powerpoint presentation gallery outline. This is a three stage process. The stages in this process are business, management, marketing, percentage, product.
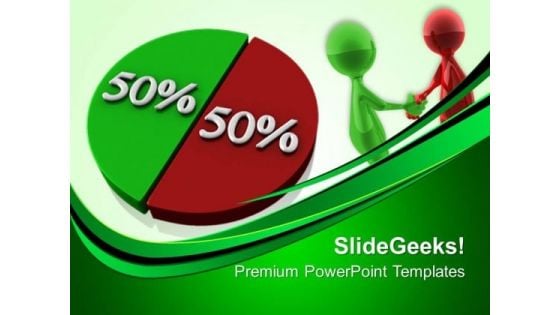
Pie Chart Percentage Business PowerPoint Templates And PowerPoint Themes 0712
Pie Chart Percentage Business PowerPoint Templates And PowerPoint Themes 0712-Microsoft Powerpoint Templates and Background with pie chart percent Assist the fallen with our Pie Chart Percentage Business PowerPoint Templates And PowerPoint Themes 0712. Give them hope to rise again.
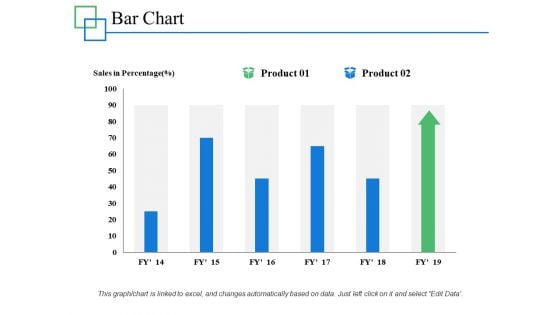
Bar Chart Percentage Product Ppt PowerPoint Presentation Layouts Designs Download
This is a bar chart percentage product ppt powerpoint presentation layouts designs download. This is a two stage process. The stages in this process are percentage, product, business, management.
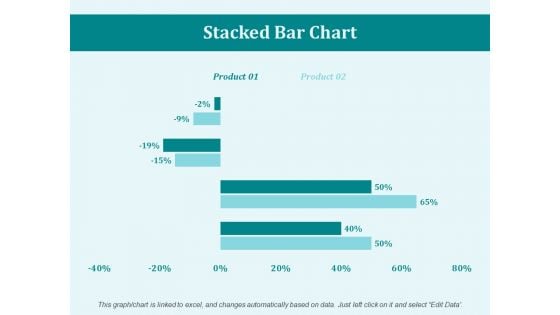
Stacked Bar Chart Percentage Ppt PowerPoint Presentation Portfolio Mockup
This is a stacked bar chart percentage ppt powerpoint presentation portfolio mockup. This is a two stage process. The stages in this process are business, marketing, management, percentage, product.

Bubble Chart Percentage Ppt PowerPoint Presentation File Layouts
This is a bubble chart percentage ppt powerpoint presentation file layouts. This is a two stage process. The stages in this process are finance, marketing, management, investment, product, percentage.
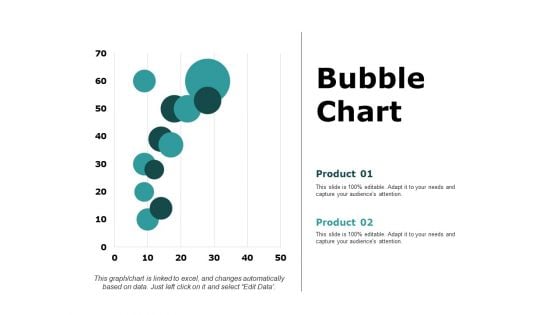
Bubble Chart Percentage Product Ppt PowerPoint Presentation Ideas Aids
This is a bubble chart percentage product ppt powerpoint presentation ideas aids. This is a two stage process. The stages in this process are business, management, marketing, percentage, product.
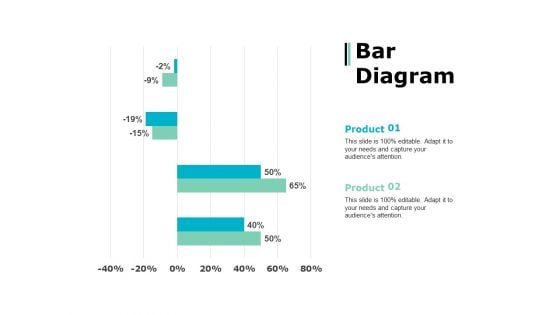
Bar Diagram Percentage Product Ppt PowerPoint Presentation Show Topics
This is a bar diagram percentage product ppt powerpoint presentation show topics. This is a two stage process. The stages in this process are percentage, product, business, management, marketing.

Stacked Column Percentage Product Ppt PowerPoint Presentation Infographics Outfit
This is a stacked column percentage product ppt powerpoint presentation infographics outfit. This is a two stage process. The stages in this process are marketing, business, management, percentage, product.
Percentage Success PowerPoint Themes And PowerPoint Slides 0611
Microsoft PowerPoint Theme and Slide with gold guy with percentage problem on business reports Dream big and achieve it with our Percentage Success PowerPoint Themes And PowerPoint Slides 0611. Dont pass up this opportunity to shine.
Golden Percentage Dice Finance PowerPoint Themes And PowerPoint Slides 0311
Microsoft PowerPoint Theme and Slide with golden percentage dice Our Golden Percentage Dice Finance PowerPoint Themes And PowerPoint Slides 0311 will keep the faith. They will show allegiance to your thoughts.
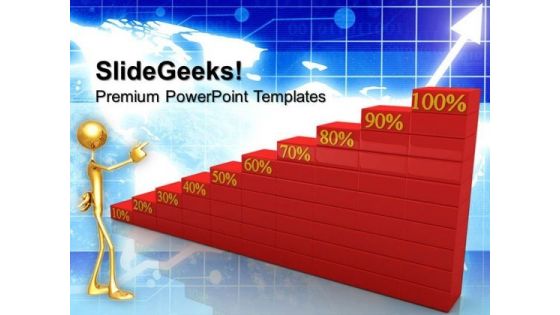
Percentage Graph Marketing PowerPoint Templates And PowerPoint Themes 0612
Percentage Graph Marketing PowerPoint Templates And PowerPoint Themes Business-Microsoft Powerpoint Templates and Background with growing percents Arrest doubts with our Percentage Graph Marketing PowerPoint Templates And PowerPoint Themes 0612. You will come out on top.
Growing Percentage Finance Success PowerPoint Templates And PowerPoint Themes 0712
Growing Percentage Finance Success PowerPoint Templates And PowerPoint Themes 0712-Microsoft Powerpoint Templates and Background with growing percents Attain victory with our Growing Percentage Finance Success PowerPoint Templates And PowerPoint Themes 0712. You will come out on top.
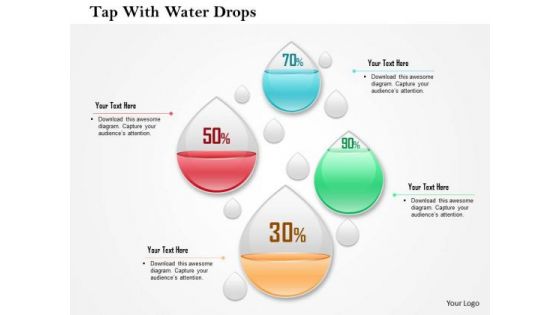
Business Diagram Four Water Drops With Percentage Values Presentation Template
This business diagram has been designed with graphic of four water drops and percentage values. This slide may be used to display percentage values for business analysis. Use this editable diagram for finance and business related presentations.
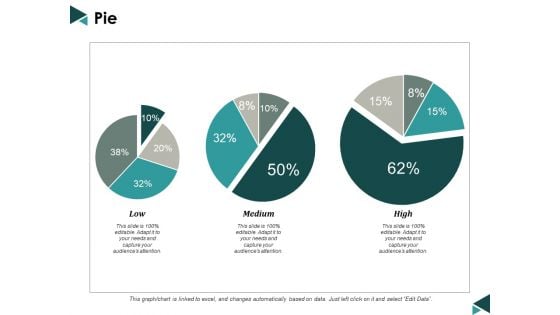
Pie Percentage Marketing Ppt Powerpoint Presentation Inspiration Show
This is a pie percentage marketing ppt powerpoint presentation inspiration show. This is a three stage process. The stages in this process are pie chart, percentage, marketing, business, analysis.
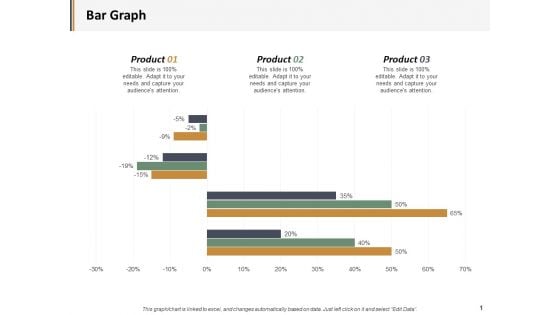
Bar Graph Percentage Product Ppt PowerPoint Presentation Layouts Microsoft
This is a bar graph percentage product ppt powerpoint presentation layouts microsoft. This is a three stage process. The stages in this process are business, management, marketing, percentage, product.

House And Percentage Symbol PowerPoint Templates And PowerPoint Themes 0812
House And Percentage Symbol PowerPoint Templates And PowerPoint Themes 0812-Microsoft Powerpoint Templates and Background with house and percentage Clever is the basic for our House And Percentage Symbol PowerPoint Templates And PowerPoint Themes 0812. Brilliance is what your thoughts will achieve.
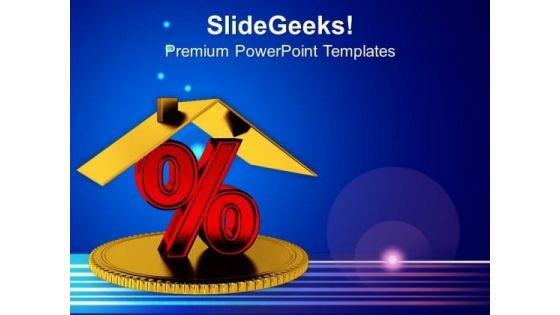
Percentage Concept Money PowerPoint Templates And PowerPoint Themes 0912
Percentage Concept Money PowerPoint Templates And PowerPoint Themes 0912-Microsoft Powerpoint Templates and Background with red percentage with money Put up the facts and figures on our Percentage Concept Money PowerPoint Templates And PowerPoint Themes 0912. Display the data for everyone's consumption.
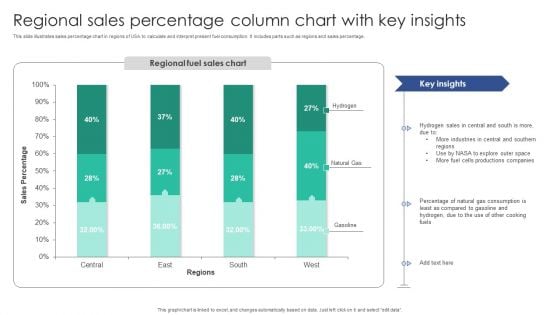
Regional Sales Percentage Column Chart With Key Insights Diagrams PDF
This slide illustrates sales percentage chart in regions of USA to calculate and interpret present fuel consumption. It includes parts such as regions and sales percentage.Pitch your topic with ease and precision using this Regional Sales Percentage Column Chart With Key Insights Diagrams PDF. This layout presents information on Industries Central, Sales Central, Productions Companies. It is also available for immediate download and adjustment. So, changes can be made in the color, design, graphics or any other component to create a unique layout.
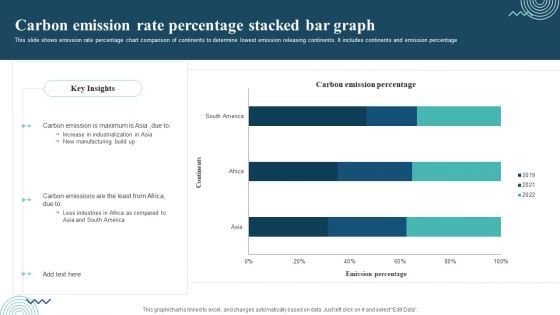
Carbon Emission Rate Percentage Stacked Bar Graph Rules PDF
This slide shows emission rate percentage chart comparison of continents to determine lowest emission releasing continents. It includes continents and emission percentage Showcasing this set of slides titled Carbon Emission Rate Percentage Stacked Bar Graph Rules PDF. The topics addressed in these templates are Carbon Emission, Increase In Industrialization, New Manufacturing. All the content presented in this PPT design is completely editable. Download it and make adjustments in color, background, font etc. as per your unique business setting.
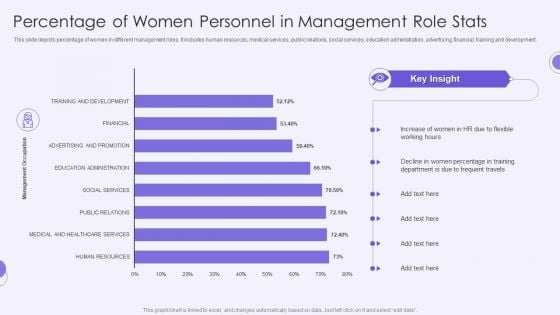
Percentage Of Women Personnel In Management Role Stats Clipart PDF
This slide depicts percentage of women in different management roles. It includes human resources, medical services, public relations, social services, education administration, advertising, financial, training and development.Showcasing this set of slides titled Percentage Of Women Personnel In Management Role Stats Clipart PDF. The topics addressed in these templates are Increase Women, Percentage In Training, Frequent Travels. All the content presented in this PPT design is completely editable. Download it and make adjustments in color, background, font etc. as per your unique business setting.
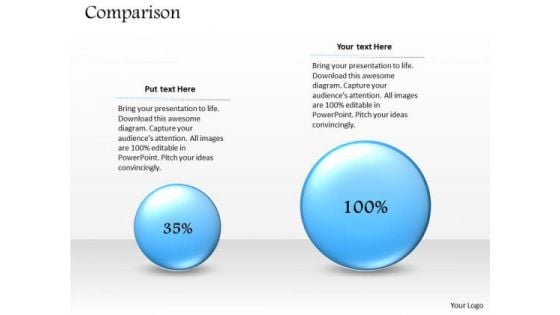
Strategic Management Percentage Comparison Business Layout Business Diagram
Knock On The Door To Success With Our Strategic Management Percentage Comparison Business Layout Business Diagram Powerpoint Templates. Be Assured Of Gaining Entry.
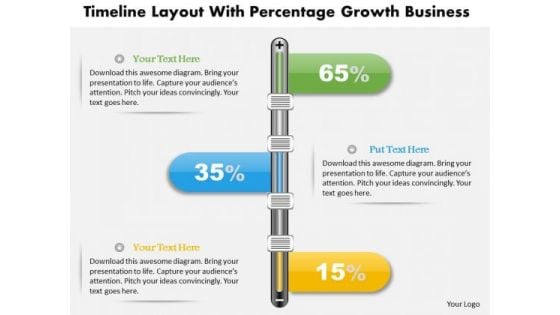
Consulting Slides Timeline Layout With Percentage Growth Business Presentation
Our awesome diagram consists with timeline layout with percentage growth. This diagram is easily editable. This diagram helps to display growth is sales or profit in business presentations
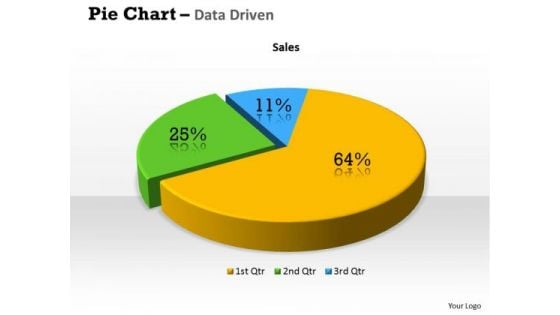
Quantitative Data Analysis 3d Percentage Ratio Pie Chart PowerPoint Templates
Plan Your Storyboard With Our quantitative data analysis 3d percentage ratio pie chart Powerpoint Templates . Give An Outline To The Solutions You Have.
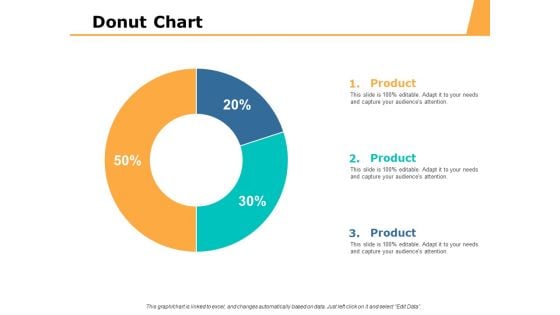
Pie Chart Percentage Ppt PowerPoint Presentation Inspiration Slides
This is a pie chart percentage ppt powerpoint presentation inspiration slides. This is a three stage process. The stages in this process are finance, marketing, management, investment, analysis.
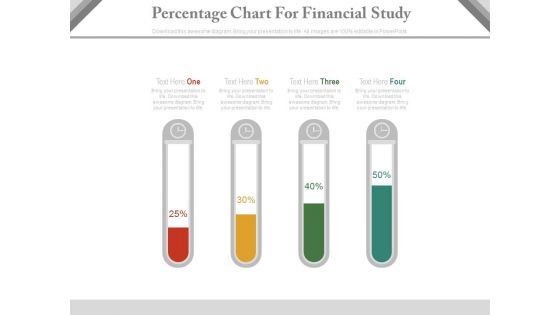
Test Tubes Percentage Chart For Financial Analysis Powerpoint Slides
This PPT slide contains test tubes percentage chart. You may download this PowerPoint template for financial analysis in your presentations. Make outstanding business presentation with this template.
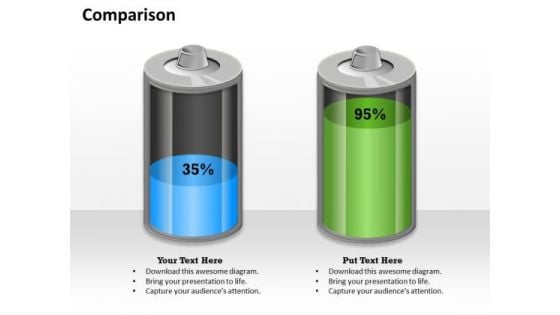
Business Cycle Diagram Percentage Comparison Business Design Strategy Diagram
Get Out Of The Dock With Our Business Cycle Diagram Percentage Comparison Business Design Strategy Diagram Powerpoint Templates. Your Mind Will Be Set Free.
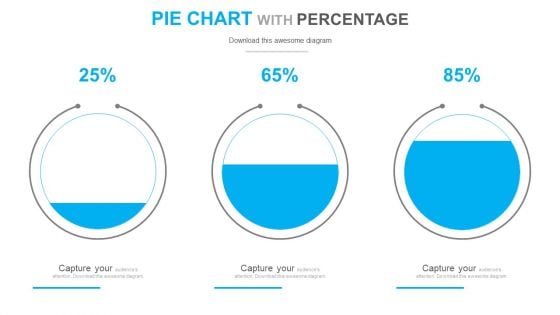
Circle Chart With Increasing Percentage Values PowerPoint Slides
Circle Chart with Increasing Percentage Values power point Slides: - Show your achievements and targets with the ideal background. Above is the diagram to display how your business has been growing or your achievements. The slide is of the three circles having water at different levels in them. Therefore it becomes easy to show that in the first circle, the growth is at this much percent, then the second one and in the last circle, completed 85% of the targets. This PowerPoint template is easy to use to show the progress, and comparisons. All icons are editable. Choose them as per your need.
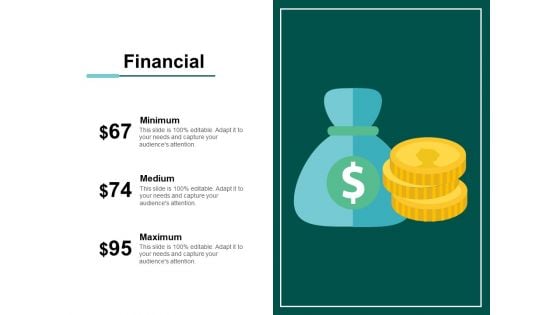
Financial Percentage Ppt PowerPoint Presentation Model Design Templates
This is a financial percentage ppt powerpoint presentation model design templates. This is a three stage process. The stages in this process are financial, minimum, maximum, marketing, strategy.
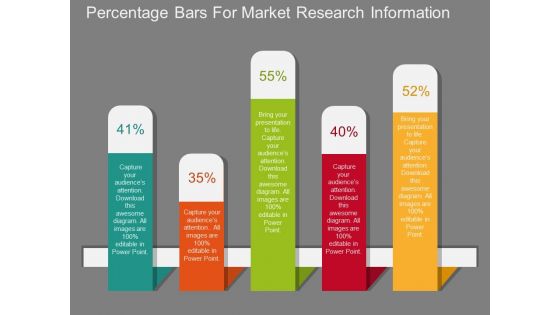
Percentage Bars For Market Research Information Powerpoint Template
This PowerPoint template displays diagram of percentage bars. This slide has been innovatively designed to present market research information. Capture the attention of your audience with this slide.

 Home
Home