Percentage Icon
Ways To Improve Production Process With Icons Ppt PowerPoint Presentation Outline Objects
Presenting this set of slides with name ways to improve production process with icons ppt powerpoint presentation outline objects. This is a five stage process. The stages in this process are reduce waiting time, process re engineering, employee involvement, time management and scheduling of tasks, perform tasks in parallel. This is a completely editable PowerPoint presentation and is available for immediate download. Download now and impress your audience.
Playbook For Lean Agile Project Administration Determine Schedule Planning For Agile Product Development Icons PDF
This slide provides information regarding agile project schedule planning by keeping track of every task included in product development with task status. Deliver an awe inspiring pitch with this creative Playbook For Lean Agile Project Administration Determine Schedule Planning For Agile Product Development Icons PDF bundle. Topics like Determine Schedule Planning, Product Development can be discussed with this completely editable template. It is available for immediate download depending on the needs and requirements of the user.
Progress Summary Dashboard For Tracking Project Health And Timeline Icons PDF
The following slide showcases business progress report for work completion status. It presents information related to task status, health, testing, budget, etc. Showcasing this set of slides titled Progress Summary Dashboard For Tracking Project Health And Timeline Icons PDF. The topics addressed in these templates are Project Progress, Budget, Project Timeline. All the content presented in this PPT design is completely editable. Download it and make adjustments in color, background, font etc. as per your unique business setting.
KPI Dashboard To Monitor Software Development Project Status Testing Icons PDF
Mentioned slide shows software development project management dashboard. KPIs covered in the dashboard are status of project budget, overdue tasks, workload and upcoming deadlines. Deliver an awe inspiring pitch with this creative kpi dashboard to monitor software development project status testing icons pdf bundle. Topics like kpi dashboard to monitor software development project status can be discussed with this completely editable template. It is available for immediate download depending on the needs and requirements of the user.
Comprehensive Development And Operations Adoption Initiatives IT Tracking Essential Devops Icons PDF
This slide provides information regarding essential DevOps activities tracking dashboard in terms of project budget, workload, overdue tasks, etc. Deliver an awe inspiring pitch with this creative comprehensive development and operations adoption initiatives it tracking essential devops icons pdf bundle. Topics like planning, design, development, project budget can be discussed with this completely editable template. It is available for immediate download depending on the needs and requirements of the user.
Automating Key Activities Of HR Manager Effect Of Automation On Employees Workforce Icons PDF
This slide focuses on the graphical presentation that represents the division of hours between human and machine for performing tasks.Deliver an awe inspiring pitch with this creative Automating Key Activities Of HR Manager Effect Of Automation On Employees Workforce Icons PDF bundle. Topics like Companies Focusing, Functions Optimal, Automation Technology can be discussed with this completely editable template. It is available for immediate download depending on the needs and requirements of the user.
Strategies To Enhance Project Management Process Project Closure Checklist To Track Status Icons PDF
This slide shows the project closure checklist to track status which focuses on description of task, status, completion date and notes. Deliver an awe inspiring pitch with this creative Strategies To Enhance Project Management Process Project Closure Checklist To Track Status Icons PDF bundle. Topics like Goals Of Project, Finance, Measures can be discussed with this completely editable template. It is available for immediate download depending on the needs and requirements of the user.
Recruitment Training To Optimize Skill Gap Analysis Of The Employee Icons PDF
This slide shows various details required skills to preform task, important of skill, and required level of skills to analyze the Skills Gaps in the employees. Deliver an awe inspiring pitch with this creative Recruitment Training To Optimize Skill Gap Analysis Of The Employee Icons PDF bundle. Topics like Negotiation Skills, Negotiation Skills can be discussed with this completely editable template. It is available for immediate download depending on the needs and requirements of the user.
Prioritisation Matrix With Important And Urgent Ppt PowerPoint Presentation Pictures Icons PDF
Presenting prioritisation matrix with important and urgent ppt powerpoint presentation pictures icons pdf to dispense important information. This template comprises four stages. It also presents valuable insights into the topics including mention the tasks that needs to be done right away, mention the tasks that are planned to be done asap, mention the tasks to be delegated, mention the tasks can be postponed. This is a completely customizable PowerPoint theme that can be put to use immediately. So, download it and address the topic impactfully.
Business Project Planning With Management System Ppt PowerPoint Presentation File Icons PDF
This slide focuses on work breakdown structure in project management system which covers planning, execution and control, closeout with sub tasks such as creating structure, developing project schedule and plan, conducting Kick-off meeting, etc. Presenting business project planning with management system ppt powerpoint presentation file icons pdf to dispense important information. This template comprises three stages. It also presents valuable insights into the topics including planning, execution and control, closeout. This is a completely customizable PowerPoint theme that can be put to use immediately. So, download it and address the topic impactfully.
Solution Assessment And Validation To Determine Business Readiness Solution Assessment And Validation Icons PDF
This slide shows the solution assessment and validation model or framework which helps to assess and determine that which solution best fits the business requirements along with the model inputs and outputs. Deliver an awe inspiring pitch with this creative solution assessment and validation to determine business readiness solution assessment and validation icons pdf bundle. Topics like solution assessment and validation tasks, process outputs, mitigating actions can be discussed with this completely editable template. It is available for immediate download depending on the needs and requirements of the user.
Strategies To Enhance Finance Team Development Techniques And Productivity Icons PDF
This slide covers techniques to optimise performance of finance team. It includes strategies such as elimination of manual tasks with finance automation, adoption of finance department tech stack, etc. Showcasing this set of slides titled Strategies To Enhance Finance Team Development Techniques And Productivity Icons PDF. The topics addressed in these templates are Strategy, Action Steps, Finance Department. All the content presented in this PPT design is completely editable. Download it and make adjustments in color, background, font etc. as per your unique business setting.
Employees Training Plan Roadmap For Logistics And Cargo Management Ppt Outline Icons PDF
This slide showcases logistics training plan along with task breakup on the basis of number of hours allocated to each topic individually. It includes elements such as inventory management, transportation and distribution operations. Showcasing this set of slides titled Employees Training Plan Roadmap For Logistics And Cargo Management Ppt Outline Icons PDF. The topics addressed in these templates are Inventory Management, Transportation Management, Distribution Operations. All the content presented in this PPT design is completely editable. Download it and make adjustments in color, background, font etc. as per your unique business setting.
Leveraging Twitter For Social Performance Analysis Of Current Social Media Marketing Icons PDF
This slide tabulates the performance analysis of existing digital marketing channels in terms of sessions, new users, bounce rate, average session duration, goal conversion rate, goal completions etc. Make sure to capture your audiences attention in your business displays with our gratis customizable Leveraging Twitter For Social Performance Analysis Of Current Social Media Marketing Icons PDF. These are great for business strategies, office conferences, capital raising or task suggestions. If you desire to acquire more customers for your tech business and ensure they stay satisfied, create your own sales presentation with these plain slides.
Parallel Computing System To Enhance Process Efficiency Difference Between Serial And Parallel Processing Icons PDF
This slide shows the comparison between serial and parallel processing based on factors such as cost, processor heat, time to complete a task, data transfer rate, and so on. In serial processing, there is only one CPU to complete a task, whereas parallel processing comprises multiple CPUs.Slidegeeks is one of the best resources for PowerPoint templates. You can download easily and regulate Parallel Computing System To Enhance Process Efficiency Difference Between Serial And Parallel Processing Icons PDF for your personal presentations from our wonderful collection. A few clicks is all it takes to discover and get the most relevant and appropriate templates. Use our Templates to add a unique zing and appeal to your presentation and meetings. All the slides are easy to edit and you can use them even for advertisement purposes.
Comprehensive Brand Portfolio Product Apple Brand Story Journey Of Iconic Enterprise Information Pdf
This slide provides information regarding complete brand portfolio of Apple in terms of product brand, service brand and experience brand. The purpose of brand portfolio is to serve requirements of different market segments. Make sure to capture your audiences attention in your business displays with our gratis customizable Comprehensive Brand Portfolio Product Apple Brand Story Journey Of Iconic Enterprise Information Pdf. These are great for business strategies, office conferences, capital raising or task suggestions. If you desire to acquire more customers for your tech business and ensure they stay satisfied, create your own sales presentation with these plain slides. This slide provides information regarding complete brand portfolio of Apple in terms of product brand, service brand and experience brand. The purpose of brand portfolio is to serve requirements of different market segments.
Icons Slide For Automating Supply Chain And Logistics For Minimizing Human Errors And Manual Tasks Professional PDF
Download our innovative and attention grabbing Icons Slide For Automating Supply Chain And Logistics For Minimizing Human Errors And Manual Tasks Professional PDF template. The set of slides exhibit completely customizable icons. These icons can be incorporated into any business presentation. So download it immediately to clearly communicate with your clientele.
Registrants And Attendees KPIS To Track Success Of Event Stakeholder Engagement Plan For Launch Event Icons PDF
This slide provides an overview of attendee related key metrics. The indicators covered are number of total registrants, attendee retention, turnout percentage, pageviews on microsite and device usage. Whether you have daily or monthly meetings, a brilliant presentation is necessary. Registrants And Attendees KPIS To Track Success Of Event Stakeholder Engagement Plan For Launch Event Icons PDF can be your best option for delivering a presentation. Represent everything in detail using Registrants And Attendees KPIS To Track Success Of Event Stakeholder Engagement Plan For Launch Event Icons PDF and make yourself stand out in meetings. The template is versatile and follows a structure that will cater to your requirements. All the templates prepared by Slidegeeks are easy to download and edit. Our research experts have taken care of the corporate themes as well. So, give it a try and see the results.
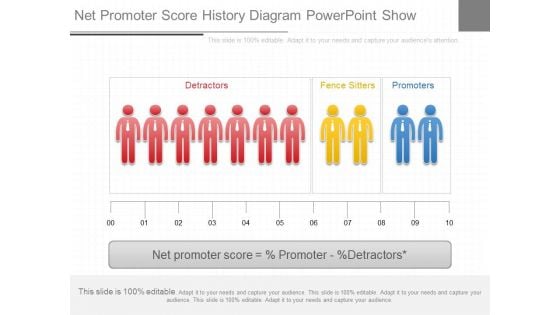
Net Promoter Score History Diagram Powerpoint Show
This is a net promoter score history diagram powerpoint show. This is a ten stage process. The stages in this process are detractors, fence sitters, promoters, net promoter score, percentage promoter, percentage detractors.
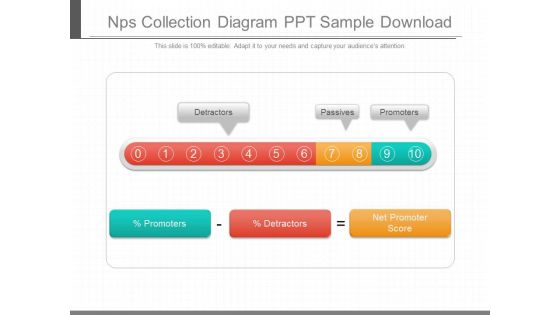
Nps Collection Diagram Ppt Sample Download
This is a nps collection diagram ppt sample download. This is a ten stage process. The stages in this process are detractors, passives, promoters, percentage promoters, percentage detractors, net promoter score.

Net Promoter Score Value Diagram Example Of Ppt
This is a net promoter score value diagram example of ppt. This is a ten stage process. The stages in this process are nps, percentage of promoters, percentage of detractors, detractors, passive, promoter, not at all likely, natural, extremely likely.
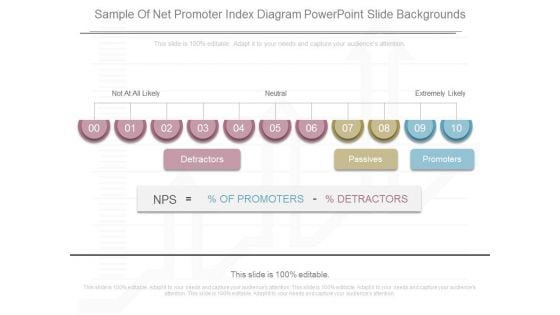
Sample Of Net Promoter Index Diagram Powerpoint Slide Backgrounds
This is a sample of net promoter index diagram powerpoint slide backgrounds. This is a ten stage process. The stages in this process are not at all likely, neutral, extremely likely, detractors, passives, promoters, nps, percentage detractors, percentage of promoters.
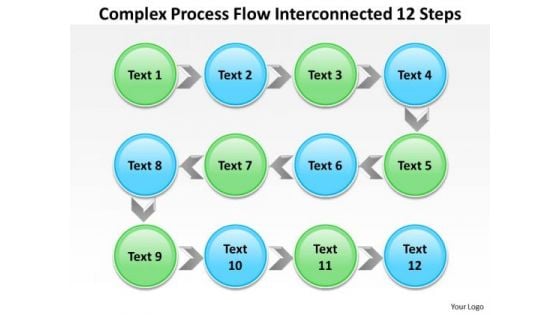
Business Process Strategy Flow Interconnected 12 Steps Ppt Development Template
We present our business process strategy flow interconnected 12 steps ppt development template.Download our Arrows PowerPoint Templates because They will bring a lot to the table. Their alluring flavours will make your audience salivate. Use our Circle Charts PowerPoint Templates because Our PowerPoint Templates and Slides will let you Clearly mark the path for others to follow. Download and present our Business PowerPoint Templates because Our PowerPoint Templates and Slides will provide you a launch platform. Give a lift off to your ideas and send them into orbit. Present our Flow Charts PowerPoint Templates because You have a driving passion to excel in your field. Our PowerPoint Templates and Slides will prove ideal vehicles for your ideas. Use our Shapes PowerPoint Templates because You can Be the puppeteer with our PowerPoint Templates and Slides as your strings. Lead your team through the steps of your script.Use these PowerPoint slides for presentations relating to Arrow, art, background, blue, business, chart, circle, clip, clipart, color, colorful, design, diagram, drop, element, flow, graph, graphic, green, grey, icon, illustration, percentage, pie, portion, primary, process, round, segmented, set, shadow, slide, stage, vector. The prominent colors used in the PowerPoint template are Green, Blue light, Gray. Achieve productivity improvement with our Business Process Strategy Flow Interconnected 12 Steps Ppt Development Template. They will make you look good.
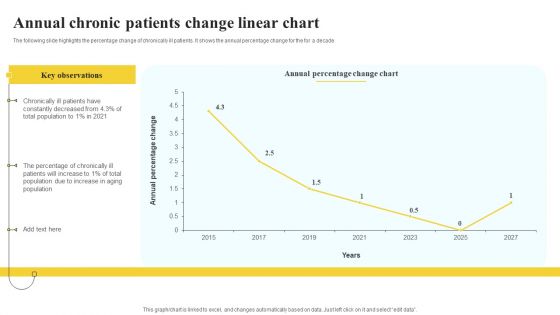
Annual Chronic Patients Change Linear Chart Demonstration PDF
The following slide highlights the percentage change of chronically ill patients. It shows the annual percentage change for the for a decade Showcasing this set of slides titled Annual Chronic Patients Change Linear Chart Demonstration PDF. The topics addressed in these templates are Key Observations, Annual Percentage, Linear Chart. All the content presented in this PPT design is completely editable. Download it and make adjustments in color, background, font etc. as per your unique business setting.

Facility Planning Management Workforce Productivity Dashboard Formats PDF
This slide showcase employees productivity driven by facility planning in organisation.it includes workforce productivity , organisation department , monthly productivity percentage and facility percentage. Showcasing this set of slides titled Facility Planning Management Workforce Productivity Dashboard Formats PDF. The topics addressed in these templates are Workforce Productivity, Work Productivity, Facility Percentage. All the content presented in this PPT design is completely editable. Download it and make adjustments in color, background, font etc. as per your unique business setting.
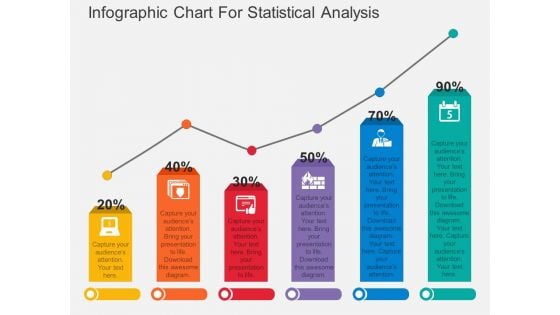
Infographic Chart For Statistical Analysis Powerpoint Template
Download this exclusive business diagram to display statistical analysis. This PowerPoint template contains bar chart with percentage values. This diagram is useful for business presentations.
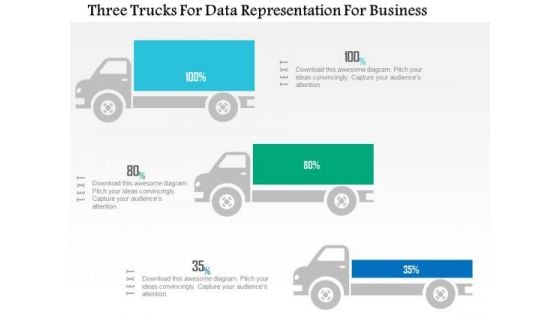
Business Diagram Three Trucks For Data Representation For Business PowerPoint Slide
This business diagram displays three trucks graphic. This diagram contains trucks for percentage value growth. Use this diagram to display business growth over a period of time.
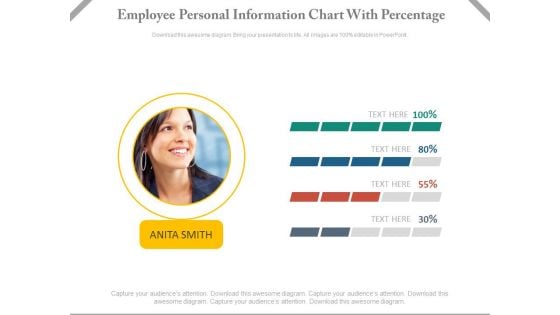
Employee Performance Information Chart Powerpoint Slides
This dashboard template contains employee picture with percentage slides. This dashboard PowerPoint template conveys employees performance in a visual manner. Download this PPT slide for quick decision-making.

Retail Trading Platform Deploy Potential Attention Grabbing Offers For Users Ideas PDF
This slide provides information regarding deployment of potential attention grabbing offers for users in terms of percentage off, buy one get one, customized promo codes, in stock availability and quick and free shipping. Presenting retail trading platform deploy potential attention grabbing offers for users ideas pdf to provide visual cues and insights. Share and navigate important information on five stages that need your due attention. This template can be used to pitch topics like percentage off, customized promo codes, stock availability, quick and free shipping. In addtion, this PPT design contains high resolution images, graphics, etc, that are easily editable and available for immediate download.

PMO Dashboard With Strategy And Delivery KPI Elements PDF
Presenting PMO Dashboard With Strategy And Delivery KPI Elements PDF to dispense important information. This template comprises three stages. It also presents valuable insights into the topics including Percentage Of Projects, Organization Objectives, Percentage Of Projects This is a completely customizable PowerPoint theme that can be put to use immediately. So, download it and address the topic impactfully.
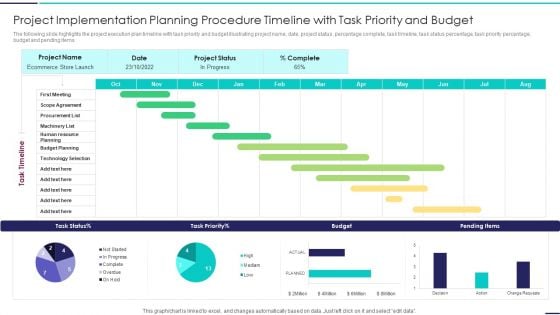
Project Implementation Planning Procedure Timeline With Task Priority And Budget Guidelines PDF
The following slide highlights the project execution plan timeline with task priority and budget illustrating project name, date, project status, percentage complete, task timeline, task status percentage, task priority percentage, budget and pending items. Showcasing this set of slides titled Project Implementation Planning Procedure Timeline With Task Priority And Budget Guidelines PDF. The topics addressed in these templates are Project Implementation Planning Procedure Timeline With Task Priority And Budget. All the content presented in this PPT design is completely editable. Download it and make adjustments in color, background, font etc. as per your unique business setting.
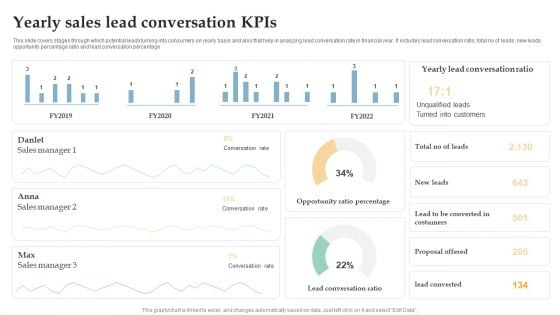
Yearly Sales Lead Conversation Kpis Ppt Inspiration Brochure PDF
This slide covers stages through which potential leads turning into consumers on yearly basis and also that help in analyzing lead conversation rate in financial year. It includes lead conversation ratio, total no of leads, new leads opportunity percentage ratio and lead conversation percentage. Pitch your topic with ease and precision using this Yearly Sales Lead Conversation Kpis Ppt Inspiration Brochure PDF. This layout presents information on Sales Manager, Conversation Rate, Opportunity Ratio Percentage. It is also available for immediate download and adjustment. So, changes can be made in the color, design, graphics or any other component to create a unique layout.
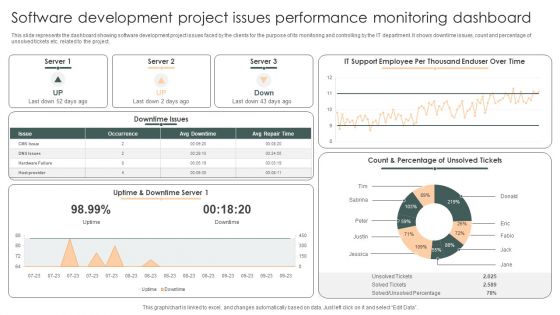
Software Development Project Issues Performance Monitoring Dashboard Structure PDF
This slide represents the dashboard showing software development project issues faced by the clients for the purpose of its monitoring and controlling by the IT department. It shows downtime issues, count and percentage of unsolved tickets etc. related to the project.Showcasing this set of slides titled Software Development Project Issues Performance Monitoring Dashboard Structure PDF. The topics addressed in these templates are Downtime Issues, Count Percentage, Unsolved Percentage. All the content presented in this PPT design is completely editable. Download it and make adjustments in color, background, font etc. as per your unique business setting.
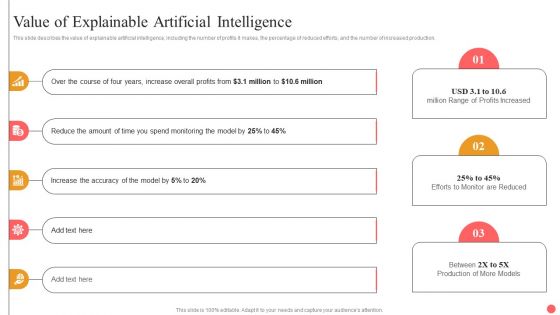
Explainable Machine Learning Value Of Explainable Artificial Intelligence Ideas PDF
This slide describes the value of explainable artificial intelligence, including the number of profits it makes, the percentage of reduced efforts, and the number of increased production. The best PPT templates are a great way to save time, energy, and resources. Slidegeeks have 100 percent editable powerpoint slides making them incredibly versatile. With these quality presentation templates, you can create a captivating and memorable presentation by combining visually appealing slides and effectively communicating your message. Download Explainable Machine Learning Value Of Explainable Artificial Intelligence Ideas PDF from Slidegeeks and deliver a wonderful presentation.
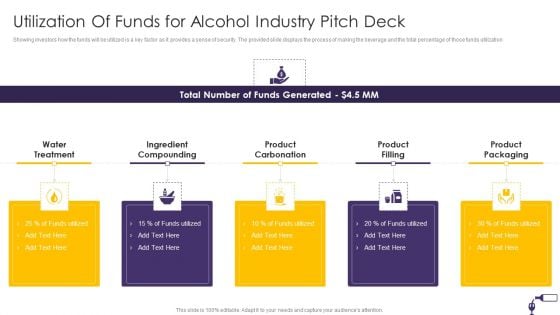
Utilization Of Funds For Alcohol Industry Pitch Deck Ppt Pictures Example File PDF
Showing investors how the funds will be utilized is a key factor as it provides a sense of security. The provided slide displays the process of making the beverage and the total percentage of those funds utilization. Presenting Utilization Of Funds For Alcohol Industry Pitch Deck Ppt Pictures Example File PDF to provide visual cues and insights. Share and navigate important information on five stages that need your due attention. This template can be used to pitch topics like Water Treatment, Ingredient Compounding, Product Carbonation, Product Filling, Product Packaging. In addtion, this PPT design contains high resolution images, graphics, etc, that are easily editable and available for immediate download.
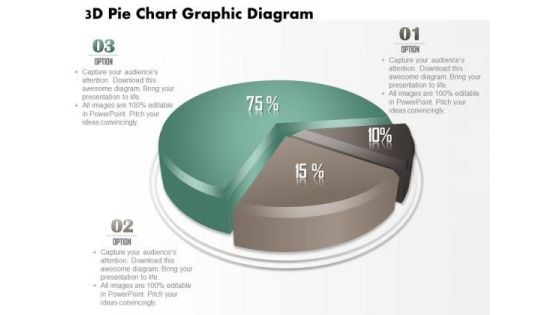
Business Diagram 3d Pie Chart Graphic Diagram PowerPoint Ppt Presentation
This business diagram displays 3d pie chart. It contains pie chart with percentage ratios. This pie chart is a visual way of displaying data. Use this diagram to make outstanding presentations.
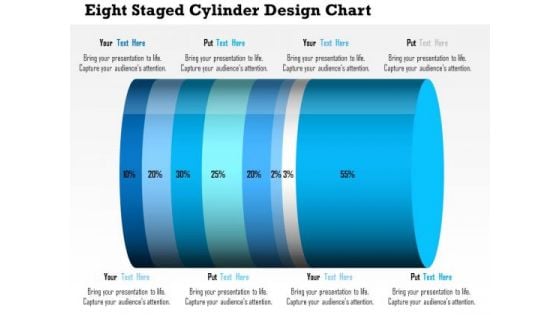
Business Daigram Eight Staged Cylinder Design Chart Presentation Templets
This business diagram contains eight staged cylinder design chart with percentage ratio. Download this diagram to display financial analysis. Use this diagram to make business and marketing related presentations.
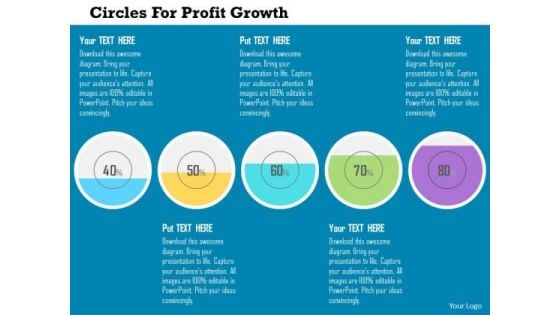
Business Diagram Circles For Profit Growth Presentation Template
This diagram displays four text circles for profit growth. This business diagram has been designed with graphic of circles with percentage ratios. Use this diagram to depict business planning process in your presentations.
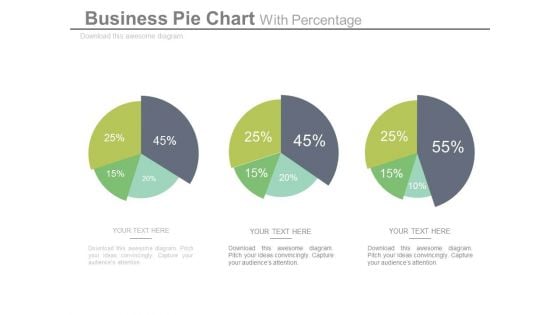
Pie Charts For Relative Comparison Study Powerpoint Slides
This power point template illustrates diagram of three pie charts with percentage values. This business slide can be used for relative comparison study. Present your views and ideas with this impressive slide.

Skill Assessment Chart For Employee Performance Powerpoint Slides
Sliders with percentage values have been displayed in this business slide. This business diagram may be used as skill assessment chart. Download this PowerPoint template to build an exclusive presentation.
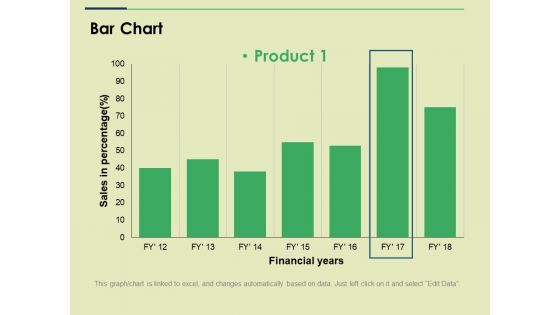
Bar Chart Ppt PowerPoint Presentation File Slide
This is a bar chart ppt powerpoint presentation file slide. This is a one stage process. The stages in this process are sales in percentage financial years, business, marketing, strategy, graph.
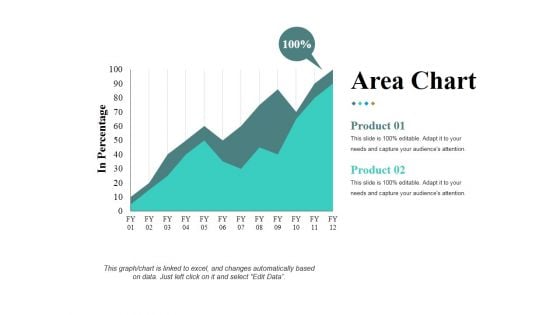
Area Chart Ppt PowerPoint Presentation Infographic Template Samples
This is a area chart ppt powerpoint presentation infographic template samples. This is a two stage process. The stages in this process are in percentage product, business, marketing, growth.
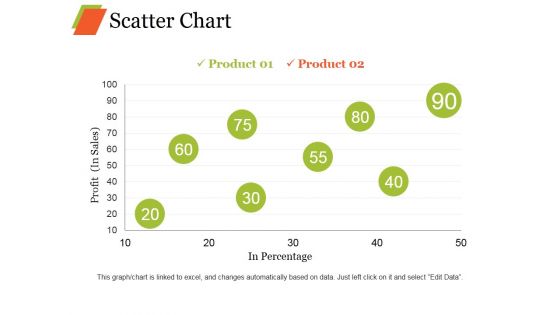
Scatter Chart Ppt PowerPoint Presentation Professional Graphic Images
This is a scatter chart ppt powerpoint presentation professional graphic images. This is a eight stage process. The stages in this process are product, profit, in percentage growth, business.
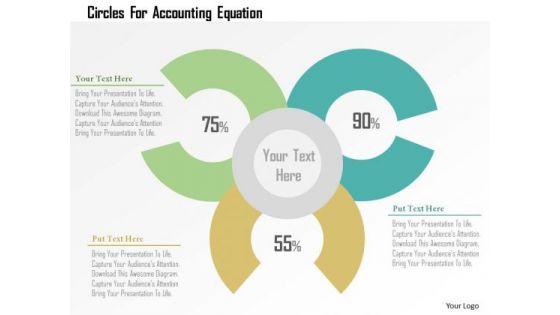
Business Diagram Circles For Accounting Equation PowerPoint Templates
Graphic of Venn diagram with percentage value has been used to design this business diagram. These circles may also be used to depict accounting equations. Use this diagram to illustrate your thoughts and experiences to your staff.
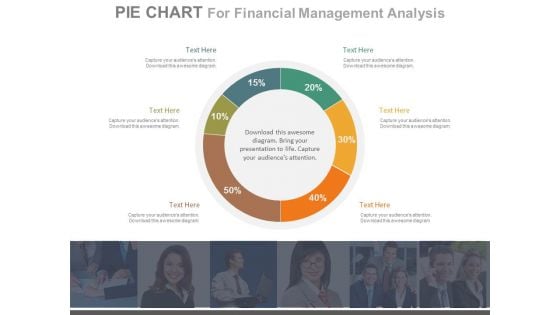
Pie Chart For Customer Analysis Powerpoint Slides
This PowerPoint template has been designed with percentage ratio pie chart. This PPT slide can be used to display customer analysis. You can download finance PowerPoint template to prepare awesome presentations.
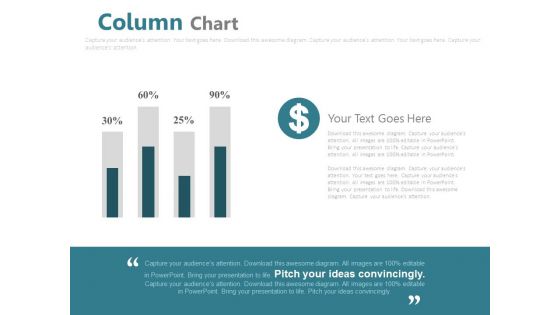
Column Chart For Financial Analysis Powerpoint Slides
This PowerPoint template has been designed with graphics of column chart with percentage values. You may use this business slide design for topics like financial analysis and planning. This PPT slide is powerful tool to describe your ideas.
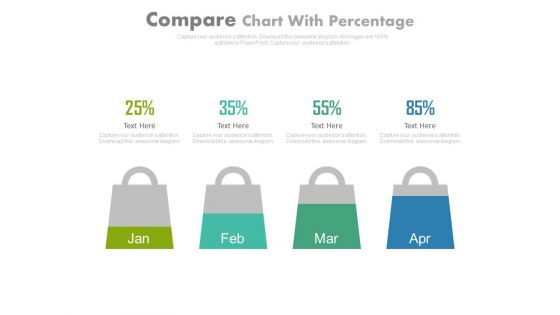
Four Months Sales Statistics Chart Powerpoint Slides
This PowerPoint template has been designed with four shopping bags with percentage values. Download this PPT slide to display four months sales statistics. Add this slide to your presentation and impress your superiors.

Three Text Tags Compare Chart Powerpoint Slides
This PowerPoint template has been designed with text tags and percentage data. You may download this PPT slide to display data comparison and analysis. Add this slide to your presentation and impress your superiors.

Business Diagram Business Bar Graph For Data Analysis Presentation Template
This business slide displays pie charts with percentage ratios. This diagram is a data visualization tool that gives you a simple way to present statistical information. This slide helps your audience examines and interprets the data you present.
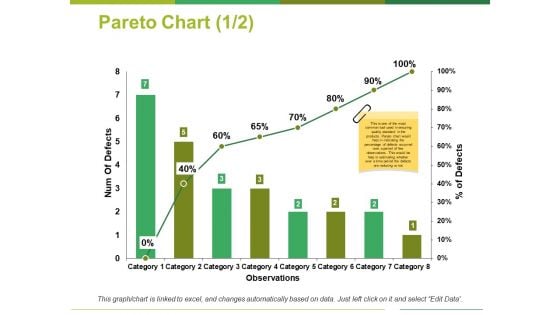
Pareto Chart Template 1 Ppt PowerPoint Presentation Outline Show
This is a pareto chart template 1 ppt powerpoint presentation outline show. This is a eight stage process. The stages in this process are num of defects, percentage of defects, observations, category.
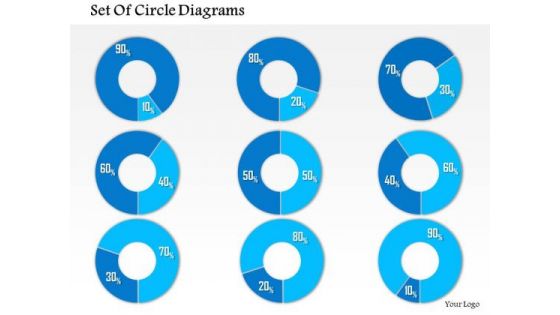
Business Framework 10 Percent To 90 Percent PowerPoint Presentation
This business diagram has been designed with graphic of multiple pie graphs. This diagram slide contains the concept of result analysis with percentage values. Use this diagram to present and compare data in an impressive manner
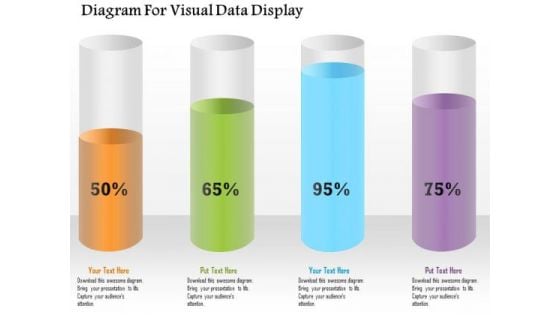
Business Diagram Diagram For Visual Data Display Presentation Template
Four colored cylindrical bars with percentage values are used to design this power point template. This diagram slide helps to display financial data analysis. Use this diagram for your business and finance related presentations.
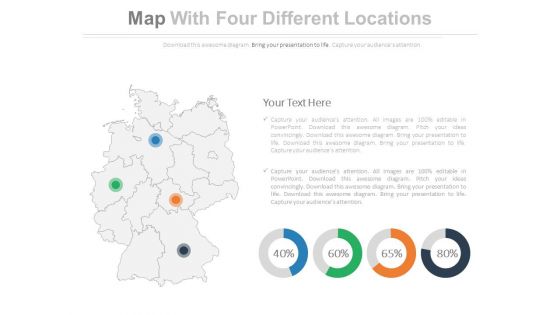
Map Diagram With Four Locations Powerpoint Slides
This PowerPoint template displays graphics of map diagram with four locations and percentage values. This Map template can be used in business presentations to depict economic analysis. This slide can also be used by school students for educational projects.
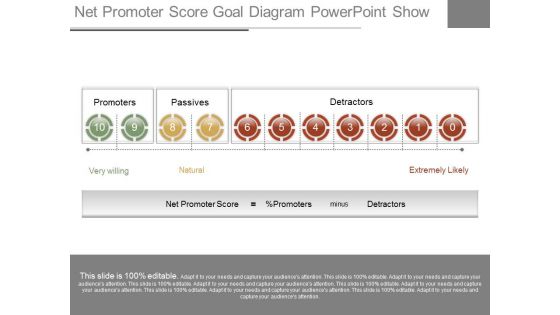
Net Promoter Score Goal Diagram Powerpoint Show
This is a net promoter score goal diagram powerpoint show. This is a ten stage process. The stages in this process are promoters, passives, detractors, very willing, natural, extremely likely, net promoter score, percentage promoters, minus.
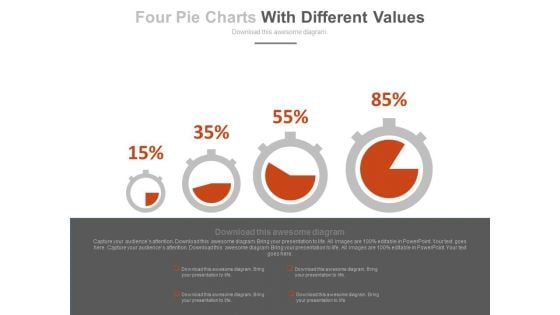
Dashboard With Increasing Values Powerpoint Slides
This innovative, stunningly beautiful dashboard has been designed for data visualization. It contains pie charts with increasing percentage values. This PowerPoint template helps to display your information in a useful, simple and uncluttered way.
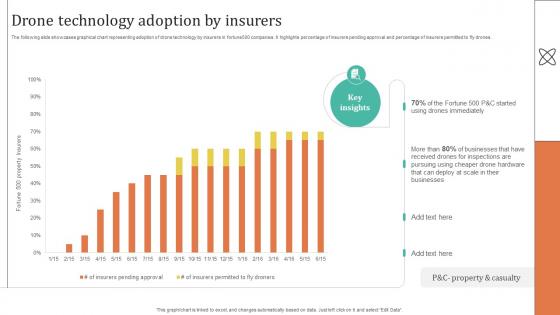
Improving Customer Satisfaction Drone Technology Adoption By Insurers
The following slide showcases graphical chart representing adoption of drone technology by insurers in fortune500 companies. It highlights percentage of insurers pending approval and percentage of insurers permitted to fly drones. Coming up with a presentation necessitates that the majority of the effort goes into the content and the message you intend to convey. The visuals of a PowerPoint presentation can only be effective if it supplements and supports the story that is being told. Keeping this in mind our experts created Improving Customer Satisfaction Drone Technology Adoption By Insurers to reduce the time that goes into designing the presentation. This way, you can concentrate on the message while our designers take care of providing you with the right template for the situation. The following slide showcases graphical chart representing adoption of drone technology by insurers in fortune500 companies. It highlights percentage of insurers pending approval and percentage of insurers permitted to fly drones.
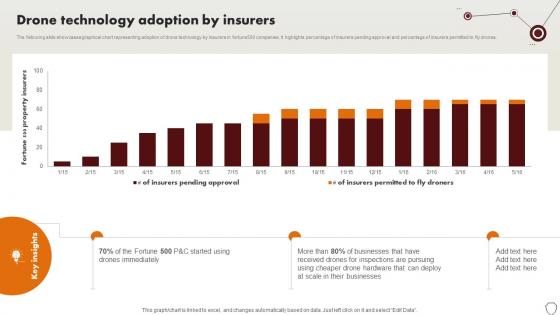
Technology Trends In Online Insurance Drone Technology Adoption By Insurers
The following slide showcases graphical chart representing adoption of drone technology by insurers in fortune500 companies. It highlights percentage of insurers pending approval and percentage of insurers permitted to fly drones. Welcome to our selection of the Technology Trends In Online Insurance Drone Technology Adoption By Insurers. These are designed to help you showcase your creativity and bring your sphere to life. Planning and Innovation are essential for any business that is just starting out. This collection contains the designs that you need for your everyday presentations. All of our PowerPoints are 100Percent editable, so you can customize them to suit your needs. This multi-purpose template can be used in various situations. Grab these presentation templates today. The following slide showcases graphical chart representing adoption of drone technology by insurers in fortune500 companies. It highlights percentage of insurers pending approval and percentage of insurers permitted to fly drones.
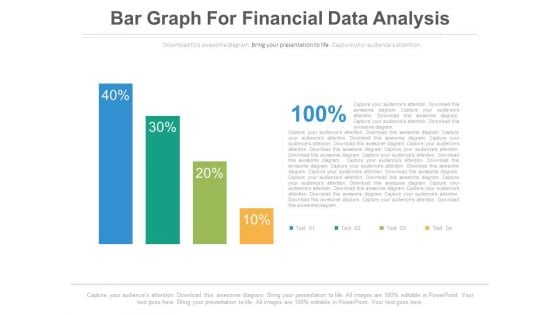
Bar Graph For Profit Growth Analysis Powerpoint Slides
This PowerPoint template has been designed with bar graph with percentage values. This diagram is useful to exhibit profit growth analysis. This diagram slide can be used to make impressive presentations.
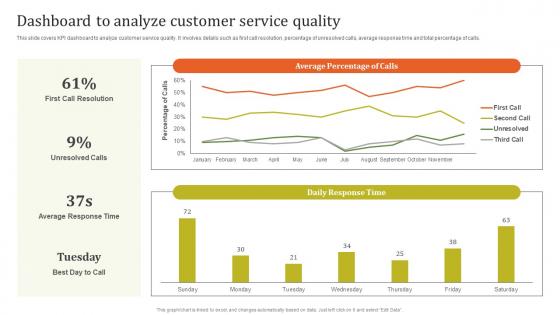
Dashboard To Analyze Customer Executing Effective Quality Enhancement Mockup Pdf
This slide covers KPI dashboard to analyze customer service quality. It involves details such as first call resolution, percentage of unresolved calls, average response time and total percentage of calls. From laying roadmaps to briefing everything in detail, our templates are perfect for you. You can set the stage with your presentation slides. All you have to do is download these easy to edit and customizable templates. Dashboard To Analyze Customer Executing Effective Quality Enhancement Mockup Pdf will help you deliver an outstanding performance that everyone would remember and praise you for. Do download this presentation today. This slide covers KPI dashboard to analyze customer service quality. It involves details such as first call resolution, percentage of unresolved calls, average response time and total percentage of calls.
Leveraging Logistics Automation Dashboard For Tracking Impact Of Procurement Ideas Pdf
This slide covers the dashboard for analysing procurement performance after automation. It include KPIs such as on time delivery, percentage of returns, compliance index percentage, procurement ROI, cost saving, budget spent on training, etc. Slidegeeks is here to make your presentations a breeze with Leveraging Logistics Automation Dashboard For Tracking Impact Of Procurement Ideas Pdf With our easy to use and customizable templates, you can focus on delivering your ideas rather than worrying about formatting. With a variety of designs to choose from, you are sure to find one that suits your needs. And with animations and unique photos, illustrations, and fonts, you can make your presentation pop. So whether you are giving a sales pitch or presenting to the board, make sure to check out Slidegeeks first. This slide covers the dashboard for analysing procurement performance after automation. It include KPIs such as on time delivery, percentage of returns, compliance index percentage, procurement ROI, cost saving, budget spent on training, etc.

 Home
Home