Percentage Progress
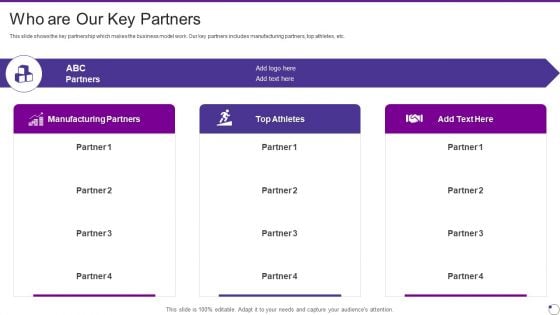
Footwear And Accessories Business Pitch Deck Who Are Our Key Partners Guidelines PDF
This slide shows the key partnership which makes the business model work. Our key partners includes manufacturing partners, top athletes, etc. Presenting footwear and accessories business pitch deck who are our key partners guidelines pdf to provide visual cues and insights. Share and navigate important information on three stages that need your due attention. This template can be used to pitch topics like year on year market growth in percentage. In addtion, this PPT design contains high resolution images, graphics, etc, that are easily editable and available for immediate download.
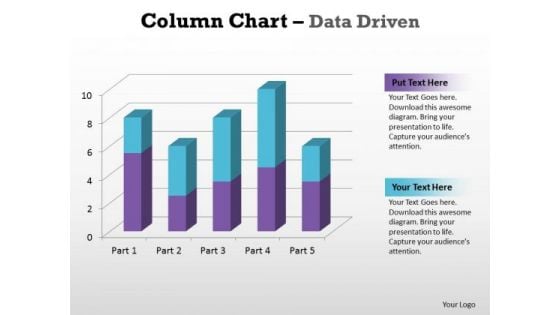
Business Graphic PowerPoint Templates Business Column Chart Data Driven Ppt Slides
Business Graphic PowerPoint Templates Business column chart data driven PPT Slides-With help of visual aids like this template you can capture the attention of the audience and make the presentation very interactive and lively.-Business Graphic PowerPoint Templates Business column chart data driven PPT Slides-This ppt can be used for concepts relating to-chart,, graph, growth, investment, , market, percentage, , presentation report, results, statistics, stock, success and business. Attain stardom with our Business Graphic PowerPoint Templates Business Column Chart Data Driven Ppt Slides. You will come out on top.
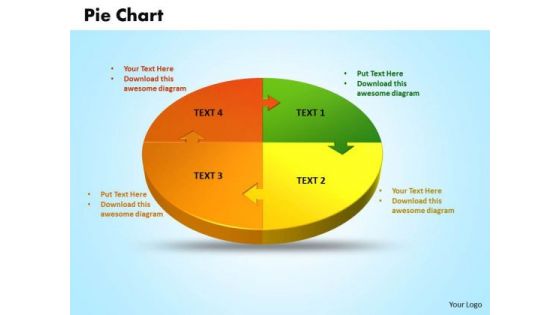
Business Editable PowerPoint Templates Business 3d Jigsaw Circular Pie Chart Ppt Slides
Business Chart PowerPoint Templates Business 3d jigsaw circular pie chart PPT Slides-PowerPoint Template shows Pie Chart with four sectors \\ Part of a series. -Business Chart PowerPoint Templates Business 3d jigsaw circular pie chart PPT Slides-This ppt can be used for concepts relating to-chart, circular, graph, growth, investment, isolated, market, numbers, percentage, pie, piece, plan, presentation, render, report, results, slice, statistics, stock, success and business. Our Business Editable PowerPoint Templates Business 3d Jigsaw Circular Pie Chart Ppt Slides ensure approval. Your ideas will fit the bill.
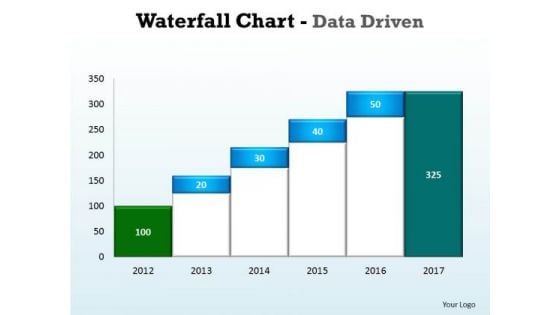
Business Graphic PowerPoint Templates Business Waterfall Chart Data Driven Ppt Slides
Business Graphic PowerPoint Templates Business waterfall chart data driven PPT Slides- This Water Fall chart can display continuous data over time, set against a common scale, and are therefore ideal for showing trends in data at equal intervals-This ppt can be used for concepts relating to-chart,, graph, growth, investment, , market, percentage, , presentation report, results, statistics, stock, success and business. Expose your team to a brave new world. Challenge preset boundaries with our Business Graphic PowerPoint Templates Business Waterfall Chart Data Driven Ppt Slides.
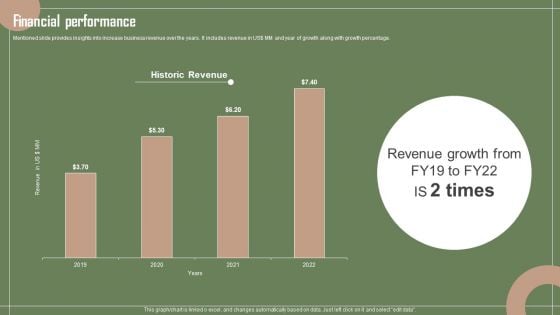
Data Automation Solution Investor Funding Presentation Financial Performance Introduction PDF
Mentioned slide provides insights into increase business revenue over the years. It includes revenue in USdoller MM and year of growth along with growth percentage. From laying roadmaps to briefing everything in detail, our templates are perfect for you. You can set the stage with your presentation slides. All you have to do is download these easy to edit and customizable templates. Data Automation Solution Investor Funding Presentation Financial Performance Introduction PDF will help you deliver an outstanding performance that everyone would remember and praise you for. Do download this presentation today.
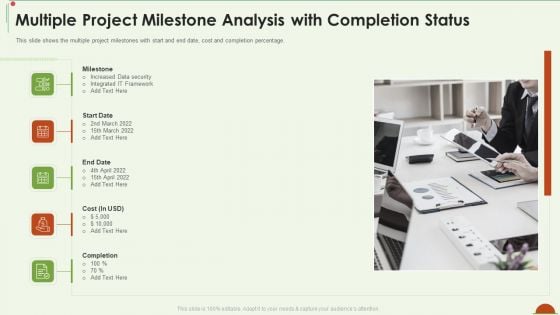
Project Management Under Supervision Multiple Project Milestone Analysis With Completion Status Clipart PDF
This slide shows the multiple project milestones with start and end date, cost and completion percentage. Presenting project management under supervision multiple project milestone analysis with completion status clipart pdf to provide visual cues and insights. Share and navigate important information on five stages that need your due attention. This template can be used to pitch topics like milestone, start date, end date, cost, completion. In addtion, this PPT design contains high resolution images, graphics, etc, that are easily editable and available for immediate download.
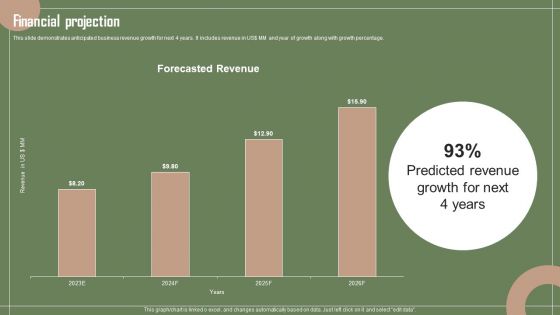
Data Automation Solution Investor Funding Presentation Financial Projection Structure PDF
This slide demonstrates anticipated business revenue growth for next 4 years. It includes revenue in USdoller MM and year of growth along with growth percentage. Present like a pro with Data Automation Solution Investor Funding Presentation Financial Projection Structure PDF Create beautiful presentations together with your team, using our easy to use presentation slides. Share your ideas in real time and make changes on the fly by downloading our templates. So whether you are in the office, on the go, or in a remote location, you can stay in sync with your team and present your ideas with confidence. With Slidegeeks presentation got a whole lot easier. Grab these presentations today.
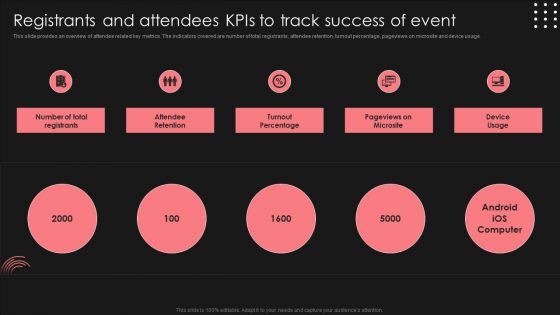
Positive Impact Of Effective Registrants And Attendees Kpis To Track Success Of Event Structure PDF
This slide provides an overview of attendee related key metrics. The indicators covered are number of total registrants, attendee retention, turnout percentage, pageviews on microsite and device usage. The best PPT templates are a great way to save time, energy, and resources. Slidegeeks have 100 percent editable powerpoint slides making them incredibly versatile. With these quality presentation templates, you can create a captivating and memorable presentation by combining visually appealing slides and effectively communicating your message. Download Positive Impact Of Effective Registrants And Attendees Kpis To Track Success Of Event Structure PDF from Slidegeeks and deliver a wonderful presentation.
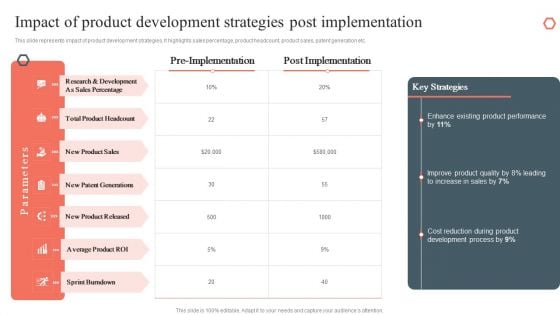
Impact Of Product Development Strategies Post Implementation Product Development Diagrams PDF
This slide represents impact of product development strategies. It highlights sales percentage, product headcount, product sales, patent generation etc.Do you know about Slidesgeeks Impact Of Product Development Strategies Post Implementation Product Development Diagrams PDF These are perfect for delivering any kind od presentation. Using it, create PowerPoint presentations that communicate your ideas and engage audiences. Save time and effort by using our pre-designed presentation templates that are perfect for a wide range of topic. Our vast selection of designs covers a range of styles, from creative to business, and are all highly customizable and easy to edit. Download as a PowerPoint template or use them as Google Slides themes.
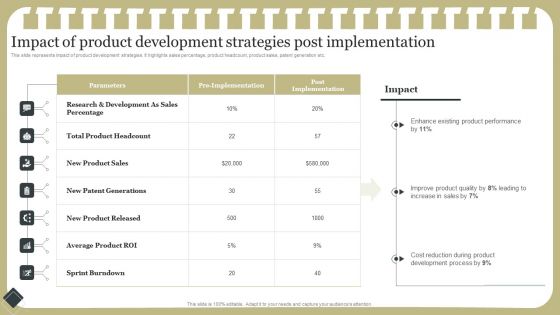
Effective Product Development Strategy Impact Of Product Development Strategies Post Implementation Infographics PDF
This slide represents impact of product development strategies. It highlights sales percentage, product headcount, product sales, patent generation etc.Slidegeeks is here to make your presentations a breeze with Effective Product Development Strategy Impact Of Product Development Strategies Post Implementation Infographics PDF With our easy-to-use and customizable templates, you can focus on delivering your ideas rather than worrying about formatting. With a variety of designs to choose from, you are sure to find one that suits your needs. And with animations and unique photos, illustrations, and fonts, you can make your presentation pop. So whether you are giving a sales pitch or presenting to the board, make sure to check out Slidegeeks first.
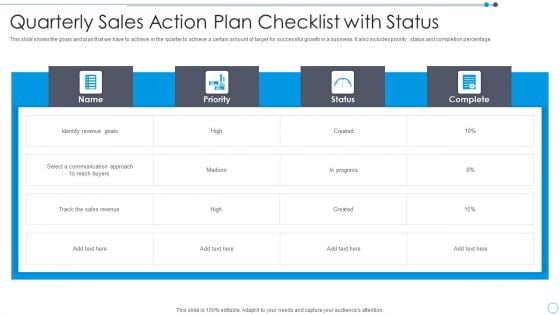
Quarterly Sales Action Plan Checklist With Status Guidelines PDF
This slide shows the goals and plan that we have to achieve in the quarter to achieve a certain amount of target for successful growth in a business. It also includes priority , status and completion percentage.Showcasing this set of slides titled Quarterly Sales Action Plan Checklist With Status Guidelines PDF. The topics addressed in these templates are Communication, Goals, Revenue. All the content presented in this PPT design is completely editable. Download it and make adjustments in color, background, font etc. as per your unique business setting.
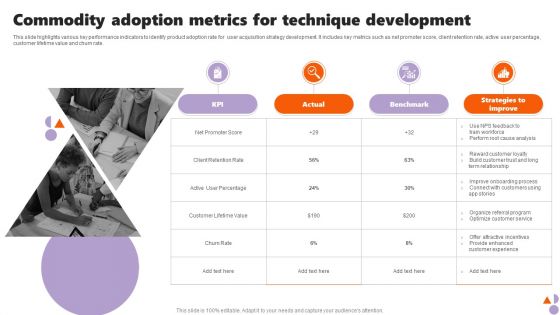
Commodity Adoption Metrics For Technique Development Microsoft PDF
This slide highlights various key performance indicators to identify product adoption rate for user acquisition strategy development. It includes key metrics such as net promoter score, client retention rate, active user percentage, customer lifetime value and churn rate. Presenting Commodity Adoption Metrics For Technique Development Microsoft PDF to dispense important information. This template comprises four stages. It also presents valuable insights into the topics including Build Customer, Onboarding Process, Analysis. This is a completely customizable PowerPoint theme that can be put to use immediately. So, download it and address the topic impactfully.
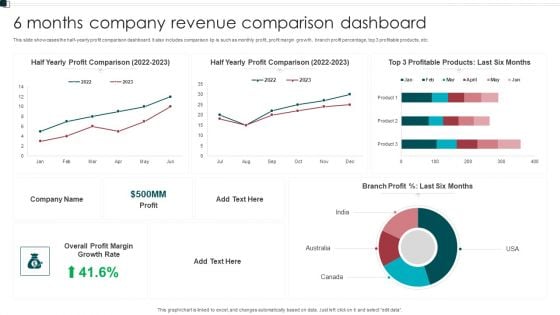
6 Months Company Revenue Comparison Dashboard Graphics PDF
This slide showcases the half yearly profit comparison dashboard. It also includes comparison kp is such as monthly profit, profit margin growth, branch profit percentage, top 3 profitable products, etc. Showcasing this set of slides titled 6 Months Company Revenue Comparison Dashboard Graphics PDF. The topics addressed in these templates are Growth Rate, Overall Profit Margin, Branch Profit. All the content presented in this PPT design is completely editable. Download it and make adjustments in color, background, font etc. as per your unique business setting.
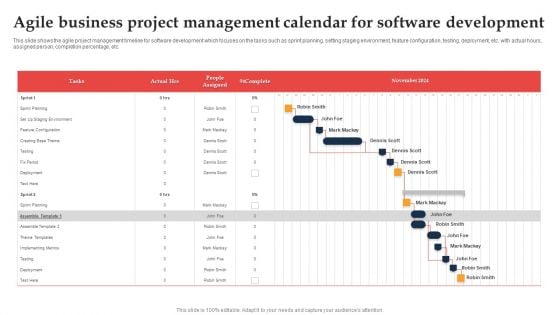
Agile Business Project Management Calendar For Software Development Ppt Portfolio Clipart Images PDF
This slide shows the agile project management timeline for software development which focuses on the tasks such as sprint planning, setting staging environment, feature configuration, testing, deployment, etc. with actual hours, assigned person, completion percentage, etc. Showcasing this set of slides titled Agile Business Project Management Calendar For Software Development Ppt Portfolio Clipart Images PDF. The topics addressed in these templates are Sprint Planning, Feature Configuration, Deployment. All the content presented in this PPT design is completely editable. Download it and make adjustments in color, background, font etc. as per your unique business setting.
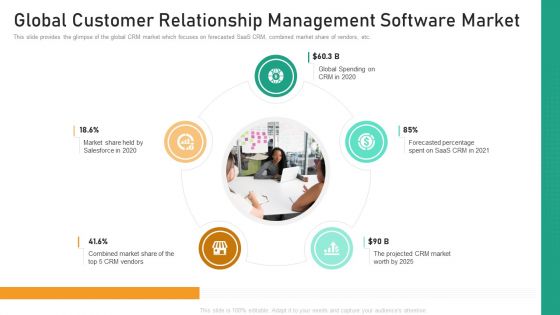
Global Customer Relationship Management Software Market Information PDF
This slide provides the glimpse of the global CRM market which focuses on forecasted SaaS CRM, combined market share of vendors, etc.This is a global customer relationship management software market information pdf template with various stages. Focus and dispense information on five stages using this creative set, that comes with editable features. It contains large content boxes to add your information on topics like combined market, forecasted percentage, global spending. You can also showcase facts, figures, and other relevant content using this PPT layout. Grab it now.
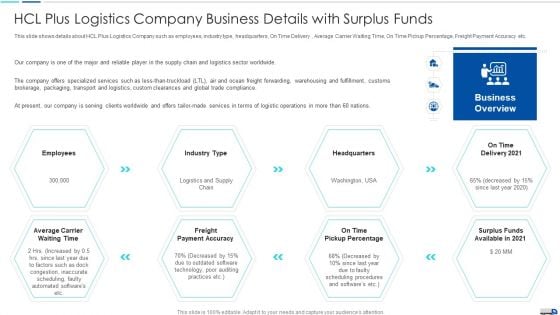
Initiatives To Produce Effective Concept For Logistic Firm HCL Plus Logistics Company Business Professional PDF
This slide shows details about HCL Plus Logistics Company such as employees, industry type, headquarters, On Time Delivery , Average Carrier Waiting Time, On Time Pickup Percentage, Freight Payment Accuracy etc. Presenting initiatives to produce effective concept for logistic firm hcl plus logistics company business professional pdf to provide visual cues and insights. Share and navigate important information on eight stages that need your due attention. This template can be used to pitch topics like services, warehousing, global, services. In addtion, this PPT design contains high resolution images, graphics, etc, that are easily editable and available for immediate download.

Smart Phone Launch Event Management Tasks Registrants And Attendees Kpis To Track Sample PDF
This slide provides an overview of attendee related key metrics. The indicators covered are number of total registrants, attendee retention, turnout percentage, pageviews on microsite and device usage. The Smart Phone Launch Event Management Tasks Registrants And Attendees Kpis To Track Sample PDF is a compilation of the most recent design trends as a series of slides. It is suitable for any subject or industry presentation, containing attractive visuals and photo spots for businesses to clearly express their messages. This template contains a variety of slides for the user to input data, such as structures to contrast two elements, bullet points, and slides for written information. Slidegeeks is prepared to create an impression.
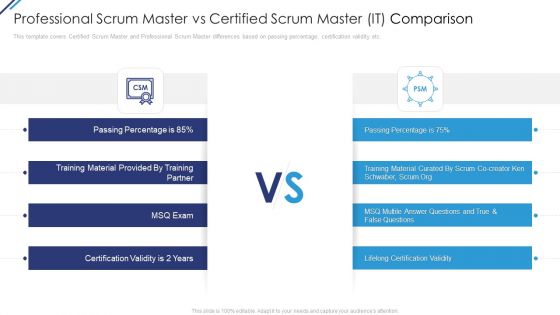
Professional Scrum Master Vs Certified Scrum Master IT Comparison Ppt Gallery Slide Download PDF
This template covers Certified Scrum Master and Professional Scrum Master differences based on passing percentage, certification validity etc. Presenting professional scrum master vs certified scrum master it comparison ppt gallery slide download pdf to provide visual cues and insights. Share and navigate important information on two stages that need your due attention. This template can be used to pitch topics like professional scrum master vs certified scrum master it comparison. In addtion, this PPT design contains high resolution images, graphics, etc, that are easily editable and available for immediate download.
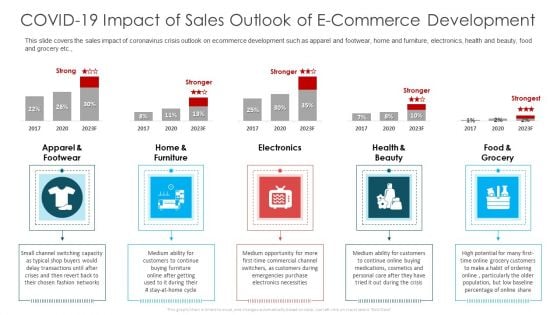
COVID 19 Impact Of Sales Outlook Of E Commerce Development Ppt Portfolio Samples PDF
This slide covers the sales impact of coronavirus crisis outlook on ecommerce development such as apparel and footwear, home and furniture, electronics, health and beauty, food and grocery etc. Presenting covid 19 impact of sales outlook of e commerce development ppt portfolio samples pdf to provide visual cues and insights. Share and navigate important information on four stages that need your due attention. This template can be used to pitch topics like capacity, customers during, baseline percentage. In addition, this PPT design contains high-resolution images, graphics, etc, that are easily editable and available for immediate download.
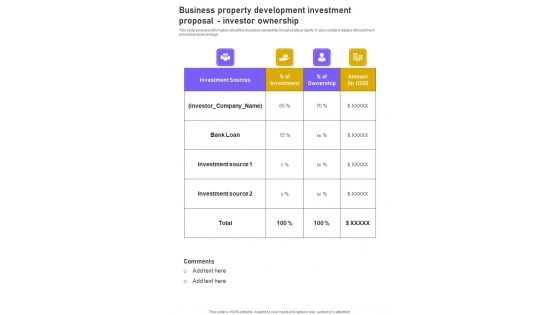
Business Property Development Investment Proposal Investor Ownership One Pager Sample Example Document
This slide provides information about the investors ownership in real estate property. It also contains details of investment amount and percentage. Presenting you an exemplary Business Property Development Investment Proposal Investor Ownership One Pager Sample Example Document. Our one-pager comprises all the must-have essentials of an inclusive document. You can edit it with ease, as its layout is completely editable. With such freedom, you can tweak its design and other elements to your requirements. Download this Business Property Development Investment Proposal Investor Ownership One Pager Sample Example Document brilliant piece now.
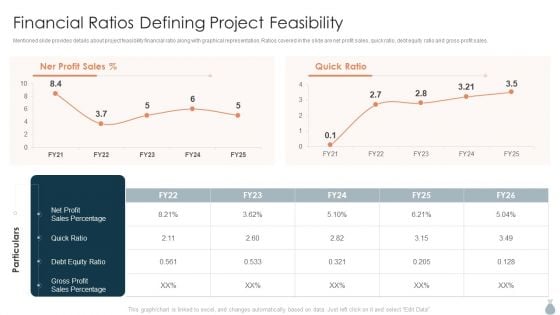
Real Estate Development Project Financing Financial Ratios Defining Project Feasibility Themes PDF
Mentioned slide provides details about project feasibility financial ratio along with graphical representation. Ratios covered in the slide are net profit sales, quick ratio, debt equity ratio and gross profit sales.Deliver and pitch your topic in the best possible manner with this Real Estate Development Project Financing Financial Ratios Defining Project Feasibility Themes PDF. Use them to share invaluable insights on Debt Equity, Sales Percentage, Gross Profit and impress your audience. This template can be altered and modified as per your expectations. So, grab it now.
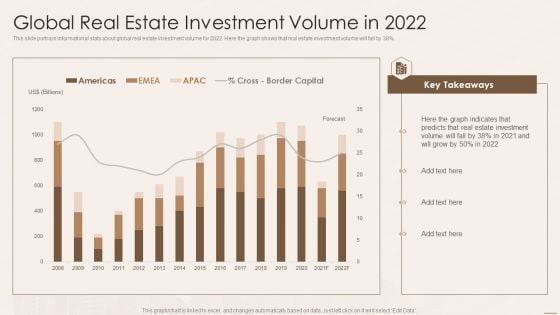
Real Estate Developers Funding Alternatives Global Real Estate Investment Volume In 2022 Brochure PDF
This slide portrays informational stats about global real estate investment volume for 2022. Here the graph shows that real estate investment volume will fall by 38 percentage. Deliver and pitch your topic in the best possible manner with this Real Estate Developers Funding Alternatives Global Real Estate Investment Volume In 2022 Brochure PDF. Use them to share invaluable insights on Real Estate Investment, Border Capital and impress your audience. This template can be altered and modified as per your expectations. So, grab it now.
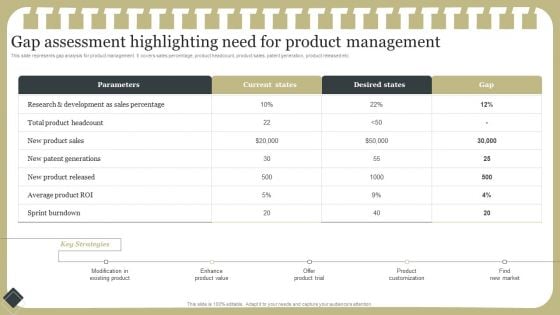
Effective Product Development Strategy Gap Assessment Highlighting Need For Product Management Guidelines PDF
This slide represents gap analysis for product management. It covers sales percentage, product headcount, product sales, patent generation, product released etc.From laying roadmaps to briefing everything in detail, our templates are perfect for you. You can set the stage with your presentation slides. All you have to do is download these easy-to-edit and customizable templates. Effective Product Development Strategy Gap Assessment Highlighting Need For Product Management Guidelines PDF will help you deliver an outstanding performance that everyone would remember and praise you for. Do download this presentation today.
Email Marketing Dashboard Illustrating Campaign Performance Results Ppt PowerPoint Presentation File Icon PDF
Mentioned slide displays email campaign dashboard which can be used by marketers to track performance of their marketing campaigns. Marketers can track metrics such as total subscribers growth, overall bounce rate, unsubscribe rate, open rate, click rate etc. Showcasing this set of slides titled email marketing dashboard illustrating campaign performance results ppt powerpoint presentation file icon pdf. The topics addressed in these templates are marketing, list health, total subscribers, percentage. All the content presented in this PPT design is completely editable. Download it and make adjustments in color, background, font etc. as per your unique business setting.
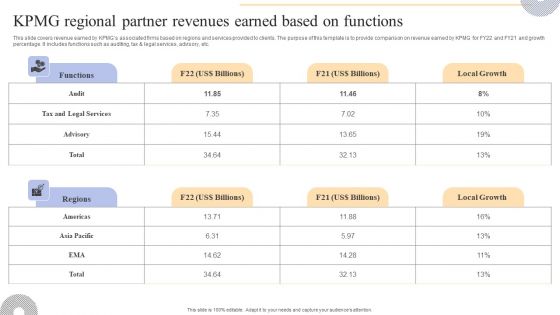
KPMG Regional Partner Revenues Earned Based On Functions Professional PDF
This slide covers revenue earned by KPMGs associated firms based on regions and services provided to clients. The purpose of this template is to provide comparison on revenue earned by KPMG for FY22 and FY21 and growth percentage. It includes functions such as auditing, tax and legal services, advisory, etc. Make sure to capture your audiences attention in your business displays with our gratis customizable KPMG Regional Partner Revenues Earned Based On Functions Professional PDF. These are great for business strategies, office conferences, capital raising or task suggestions. If you desire to acquire more customers for your tech business and ensure they stay satisfied, create your own sales presentation with these plain slides.
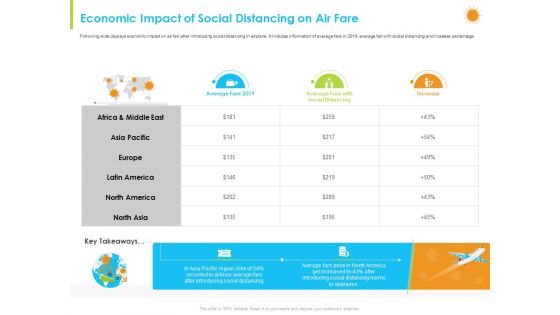
How Aviation Industry Coping With COVID 19 Pandemic Economic Impact Of Social Distancing On Air Fare Mockup PDF
Following slide displays economic impact on air fair after introducing social distancing in airplane. It includes information of average fare in 2019, average fair with social distancing and increase percentage.Deliver and pitch your topic in the best possible manner with this how aviation industry coping with COVID 19 pandemic economic impact of social distancing on air fare mockup pdf. Use them to share invaluable insights on average fare 2019, average fare with social distancing, increase and impress your audience. This template can be altered and modified as per your expectations. So, grab it now.
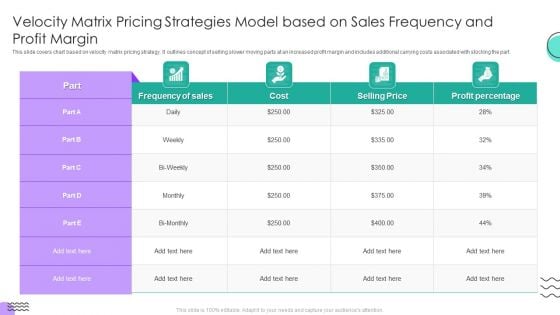
Velocity Matrix Pricing Strategies Model Based On Sales Frequency And Profit Margin Rules PDF
This slide covers chart based on velocity matrix pricing strategy. It outlines concept of selling slower moving parts at an increased profit margin and includes additional carrying costs associated with stocking the part.Pitch your topic with ease and precision using this Velocity Matrix Pricing Strategies Model Based On Sales Frequency And Profit Margin Rules PDF. This layout presents information on Frequency Sales, Selling Price, Profit Percentage. It is also available for immediate download and adjustment. So, changes can be made in the color, design, graphics or any other component to create a unique layout.
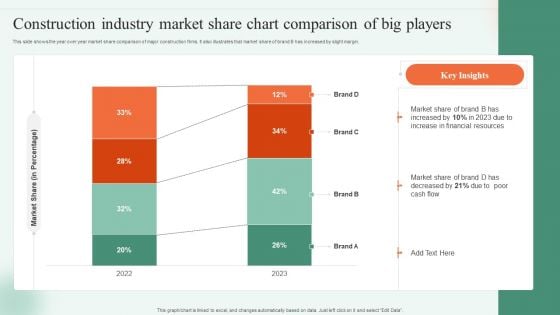
Construction Industry Market Share Chart Comparison Of Big Players Ppt Portfolio Shapes PDF
This slide shows the year over year market share comparison of major construction firms. It also illustrates that market share of brand B has increased by slight margin. Pitch your topic with ease and precision using this Construction Industry Market Share Chart Comparison Of Big Players Ppt Portfolio Shapes PDF. This layout presents information on Market Share Percentage, 2022 To 2023, Market Share. It is also available for immediate download and adjustment. So, changes can be made in the color, design, graphics or any other component to create a unique layout.
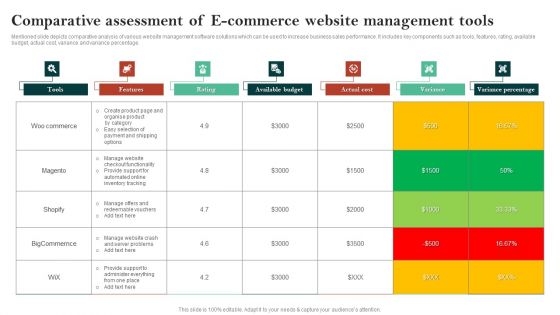
Comparative Assessment Of E Commerce Website Management Tools Themes PDF
Mentioned slide depicts comparative analysis of various website management software solutions which can be used to increase business sales performance. It includes key components such as tools, features, rating, available budget, actual cost, variance and variance percentage. Pitch your topic with ease and precision using this Comparative Assessment Of E Commerce Website Management Tools Themes PDF. This layout presents information on Rating, Available Budget, Actual Cost, Variance. It is also available for immediate download and adjustment. So, changes can be made in the color, design, graphics or any other component to create a unique layout.
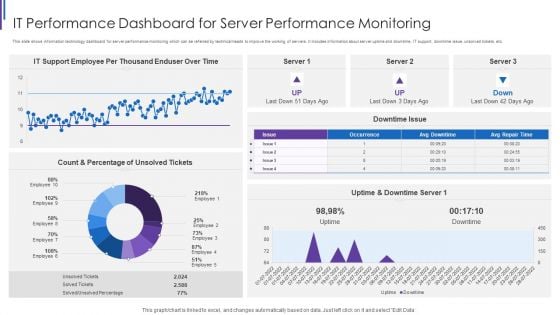
IT Performance Dashboard For Server Performance Monitoring Portrait PDF
This slide shows information technology dashboard for server performance monitoring which can be referred by technical heads to improve the working of servers. It includes information about server uptime and downtime, IT support, downtime issue, unsolved tickets, etc. Showcasing this set of slides titled IT Performance Dashboard For Server Performance Monitoring Portrait PDF. The topics addressed in these templates are IT Support Employee, Per Thousand Enduser, Uptime And Downtime, Count And Percentage. All the content presented in this PPT design is completely editable. Download it and make adjustments in color, background, font etc. as per your unique business setting.
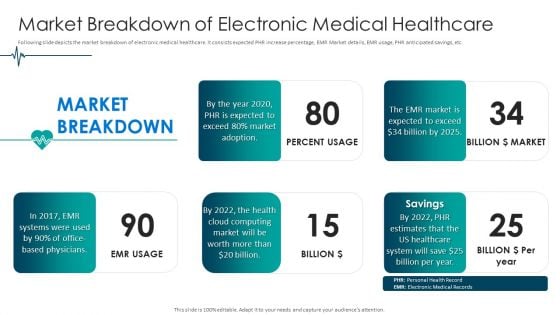
Medical Care Market Breakdown Of Electronic Medical Healthcare Template PDF
Following slide depicts the market breakdown of electronic medical healthcare. It consists expected PHR increase percentage, EMR Market details, EMR usage, PHR anticipated savings, etc. This is a medical care market breakdown of electronic medical healthcare template pdf template with various stages. Focus and dispense information on five stages using this creative set, that comes with editable features. It contains large content boxes to add your information on topics like market breakdown of electronic medical healthcare. You can also showcase facts, figures, and other relevant content using this PPT layout. Grab it now.
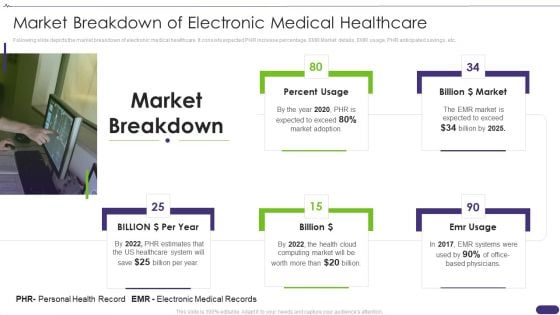
Pitch Deck For Healthcare Application Market Breakdown Of Electronic Medical Healthcare Slides PDF
Following slide depicts the market breakdown of electronic medical healthcare. It consists expected PHR increase percentage, EMR Market details, EMR usage, PHR anticipated savings, etc. Presenting Pitch Deck For Healthcare Application Market Breakdown Of Electronic Medical Healthcare Slides PDF to provide visual cues and insights. Share and navigate important information on one stage that need your due attention. This template can be used to pitch topics like Market Breakdown, Systems, Percent Usage. In addtion, this PPT design contains high resolution images, graphics, etc, that are easily editable and available for immediate download.
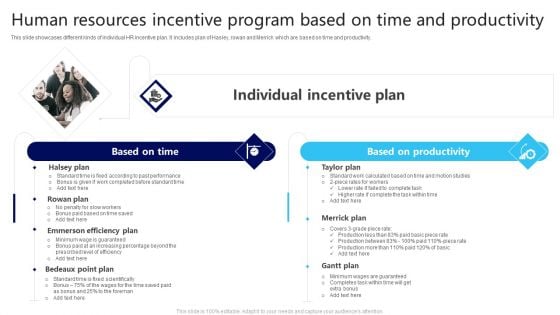
Human Resources Incentive Program Based On Time And Productivity Information PDF
This slide showcases different kinds of individual HR incentive plan. It includes plan of Hasley, rowan and Merrick which are based on time and productivity.Persuade your audience using this Human Resources Incentive Program Based On Time And Productivity Information PDF. This PPT design covers two stages, thus making it a great tool to use. It also caters to a variety of topics including Based Productivity, Emmerson Efficiency, Increasing Percentage. Download this PPT design now to present a convincing pitch that not only emphasizes the topic but also showcases your presentation skills.
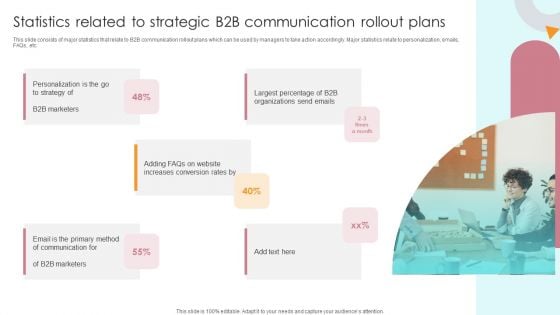
Statistics Related To Strategic B2B Communication Rollout Plans Structure PDF
This slide consists of major statistics that relate to B2B communication rollout plans which can be used by managers to take action accordingly. Major statistics relate to personalization, emails, FAQs, etc. Presenting Statistics Related To Strategic B2B Communication Rollout Plans Structure PDF to dispense important information. This template comprises five stages. It also presents valuable insights into the topics including Personalization, Largest Percentage, Increases Conversion Rates. This is a completely customizable PowerPoint theme that can be put to use immediately. So, download it and address the topic impactfully.
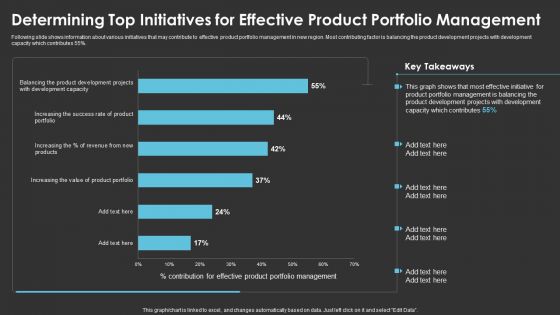
Determining Top Initiatives For Effective Product Portfolio Management Formats PDF
Following slide shows information about various initiatives that may contribute to effective product portfolio management in new region. Most contributing factor is balancing the product development projects with development capacity which contributes 55 percentage. Deliver and pitch your topic in the best possible manner with this Determining Top Initiatives For Effective Product Portfolio Management Formats PDF. Use them to share invaluable insights on Product Development, Management and impress your audience. This template can be altered and modified as per your expectations. So, grab it now.
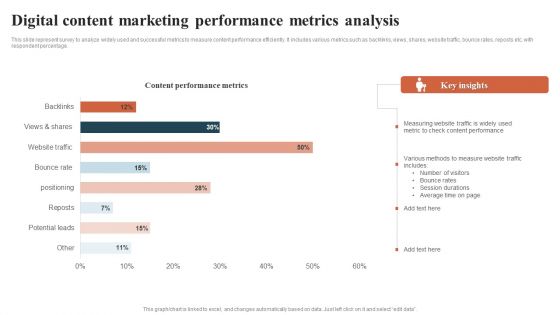
Digital Content Marketing Performance Metrics Analysis Introduction PDF
This slide represent survey to analyze widely used and successful metrics to measure content performance efficiently. It includes various metrics such as backlinks, views, shares, website traffic, bounce rates, reposts etc. with respondent percentage. Showcasing this set of slides titled Digital Content Marketing Performance Metrics Analysis Introduction PDF. The topics addressed in these templates are Digital Content Marketing, Performance Metrics Analysis. All the content presented in this PPT design is completely editable. Download it and make adjustments in color, background, font etc. as per your unique business setting.
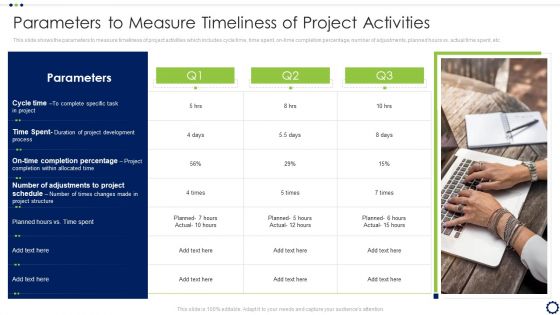
Coordinating Distinct Activities For Effective Project Time Management Parameters To Measure Timeliness Clipart PDF
This slide covers the key issues faced in project time management which includes ineffective task scheduling, no time tracking, lack of technology and inaccurate time estimation that results in client dissatisfaction.Presenting Coordinating Distinct Activities For Effective Project Time Management Parameters To Measure Timeliness Clipart PDF to provide visual cues and insights. Share and navigate important information on four stages that need your due attention. This template can be used to pitch topics like Project Development, Completion Percentage, Adjustments Project In addtion, this PPT design contains high resolution images, graphics, etc, that are easily editable and available for immediate download.
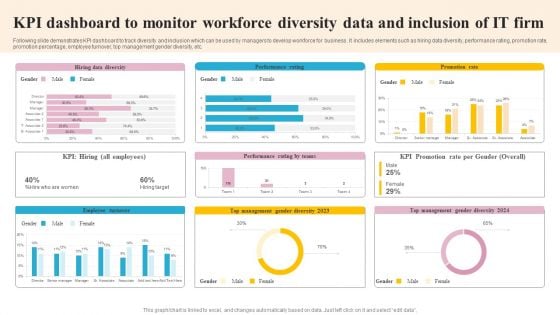
KPI Dashboard To Monitor Workforce Diversity Data And Inclusion Of IT Firm Slides PDF
Following slide demonstrates KPI dashboard to track diversity and inclusion which can be used by managers to develop workforce for business . It includes elements such as hiring data diversity, performance rating, promotion rate, promotion percentage, employee turnover, top management gender diversity, etc. Showcasing this set of slides titled KPI Dashboard To Monitor Workforce Diversity Data And Inclusion Of IT Firm Slides PDF. The topics addressed in these templates are Employee Turnover, Management, Promotion Rate. All the content presented in this PPT design is completely editable. Download it and make adjustments in color, background, font etc. as per your unique business setting.

Online Payment Techniques QR Code Payment Key Statistics
Mentioned slide highlights key statistics associated with Quick Response QR code which can be used by businesses to go contactless. It includes key points such as QR code usage, transaction value, people usage percentage, QR payment growth in the US, etc. Coming up with a presentation necessitates that the majority of the effort goes into the content and the message you intend to convey. The visuals of a PowerPoint presentation can only be effective if it supplements and supports the story that is being told. Keeping this in mind our experts created Online Payment Techniques QR Code Payment Key Statistics to reduce the time that goes into designing the presentation. This way, you can concentrate on the message while our designers take care of providing you with the right template for the situation. Mentioned slide highlights key statistics associated with Quick Response QR code which can be used by businesses to go contactless. It includes key points such as QR code usage, transaction value, people usage percentage, QR payment growth in the US, etc.
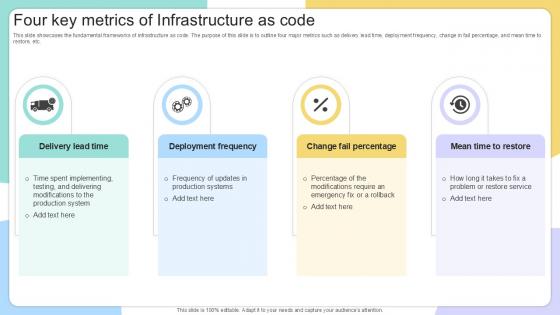
Four Key Metrics Of Infrastructure IAC Tools For Performance Analysis PPT PowerPoint
This slide showcases the fundamental frameworks of infrastructure as code. The purpose of this slide is to outline four major metrics such as delivery lead time, deployment frequency, change in fail percentage, and mean time to restore, etc. Explore a selection of the finest Four Key Metrics Of Infrastructure IAC Tools For Performance Analysis PPT PowerPoint here. With a plethora of professionally designed and pre-made slide templates, you can quickly and easily find the right one for your upcoming presentation. You can use our Four Key Metrics Of Infrastructure IAC Tools For Performance Analysis PPT PowerPoint to effectively convey your message to a wider audience. Slidegeeks has done a lot of research before preparing these presentation templates. The content can be personalized and the slides are highly editable. Grab templates today from Slidegeeks. This slide showcases the fundamental frameworks of infrastructure as code. The purpose of this slide is to outline four major metrics such as delivery lead time, deployment frequency, change in fail percentage, and mean time to restore, etc.
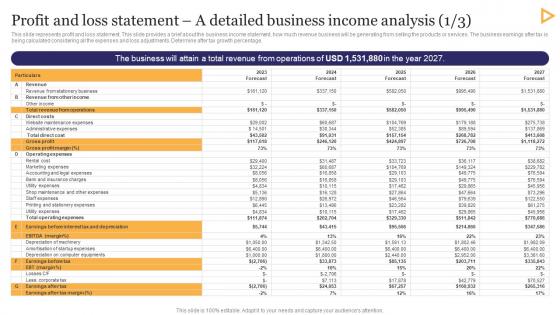
Profit And Loss Statement A Detailed Stationery Business Plan Go To Market Strategy Graphics Pdf
This slide represents profit and loss statement. This slide provides a brief about the business income statement, how much revenue business will be generating from selling the products or services. The business earnings after tax is being calculated considering all the expenses and loss adjustments. Determine after tax growth percentage. Are you searching for a Profit And Loss Statement A Detailed Stationery Business Plan Go To Market Strategy Graphics Pdf that is uncluttered, straightforward, and original Its easy to edit, and you can change the colors to suit your personal or business branding. For a presentation that expresses how much effort you have put in, this template is ideal With all of its features, including tables, diagrams, statistics, and lists, its perfect for a business plan presentation. Make your ideas more appealing with these professional slides. Download Profit And Loss Statement A Detailed Stationery Business Plan Go To Market Strategy Graphics Pdf from Slidegeeks today. This slide represents profit and loss statement. This slide provides a brief about the business income statement, how much revenue business will be generating from selling the products or services. The business earnings after tax is being calculated considering all the expenses and loss adjustments. Determine after tax growth percentage.
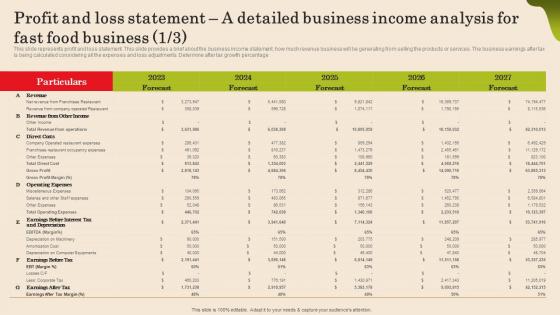
Profit And Loss Statement A Detailed Business Income Fast Food Business Plan Brochure Pdf
This slide represents profit and loss statement. This slide provides a brief about the business income statement, how much revenue business will be generating from selling the products or services. The business earnings after tax is being calculated considering all the expenses and loss adjustments. Determine after tax growth percentage. Take your projects to the next level with our ultimate collection of Profit And Loss Statement A Detailed Business Income Fast Food Business Plan Brochure Pdf. Slidegeeks has designed a range of layouts that are perfect for representing task or activity duration, keeping track of all your deadlines at a glance. Tailor these designs to your exact needs and give them a truly corporate look with your own brand colors they will make your projects stand out from the rest This slide represents profit and loss statement. This slide provides a brief about the business income statement, how much revenue business will be generating from selling the products or services. The business earnings after tax is being calculated considering all the expenses and loss adjustments. Determine after tax growth percentage.
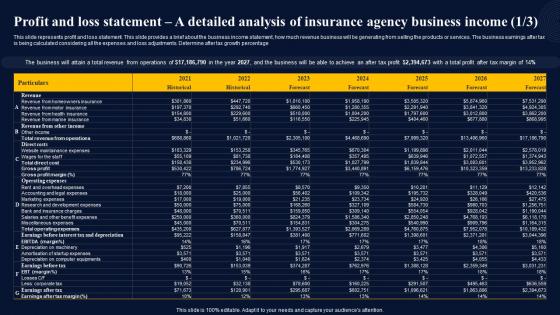
Profit And Loss Statement A Detailed Analysis Insurance Broker Business Plan Portrait Pdf
This slide represents profit and loss statement. This slide provides a brief about the business income statement, how much revenue business will be generating from selling the products or services. The business earnings after tax is being calculated considering all the expenses and loss adjustments. Determine after tax growth percentage.Retrieve professionally designed Profit And Loss Statement A Detailed Analysis Insurance Broker Business Plan Portrait Pdf to effectively convey your message and captivate your listeners. Save time by selecting pre-made slideshows that are appropriate for various topics, from business to educational purposes. These themes come in many different styles, from creative to corporate, and all of them are easily adjustable and can be edited quickly. Access them as PowerPoint templates or as Google Slides themes. You do not have to go on a hunt for the perfect presentation because Slidegeeks got you covered from everywhere. This slide represents profit and loss statement. This slide provides a brief about the business income statement, how much revenue business will be generating from selling the products or services. The business earnings after tax is being calculated considering all the expenses and loss adjustments. Determine after tax growth percentage.
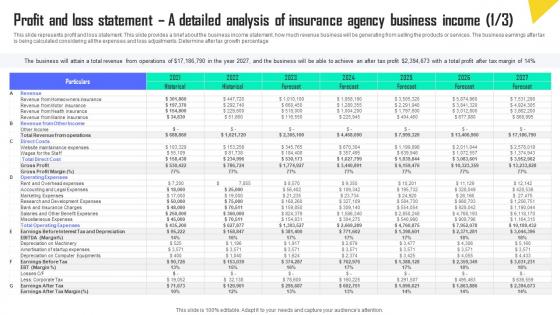
Profit And Loss Statement A Detailed Analysis Of Insurance Automobile Insurance Agency Rules Pdf
This slide represents profit and loss statement. This slide provides a brief about the business income statement, how much revenue business will be generating from selling the products or services. The business earnings after tax is being calculated considering all the expenses and loss adjustments. Determine after tax growth percentage. Retrieve professionally designed Profit And Loss Statement A Detailed Analysis Of Insurance Automobile Insurance Agency Rules Pdf to effectively convey your message and captivate your listeners. Save time by selecting pre-made slideshows that are appropriate for various topics, from business to educational purposes. These themes come in many different styles, from creative to corporate, and all of them are easily adjustable and can be edited quickly. Access them as PowerPoint templates or as Google Slides themes. You do not have to go on a hunt for the perfect presentation because Slidegeeks got you covered from everywhere. This slide represents profit and loss statement. This slide provides a brief about the business income statement, how much revenue business will be generating from selling the products or services. The business earnings after tax is being calculated considering all the expenses and loss adjustments. Determine after tax growth percentage.
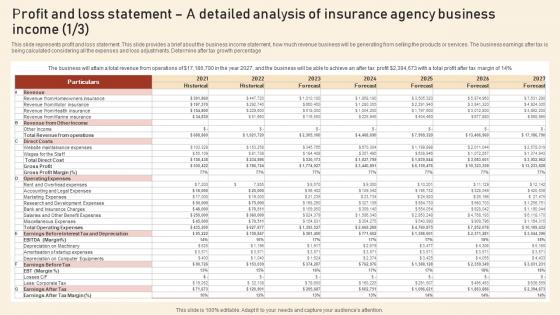
Profit And Loss Statement A Detailed Analysis Of Insurance Agency Assurant Insurance Agency Microsoft Pdf
This slide represents profit and loss statement. This slide provides a brief about the business income statement, how much revenue business will be generating from selling the products or services. The business earnings after tax is being calculated considering all the expenses and loss adjustments. Determine after tax growth percentage. Retrieve professionally designed Profit And Loss Statement A Detailed Analysis Of Insurance Agency Assurant Insurance Agency Microsoft Pdf to effectively convey your message and captivate your listeners. Save time by selecting pre-made slideshows that are appropriate for various topics, from business to educational purposes. These themes come in many different styles, from creative to corporate, and all of them are easily adjustable and can be edited quickly. Access them as PowerPoint templates or as Google Slides themes. You do not have to go on a hunt for the perfect presentation because Slidegeeks got you covered from everywhere. This slide represents profit and loss statement. This slide provides a brief about the business income statement, how much revenue business will be generating from selling the products or services. The business earnings after tax is being calculated considering all the expenses and loss adjustments. Determine after tax growth percentage.

Profit And Loss Statement A Detailed Business Income Fashion Business Plan Structure Pdf
This slide represents profit and loss statement. This slide provides a brief about the business income statement, how much revenue business will be generating from selling the products or services. The business earnings after tax is being calculated considering all the expenses and loss adjustments. Determine after tax growth percentage. Retrieve professionally designed Profit And Loss Statement A Detailed Business Income Fashion Business Plan Structure Pdf to effectively convey your message and captivate your listeners. Save time by selecting pre-made slideshows that are appropriate for various topics, from business to educational purposes. These themes come in many different styles, from creative to corporate, and all of them are easily adjustable and can be edited quickly. Access them as PowerPoint templates or as Google Slides themes. You do not have to go on a hunt for the perfect presentation because Slidegeeks got you covered from everywhere. This slide represents profit and loss statement. This slide provides a brief about the business income statement, how much revenue business will be generating from selling the products or services. The business earnings after tax is being calculated considering all the expenses and loss adjustments. Determine after tax growth percentage.
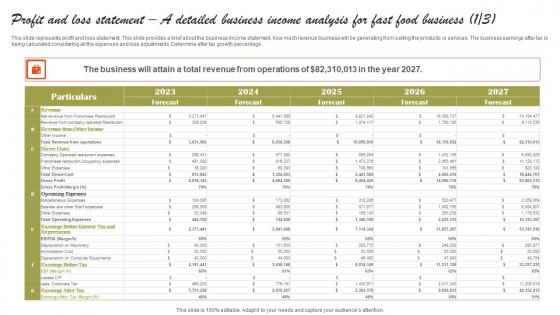
Profit And Loss Statement A Detailed Business Income Small Fast Food Business Plan Pictures Pdf
This slide represents profit and loss statement. This slide provides a brief about the business income statement, how much revenue business will be generating from selling the products or services. The business earnings after tax is being calculated considering all the expenses and loss adjustments. Determine after tax growth percentage.Here you can discover an assortment of the finest PowerPoint and Google Slides templates. With these templates, you can create presentations for a variety of purposes while simultaneously providing your audience with an eye-catching visual experience. Download Profit And Loss Statement A Detailed Business Income Small Fast Food Business Plan Pictures Pdf to deliver an impeccable presentation. These templates will make your job of preparing presentations much quicker, yet still, maintain a high level of quality. Slidegeeks has experienced researchers who prepare these templates and write high-quality content for you. Later on, you can personalize the content by editing the Profit And Loss Statement A Detailed Business Income Small Fast Food Business Plan Pictures Pdf This slide represents profit and loss statement. This slide provides a brief about the business income statement, how much revenue business will be generating from selling the products or services. The business earnings after tax is being calculated considering all the expenses and loss adjustments. Determine after tax growth percentage.
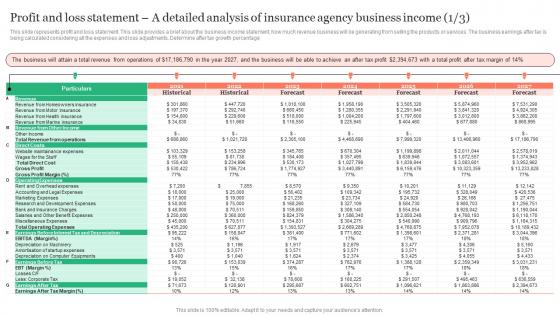
Profit And Loss Statement A Detailed Analysis Of A Insurance Business Plan Diagrams Pdf
This slide represents profit and loss statement. This slide provides a brief about the business income statement, how much revenue business will be generating from selling the products or services. The business earnings after tax is being calculated considering all the expenses and loss adjustments. Determine after tax growth percentage. Retrieve professionally designed Profit And Loss Statement A Detailed Analysis Of A Insurance Business Plan Diagrams Pdf to effectively convey your message and captivate your listeners. Save time by selecting pre-made slideshows that are appropriate for various topics, from business to educational purposes. These themes come in many different styles, from creative to corporate, and all of them are easily adjustable and can be edited quickly. Access them as PowerPoint templates or as Google Slides themes. You do not have to go on a hunt for the perfect presentation because Slidegeeks got you covered from everywhere. This slide represents profit and loss statement. This slide provides a brief about the business income statement, how much revenue business will be generating from selling the products or services. The business earnings after tax is being calculated considering all the expenses and loss adjustments. Determine after tax growth percentage.
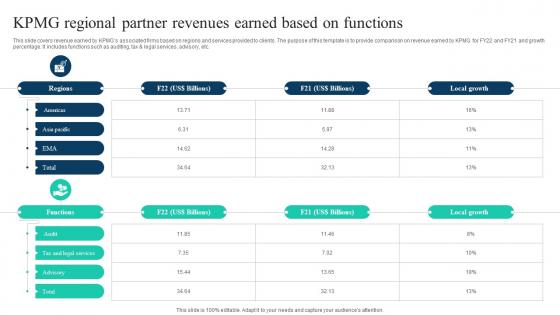
The Ultimate Guide To KPMG Regional Partner Revenues Earned Based Strategy SS V
This slide covers revenue earned by KPMGs associated firms based on regions and services provided to clients. The purpose of this template is to provide comparison on revenue earned by KPMG for FY22 and FY21 and growth percentage. It includes functions such as auditing, tax and legal services, advisory, etc. Want to ace your presentation in front of a live audience Our The Ultimate Guide To KPMG Regional Partner Revenues Earned Based Strategy SS V can help you do that by engaging all the users towards you. Slidegeeks experts have put their efforts and expertise into creating these impeccable powerpoint presentations so that you can communicate your ideas clearly. Moreover, all the templates are customizable, and easy-to-edit and downloadable. Use these for both personal and commercial use. This slide covers revenue earned by KPMGs associated firms based on regions and services provided to clients. The purpose of this template is to provide comparison on revenue earned by KPMG for FY22 and FY21 and growth percentage. It includes functions such as auditing, tax and legal services, advisory, etc.
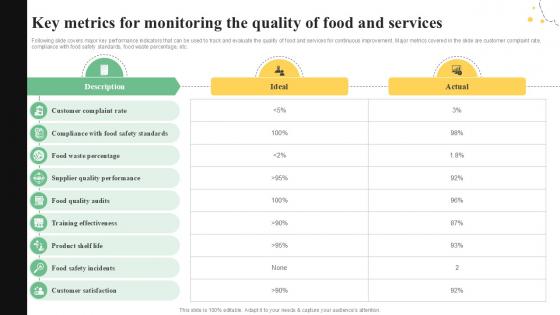
Key Metrics For Monitoring The Quality Control Guide For Food PPT Slide
Following slide covers major key performance indicators that can be used to track and evaluate the quality of food and services for continuous improvement. Major metrics covered in the slide are customer complaint rate, compliance with food safety standards, food waste percentage, etc. Explore a selection of the finest Key Metrics For Monitoring The Quality Control Guide For Food PPT Slide here. With a plethora of professionally designed and pre-made slide templates, you can quickly and easily find the right one for your upcoming presentation. You can use our Key Metrics For Monitoring The Quality Control Guide For Food PPT Slide to effectively convey your message to a wider audience. Slidegeeks has done a lot of research before preparing these presentation templates. The content can be personalized and the slides are highly editable. Grab templates today from Slidegeeks. Following slide covers major key performance indicators that can be used to track and evaluate the quality of food and services for continuous improvement. Major metrics covered in the slide are customer complaint rate, compliance with food safety standards, food waste percentage, etc.

Assessing Annual Income Statement Of Brand How To Implement Product Background Pdf
This slide showcases analyses annual income statement of brand. It provides details about net sales, cost of goods sold, gross margin percentage, research and development, advertising, packaging, product line launch, contribution margin, etc. If you are looking for a format to display your unique thoughts, then the professionally designed Assessing Annual Income Statement Of Brand How To Implement Product Background Pdf is the one for you. You can use it as a Google Slides template or a PowerPoint template. Incorporate impressive visuals, symbols, images, and other charts. Modify or reorganize the text boxes as you desire. Experiment with shade schemes and font pairings. Alter, share or cooperate with other people on your work. Download Assessing Annual Income Statement Of Brand How To Implement Product Background Pdf and find out how to give a successful presentation. Present a perfect display to your team and make your presentation unforgettable. This slide showcases analyses annual income statement of brand. It provides details about net sales, cost of goods sold, gross margin percentage, research and development, advertising, packaging, product line launch, contribution margin, etc.
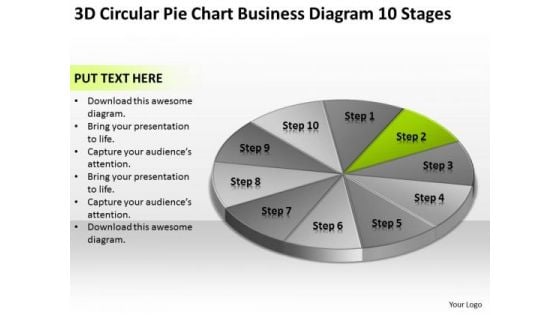
Circular Pie Chart Business Diagram 10 Stages Plan PowerPoint Slides
We present our circular pie chart business diagram 10 stages plan PowerPoint Slides.Present our Business PowerPoint Templates because Our PowerPoint Templates and Slides are conceived by a dedicated team. Use them and give form to your wondrous ideas. Present our Finance PowerPoint Templates because Our PowerPoint Templates and Slides are created with admirable insight. Use them and give your group a sense of your logical mind. Use our Circle Charts PowerPoint Templates because Our PowerPoint Templates and Slides come in all colours, shades and hues. They help highlight every nuance of your views. Download our Shapes PowerPoint Templates because Our PowerPoint Templates and Slides will let your team Walk through your plans. See their energy levels rise as you show them the way. Download and present our Process and Flows PowerPoint Templates because Timeline crunches are a fact of life. Meet all deadlines using our PowerPoint Templates and Slides.Use these PowerPoint slides for presentations relating to Chart, donut, market, isolated, diminishing, rate, downtrend, business, three-dimensional, success, presentation, diagram, circle, uptrend, percentage, graphic, finance, data, stock, holdings, report, marketing, analyzing, trading, graph, illustration, pie, sale, up, money, design, currency, growth, descriptive, representing, painting, moving, progress, part, increases, background, investment, index, financial, multi, counter. The prominent colors used in the PowerPoint template are Green, Gray, White. Our Circular Pie Chart Business Diagram 10 Stages Plan PowerPoint Slides are a great feeder line. They keep the energy coming to you.
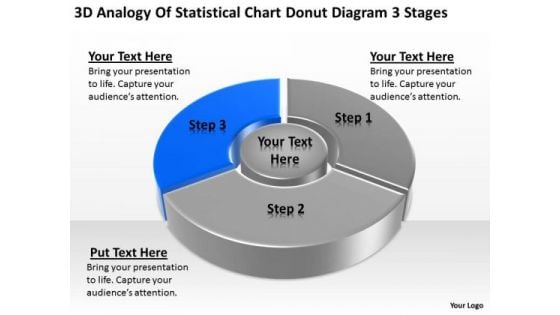
Statistical Chart Donut Diagram 3 Stages Ppt Samples Business Plan PowerPoint Slides
We present our statistical chart donut diagram 3 stages ppt samples business plan PowerPoint Slides.Download our Finance PowerPoint Templates because you should Experience excellence with our PowerPoint Templates and Slides. They will take your breath away. Present our Marketing PowerPoint Templates because our bewitching PowerPoint Templates and Slides will delight your audience with the magic of your words. Use our Sales PowerPoint Templates because You have gained great respect for your brilliant ideas. Use our PowerPoint Templates and Slides to strengthen and enhance your reputation. Download our Business PowerPoint Templates because You have a driving passion to excel in your field. Our PowerPoint Templates and Slides will prove ideal vehicles for your ideas. Download our Success PowerPoint Templates because You should Kick up a storm with our PowerPoint Templates and Slides. The heads of your listeners will swirl with your ideas.Use these PowerPoint slides for presentations relating to Chart, Business, Data, Donut, Market, Sales, Document, Economy, Display, Bar, Corporate, Income, Concept, Success, Presentation, Symbol, Diagram, Percentage, Graphic, Finance, Stock, Clean, Analysis, Report, Marketing, Accounting, Management, Graph, Colors, Forecast, Design, Growth, Competition, Progress, Profit, Information, Background, Trade, Investment, Statistic, Financial. The prominent colors used in the PowerPoint template are Blue, Gray, Black. Make the event with our Statistical Chart Donut Diagram 3 Stages Ppt Samples Business Plan PowerPoint Slides. Your thoughts will be really happening.
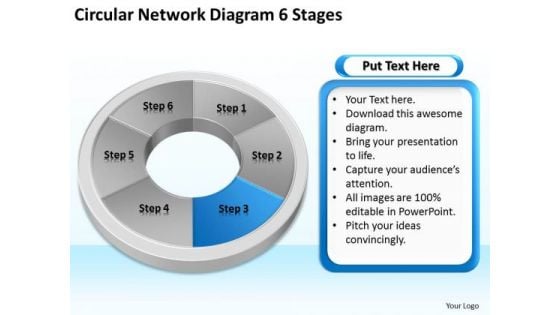
Circular Network Diagram 6 Stages Business Plan Professional PowerPoint Templates
We present our circular network diagram 6 stages business plan professional PowerPoint templates.Present our Process and Flows PowerPoint Templates because Our PowerPoint Templates and Slides will definately Enhance the stature of your presentation. Adorn the beauty of your thoughts with their colourful backgrounds. Present our Circle Charts PowerPoint Templates because you should Whip up a frenzy with our PowerPoint Templates and Slides. They will fuel the excitement of your team. Use our Shapes PowerPoint Templates because Our PowerPoint Templates and Slides are endowed to endure. Ideas conveyed through them will pass the test of time. Download and present our Business PowerPoint Templates because Our PowerPoint Templates and Slides are aesthetically designed to attract attention. We gaurantee that they will grab all the eyeballs you need. Download and present our Marketing PowerPoint Templates because It will Give impetus to the hopes of your colleagues. Our PowerPoint Templates and Slides will aid you in winning their trust.Use these PowerPoint slides for presentations relating to Pie, chart, business, concept, success, icon, account, market, isolated, slice, economy, presentation, diagram, circle, wealth, percentage, graphic,finance, data, report, marketing, analyzing, accounting, partition, management, graph, illustration, earnings, piece, strategy, money, planning, growth, progress,profit, part, information, investment, improvement, statistic, financial, measure, six, savings, performance. The prominent colors used in the PowerPoint template are Blue, White, Gray. Gather the data and present with our Circular Network Diagram 6 Stages Business Plan Professional PowerPoint Templates. Try us out and see what a difference our templates make.
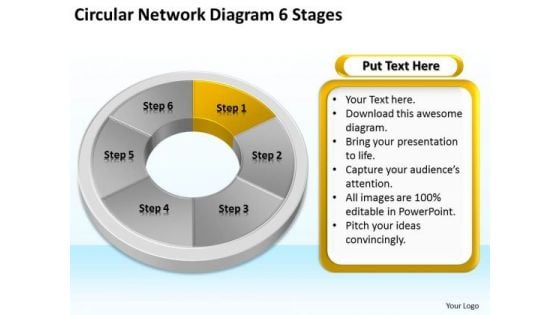
Circular Network Diagram 6 Stages Business Plans That PowerPoint Slides
We present our circular network diagram 6 stages business plans that PowerPoint Slides.Download our Circle Charts PowerPoint Templates because It will Give impetus to the hopes of your colleagues. Our PowerPoint Templates and Slides will aid you in winning their trust. Download and present our Business PowerPoint Templates because It will mark the footprints of your journey. Illustrate how they will lead you to your desired destination. Download our Process and Flows PowerPoint Templates because Our PowerPoint Templates and Slides will bullet point your ideas. See them fall into place one by one. Download our Success PowerPoint Templates because You can Inspire your team with our PowerPoint Templates and Slides. Let the force of your ideas flow into their minds. Download and present our Shapes PowerPoint Templates because Our PowerPoint Templates and Slides are truly out of this world. Even the MIB duo has been keeping tabs on our team.Use these PowerPoint slides for presentations relating to Pie, chart, business, concept, success, icon, account, market, isolated, slice, economy, presentation, diagram, circle, wealth, percentage, graphic,finance, data, report, marketing, analyzing, accounting, partition, management, graph, illustration, earnings, piece, strategy, money, planning, growth, progress,profit, part, information, investment, improvement, statistic, financial, measure, six, savings, performance. The prominent colors used in the PowerPoint template are White, Gray, Yellow. Filter out ideas with our Circular Network Diagram 6 Stages Business Plans That PowerPoint Slides. They get actionable ones to emerge.
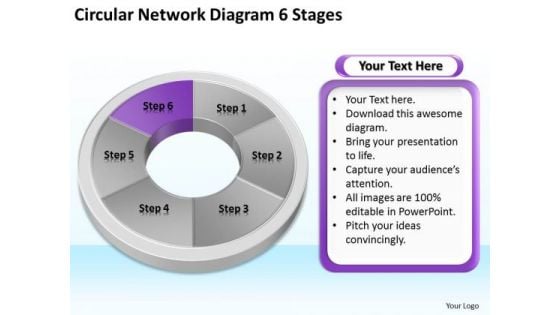
Circular Network Diagram 6 Stages Business Plan PowerPoint Slides
We present our circular network diagram 6 stages business plan PowerPoint Slides.Download our Circle Charts PowerPoint Templates because You have a driving passion to excel in your field. Our PowerPoint Templates and Slides will prove ideal vehicles for your ideas. Download our Business PowerPoint Templates because Our PowerPoint Templates and Slides are created with admirable insight. Use them and give your group a sense of your logical mind. Download and present our Process and Flows PowerPoint Templates because Our PowerPoint Templates and Slides will provide you the cutting edge. Slice through the doubts in the minds of your listeners. Present our Marketing PowerPoint Templates because Our PowerPoint Templates and Slides will fulfill your every need. Use them and effectively satisfy the desires of your audience. Present our Success PowerPoint Templates because Our PowerPoint Templates and Slides has conjured up a web of all you need with the help of our great team. Use them to string together your glistening ideas.Use these PowerPoint slides for presentations relating to Pie, chart, business, concept, success, icon, account, market, isolated, slice, economy, presentation, diagram, circle, wealth, percentage, graphic,finance, data, report, marketing, analyzing, accounting, partition, management, graph, illustration, earnings, piece, strategy, money, planning, growth, progress,profit, part, information, investment, improvement, statistic, financial, measure, six, savings, performance. The prominent colors used in the PowerPoint template are Gray, Purple, White. Our Circular Network Diagram 6 Stages Business Plan PowerPoint Slides adhere to democratic culture. They cater for different attitudes and beliefs.
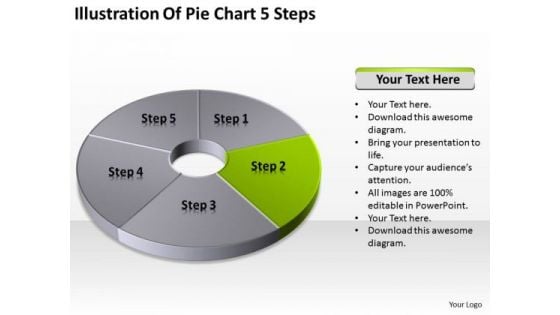
Illustration Of Pie Chart 5 Step Business Plan Steps PowerPoint Slides
We present our illustration of pie chart 5 step business plan steps PowerPoint Slides.Download our Circle Charts PowerPoint Templates because You have a driving passion to excel in your field. Our PowerPoint Templates and Slides will prove ideal vehicles for your ideas. Use our Shapes PowerPoint Templates because our PowerPoint Templates and Slides are the string of your bow. Fire of your ideas and conquer the podium. Use our Success PowerPoint Templates because Our PowerPoint Templates and Slides are like the strings of a tennis racquet. Well strung to help you serve aces. Download and present our Business PowerPoint Templates because Our PowerPoint Templates and Slides will effectively help you save your valuable time. They are readymade to fit into any presentation structure. Present our Process and Flows PowerPoint Templates because Our PowerPoint Templates and Slides are Clear and concise. Use them and dispel any doubts your team may have.Use these PowerPoint slides for presentations relating to pie, chart, market, statistics, sales, slice, economy, display, corporate, business, concept, render, success, presentation, diagram, percentage, graphic, finance, data, bank, report, marketing, accounting, management, graph, illustration, icon, piece, strategy, money, growth, company, control, competition, progress, account, sheet, profit, part, information, investment, improvement, banking, index, financial, reflect, results, performance, exchange. The prominent colors used in the PowerPoint template are Green, Gray, Black. Our Illustration Of Pie Chart 5 Step Business Plan Steps PowerPoint Slides are empowering agents. Your thoughts will create the correct chemistry.
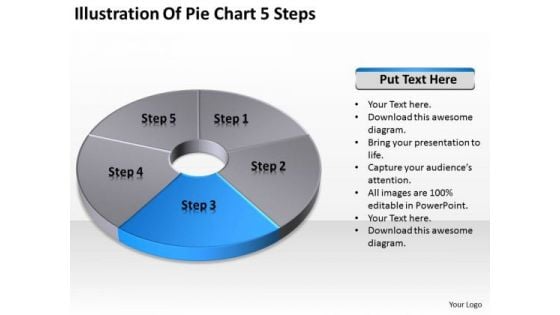
Illustration Of Pie Chart 5 Step How To Write Business Plans PowerPoint Templates
We present our illustration of pie chart 5 step how to write business plans PowerPoint templates.Present our Circle Charts PowerPoint Templates because You aspire to touch the sky with glory. Let our PowerPoint Templates and Slides provide the fuel for your ascent. Present our Shapes PowerPoint Templates because Our PowerPoint Templates and Slides have the Brilliant backdrops. Guaranteed to illuminate the minds of your audience. Present our Success PowerPoint Templates because You can Be the star of the show with our PowerPoint Templates and Slides. Rock the stage with your ideas. Download our Business PowerPoint Templates because Timeline crunches are a fact of life. Meet all deadlines using our PowerPoint Templates and Slides. Download our Process and Flows PowerPoint Templates because You should Press the right buttons with our PowerPoint Templates and Slides. They will take your ideas down the perfect channel.Use these PowerPoint slides for presentations relating to pie, chart, market, statistics, sales, slice, economy, display, corporate, business, concept, render, success, presentation, diagram, percentage, graphic, finance, data, bank, report, marketing, accounting, management, graph, illustration, icon, piece, strategy, money, growth, company, control, competition, progress, account, sheet, profit, part, information, investment, improvement, banking, index, financial, reflect, results, performance, exchange. The prominent colors used in the PowerPoint template are Blue, Gray, Black. Forget about ceilings with our Illustration Of Pie Chart 5 Step How To Write Business Plans PowerPoint Templates. They pitch it so high that the glass will crack.
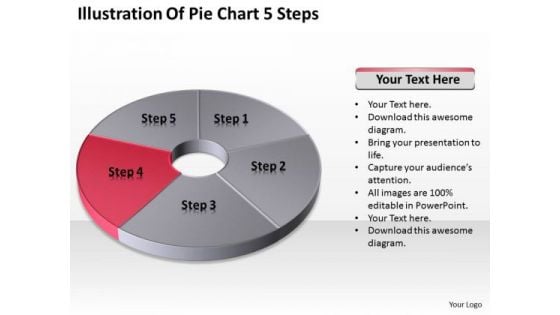
Illustration Of Pie Chart 5 Step Ppt Business Plan Sample PowerPoint Templates
We present our illustration of pie chart 5 step ppt business plan sample PowerPoint templates.Use our Circle Charts PowerPoint Templates because Our PowerPoint Templates and Slides will let you Clearly mark the path for others to follow. Download and present our Shapes PowerPoint Templates because They will Put your wonderful verbal artistry on display. Our PowerPoint Templates and Slides will provide you the necessary glam and glitter. Use our Success PowerPoint Templates because It will get your audience in sync. Present our Business PowerPoint Templates because our PowerPoint Templates and Slides will give your ideas the shape. Download our Process and Flows PowerPoint Templates because These PowerPoint Templates and Slides will give the updraft to your ideas. See them soar to great heights with ease.Use these PowerPoint slides for presentations relating to pie, chart, market, statistics, sales, slice, economy, display, corporate, business, concept, render, success, presentation, diagram, percentage, graphic, finance, data, bank, report, marketing, accounting, management, graph, illustration, icon, piece, strategy, money, growth, company, control, competition, progress, account, sheet, profit, part, information, investment, improvement, banking, index, financial, reflect, results, performance, exchange. The prominent colors used in the PowerPoint template are Red, Gray, Black. Our Illustration Of Pie Chart 5 Step Ppt Business Plan Sample PowerPoint Templates are driven by excellence. They automatically attract the exceptional.
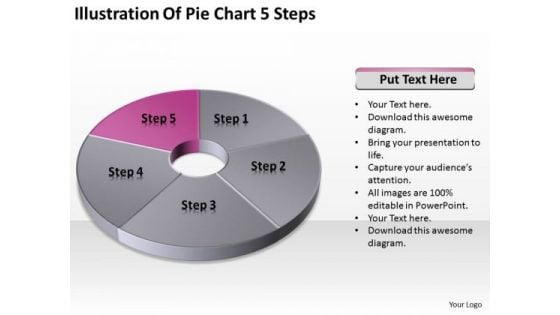
Illustration Of Pie Chart 5 Step Ppt Samples Business Plan PowerPoint Templates
We present our illustration of pie chart 5 step ppt samples business plan PowerPoint templates.Download our Circle Charts PowerPoint Templates because Our PowerPoint Templates and Slides are designed to help you succeed. They have all the ingredients you need. Present our Shapes PowerPoint Templates because You can Channelise the thoughts of your team with our PowerPoint Templates and Slides. Urge them to focus on the goals you have set. Use our Success PowerPoint Templates because Our PowerPoint Templates and Slides will let your ideas bloom. Create a bed of roses for your audience. Use our Business PowerPoint Templates because It will let you Set new benchmarks with our PowerPoint Templates and Slides. They will keep your prospects well above par. Download our Process and Flows PowerPoint Templates because Our PowerPoint Templates and Slides will let Your superior ideas hit the target always and everytime.Use these PowerPoint slides for presentations relating to pie, chart, market, statistics, sales, slice, economy, display, corporate, business, concept, render, success, presentation, diagram, percentage, graphic, finance, data, bank, report, marketing, accounting, management, graph, illustration, icon, piece, strategy, money, growth, company, control, competition, progress, account, sheet, profit, part, information, investment, improvement, banking, index, financial, reflect, results, performance, exchange. The prominent colors used in the PowerPoint template are Pink, Gray, Black. There is one thing our Illustration Of Pie Chart 5 Step Ppt Samples Business Plan PowerPoint Templates cannot do. They cannot be drab and dreary.


 Continue with Email

 Home
Home


