Percentage Progress
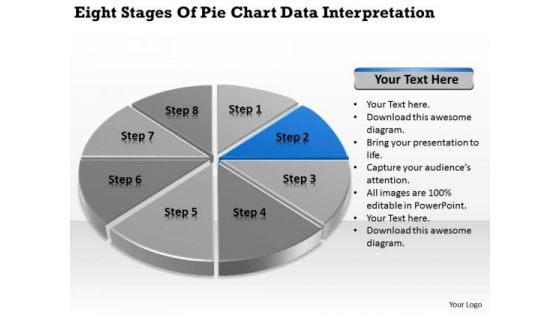
Stages Of Pie Chart Data Interpretation Vending Machine Business Plan PowerPoint Slides
We present our stages of pie chart data interpretation vending machine business plan PowerPoint Slides.Present our Circle Charts PowerPoint Templates because You should Bet on your luck with our PowerPoint Templates and Slides. Be assured that you will hit the jackpot. Present our Marketing PowerPoint Templates because Our PowerPoint Templates and Slides will provide you the cutting edge. Slice through the doubts in the minds of your listeners. Download our Business PowerPoint Templates because you should Experience excellence with our PowerPoint Templates and Slides. They will take your breath away. Download our Shapes PowerPoint Templates because It will Raise the bar of your Thoughts. They are programmed to take you to the next level. Present our Process and Flows PowerPoint Templates because Our PowerPoint Templates and Slides will give good value for money. They also have respect for the value of your time.Use these PowerPoint slides for presentations relating to achievement, analysis, background, bank, banking, business, calculation, chart, circle, commerce, commercial, commission, concept, credit, crisis, debt, deposit, design, detail, diagram, earnings, economics, economy, element, finance, goal, gold, golden, graph, graphic, growth, icon, idea, illustration, income, increase, invest, isolated, level, loss, market, marketing, metal, modern, money, new, object, part, percent, percentage, pie, plot, politics, profit, progress, ratio, reflection, reflective. The prominent colors used in the PowerPoint template are Blue, Gray, Black. Our Stages Of Pie Chart Data Interpretation Vending Machine Business Plan PowerPoint Slides come at a comfortable cost. They are definitely an economical choice.
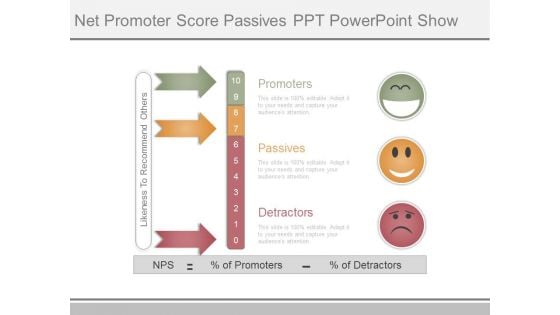
Net Promoter Score Passives Ppt Powerpoint Show
This is a net promoter score passives ppt powerpoint show. This is a three stage process. The stages in this process are promoters, passives, detractors, nps, percentage of promoters, likeness to recommend others, percentage of detractors.

Net Promoter Score Value Diagram Example Of Ppt
This is a net promoter score value diagram example of ppt. This is a ten stage process. The stages in this process are nps, percentage of promoters, percentage of detractors, detractors, passive, promoter, not at all likely, natural, extremely likely.
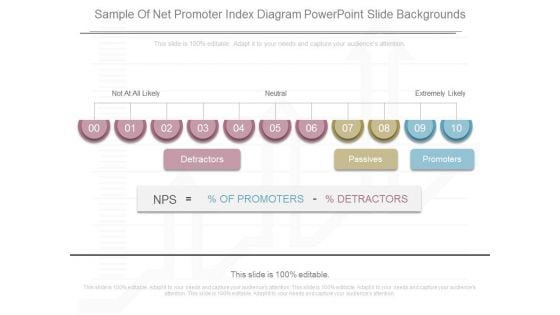
Sample Of Net Promoter Index Diagram Powerpoint Slide Backgrounds
This is a sample of net promoter index diagram powerpoint slide backgrounds. This is a ten stage process. The stages in this process are not at all likely, neutral, extremely likely, detractors, passives, promoters, nps, percentage detractors, percentage of promoters.
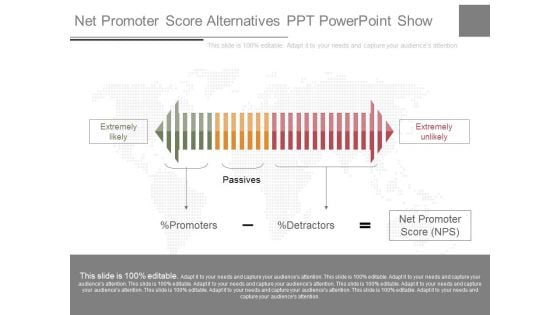
Net Promoter Score Alternatives Ppt Powerpoint Show
This is a net promoter score alternatives ppt powerpoint show. This is a one stage process. The stages in this process are extremely likely, passives, extremely unlikely, percentage of promoters, percentage of detractors, net promoter score nps.
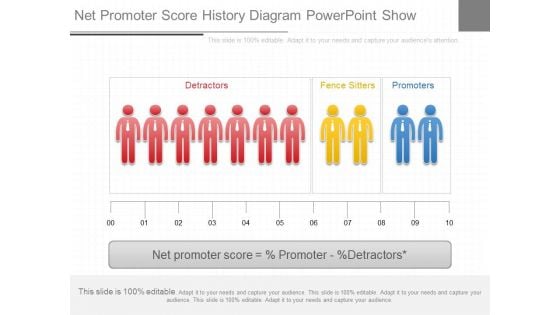
Net Promoter Score History Diagram Powerpoint Show
This is a net promoter score history diagram powerpoint show. This is a ten stage process. The stages in this process are detractors, fence sitters, promoters, net promoter score, percentage promoter, percentage detractors.
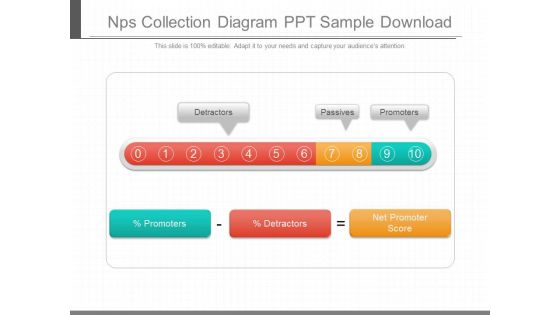
Nps Collection Diagram Ppt Sample Download
This is a nps collection diagram ppt sample download. This is a ten stage process. The stages in this process are detractors, passives, promoters, percentage promoters, percentage detractors, net promoter score.
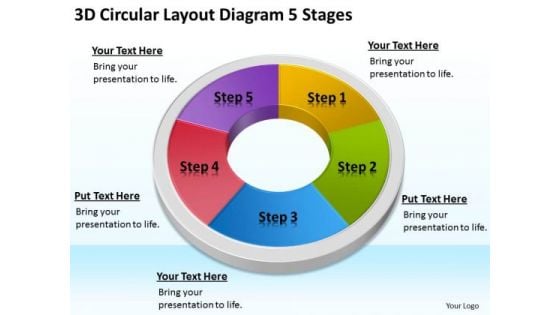
3d Circular Layout Diagram 5 Stages Network Marketing Business Plan PowerPoint Slides
We present our 3d circular layout diagram 5 stages network marketing business plan PowerPoint Slides.Download and present our Process and Flows PowerPoint Templates because You should Bet on your luck with our PowerPoint Templates and Slides. Be assured that you will hit the jackpot. Present our Flow Charts PowerPoint Templates because You can safely bank on our PowerPoint Templates and Slides. They will provide a growth factor to your valuable thoughts. Download and present our Ring Charts PowerPoint Templates because Our PowerPoint Templates and Slides will let your team Walk through your plans. See their energy levels rise as you show them the way. Present our Marketing PowerPoint Templates because Our PowerPoint Templates and Slides help you meet the demand of the Market. Just browse and pick the slides that appeal to your intuitive senses. Download our Success PowerPoint Templates because you can Add colour to your speech with our PowerPoint Templates and Slides. Your presentation will leave your audience speechless.Use these PowerPoint slides for presentations relating to Account, accounting, analyzing, business, calculate, chart, circle, concept, data, diagram, display, division, economy, five, finance, financial, graph, graphic, growth, illustration, information, market, marketing, part, partition, percentage, performance, pie, piece, planning, portion,presentation, profit, progress, report, round, sales, shape, slice, statistic, stock, success, survey, symbol, wealth. The prominent colors used in the PowerPoint template are Purple, Green lime, Blue light. Feel free to air your views. Get that allowance with our 3d Circular Layout Diagram 5 Stages Network Marketing Business Plan PowerPoint Slides.
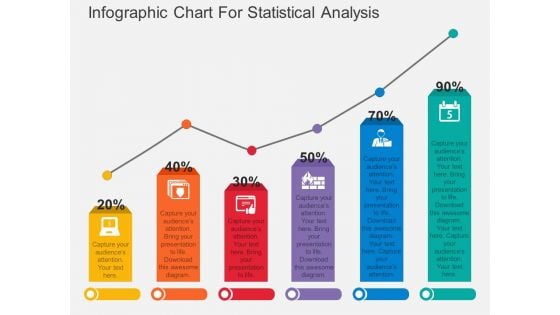
Infographic Chart For Statistical Analysis Powerpoint Template
Download this exclusive business diagram to display statistical analysis. This PowerPoint template contains bar chart with percentage values. This diagram is useful for business presentations.
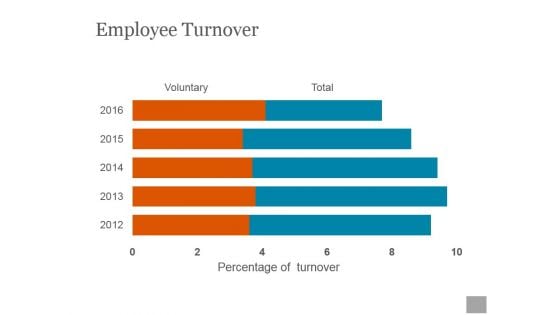
Employee Turnover Ppt PowerPoint Presentation Designs
This is a employee turnover ppt powerpoint presentation designs. This is a five stage process. The stages in this process are voluntary, percentage of turnover, total.
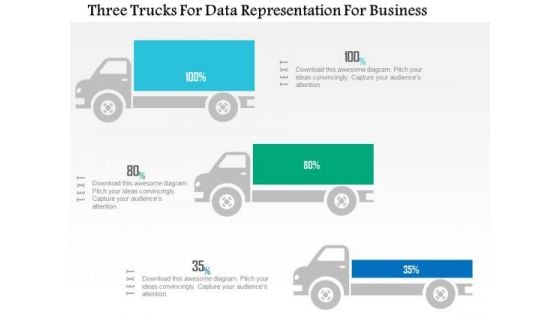
Business Diagram Three Trucks For Data Representation For Business PowerPoint Slide
This business diagram displays three trucks graphic. This diagram contains trucks for percentage value growth. Use this diagram to display business growth over a period of time.
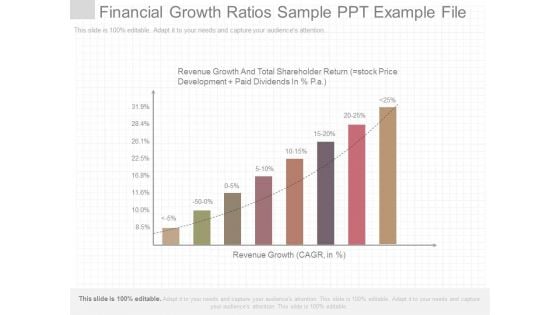
Financial Growth Ratios Sample Ppt Example File
This is a financial growth ratios sample ppt example file. This is a eight stage process. The stages in this process are revenue growth and total shareholder return stock price development paid dividends in percentage p a, revenue growth cagr in percentage.
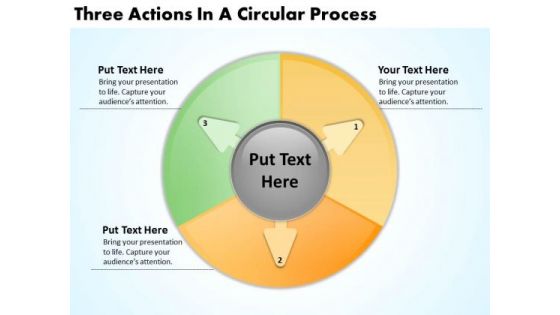
Three Actions In Circular Process Business Plans Sample PowerPoint Templates
We present our three actions in circular process business plans sample PowerPoint templates.Download and present our Flow Charts PowerPoint Templates because It is Aesthetically crafted by artistic young minds. Our PowerPoint Templates and Slides are designed to display your dexterity. Present our Arrows PowerPoint Templates because our PowerPoint Templates and Slides are the string of your bow. Fire of your ideas and conquer the podium. Present our Process and Flows PowerPoint Templates because You can Rise to the occasion with our PowerPoint Templates and Slides. You will bring your audience on their feet in no time. Download and present our Marketing PowerPoint Templates because It will Give impetus to the hopes of your colleagues. Our PowerPoint Templates and Slides will aid you in winning their trust. Download our Business PowerPoint Templates because Our PowerPoint Templates and Slides help you pinpoint your timelines. Highlight the reasons for your deadlines with their use.Use these PowerPoint slides for presentations relating to Analyzing, business, capital, commerce, communication, company, decrease, descending, direction, earnings, economic, economy, finance, financial, graph,grow, growth, index, information, investment, leader, manage, management, marketing, money, organization, part, partition, percentage, pie, piechart, graph, piece, plan, presentation, process, profit, progress, report, resource, results, selling, slice, statistic, success, system, team, three. The prominent colors used in the PowerPoint template are Gray, Yellow, Green lime. Explanations are a cinch with our Three Actions In Circular Process Business Plans Sample PowerPoint Templates. Your thoughts will be easily accepted.
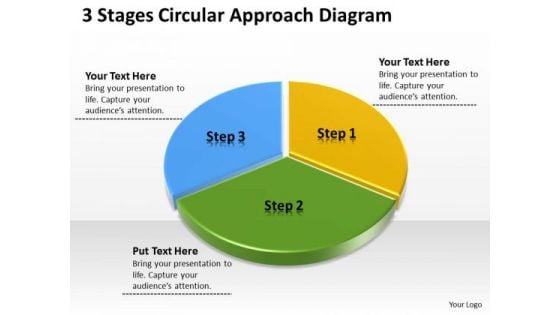
3 Stages Circular Approach Diagram Example Of Business Plan PowerPoint Slides
We present our 3 stages circular approach diagram example of business plan PowerPoint Slides.Present our Circle Charts PowerPoint Templates because Our PowerPoint Templates and Slides will let you Leave a lasting impression to your audiences. They possess an inherent longstanding recall factor. Present our Process and Flows PowerPoint Templates because Our PowerPoint Templates and Slides are specially created by a professional team with vast experience. They diligently strive to come up with the right vehicle for your brilliant Ideas. Present our Business PowerPoint Templates because Our PowerPoint Templates and Slides will let you Leave a lasting impression to your audiences. They possess an inherent longstanding recall factor. Present our Shapes PowerPoint Templates because These PowerPoint Templates and Slides will give the updraft to your ideas. See them soar to great heights with ease. Use our Success PowerPoint Templates because You have a driving passion to excel in your field. Our PowerPoint Templates and Slides will prove ideal vehicles for your ideas.Use these PowerPoint slides for presentations relating to Analyzing, business, capital, commerce, communication, company, decrease, descending, direction, earnings, economic, economy, finance, financial, graph,grow, growth, index, information, investment, leader, manage, management, marketing, money, organization, part, partition, percentage, pie, piechart, graph, piece, plan, presentation, process, profit, progress, report, resource, results, selling, slice, statistic, success, system, team, three, theory. The prominent colors used in the PowerPoint template are Blue light, Green, Yellow. Our 3 Stages Circular Approach Diagram Example Of Business Plan PowerPoint Slides will give a clarion call. People will fall over each other to come hear you.
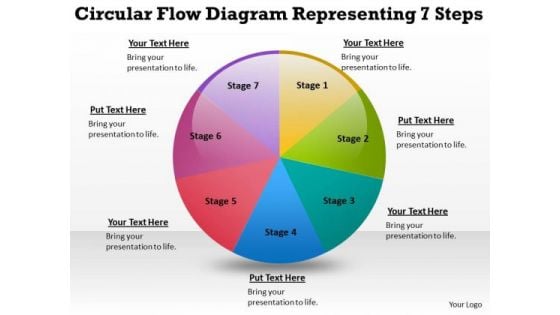
Circular Flow Diagram Representing 7 Steps Business Plan For Startup PowerPoint Templates
We present our circular flow diagram representing 7 steps business plan for startup PowerPoint templates.Download our Circle Charts PowerPoint Templates because you should Whip up a frenzy with our PowerPoint Templates and Slides. They will fuel the excitement of your team. Use our Process and Flows PowerPoint Templates because They will bring a lot to the table. Their alluring flavours will make your audience salivate. Download our Marketing PowerPoint Templates because You can Hit a home run with our PowerPoint Templates and Slides. See your ideas sail into the minds of your audience. Use our Shapes PowerPoint Templates because Our PowerPoint Templates and Slides has conjured up a web of all you need with the help of our great team. Use them to string together your glistening ideas. Present our Success PowerPoint Templates because Our PowerPoint Templates and Slides offer you the needful to organise your thoughts. Use them to list out your views in a logical sequence.Use these PowerPoint slides for presentations relating to Capital, commerce, communication, company, decrease, descending, direction, earnings, economic, economy, finance, financial, graph,grow, growth, index, information, investment, leader, manage, management, marketing, money, organization, part, partition, percentage, pie, piechart, graph, piece, plan, presentation, process, profit, progress, report, resource, results, selling, slice, seven, success, system, team, theory. The prominent colors used in the PowerPoint template are Pink, Red, Green. Our Circular Flow Diagram Representing 7 Steps Business Plan For Startup PowerPoint Templates will be your lucky charm. They will deliver for you on your fateful day.
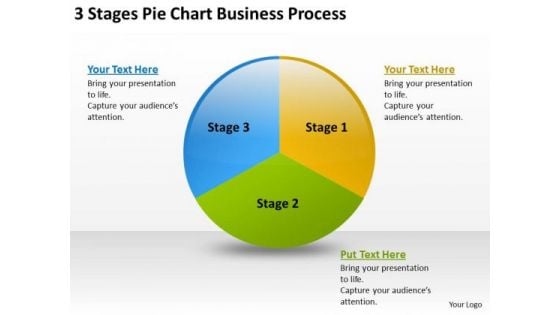
Chart Business PowerPoint Theme Process Writing Simple Plan Templates
We present our chart business powerpoint theme process writing simple plan templates.Download and present our Circle Charts PowerPoint Templates because Our PowerPoint Templates and Slides are aesthetically designed to attract attention. We gaurantee that they will grab all the eyeballs you need. Download and present our Flow Charts PowerPoint Templates because It is Aesthetically crafted by artistic young minds. Our PowerPoint Templates and Slides are designed to display your dexterity. Present our Business PowerPoint Templates because You can Stir your ideas in the cauldron of our PowerPoint Templates and Slides. Cast a magic spell on your audience. Download and present our Shapes PowerPoint Templates because you can Break through with our PowerPoint Templates and Slides. Bring down the mental barriers of your audience. Present our Marketing PowerPoint Templates because It can Bubble and burst with your ideas.Use these PowerPoint slides for presentations relating to Analyzing, business, capital, commerce, communication, company, decrease, descending, direction, earnings, economic, economy, finance, financial, graph,grow, growth, index, information, investment, leader, manage, management, marketing, money, organization, part, partition, percentage, pie, piechart, graph, piece, plan, presentation, process, profit, progress, report, resource, results, selling, slice, statistic, success, system, team, theory. The prominent colors used in the PowerPoint template are Green, Yellow, Blue. Set up the base with our Chart Business PowerPoint Theme Process Writing Simple Plan Templates. You will soon celebrate success.
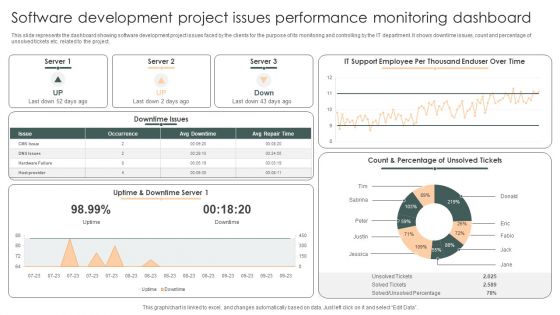
Software Development Project Issues Performance Monitoring Dashboard Structure PDF
This slide represents the dashboard showing software development project issues faced by the clients for the purpose of its monitoring and controlling by the IT department. It shows downtime issues, count and percentage of unsolved tickets etc. related to the project.Showcasing this set of slides titled Software Development Project Issues Performance Monitoring Dashboard Structure PDF. The topics addressed in these templates are Downtime Issues, Count Percentage, Unsolved Percentage. All the content presented in this PPT design is completely editable. Download it and make adjustments in color, background, font etc. as per your unique business setting.
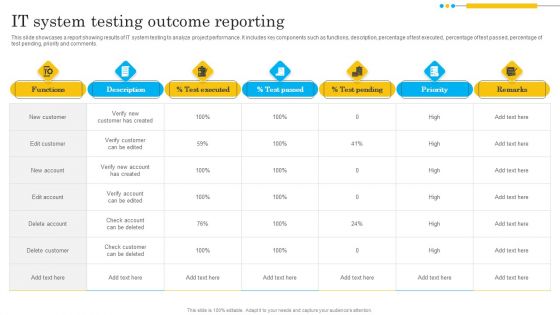
IT System Testing Outcome Reporting Formats PDF
This slide showcases a report showing results of IT system testing to analyze project performance. It includes key components such as functions, description, percentage of test executed, percentage of test passed, percentage of test pending, priority and comments. Showcasing this set of slides titled IT System Testing Outcome Reporting Formats PDF. The topics addressed in these templates are Verify Customer Created, Check Account, Check Customer. All the content presented in this PPT design is completely editable. Download it and make adjustments in color, background, font etc. as per your unique business setting.
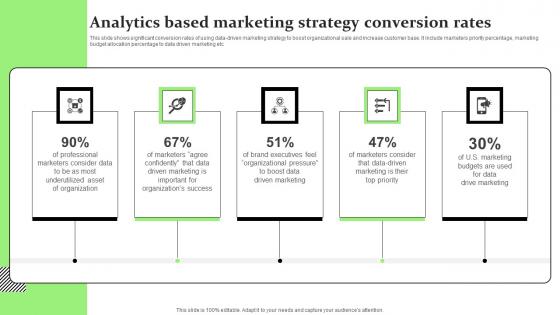
Analytics Based Marketing Strategy Conversion Rates Ideas Pdf
This slide shows significant conversion rates of using data driven marketing strategy to boost organizational sale and increase customer base. It include marketers priority percentage, marketing budget allocation percentage to data driven marketing etc.Pitch your topic with ease and precision using this Analytics Based Marketing Strategy Conversion Rates Ideas Pdf This layout presents information on Organizations Success, Driven Marketing, Organizational Pressure It is also available for immediate download and adjustment. So, changes can be made in the color, design, graphics or any other component to create a unique layout. This slide shows significant conversion rates of using data driven marketing strategy to boost organizational sale and increase customer base. It include marketers priority percentage, marketing budget allocation percentage to data driven marketing etc.
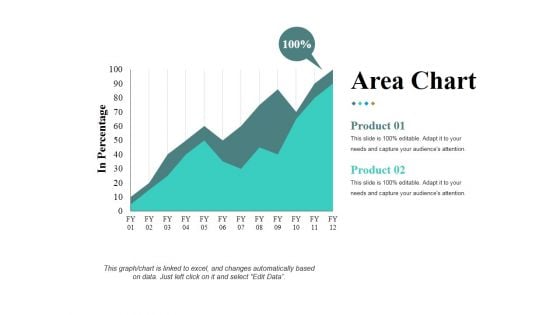
Area Chart Ppt PowerPoint Presentation Infographic Template Samples
This is a area chart ppt powerpoint presentation infographic template samples. This is a two stage process. The stages in this process are in percentage product, business, marketing, growth.
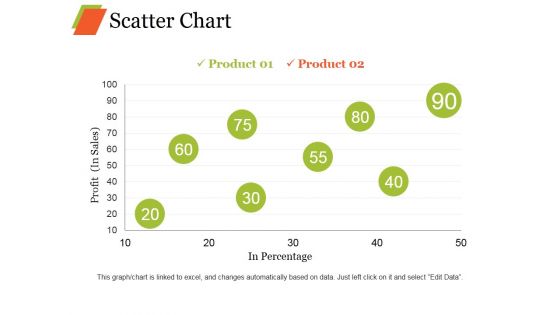
Scatter Chart Ppt PowerPoint Presentation Professional Graphic Images
This is a scatter chart ppt powerpoint presentation professional graphic images. This is a eight stage process. The stages in this process are product, profit, in percentage growth, business.

Stakeholders Fund And Market Analysis Bar Graph Powerpoint Slide Information
This is a stakeholders fund and market analysis bar graph powerpoint slide information. This is a five stage process. The stages in this process are shareholders funds, market capitalization, market capitalization as a percentage of cse market capitalization.
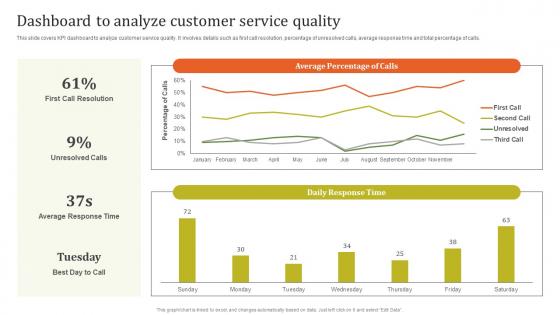
Dashboard To Analyze Customer Executing Effective Quality Enhancement Mockup Pdf
This slide covers KPI dashboard to analyze customer service quality. It involves details such as first call resolution, percentage of unresolved calls, average response time and total percentage of calls. From laying roadmaps to briefing everything in detail, our templates are perfect for you. You can set the stage with your presentation slides. All you have to do is download these easy to edit and customizable templates. Dashboard To Analyze Customer Executing Effective Quality Enhancement Mockup Pdf will help you deliver an outstanding performance that everyone would remember and praise you for. Do download this presentation today. This slide covers KPI dashboard to analyze customer service quality. It involves details such as first call resolution, percentage of unresolved calls, average response time and total percentage of calls.
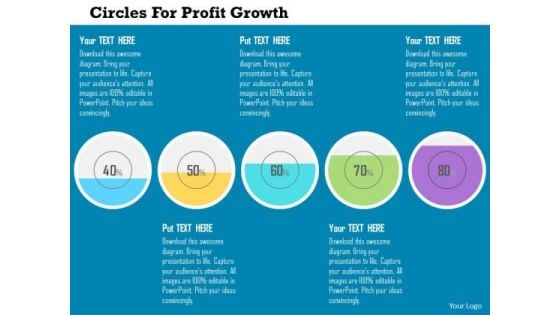
Business Diagram Circles For Profit Growth Presentation Template
This diagram displays four text circles for profit growth. This business diagram has been designed with graphic of circles with percentage ratios. Use this diagram to depict business planning process in your presentations.
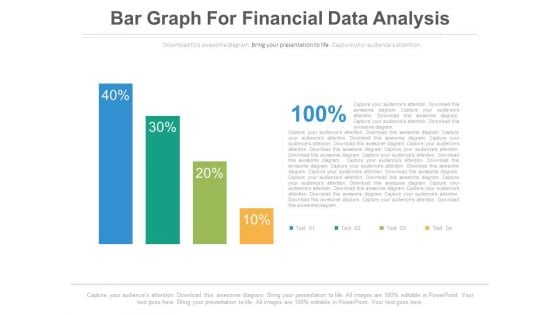
Bar Graph For Profit Growth Analysis Powerpoint Slides
This PowerPoint template has been designed with bar graph with percentage values. This diagram is useful to exhibit profit growth analysis. This diagram slide can be used to make impressive presentations.
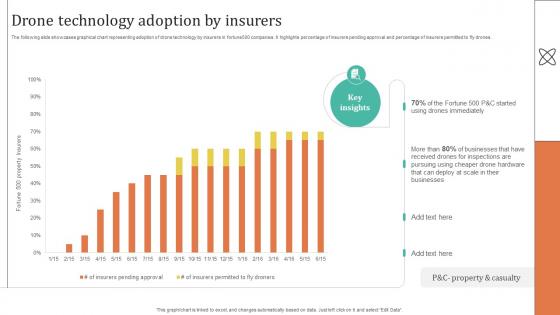
Improving Customer Satisfaction Drone Technology Adoption By Insurers
The following slide showcases graphical chart representing adoption of drone technology by insurers in fortune500 companies. It highlights percentage of insurers pending approval and percentage of insurers permitted to fly drones. Coming up with a presentation necessitates that the majority of the effort goes into the content and the message you intend to convey. The visuals of a PowerPoint presentation can only be effective if it supplements and supports the story that is being told. Keeping this in mind our experts created Improving Customer Satisfaction Drone Technology Adoption By Insurers to reduce the time that goes into designing the presentation. This way, you can concentrate on the message while our designers take care of providing you with the right template for the situation. The following slide showcases graphical chart representing adoption of drone technology by insurers in fortune500 companies. It highlights percentage of insurers pending approval and percentage of insurers permitted to fly drones.
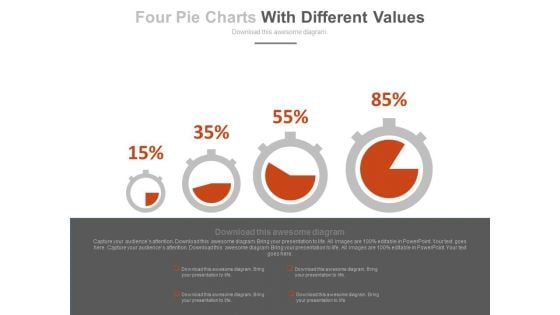
Dashboard With Increasing Values Powerpoint Slides
This innovative, stunningly beautiful dashboard has been designed for data visualization. It contains pie charts with increasing percentage values. This PowerPoint template helps to display your information in a useful, simple and uncluttered way.
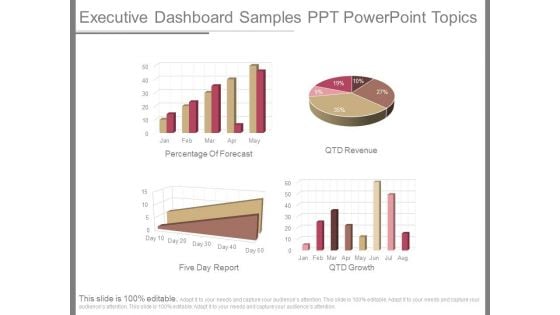
Executive Dashboard Samples Ppt Powerpoint Topics
This is a executive dashboard samples ppt powerpoint topics. This is a four stage process. The stages in this process are percentage of forecast, qtd revenue, five day report, qtd growth
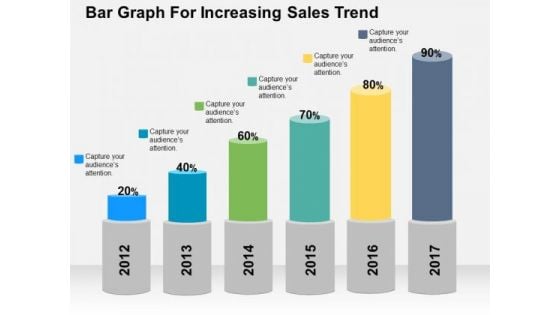
Bar Graph For Increasing Sales Trend PowerPoint Template
Deliver amazing presentations with our above template showing bar graph with percentage values. You may download this slide to depict increase in sales trends. Capture the attention of your audience using this diagram.
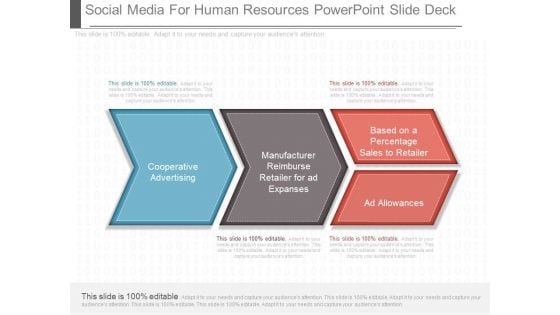
Social Media For Human Resources Powerpoint Slide Deck
This is a social media for human resources powerpoint slide deck. This is a four stage process. The stages in this process are cooperative advertising, manufacturer reimburse retailer for ad expanses, based on a percentage sales to retailer, ad allowances.
Business Diagram Human Icons With Bubbles And Different Icons Inside PowerPoint Slide
This diagram displays graph with percentage value growth. This business slide is suitable to present and compare business data. Use this diagram to build professional presentations for your viewers.
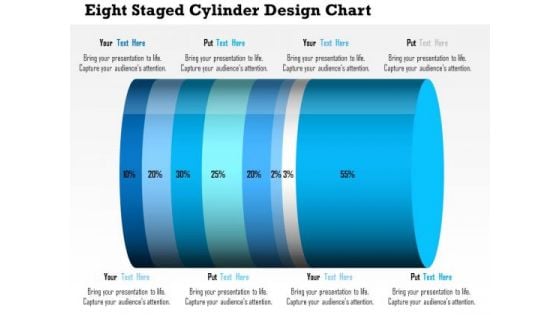
Business Daigram Eight Staged Cylinder Design Chart Presentation Templets
This business diagram contains eight staged cylinder design chart with percentage ratio. Download this diagram to display financial analysis. Use this diagram to make business and marketing related presentations.
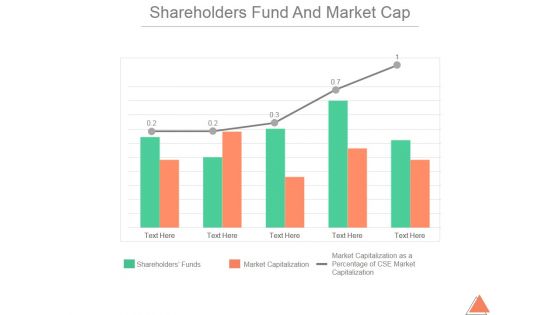
Shareholders Fund And Market Cap Ppt PowerPoint Presentation Guidelines
This is a shareholders fund and market cap ppt powerpoint presentation guidelines. This is a five stage process. The stages in this process are shareholders funds, market capitalization, market capitalization as a percentage of cse market capitalization.

Stock Photo Pyramid Of Balls With Percent Symbols Pwerpoint Slide
This image has been crafted for displaying the concept of discount and leadership. This image contains the graphic of metal balls with percentage symbol on each ball. Use this image and build a unique presentation for business and marketing topics.

Banking Concept Financial PowerPoint Templates And PowerPoint Backgrounds 0211
Microsoft PowerPoint Template and Background with money and percentage symbol in hands Add on the colours with our Banking Concept Financial PowerPoint Templates And PowerPoint Backgrounds 0211. Give your views a decorative look.
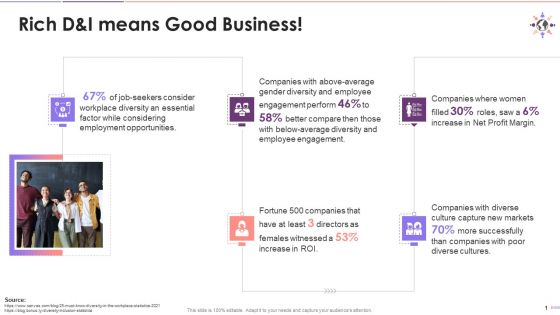
Rich Diversity And Inclusion Benefits Business Training Ppt
This slide provides five major quantitative figures to prove that rich D and I indeed means good business. The most powerful, example, perhaps, is that diverse and inclusive businesses capture new markets 70 percentage more successfully.
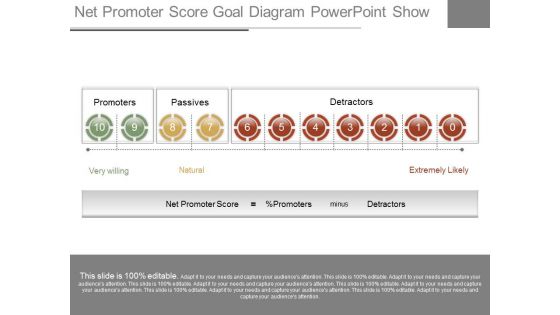
Net Promoter Score Goal Diagram Powerpoint Show
This is a net promoter score goal diagram powerpoint show. This is a ten stage process. The stages in this process are promoters, passives, detractors, very willing, natural, extremely likely, net promoter score, percentage promoters, minus.
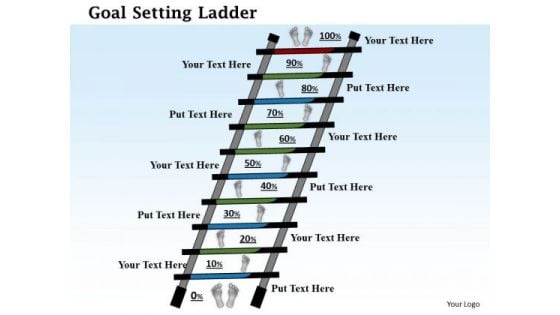
Business Framework Goal Setting Ladder PowerPoint Presentation
This image slide has been designed to express views on goals, targets and achievements. This image slide displays goal setting ladder with percentage steps. This image slide will enhance the quality of your presentations.
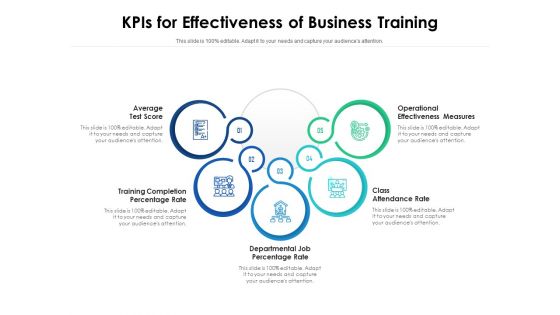
Kpis For Effectiveness Of Business Training Ppt PowerPoint Presentation Ideas Summary PDF
Persuade your audience using this kpis for effectiveness of business training ppt powerpoint presentation ideas summary pdf. This PPT design covers five stages, thus making it a great tool to use. It also caters to a variety of topics including average test score, training completion percentage rate, departmental job percentage rate, class attendance rate, operational effectiveness measures. Download this PPT design now to present a convincing pitch that not only emphasizes the topic but also showcases your presentation skills.
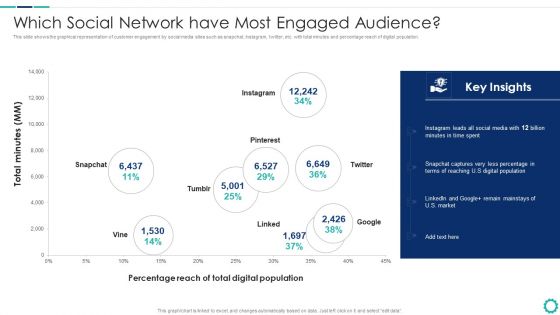
Creating Successful Strategies To Enhance Customer Experience Which Social Network Mockup PDF
This slide shows the graphical representation of customer engagement by social media sites such as snapchat, Instagram, twitter, etc. with total minutes and percentage reach of digital population.Deliver and pitch your topic in the best possible manner with this Creating Successful Strategies To Enhance Customer Experience Which Social Network Mockup PDF Use them to share invaluable insights on Digital Population, Percentage Reach, Digital Population and impress your audience. This template can be altered and modified as per your expectations. So, grab it now.
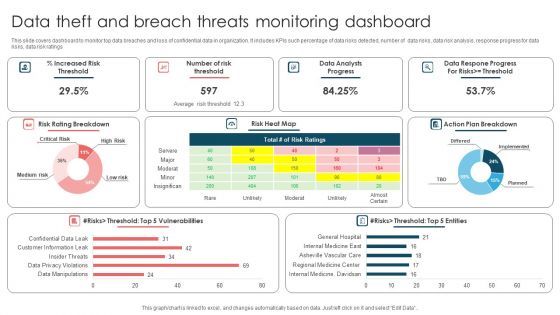
Data Theft And Breach Threats Monitoring Dashboard Ppt Outline Designs PDF
This slide covers dashboard to monitor top data breaches and loss of confidential data in organization. It includes KPIs such percentage of data risks detected, number of data risks, data risk analysis, response progress for data risks, data risk ratings. Showcasing this set of slides titled Data Theft And Breach Threats Monitoring Dashboard Ppt Outline Designs PDF. The topics addressed in these templates are Number Risk Threshold, Data Analysts Progress, Action Plan Breakdown. All the content presented in this PPT design is completely editable. Download it and make adjustments in color, background, font etc. as per your unique business setting.

Patient Retention Approaches For Improving Brand Loyalty Current Patient Satisfaction Status Graphics PDF
This slide shows the current Patient Satisfaction Status at the medical facility. This slide shows the percentage of patients that are satisfied and percentage that are dissatisfied at a medical facility due to various reasons.Deliver and pitch your topic in the best possible manner with this patient retention approaches for improving brand loyalty current patient satisfaction status graphics pdf Use them to share invaluable insights on percentages patients, patient satisfaction status, dissatisfied are around and impress your audience. This template can be altered and modified as per your expectations. So, grab it now.
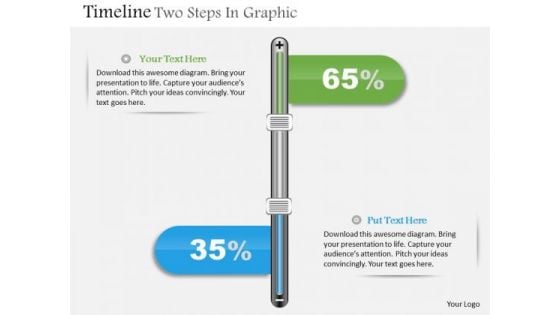
Business Diagram Timeline Two Steps In Graphic Presentation Template
This slide contains timeline two steps in graphic presentation template. This business diagram has been designed with sign board with percentages. Use this slide to depict percentage growth in business profits. Download this diagram profit growth representation in your business presentations.
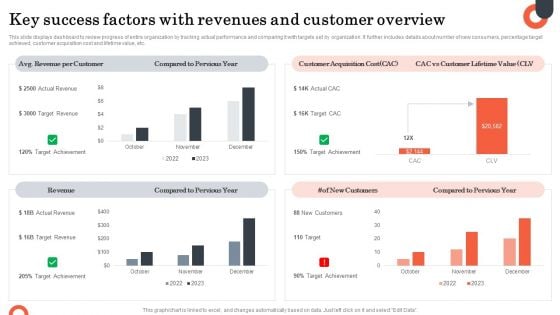
Key Success Factors With Revenues And Customer Overview Diagrams PDF
This slide displays dashboard to review progress of entire organization by tracking actual performance and comparing it with targets set by organization. It further includes details about number of new consumers, percentage target achieved, customer acquisition cost and lifetime value, etc. Showcasing this set of slides titled Key Success Factors With Revenues And Customer Overview Diagrams PDF. The topics addressed in these templates are Compared Pervious Year, Customer Acquisition Cost. All the content presented in this PPT design is completely editable. Download it and make adjustments in color, background, font etc. as per your unique business setting.
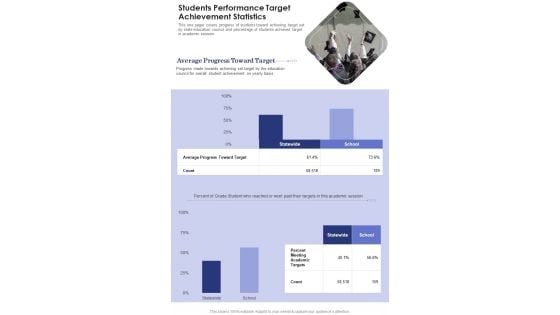
Students Performance Target Achievement Statistics One Pager Documents
This one pager covers progress of students toward achieving target set by state education council and percentage of students achieved target in academic session. Presenting you an exemplary Students Performance Target Achievement Statistics One Pager Documents. Our one-pager comprises all the must-have essentials of an inclusive document. You can edit it with ease, as its layout is completely editable. With such freedom, you can tweak its design and other elements to your requirements. Download this Students Performance Target Achievement Statistics One Pager Documents brilliant piece now.
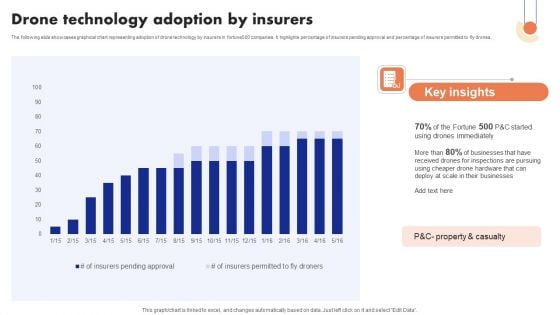
Implementation Of Digital Advancement Techniques Drone Technology Adoption Ideas PDF
The following slide showcases graphical chart representing adoption of drone technology by insurers in fortune500 companies. It highlights percentage of insurers pending approval and percentage of insurers permitted to fly drones. Slidegeeks is one of the best resources for PowerPoint templates. You can download easily and regulate Implementation Of Digital Advancement Techniques Drone Technology Adoption Ideas PDF for your personal presentations from our wonderful collection. A few clicks is all it takes to discover and get the most relevant and appropriate templates. Use our Templates to add a unique zing and appeal to your presentation and meetings. All the slides are easy to edit and you can use them even for advertisement purposes.
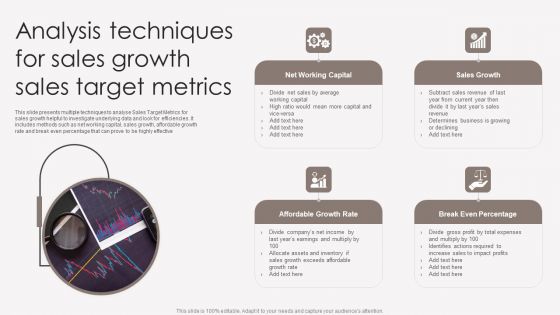
Analysis Techniques For Sales Growth Sales Target Metrics Pictures PDF
This slide presents multiple techniques to analyse Sales Target Metrics for sales growth helpful to investigate underlying data and look for efficiencies. It includes methods such as net working capital, sales growth, affordable growth rate and break even percentage that can prove to be highly effective. Presenting Analysis Techniques For Sales Growth Sales Target Metrics Pictures PDF to dispense important information. This template comprises four stages. It also presents valuable insights into the topics including Net Working Capital, Affordable Growth Rate, Break Even Percentage. This is a completely customizable PowerPoint theme that can be put to use immediately. So, download it and address the topic impactfully.
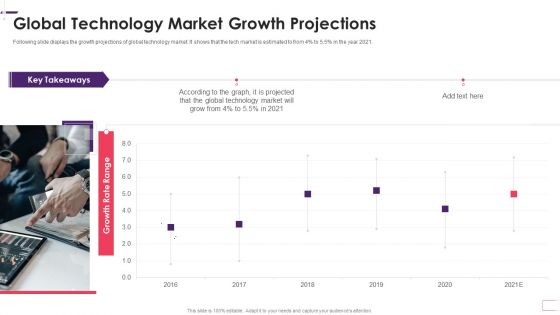
Enhancing Stp Strategies For A Successful Market Promotion Global Technology Market Template PDF
Following slide displays the growth projections of global technology market. It shows that the tech market is estimated to from 4 percentage to 5.5 percentage in the year 2021. Presenting enhancing stp strategies for a successful market promotion global technology market template pdf to provide visual cues and insights. Share and navigate important information on one stages that need your due attention. This template can be used to pitch topics like global, technology, market. In addtion, this PPT design contains high resolution images, graphics, etc, that are easily editable and available for immediate download.
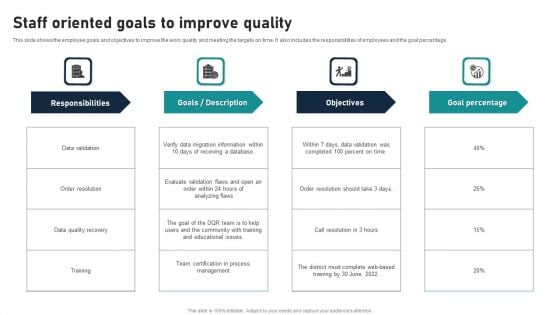
Staff Oriented Goals To Improve Quality Introduction PDF
This slide shows the employee goals and objectives to improve the work quality and meeting the targets on time. It also includes the responsibilities of employees and the goal percentage. Pitch your topic with ease and precision using this Staff Oriented Goals To Improve Quality Introduction PDF. This layout presents information on Responsibilities, Objectives, Goal Percentage . It is also available for immediate download and adjustment. So, changes can be made in the color, design, graphics or any other component to create a unique layout.
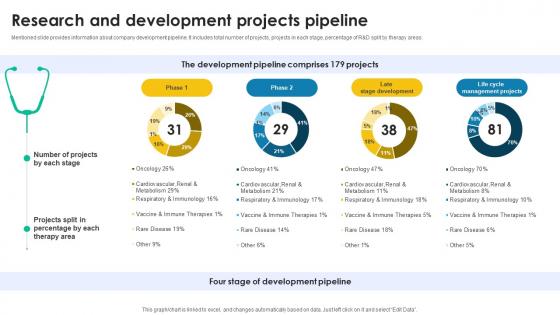
Research And Development Projects Pipeline Medical Research And Development Company Profile CP SS V
Mentioned slide provides information about company development pipeline. It includes total number of projects, projects in each stage, percentage of RandD split by therapy areas. Find a pre-designed and impeccable Research And Development Projects Pipeline Medical Research And Development Company Profile CP SS V. The templates can ace your presentation without additional effort. You can download these easy-to-edit presentation templates to make your presentation stand out from others. So, what are you waiting for Download the template from Slidegeeks today and give a unique touch to your presentation. Mentioned slide provides information about company development pipeline. It includes total number of projects, projects in each stage, percentage of RandD split by therapy areas.
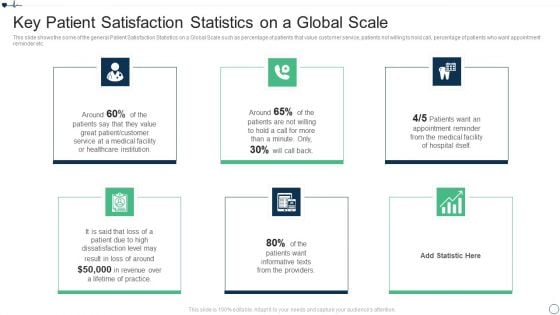
Patient Retention Approaches For Improving Brand Loyalty Statistics On A Global Scale Guidelines PDF
This slide shows the some of the general Patient Satisfaction Statistics on a Global Scale such as percentage of patients that value customer service, patients not willing to hold call, percentage of patients who want appointment reminder etc. Presenting patient retention approaches for improving brand loyalty statistics on a global scale guidelines pdf to provide visual cues and insights. Share and navigate important information on six stages that need your due attention. This template can be used to pitch topics like appointment reminder, healthcare institution, dissatisfaction level In addtion, this PPT design contains high resolution images, graphics, etc, that are easily editable and available for immediate download.
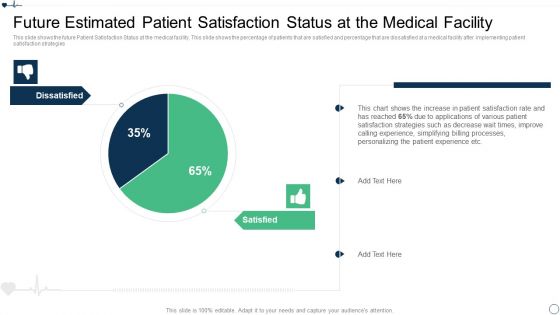
Patient Retention Approaches For Improving Brand Loyalty Future Estimated Patient Information PDF
This slide shows the future Patient Satisfaction Status at the medical facility. This slide shows the percentage of patients that are satisfied and percentage that are dissatisfied at a medical facility after implementing patient satisfaction strategies Deliver and pitch your topic in the best possible manner with this patient retention approaches for improving brand loyalty future estimated patient information pdf Use them to share invaluable insights on processes personalizing, experience simplifying, patient satisfaction and impress your audience. This template can be altered and modified as per your expectations. So, grab it now.
Online Business Client Experience Improvement Strategy Playbook Deploy Potential Attention Grabbing Offers For Users Icons PDF
This slide provides information regarding deployment of potential attention grabbing offers for users in terms of percentage off, buy one get one, customized promo codes, in stock availability and quick and free shipping. This is a Online Business Client Experience Improvement Strategy Playbook Deploy Potential Attention Grabbing Offers For Users Icons PDF template with various stages. Focus and dispense information on five stages using this creative set, that comes with editable features. It contains large content boxes to add your information on topics like Percentage Off, Customized Promo Codes, Quick And Free Shipping. You can also showcase facts, figures, and other relevant content using this PPT layout. Grab it now.
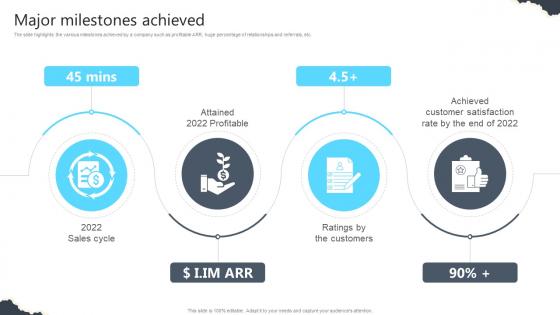
Major Milestones Achieved Real Estate Platform Investor Funding Elevator Pitch Deck
The slide highlights the various milestones achieved by a company such as profitable ARR, huge percentage of relationships and referrals, etc. If your project calls for a presentation, then Slidegeeks is your go-to partner because we have professionally designed, easy-to-edit templates that are perfect for any presentation. After downloading, you can easily edit Major Milestones Achieved Real Estate Platform Investor Funding Elevator Pitch Deck and make the changes accordingly. You can rearrange slides or fill them with different images. Check out all the handy templates The slide highlights the various milestones achieved by a company such as profitable ARR, huge percentage of relationships and referrals, etc.

Application Patient Satisfaction Tactics Enhance Clinical Results Key Patient Satisfaction Statistics Elements PDF
This slide shows the some of the general Patient Satisfaction Statistics on a Global Scale such as percentage of patients that value customer service, patients not willing to hold call, percentage of patients who want appointment reminder etc. This is a application patient satisfaction tactics enhance clinical results key patient satisfaction statistics elements pdf template with various stages. Focus and dispense information on six stages using this creative set, that comes with editable features. It contains large content boxes to add your information on topics like medical facility, customer service, healthcare, revenue. You can also showcase facts, figures, and other relevant content using this PPT layout. Grab it now.
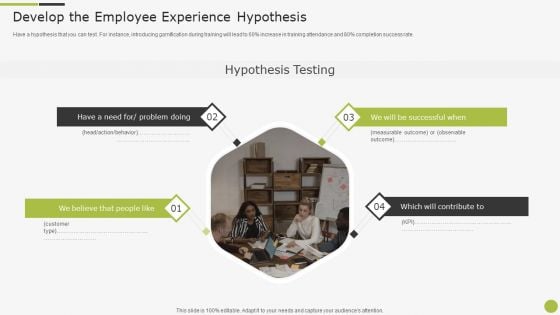
Sample To Create Best Personnel Experience Strategy Develop The Employee Experience Hypothesis Themes PDF
Have a hypothesis that you can test. For instance, introducing gamification during training will lead to 60 percentage increase in training attendance and 80 percentage completion success rate. This is a Sample To Create Best Personnel Experience Strategy Develop The Employee Experience Hypothesis Themes PDF template with various stages. Focus and dispense information on four stages using this creative set, that comes with editable features. It contains large content boxes to add your information on topics like Measurable Outcome, Customer. You can also showcase facts, figures, and other relevant content using this PPT layout. Grab it now.
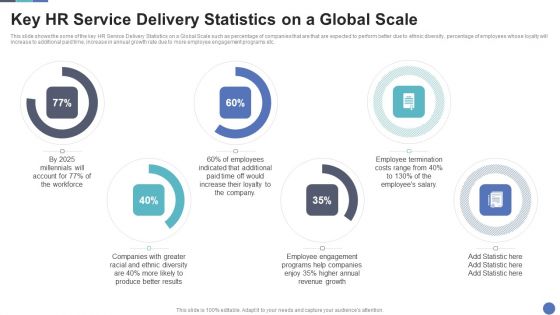
Key HR Service Delivery Statistics On A Global Scal Portrait PDF
This slide shows the some of the key HR Service Delivery Statistics on a Global Scale such as percentage of companies that are that are expected to perform better due to ethnic diversity, percentage of employees whose loyalty will increase to additional paid time, increase in annual growth rate due to more employee engagement programs etc. Deliver and pitch your topic in the best possible manner with this Key HR Service Delivery Statistics On A Global Scal Portrait PDF. Use them to share invaluable insights on Produce Better, Employee Engagement, Employee Termination and impress your audience. This template can be altered and modified as per your expectations. So, grab it now.
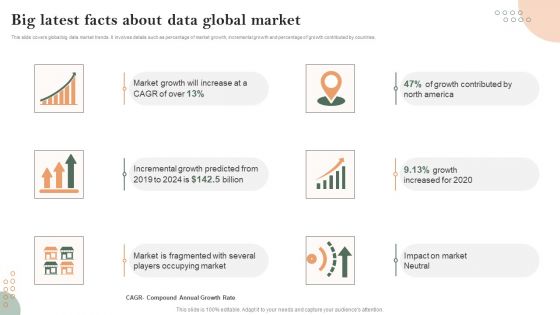
Big Latest Facts About Data Global Market Microsoft PDF
This slide covers global big data market trends. It involves details such as percentage of market growth, incremental growth and percentage of growth contributed by countries. Pitch your topic with ease and precision using this Big Latest Facts About Data Global Market Microsoft PDF. This layout presents information on Big Latest Facts, About Data Global Market. It is also available for immediate download and adjustment. So, changes can be made in the color, design, graphics or any other component to create a unique layout.
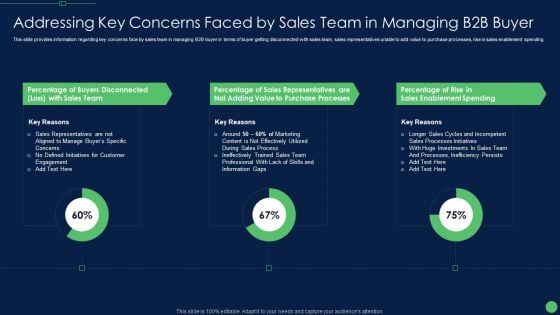
Addressing Key Concerns Faced By Sales Team In Managing B2B Buyer Inspiration PDF
This slide provides information regarding key concerns face by sales team in managing B2B buyer in terms of buyer getting disconnected with sales team, sales representatives unable to add value to purchase processes, rise in sales enablement spending.Deliver an awe inspiring pitch with this creative addressing key concerns faced by sales team in managing b2b buyer inspiration pdf bundle. Topics like percentage of buyers disconnected, percentage of sales representatives, sales enablement spending can be discussed with this completely editable template. It is available for immediate download depending on the needs and requirements of the user.
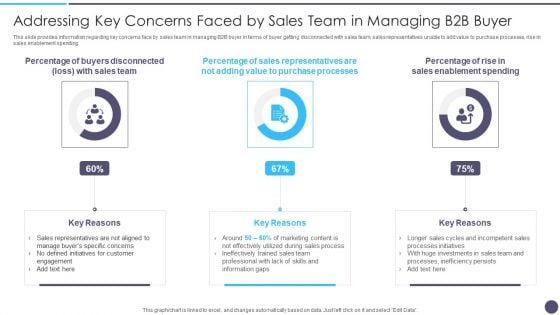
Addressing Key Concerns Faced By Sales Team In Managing B2B Buyer Designs PDF
This slide provides information regarding key concerns face by sales team in managing B2B buyer in terms of buyer getting disconnected with sales team, sales representatives unable to add value to purchase processes, rise in sales enablement spending. Deliver an awe inspiring pitch with this creative Addressing Key Concerns Faced By Sales Team In Managing B2B Buyer Designs PDF bundle. Topics like Percentage Of Buyers Disconnected, Percentage Of Sales Representatives, Enablement Spending can be discussed with this completely editable template. It is available for immediate download depending on the needs and requirements of the user.


 Continue with Email

 Home
Home


