Percentage
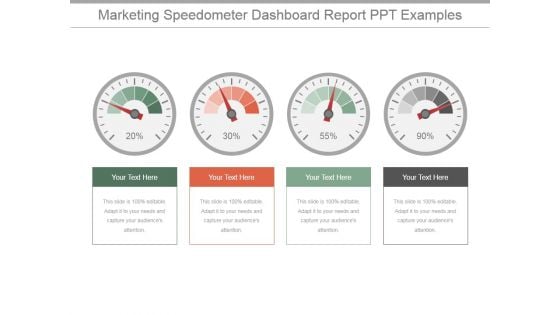
Marketing Speedometer Dashboard Report Ppt PowerPoint Presentation Designs Download
This is a marketing speedometer dashboard report ppt powerpoint presentation designs download. This is a four stage process. The stages in this process are dashboard, measurement, percentage, business, finance.
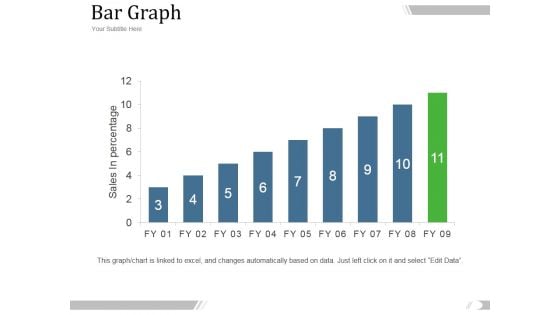
Bar Graph Ppt PowerPoint Presentation Introduction
This is a bar graph ppt powerpoint presentation introduction. This is a eleven stage process. The stages in this process are management, marketing, business, fy, graph, sales in percentage.
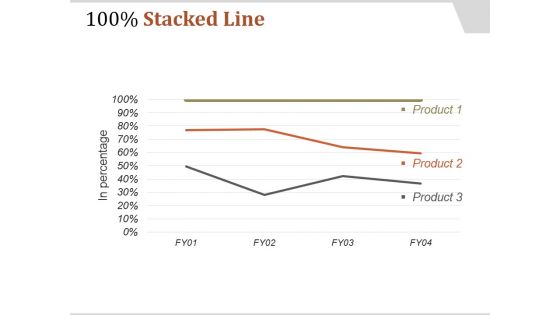
Stacked Line Template 1 Ppt PowerPoint Presentation Background Images
This is a stacked line template 1 ppt powerpoint presentation background images. This is a three stage process. The stages in this process are in percentage, product, business, management.
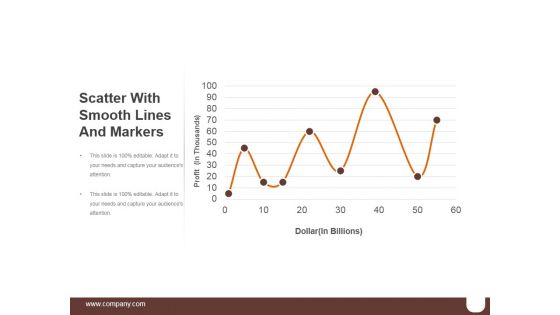
Scatter With Smooth Lines And Markers Ppt PowerPoint Presentation Ideas
This is a scatter with smooth lines and markers ppt powerpoint presentation ideas. This is a seven stage process. The stages in this process are business, marketing, percentage, success, finance.
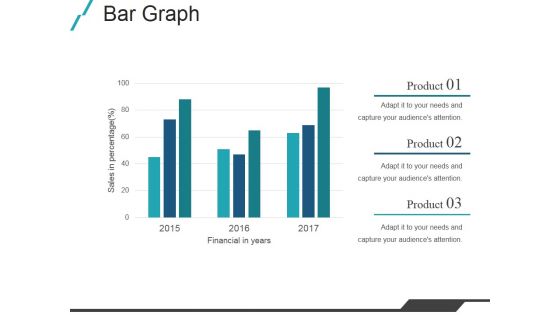
Bar Graph Ppt PowerPoint Presentation Slides Deck
This is a bar graph ppt powerpoint presentation slides deck. This is a three stage process. The stages in this process are financial in years, product, sales in percentage.
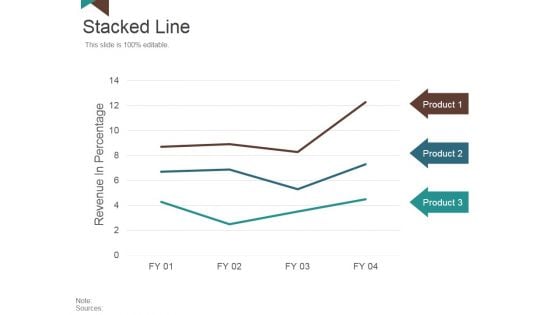
Stacked Line Ppt PowerPoint Presentation Professional Graphics
This is a stacked line ppt powerpoint presentation professional graphics. This is a three stage process. The stages in this process are revenue in percentage, product, business, marketing, success.
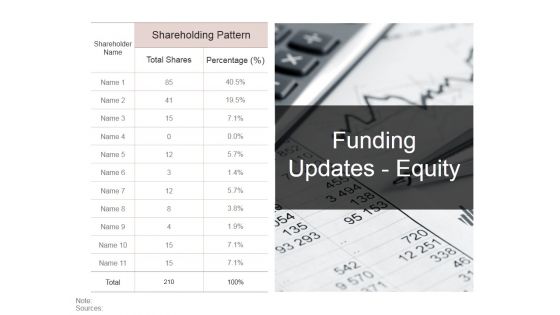
Funding Updates Equity Ppt PowerPoint Presentation Ideas Diagrams
This is a funding updates equity ppt powerpoint presentation ideas diagrams. This is a three stage process. The stages in this process are shareholder name, shareholding pattern, total shares, percentage.
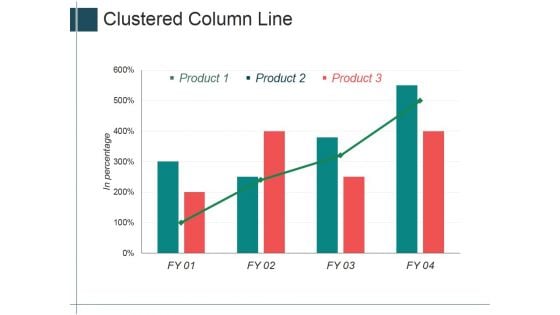
Clustered Column Line Ppt Powerpoint Presentation Ideas Inspiration
This is a clustered column line ppt powerpoint presentation ideas inspiration. This is a four stage process. The stages in this process are product, in percentage, graph, management, business.
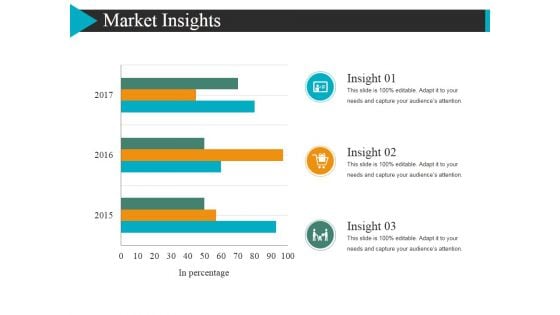
Market Insights Template 2 Ppt Powerpoint Presentation Pictures Gallery
This is a market insights template 2 ppt powerpoint presentation pictures gallery. This is a three stage process. The stages in this process are in percentage, insight, icons, strategy, business.
Scatter Chart Ppt PowerPoint Presentation Icon Elements
This is a scatter chart ppt powerpoint presentation icon elements. This is a nine stage process. The stages in this process are dollar in billions, sales in percentage, business, success.
Financial Highlights Ppt PowerPoint Presentation Icon Slide Download
This is a financial highlights ppt powerpoint presentation icon slide download. This is a three stage process. The stages in this process are percentage, business, strategy, management, finance, analysis.

business model template 2 ppt powerpoint presentation styles
This is a business model template 2 ppt powerpoint presentation styles styles. This is a three stage process. The stages in this process are business, marketing, strategy, management, model, percentage.
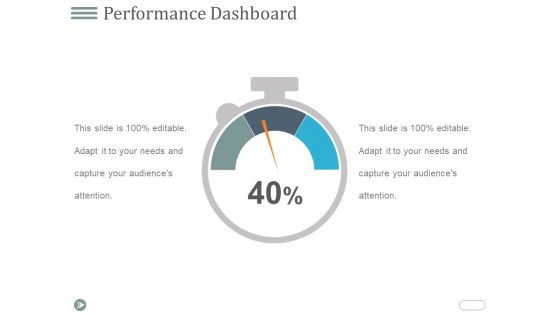
Performance Dashboard Ppt PowerPoint Presentation Visual Aids Example 2015
This is a performance dashboard ppt powerpoint presentation visual aids example 2015. This is a one stage process. The stages in this process are dashboard, percentage, business, marketing, strategy.
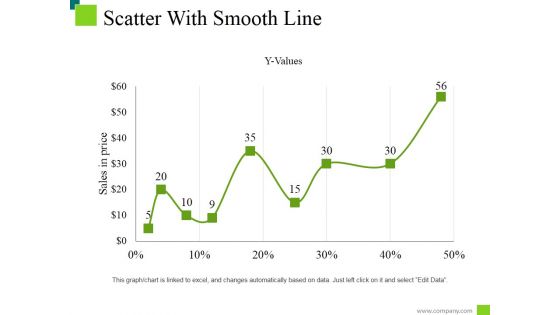
Scatter With Smooth Line Ppt PowerPoint Presentation Professional Display
This is a scatter with smooth line ppt powerpoint presentation professional display. This is a nine stage process. The stages in this process are sale price, business, marketing, percentage, finance.
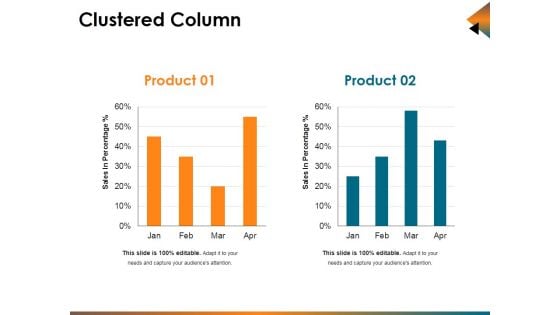
Clustered Column Ppt PowerPoint Presentation Infographic Template Background Designs
This is a clustered column ppt powerpoint presentation infographic template background designs. This is a two stage process. The stages in this process are sales in percentage, bar, business, marketing, planning.
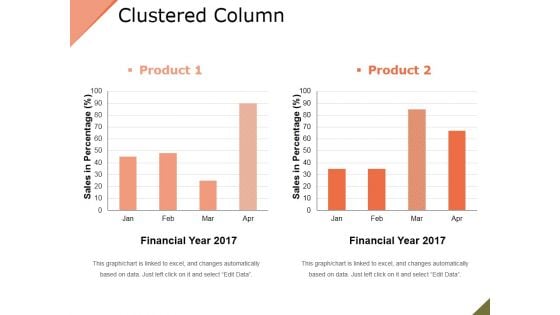
Clustered Column Ppt PowerPoint Presentation File Slide
This is a clustered column ppt powerpoint presentation file slide. This is a two stage process. The stages in this process are product, financial year, sales in percentage, bar graph.
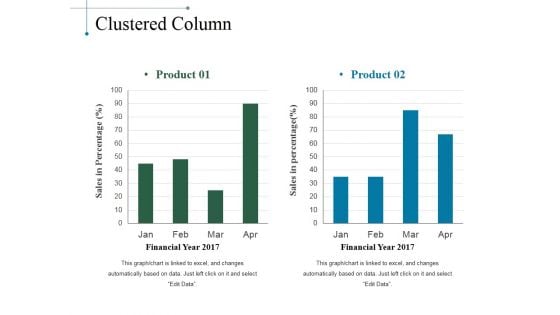
Clustered Column Ppt PowerPoint Presentation Slides Smartart
This is a clustered column ppt powerpoint presentation slides smartart. This is a two stage process. The stages in this process are product, sales in percentage, financial year, bar graph.
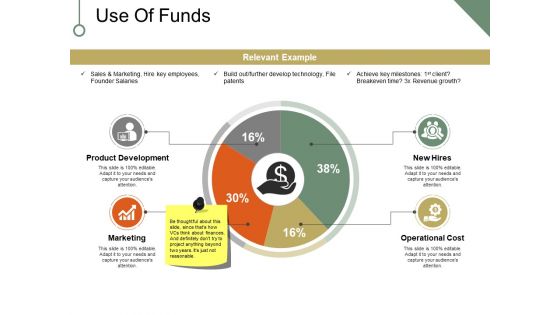
Use Of Funds Ppt PowerPoint Presentation Ideas Designs Download
This is a use of funds ppt powerpoint presentation ideas designs download. This is a four stage process. The stages in this process are product development, percentage, marketing, operational cost, new hires.
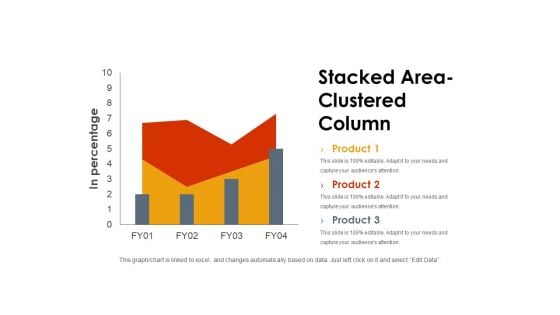
Stacked Area Clustered Column Ppt PowerPoint Presentation Styles Background Image
This is a stacked area clustered column ppt powerpoint presentation styles background image. This is a three stage process. The stages in this process are in percentage, graph, business, marketing, finance.
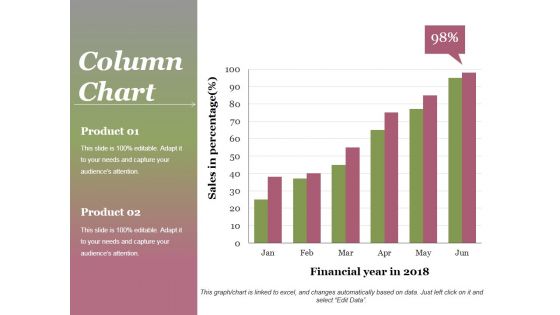
Column Chart Ppt PowerPoint Presentation Gallery Background
This is a column chart ppt powerpoint presentation gallery background. This is a two stage process. The stages in this process are product, sales in percentage, financial year, graph, success.
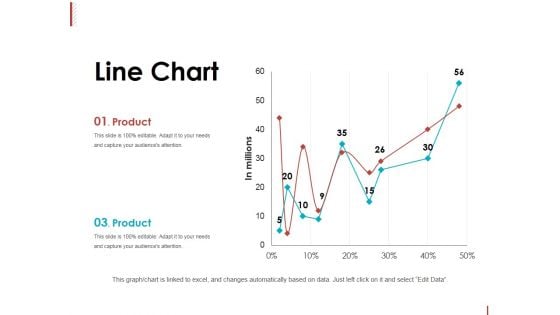
Line Chart Ppt PowerPoint Presentation Slides Graphics Tutorials
This is a line chart ppt powerpoint presentation slides graphics tutorials. This is a two stage process. The stages in this process are product, in millions, line chart, percentage, finance.
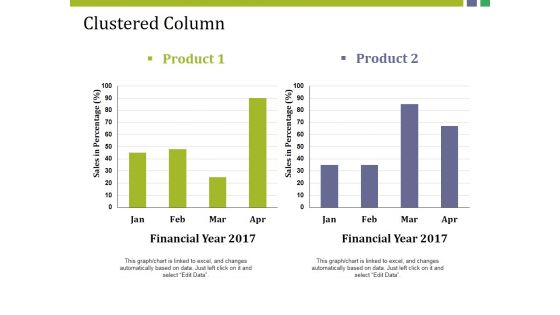
Clustered Column Ppt PowerPoint Presentation Gallery Structure
This is a clustered column ppt powerpoint presentation gallery structure. This is a two stage process. The stages in this process are product, sales in percentage, financial year, bar graph, finance.
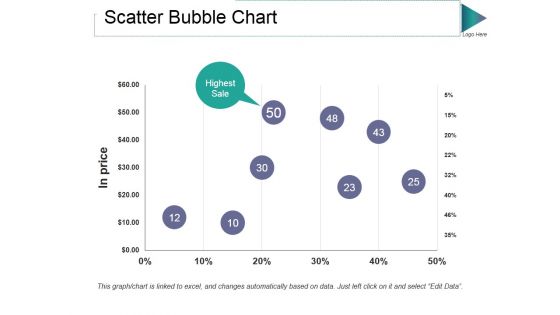
Scatter Bubble Chart Ppt PowerPoint Presentation Gallery Guidelines
This is a scatter bubble chart ppt powerpoint presentation gallery guidelines. This is a one stage process. The stages in this process are in price, highest sale, percentage, finance, business.
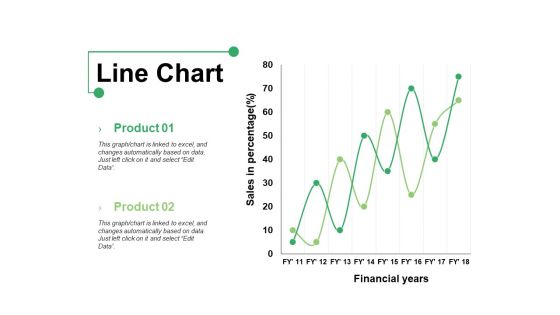
Line Chart Ppt PowerPoint Presentation Show Graphics Example
This is a line chart ppt powerpoint presentation show graphics example. This is a two stage process. The stages in this process are product, line chart, financial years, sales in percentage.
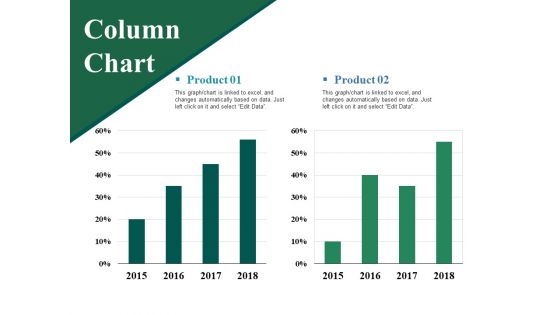
Column Chart Ppt PowerPoint Presentation Layouts Vector
This is a column chart ppt powerpoint presentation layouts vector. This is a two stage process. The stages in this process are product, column chart, bar graph, percentage, finance.
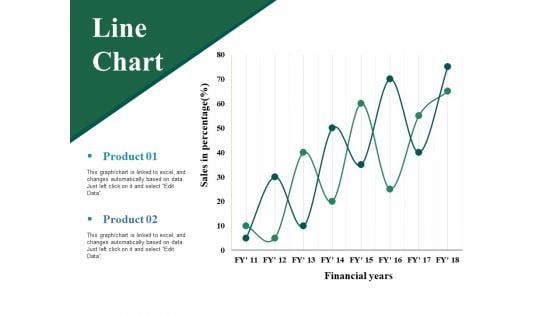
Line Chart Ppt PowerPoint Presentation Professional Grid
This is a line chart ppt powerpoint presentation professional grid. This is a two stage process. The stages in this process are sales in percentage, financial years, product, line chart.
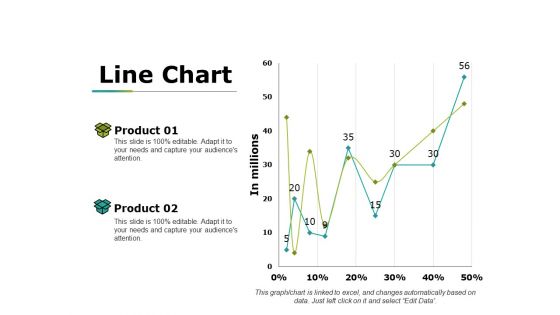
Line Chart Ppt PowerPoint Presentation Infographic Template Design Ideas
This is a line chart ppt powerpoint presentation infographic template design ideas. This is a two stage process. The stages in this process are product, in millions, percentage, line chart, success.
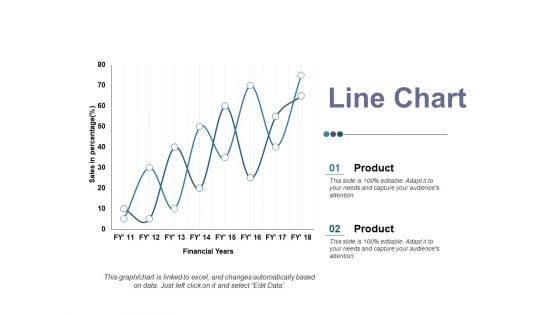
Line Chart Ppt PowerPoint Presentation Ideas Elements
This is a line chart ppt powerpoint presentation ideas elements. This is a two stage process. The stages in this process are product, sales in percentage, financial year, business, line chart.
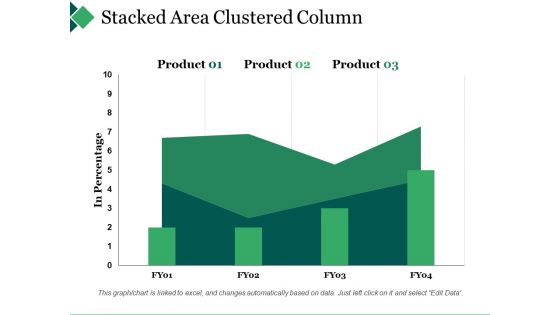
Stacked Area Clustered Column Ppt PowerPoint Presentation Gallery Gridlines
This is a stacked area clustered column ppt powerpoint presentation gallery gridlines. This is a three stage process. The stages in this process are bar graph, product, in percentage.
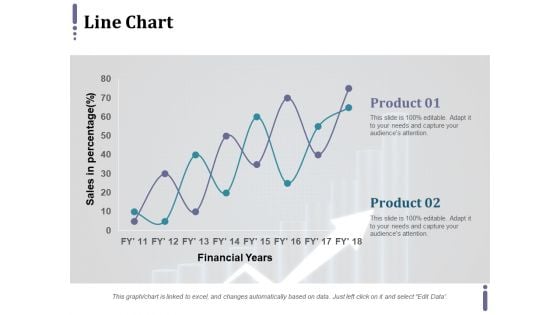
Line Chart Ppt PowerPoint Presentation Infographic Template Master Slide
This is a line chart ppt powerpoint presentation infographic template master slide. This is a two stage process. The stages in this process are product, financial years, sales in percentage.
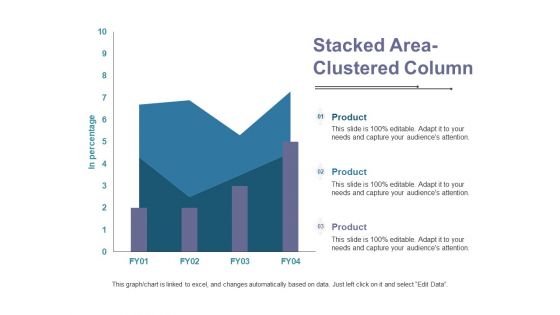
Stacked Area Clustered Column Ppt PowerPoint Presentation Outline Diagrams
This is a stacked area clustered column ppt powerpoint presentation outline diagrams. This is a three stage process. The stages in this process are product, in percentage, area chart.
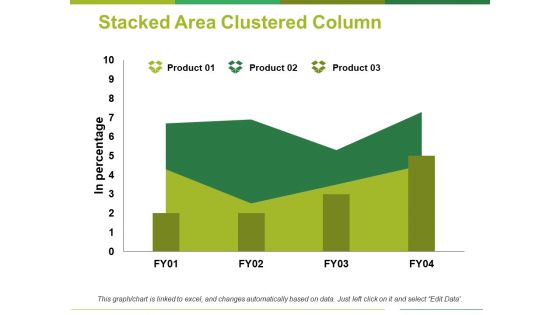
Stacked Area Clustered Column Ppt PowerPoint Presentation Professional Clipart
This is a stacked area clustered column ppt powerpoint presentation professional clipart. This is a three stage process. The stages in this process are product, in percentage, area chart.

Clustered Column Ppt PowerPoint Presentation Infographic Template Backgrounds
This is a clustered column ppt powerpoint presentation infographic template backgrounds. This is a two stage process. The stages in this process are sales in percentage, financial year, product.
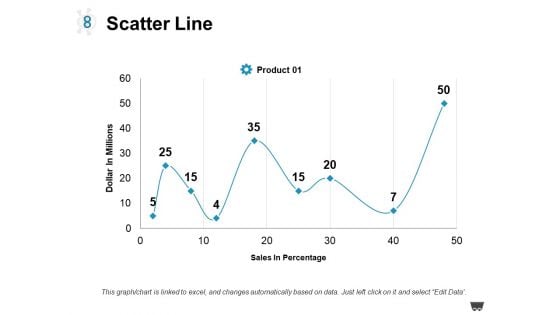
Scatter Line Ppt PowerPoint Presentation Styles Graphics Pictures
This is a scatter line ppt powerpoint presentation styles graphics pictures. This is a one stage process. The stages in this process are product, dollar in millions, sales in percentage.
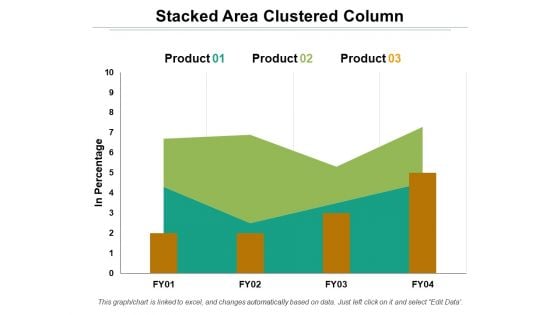
Stacked Area Clustered Column Ppt PowerPoint Presentation Layouts Templates
This is a stacked area clustered column ppt powerpoint presentation layouts templates. This is a three stage process. The stages in this process are product, in percentage, area chart.
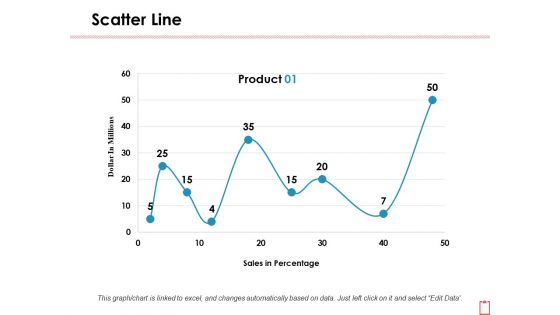
Scatter Line Ppt PowerPoint Presentation Infographics Background Images
This is a scatter line ppt powerpoint presentation infographics background images. This is a one stage process. The stages in this process are dollar in millions, product, sales in percentage.
Area Chart Ppt PowerPoint Presentation Icon Summary
This is a area chart ppt powerpoint presentation icon summary. This is a two stage process. The stages in this process are financial year, area chart, in percentage, product.
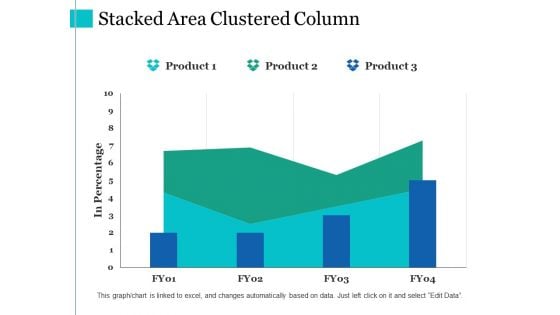
Stacked Area Clustered Column Ppt PowerPoint Presentation Summary Slides
This is a stacked area clustered column ppt powerpoint presentation summary slides. This is a three stage process. The stages in this process are product, in percentage, financial year, bar graph.
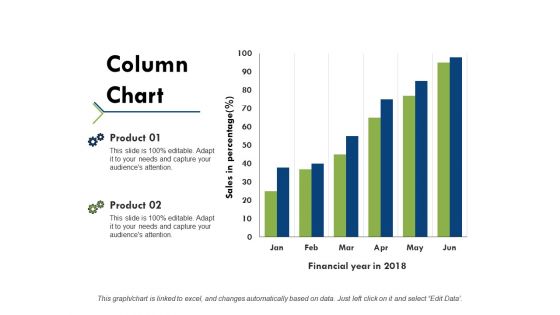
Column Chart Ppt PowerPoint Presentation Portfolio Example Topics
This is a column chart ppt powerpoint presentation portfolio example topics. This is a two stage process. The stages in this process are product, financial year, sales in percentage, column chart.
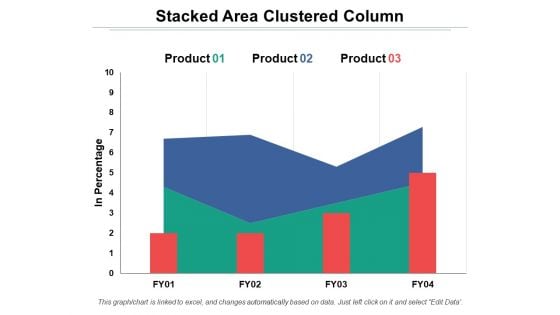
Stacked Area Clustered Column Ppt PowerPoint Presentation Professional Influencers
This is a stacked area clustered column ppt powerpoint presentation professional influencers. This is a three stage process. The stages in this process are stacked area clustered column, percentage, product, year.
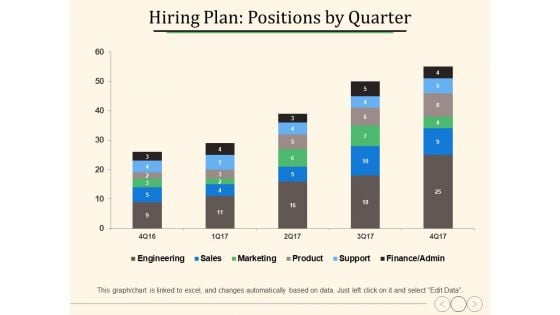
Hiring Plan Positions By Quarter Ppt PowerPoint Presentation Slides Deck
This is a hiring plan positions by quarter ppt powerpoint presentation slides deck. This is a five stage process. The stages in this process are percentage, product, business, management.
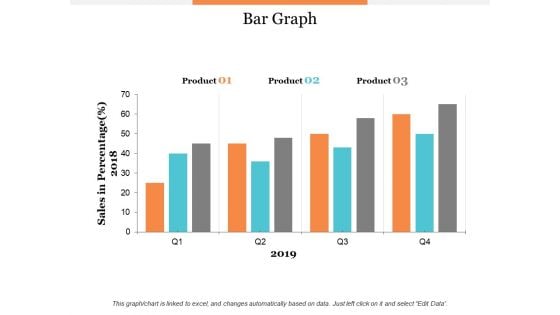
Bar Graph Product Ppt PowerPoint Presentation Model Graphic Tips
This is a bar graph product ppt powerpoint presentation model graphic tips. This is a three stage process. The stages in this process are product, percentage, business, management, marketing.
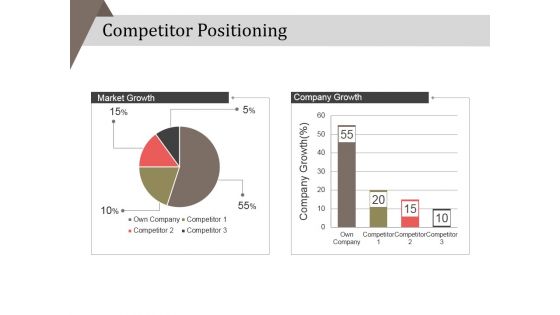
Competitor Positioning Ppt PowerPoint Presentation Professional Picture
This is a competitor positioning ppt powerpoint presentation professional picture. This is a two stage process. The stages in this process are company growth, percentage, market growth , business.
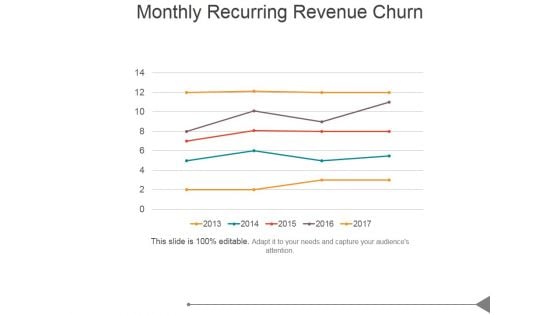
Monthly Recurring Revenue Churn Template 1 Ppt PowerPoint Presentation Clipart
This is a monthly recurring revenue churn template 1 ppt powerpoint presentation clipart. This is a one stage process. The stages in this process are business, marketing, success, in percentage, growth.
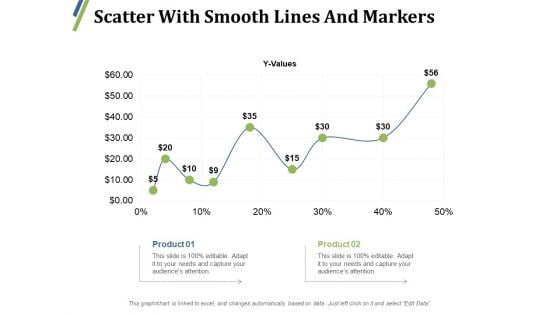
Scatter With Smooth Lines And Markers Ppt PowerPoint Presentation Outline Inspiration
This is a scatter with smooth lines and markers ppt powerpoint presentation outline inspiration. This is a two stage process. The stages in this process are product, percentage, finance, growth, line graph.
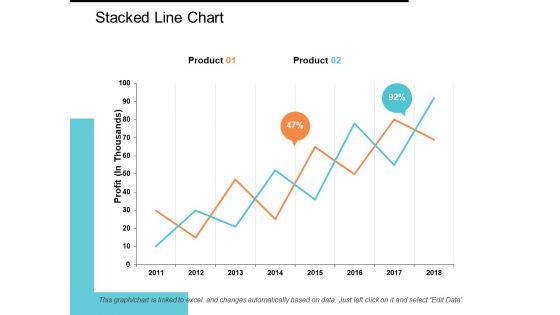
Stacked Line Chart Ppt PowerPoint Presentation Model Show
This is a stacked line chart ppt powerpoint presentation model show. This is a two stage process. The stages in this process are stacked line chart, product, profit, percentage, growth.
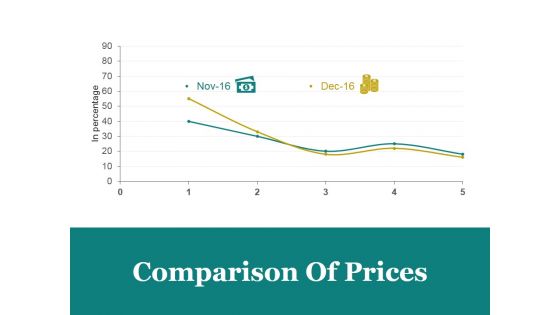
Comparison Of Prices Ppt PowerPoint Presentation Designs Download
This is a comparison of prices ppt powerpoint presentation designs download. This is a two stage process. The stages in this process are comparison of prices, marketing, in percentage, bar graph, business.
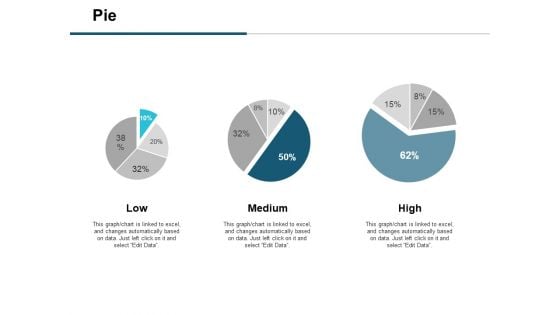
Pie Financial Ppt PowerPoint Presentation Infographics Master Slide
This is a pie financial ppt powerpoint presentation infographics master slide. This is a three stage process. The stages in this process are business strategy, marketing, management, percentage, pie, financial.
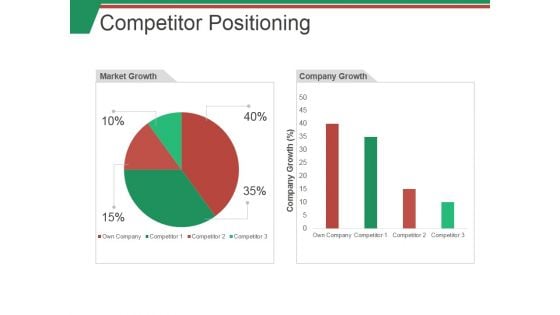
Competitor Positioning Ppt PowerPoint Presentation Show Example Introduction
This is a competitor positioning ppt powerpoint presentation show example introduction. This is a two stage process. The stages in this process are market growth, company growth, business, finance, percentage.
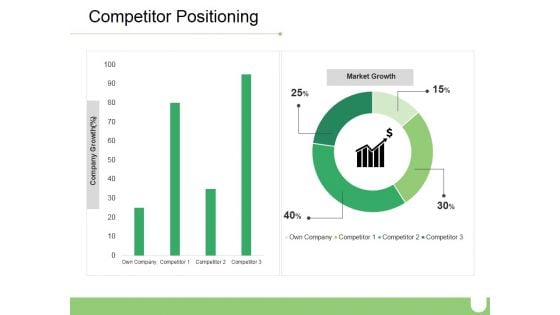
Competitor Positioning Ppt PowerPoint Presentation Gallery Portrait
This is a competitor positioning ppt powerpoint presentation gallery portrait. This is a two stage process. The stages in this process are company growth, market growth, business, marketing, percentage.
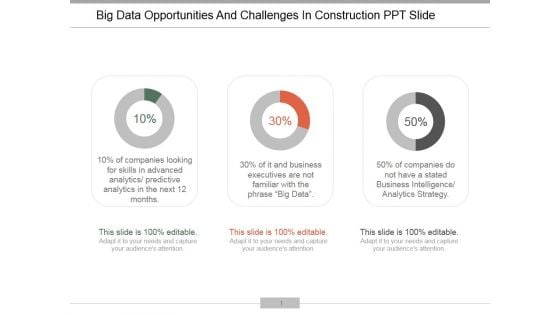
Big Data Opportunities And Challenges In Construction Ppt PowerPoint Presentation Outline
This is a big data opportunities and challenges in construction ppt powerpoint presentation outline. This is a three stage process. The stages in this process are finance, management, growth, percentage, business.
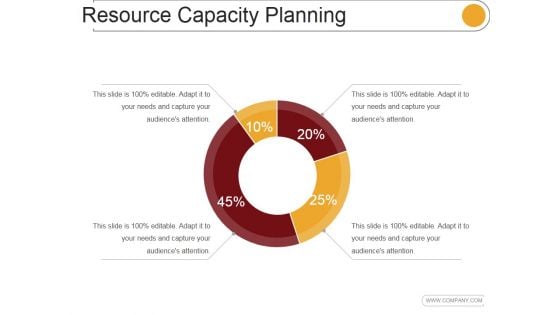
Resource Capacity Planning Template 2 Ppt PowerPoint Presentation Show
This is a resource capacity planning template 2 ppt powerpoint presentation show. This is a four stage process. The stages in this process are percentage, finance, donut, growth, success.
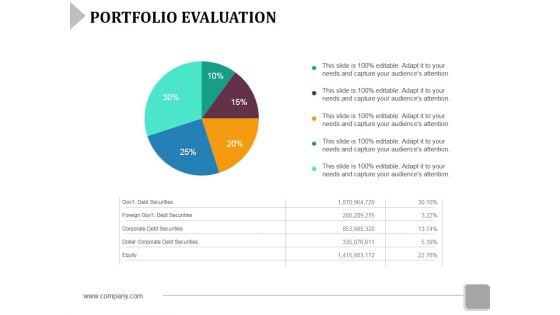
Portfolio Evaluation Template 2 Ppt PowerPoint Presentation Inspiration Information
This is a portfolio evaluation template 2 ppt powerpoint presentation inspiration information. This is a five stage process. The stages in this process are pie, finance, percentage, business, growth.

Clustered Column Line Ppt PowerPoint Presentation Slide
This is a clustered column line ppt powerpoint presentation slide. This is a three stage process. The stages in this process are bar graph, growth, finance, product, sales in percentage.
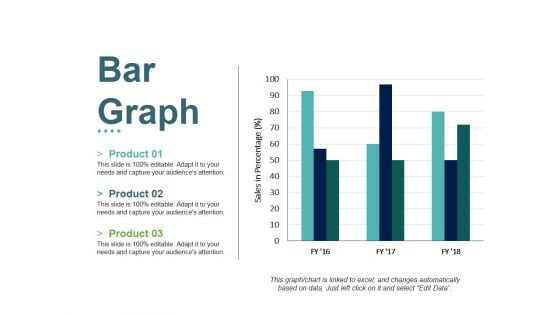
Bar Graph Ppt PowerPoint Presentation File Slides
This is a bar graph ppt powerpoint presentation file slides. This is a three stage process. The stages in this process are product, sales in percentage, bar graph, growth, success.
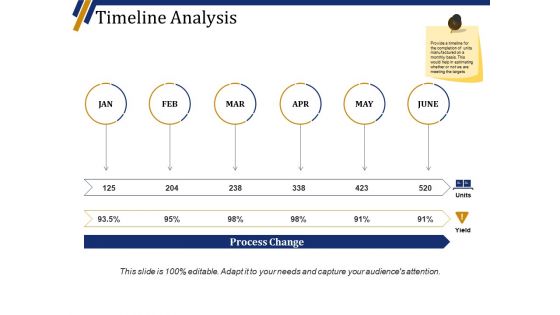
Timeline Analysis Ppt PowerPoint Presentation Pictures Master Slide
This is a timeline analysis ppt powerpoint presentation pictures master slide. This is a six stage process. The stages in this process are process change, timeline, business, management, percentage.
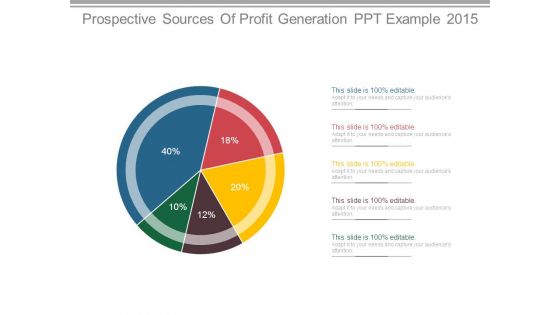
Prospective Sources Of Profit Generation Ppt Example 2015
This is a prospective sources of profit generation ppt example 2015. This is a five stage process. The stages in this process are finance, success, business, marketing, percentage, pie.
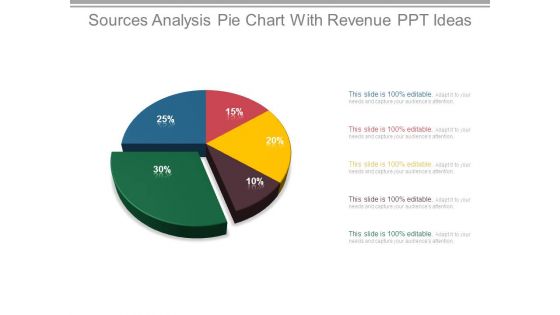
Sources Analysis Pie Chart With Revenue Ppt Ideas
This is a sources analysis pie chart with revenue ppt ideas. This is a five stage process. The stages in this process are finance, success, business, marketing, percentage, pie chart.
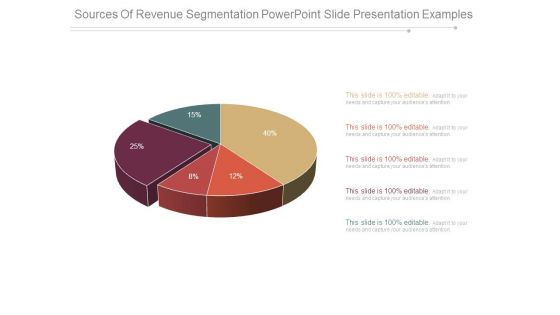
Sources Of Revenue Segmentation Powerpoint Slide Presentation Examples
This is a sources of revenue segmentation powerpoint slide presentation examples. This is a five stage process. The stages in this process are finance, success, business, marketing, percentage, pie chart.
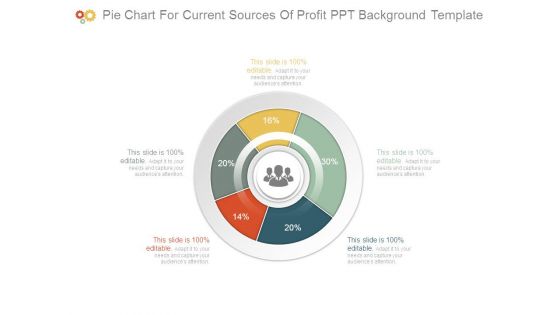
Pie Chart For Current Sources Of Profit Ppt Background Template
This is a pie chart for current sources of profit ppt background template. This is a five stage process. The stages in this process are finance, success, business, marketing, percentage, donut.


 Continue with Email

 Home
Home


