Percentage
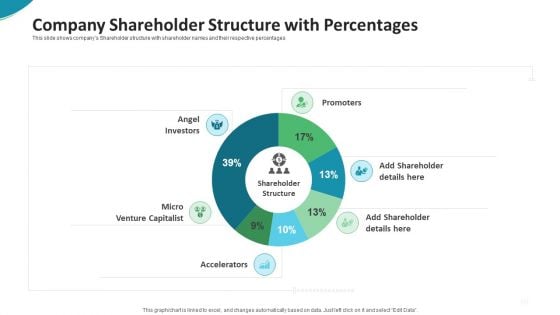
Investor Pitch Deck For Seed Funding From Private Investor Company Shareholder Structure With Percentages Pictures PDF
This slide shows companys Shareholder structure with shareholder names and their respective percentages.Deliver an awe-inspiring pitch with this creative investor pitch deck for seed funding from private investor company shareholder structure with percentages pictures pdf. bundle. Topics like company shareholder structure with percentages can be discussed with this completely editable template. It is available for immediate download depending on the needs and requirements of the user.
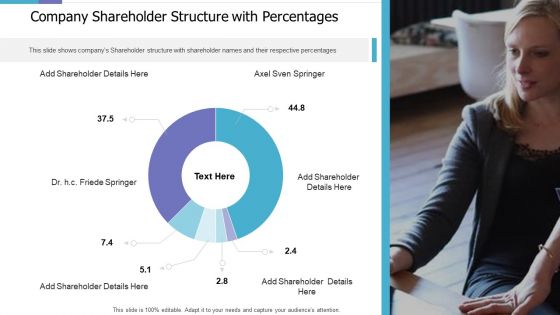
Company Shareholder Structure With Percentages Investor Pitch Deck For PE Funding Designs PDF
This slide shows companys Shareholder structure with shareholder names and their respective percentages. Deliver an awe inspiring pitch with this creative company shareholder structure with percentages investor pitch deck for pe funding designs pdf bundle. Topics like company shareholder structure with percentages can be discussed with this completely editable template. It is available for immediate download depending on the needs and requirements of the user.
Four Boxes With Percentages In Increasing Order Ppt PowerPoint Presentation Outline Icons PDF
Presenting this set of slides with name four boxes with percentages in increasing order ppt powerpoint presentation outline icons pdf. This is a four stage process. The stages in this process are four boxes with percentages in increasing order. This is a completely editable PowerPoint presentation and is available for immediate download. Download now and impress your audience.
Compare Pricing Percentages Across Competitive Product Ppt PowerPoint Presentation Model Graphic Images Cpb Pdf
Presenting this set of slides with name compare pricing percentages across competitive product ppt powerpoint presentation model graphic images cpb pdf. This is an editable Powerpoint four stages graphic that deals with topics like compare pricing percentages across competitive product to help convey your message better graphically. This product is a premium product available for immediate download and is 100 percent editable in Powerpoint. Download this now and use it in your presentations to impress your audience.
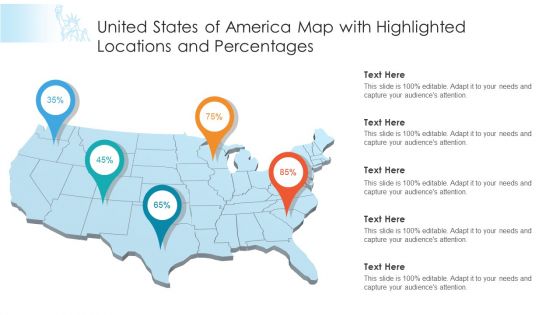
United States Of America Map With Highlighted Locations And Percentages Ppt PowerPoint Presentation File Outline PDF
Presenting united states of america map with highlighted locations and percentages ppt powerpoint presentation file outline pdf to dispense important information. This template comprises five stages. It also presents valuable insights into the topics including united states of america map with highlighted locations and percentages. This is a completely customizable PowerPoint theme that can be put to use immediately. So, download it and address the topic impactfully.
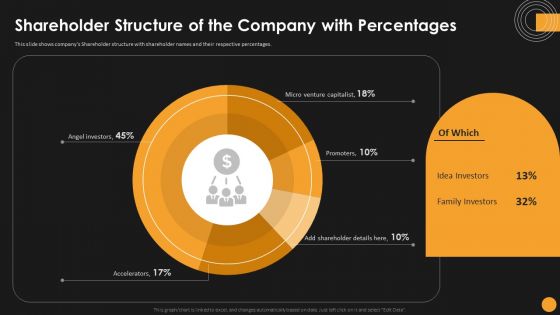
Assessing Startup Funding Channels Shareholder Structure Of The Company With Percentages Formats PDF
This slide shows companys Shareholder structure with shareholder names and their respective percentages. Formulating a presentation can take up a lot of effort and time, so the content and message should always be the primary focus. The visuals of the PowerPoint can enhance the presenters message, so our Assessing Startup Funding Channels Shareholder Structure Of The Company With Percentages Formats PDF was created to help save time. Instead of worrying about the design, the presenter can concentrate on the message while our designers work on creating the ideal templates for whatever situation is needed. Slidegeeks has experts for everything from amazing designs to valuable content, we have put everything into Assessing Startup Funding Channels Shareholder Structure Of The Company With Percentages Formats PDF.
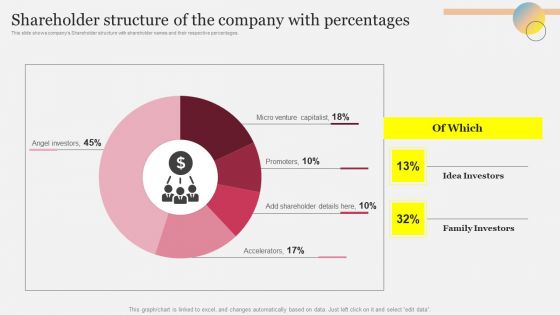
Shareholder Structure Of The Company With Percentages Ppt Pictures Slide Portrait PDF
This slide shows companys Shareholder structure with shareholder names and their respective percentages. This Shareholder Structure Of The Company With Percentages Ppt Pictures Slide Portrait PDF is perfect for any presentation, be it in front of clients or colleagues. It is a versatile and stylish solution for organizing your meetings. The product features a modern design for your presentation meetings. The adjustable and customizable slides provide unlimited possibilities for acing up your presentation. Slidegeeks has done all the homework before launching the product for you. So, do not wait, grab the presentation templates today
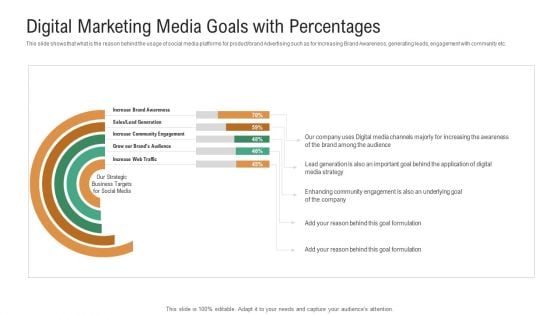
Investor Pitch Deck To Generate Venture Capital Funds Digital Marketing Media Goals With Percentages Portrait PDF
This slide shows that what is the reason behind the usage of social media platforms for product brand Advertising such as for Increasing Brand Awareness, generating leads, engagement with community etc. Deliver an awe inspiring pitch with this creative investor pitch deck to generate venture capital funds digital marketing media goals with percentages portrait pdf bundle. Topics like community engagement, sales lead generation, enhancing community engagement, digital media strategy can be discussed with this completely editable template. It is available for immediate download depending on the needs and requirements of the user.
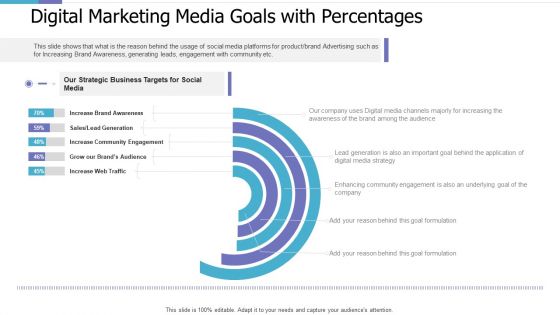
Digital Marketing Media Goals With Percentages Investor Pitch Deck For PE Funding Ideas PDF
This slide shows that what is the reason behind the usage of social media platforms for product brand Advertising such as for Increasing Brand Awareness, generating leads, engagement with community etc. This is a digital marketing media goals with percentages investor pitch deck for pe funding ideas pdf template with various stages. Focus and dispense information on five stages using this creative set, that comes with editable features. It contains large content boxes to add your information on topics like lead generation, community engagement, web traffic. You can also showcase facts, figures, and other relevant content using this PPT layout. Grab it now.
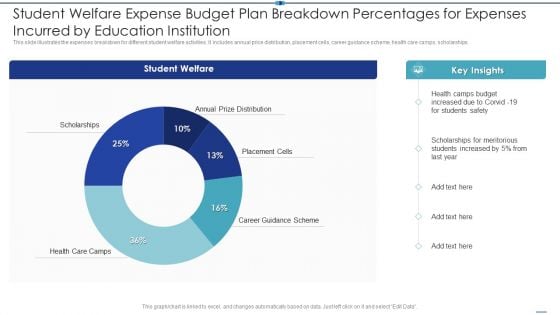
Student Welfare Expense Budget Plan Breakdown Percentages For Expenses Incurred By Education Institution Demonstration PDF
This slide illustrates the expenses breakdown for different student welfare activities. It includes annual price distribution, placement cells, career guidance scheme, health care camps, scholarships.Showcasing this set of slides titled Student Welfare Expense Budget Plan Breakdown Percentages For Expenses Incurred By Education Institution Demonstration PDF The topics addressed in these templates are Scholarships For Meritorious, Students Increased, Student Welfare All the content presented in this PPT design is completely editable. Download it and make adjustments in color, background, font etc. as per your unique business setting.

United States Of America Map Locations Percentages Ppt PowerPoint Presentation Complete Deck With Slides
Boost your confidence and team morale with this well-structured united states of america map locations percentages ppt powerpoint presentation complete deck with slides. This prefabricated set gives a voice to your presentation because of its well-researched content and graphics. Our experts have added all the components very carefully, thus helping you deliver great presentations with a single click. Not only that, it contains a set of twelve slides that are designed using the right visuals, graphics, etc. Various topics can be discussed, and effective brainstorming sessions can be conducted using the wide variety of slides added in this complete deck. Apart from this, our PPT design contains clear instructions to help you restructure your presentations and create multiple variations. The color, format, design anything can be modified as deemed fit by the user. Not only this, it is available for immediate download. So, grab it now.
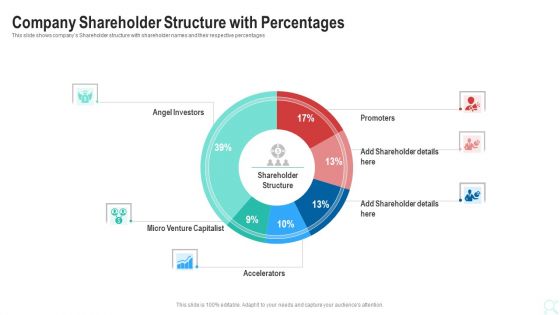
Pitch Deck To Raise New Venture Financing From Seed Investors Company Shareholder Structure With Percentages Brochure PDF
This slide shows companys Shareholder structure with shareholder names and their respective percentages Deliver and pitch your topic in the best possible manner with this pitch deck to raise new venture financing from seed investors company shareholder structure with percentages brochure pdf. Use them to share invaluable insights on company shareholder structure with percentages and impress your audience. This template can be altered and modified as per your expectations. So, grab it now.
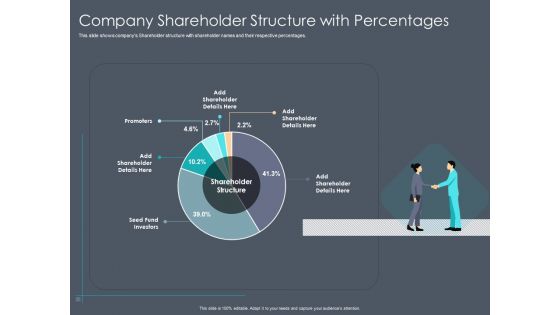
Private Equity Fund Pitch Deck To Raise Series C Funding Company Shareholder Structure With Percentages Microsoft PDF
Deliver and pitch your topic in the best possible manner with this private equity fund pitch deck to raise series c funding company shareholder structure with percentages microsoft pdf. Use them to share invaluable insights on seed fund investors, promoters, sales and impress your audience. This template can be altered and modified as per your expectations. So, grab it now.
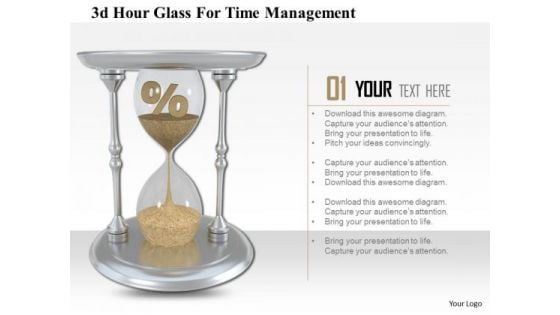
Stock Photo 3d Hour Glass For Time Management Image Graphics For PowerPoint Slide
This image slide displays hourglass with percentage symbol. This image slide may be used to display the time management and profit percentage. Make outstanding presentations using this image.
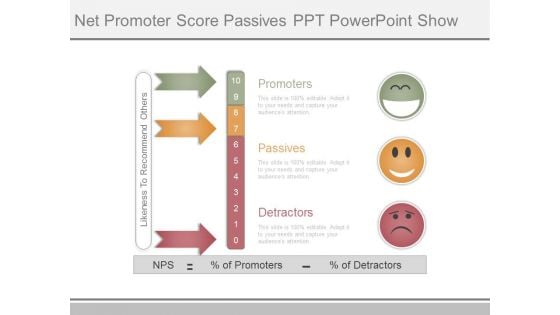
Net Promoter Score Passives Ppt Powerpoint Show
This is a net promoter score passives ppt powerpoint show. This is a three stage process. The stages in this process are promoters, passives, detractors, nps, percentage of promoters, likeness to recommend others, percentage of detractors.

Net Promoter Score Value Diagram Example Of Ppt
This is a net promoter score value diagram example of ppt. This is a ten stage process. The stages in this process are nps, percentage of promoters, percentage of detractors, detractors, passive, promoter, not at all likely, natural, extremely likely.
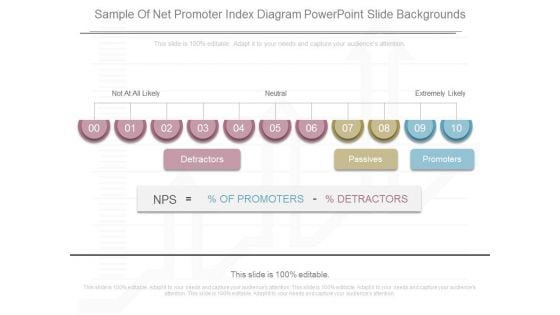
Sample Of Net Promoter Index Diagram Powerpoint Slide Backgrounds
This is a sample of net promoter index diagram powerpoint slide backgrounds. This is a ten stage process. The stages in this process are not at all likely, neutral, extremely likely, detractors, passives, promoters, nps, percentage detractors, percentage of promoters.
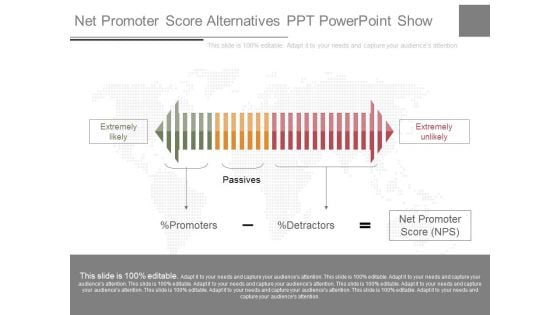
Net Promoter Score Alternatives Ppt Powerpoint Show
This is a net promoter score alternatives ppt powerpoint show. This is a one stage process. The stages in this process are extremely likely, passives, extremely unlikely, percentage of promoters, percentage of detractors, net promoter score nps.
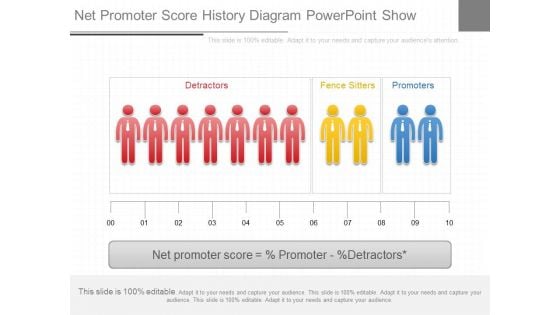
Net Promoter Score History Diagram Powerpoint Show
This is a net promoter score history diagram powerpoint show. This is a ten stage process. The stages in this process are detractors, fence sitters, promoters, net promoter score, percentage promoter, percentage detractors.
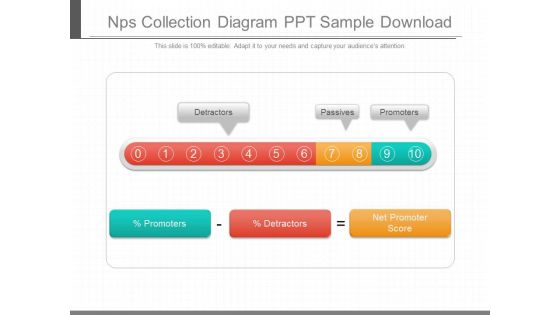
Nps Collection Diagram Ppt Sample Download
This is a nps collection diagram ppt sample download. This is a ten stage process. The stages in this process are detractors, passives, promoters, percentage promoters, percentage detractors, net promoter score.
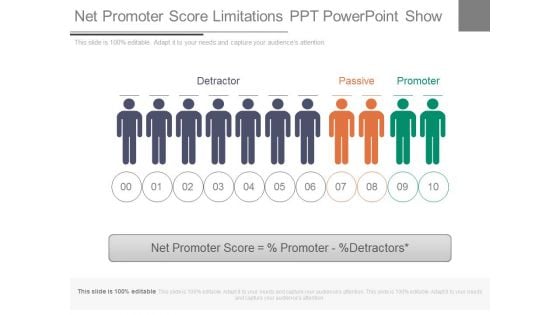
Net Promoter Score Limitations Ppt Powerpoint Show
This is a net promoter score limitations ppt powerpoint show. This is a ten stage process. The stages in this process are detractor, passive, promoter, net promoter score percentage promoter percentage detractors.
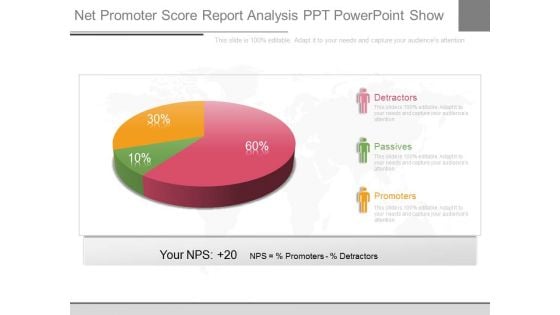
Net Promoter Score Report Analysis Ppt Powerpoint Show
This is a net promoter score report analysis ppt powerpoint show. This is a three stage process. The stages in this process are detractors, passives, promoters, your nps, nps, percentage promoters, percentage detractors.
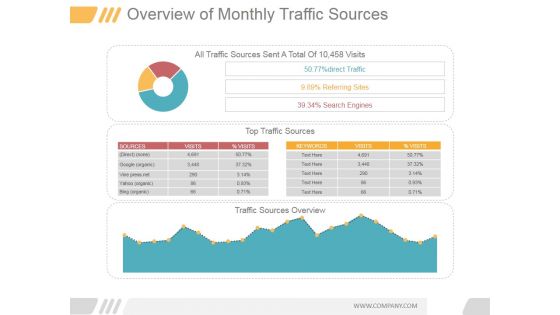
Overview Of Monthly Traffic Sources Ppt PowerPoint Presentation Visuals
This is a overview of monthly traffic sources ppt powerpoint presentation visuals. This is a three stage process. The stages in this process are all traffic sources sent a total of 10 458 visits, 50 77 percentage direct traffic, 9 89 percentage referring sites, 39 34 percentage search engines, sources, visits.
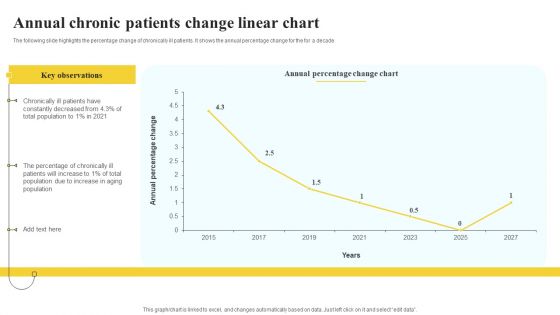
Annual Chronic Patients Change Linear Chart Demonstration PDF
The following slide highlights the percentage change of chronically ill patients. It shows the annual percentage change for the for a decade Showcasing this set of slides titled Annual Chronic Patients Change Linear Chart Demonstration PDF. The topics addressed in these templates are Key Observations, Annual Percentage, Linear Chart. All the content presented in this PPT design is completely editable. Download it and make adjustments in color, background, font etc. as per your unique business setting.

Facility Planning Management Workforce Productivity Dashboard Formats PDF
This slide showcase employees productivity driven by facility planning in organisation.it includes workforce productivity , organisation department , monthly productivity percentage and facility percentage. Showcasing this set of slides titled Facility Planning Management Workforce Productivity Dashboard Formats PDF. The topics addressed in these templates are Workforce Productivity, Work Productivity, Facility Percentage. All the content presented in this PPT design is completely editable. Download it and make adjustments in color, background, font etc. as per your unique business setting.
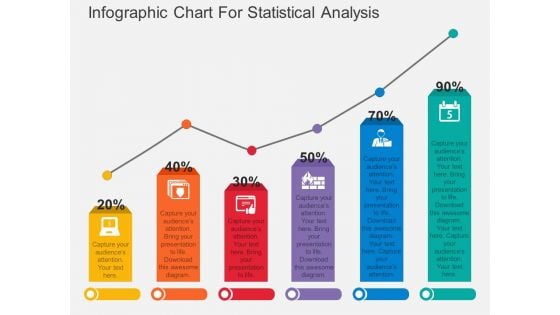
Infographic Chart For Statistical Analysis Powerpoint Template
Download this exclusive business diagram to display statistical analysis. This PowerPoint template contains bar chart with percentage values. This diagram is useful for business presentations.
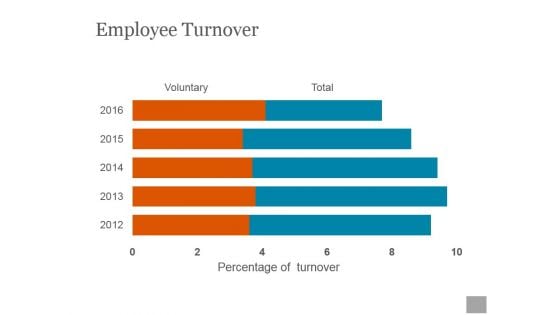
Employee Turnover Ppt PowerPoint Presentation Designs
This is a employee turnover ppt powerpoint presentation designs. This is a five stage process. The stages in this process are voluntary, percentage of turnover, total.
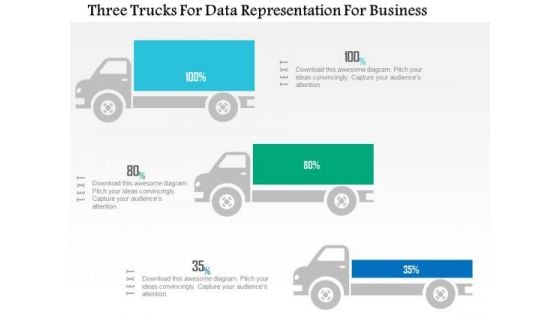
Business Diagram Three Trucks For Data Representation For Business PowerPoint Slide
This business diagram displays three trucks graphic. This diagram contains trucks for percentage value growth. Use this diagram to display business growth over a period of time.
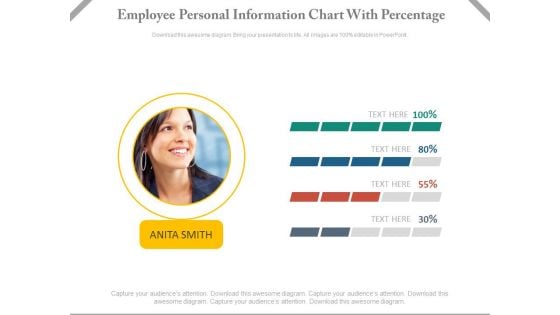
Employee Performance Information Chart Powerpoint Slides
This dashboard template contains employee picture with percentage slides. This dashboard PowerPoint template conveys employees performance in a visual manner. Download this PPT slide for quick decision-making.
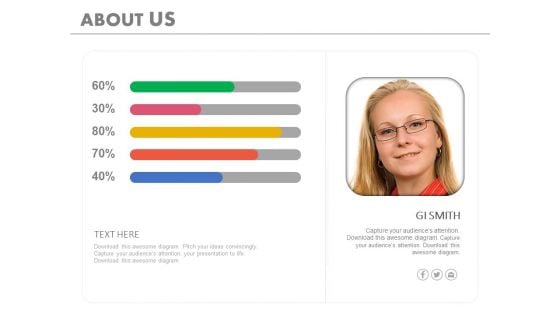
Overview Of Company Economic Analysis Powerpoint Slides
This PowerPoint template has been designed with employee picture and percentage tags. Download this PPT slide to depict company?s economic analysis. Make impressive presentation using this slide design.

Employee Turnover Ppt PowerPoint Presentation Show Layouts
This is a employee turnover ppt powerpoint presentation show layouts. This is a five stage process. The stages in this process are total, voluntary, percentage of turnover, finance.
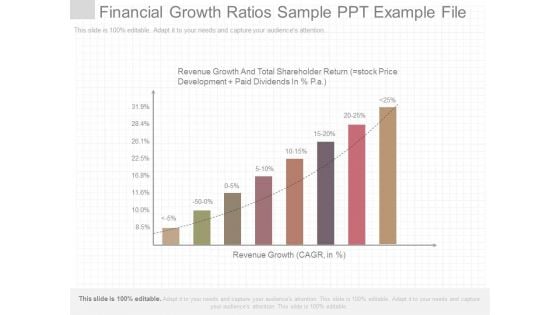
Financial Growth Ratios Sample Ppt Example File
This is a financial growth ratios sample ppt example file. This is a eight stage process. The stages in this process are revenue growth and total shareholder return stock price development paid dividends in percentage p a, revenue growth cagr in percentage.

Net Promoter Score Data Analysis Ppt Powerpoint Slides
This is a net promoter score data analysis ppt powerpoint slides. This is a ten stage process. The stages in this process are very willing, neutral, not at all willing, promoters, passives, detractors, net promoter score, percentage promoters, minus, percentage detractors.

Net Promoter Score Methodology Ppt Powerpoint Guide
This is a net promoter score methodology ppt powerpoint guide. This is a ten stage process. The stages in this process are survey your customers, detractor, neutral, promoters, calculate your score, tally responses, net promoter score percentage of promoters percentage of detractors.
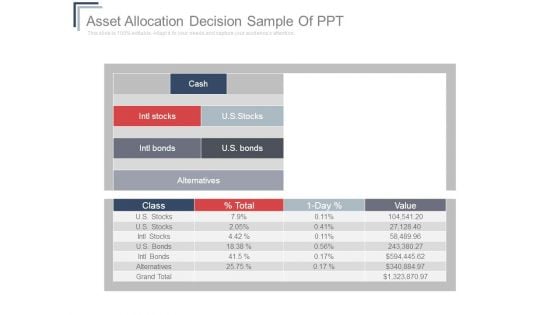
Asset Allocation Decision Sample Of Ppt
This is a asset allocation decision sample of ppt. This is a four stage process. The stages in this process are u s stocks, cash, intl stocks, intl bonds, u s bonds, alternatives, class, percentage total, 1 day percentage, value, grand total.
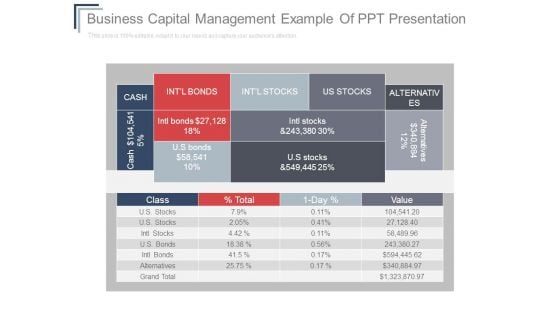
Business Capital Management Example Of Ppt Presentation
This is a business capital management example of ppt presentation. This is a four stage process. The stages in this process are u s stocks, cash, intl stocks, intl bonds, u s bonds, alternatives, class, percentage total, 1 day percentage, value, grand total.

PMO Dashboard With Strategy And Delivery KPI Elements PDF
Presenting PMO Dashboard With Strategy And Delivery KPI Elements PDF to dispense important information. This template comprises three stages. It also presents valuable insights into the topics including Percentage Of Projects, Organization Objectives, Percentage Of Projects This is a completely customizable PowerPoint theme that can be put to use immediately. So, download it and address the topic impactfully.
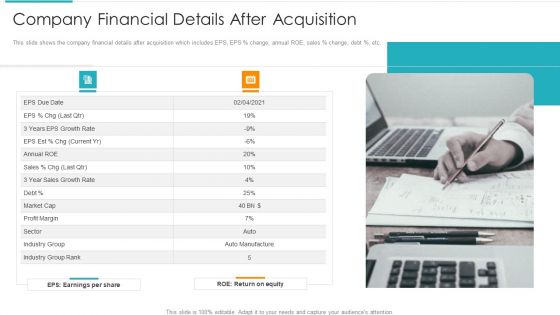
Inorganic Expansion Plan And Progression Company Financial Details After Acquisition Summary PDF
This slide shows the company financial details after acquisition which includes EPS, EPS percentage change, annual ROE, sales percentage change, debt percentage, etc. This is a inorganic expansion plan and progression company financial details after acquisition summary pdf template with various stages. Focus and dispense information on one stages using this creative set, that comes with editable features. It contains large content boxes to add your information on topics like sales, growth rate, profit margin, industry group rank, equity. You can also showcase facts, figures, and other relevant content using this PPT layout. Grab it now.
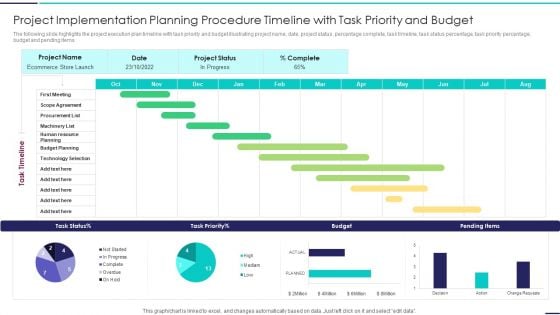
Project Implementation Planning Procedure Timeline With Task Priority And Budget Guidelines PDF
The following slide highlights the project execution plan timeline with task priority and budget illustrating project name, date, project status, percentage complete, task timeline, task status percentage, task priority percentage, budget and pending items. Showcasing this set of slides titled Project Implementation Planning Procedure Timeline With Task Priority And Budget Guidelines PDF. The topics addressed in these templates are Project Implementation Planning Procedure Timeline With Task Priority And Budget. All the content presented in this PPT design is completely editable. Download it and make adjustments in color, background, font etc. as per your unique business setting.
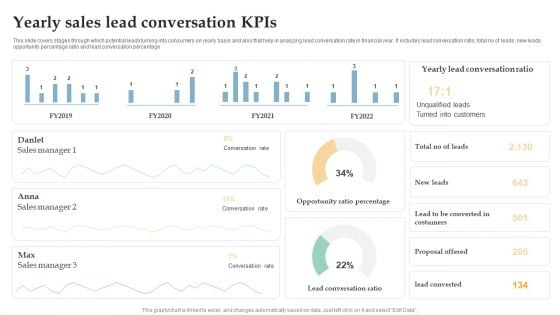
Yearly Sales Lead Conversation Kpis Ppt Inspiration Brochure PDF
This slide covers stages through which potential leads turning into consumers on yearly basis and also that help in analyzing lead conversation rate in financial year. It includes lead conversation ratio, total no of leads, new leads opportunity percentage ratio and lead conversation percentage. Pitch your topic with ease and precision using this Yearly Sales Lead Conversation Kpis Ppt Inspiration Brochure PDF. This layout presents information on Sales Manager, Conversation Rate, Opportunity Ratio Percentage. It is also available for immediate download and adjustment. So, changes can be made in the color, design, graphics or any other component to create a unique layout.
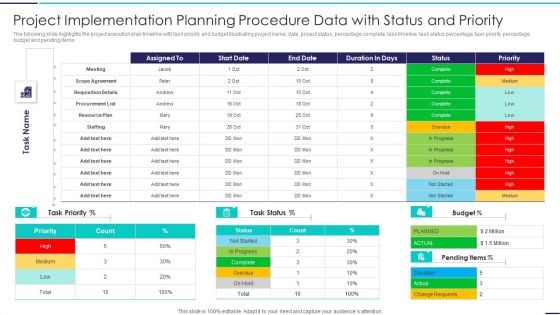
Project Implementation Planning Procedure Data With Status And Priority Demonstration PDF
The following slide highlights the project execution plan timeline with task priority and budget illustrating project name, date, project status, percentage complete, task timeline, task status percentage, task priority percentage, budget and pending items. Showcasing this set of slides titled Project Implementation Planning Procedure Data With Status And Priority Demonstration PDF. The topics addressed in these templates are Project Implementation Planning Procedure Data With Status And Priority. All the content presented in this PPT design is completely editable. Download it and make adjustments in color, background, font etc. as per your unique business setting.
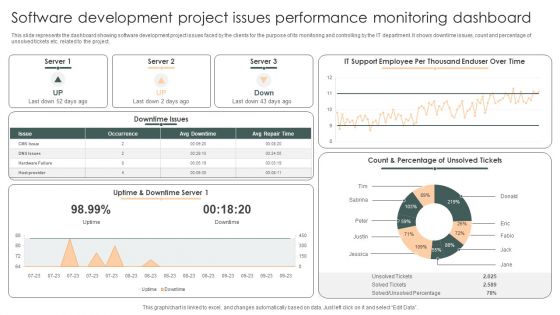
Software Development Project Issues Performance Monitoring Dashboard Structure PDF
This slide represents the dashboard showing software development project issues faced by the clients for the purpose of its monitoring and controlling by the IT department. It shows downtime issues, count and percentage of unsolved tickets etc. related to the project.Showcasing this set of slides titled Software Development Project Issues Performance Monitoring Dashboard Structure PDF. The topics addressed in these templates are Downtime Issues, Count Percentage, Unsolved Percentage. All the content presented in this PPT design is completely editable. Download it and make adjustments in color, background, font etc. as per your unique business setting.
Coronavirus Cases And Deaths Update By Age Group Icons PDF
Following slide provides information regarding distribution of confirmed coronavirus cases and deaths which government uses to take necessary measure in containing virus outspread. Percentage of confirmed cases and deaths are demonstrated in this slide. Showcasing this set of slides titled Coronavirus Cases And Deaths Update By Age Group Icons PDF. The topics addressed in these templates are Highest Percentage, Age Group, Least Percentage. All the content presented in this PPT design is completely editable. Download it and make adjustments in color, background, font etc. as per your unique business setting.
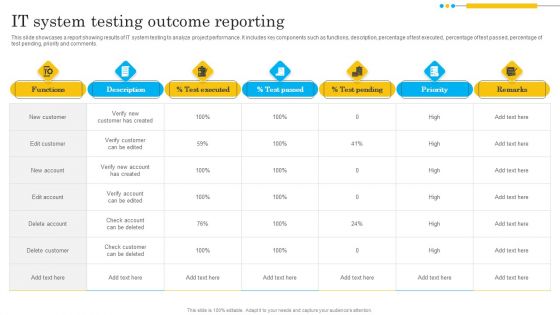
IT System Testing Outcome Reporting Formats PDF
This slide showcases a report showing results of IT system testing to analyze project performance. It includes key components such as functions, description, percentage of test executed, percentage of test passed, percentage of test pending, priority and comments. Showcasing this set of slides titled IT System Testing Outcome Reporting Formats PDF. The topics addressed in these templates are Verify Customer Created, Check Account, Check Customer. All the content presented in this PPT design is completely editable. Download it and make adjustments in color, background, font etc. as per your unique business setting.
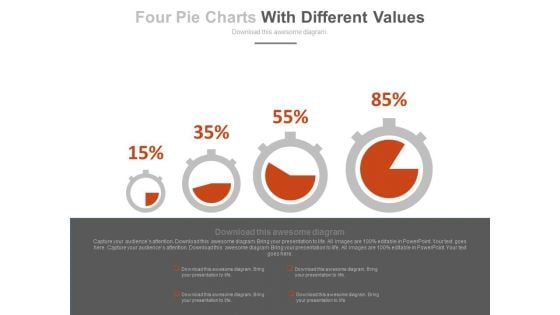
Dashboard With Increasing Values Powerpoint Slides
This innovative, stunningly beautiful dashboard has been designed for data visualization. It contains pie charts with increasing percentage values. This PowerPoint template helps to display your information in a useful, simple and uncluttered way.
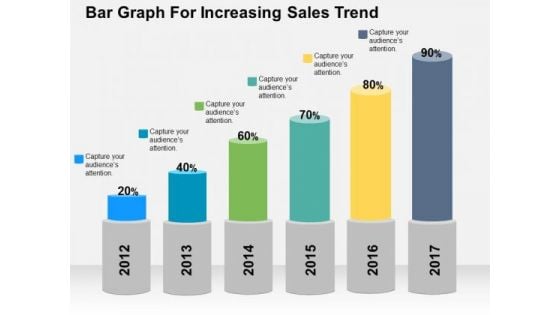
Bar Graph For Increasing Sales Trend PowerPoint Template
Deliver amazing presentations with our above template showing bar graph with percentage values. You may download this slide to depict increase in sales trends. Capture the attention of your audience using this diagram.
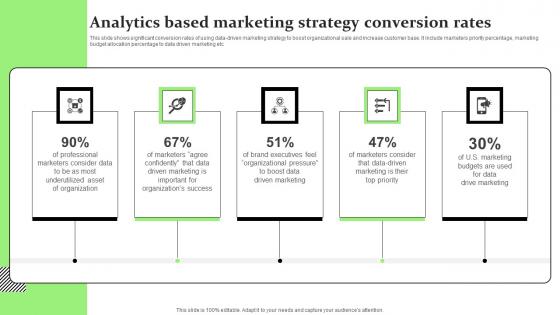
Analytics Based Marketing Strategy Conversion Rates Ideas Pdf
This slide shows significant conversion rates of using data driven marketing strategy to boost organizational sale and increase customer base. It include marketers priority percentage, marketing budget allocation percentage to data driven marketing etc.Pitch your topic with ease and precision using this Analytics Based Marketing Strategy Conversion Rates Ideas Pdf This layout presents information on Organizations Success, Driven Marketing, Organizational Pressure It is also available for immediate download and adjustment. So, changes can be made in the color, design, graphics or any other component to create a unique layout. This slide shows significant conversion rates of using data driven marketing strategy to boost organizational sale and increase customer base. It include marketers priority percentage, marketing budget allocation percentage to data driven marketing etc.
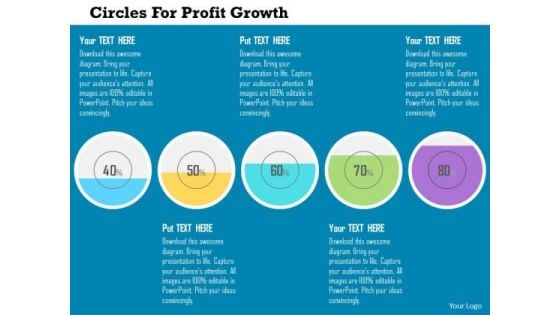
Business Diagram Circles For Profit Growth Presentation Template
This diagram displays four text circles for profit growth. This business diagram has been designed with graphic of circles with percentage ratios. Use this diagram to depict business planning process in your presentations.
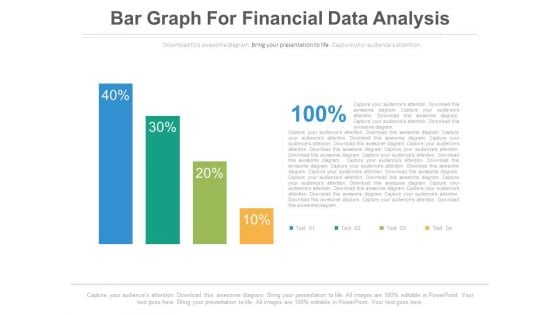
Bar Graph For Profit Growth Analysis Powerpoint Slides
This PowerPoint template has been designed with bar graph with percentage values. This diagram is useful to exhibit profit growth analysis. This diagram slide can be used to make impressive presentations.
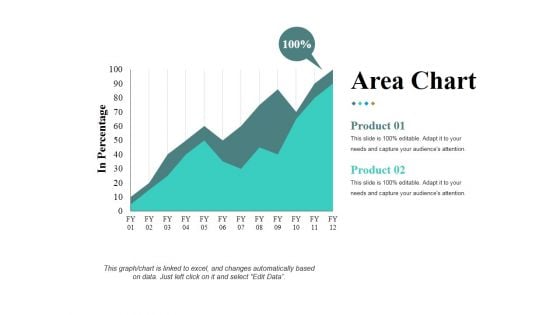
Area Chart Ppt PowerPoint Presentation Infographic Template Samples
This is a area chart ppt powerpoint presentation infographic template samples. This is a two stage process. The stages in this process are in percentage product, business, marketing, growth.
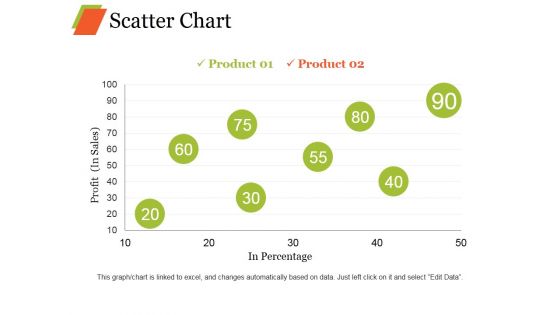
Scatter Chart Ppt PowerPoint Presentation Professional Graphic Images
This is a scatter chart ppt powerpoint presentation professional graphic images. This is a eight stage process. The stages in this process are product, profit, in percentage growth, business.

Stakeholders Fund And Market Analysis Bar Graph Powerpoint Slide Information
This is a stakeholders fund and market analysis bar graph powerpoint slide information. This is a five stage process. The stages in this process are shareholders funds, market capitalization, market capitalization as a percentage of cse market capitalization.
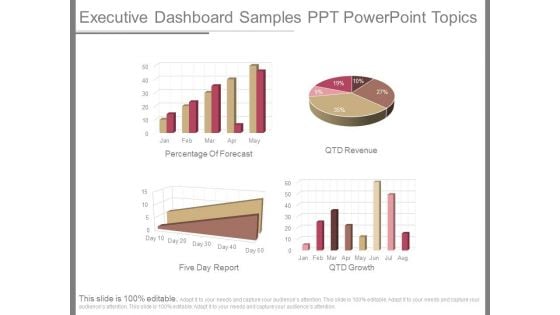
Executive Dashboard Samples Ppt Powerpoint Topics
This is a executive dashboard samples ppt powerpoint topics. This is a four stage process. The stages in this process are percentage of forecast, qtd revenue, five day report, qtd growth
Business Diagram Human Icons With Bubbles And Different Icons Inside PowerPoint Slide
This diagram displays graph with percentage value growth. This business slide is suitable to present and compare business data. Use this diagram to build professional presentations for your viewers.
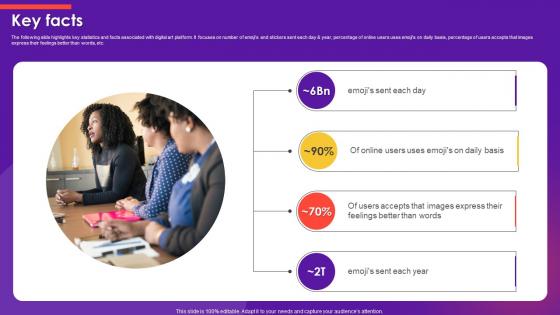
Key Facts Emoji Marketplace Investor Funding Elevator Pitch Deck
The following slide highlights key statistics and facts associated with digital art platform. It focuses on number of emojis and stickers sent each day and year, percentage of online users uses emojis on daily basis, percentage of users accepts that images express their feelings better than words, etc. If your project calls for a presentation, then Slidegeeks is your go-to partner because we have professionally designed, easy-to-edit templates that are perfect for any presentation. After downloading, you can easily edit Key Facts Emoji Marketplace Investor Funding Elevator Pitch Deck and make the changes accordingly. You can rearrange slides or fill them with different images. Check out all the handy templates The following slide highlights key statistics and facts associated with digital art platform. It focuses on number of emojis and stickers sent each day and year, percentage of online users uses emojis on daily basis, percentage of users accepts that images express their feelings better than words, etc.

Banking Concept Financial PowerPoint Templates And PowerPoint Backgrounds 0211
Microsoft PowerPoint Template and Background with money and percentage symbol in hands Add on the colours with our Banking Concept Financial PowerPoint Templates And PowerPoint Backgrounds 0211. Give your views a decorative look.

Stock Photo Pyramid Of Balls With Percent Symbols Pwerpoint Slide
This image has been crafted for displaying the concept of discount and leadership. This image contains the graphic of metal balls with percentage symbol on each ball. Use this image and build a unique presentation for business and marketing topics.
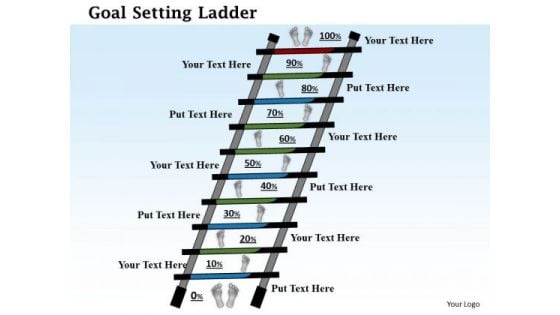
Business Framework Goal Setting Ladder PowerPoint Presentation
This image slide has been designed to express views on goals, targets and achievements. This image slide displays goal setting ladder with percentage steps. This image slide will enhance the quality of your presentations.
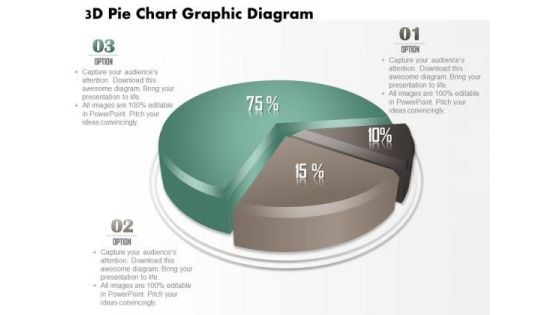
Business Diagram 3d Pie Chart Graphic Diagram PowerPoint Ppt Presentation
This business diagram displays 3d pie chart. It contains pie chart with percentage ratios. This pie chart is a visual way of displaying data. Use this diagram to make outstanding presentations.

Business Diagram Business Bar Graph For Data Analysis Presentation Template
This business slide displays pie charts with percentage ratios. This diagram is a data visualization tool that gives you a simple way to present statistical information. This slide helps your audience examines and interprets the data you present.


 Continue with Email

 Home
Home


