Performance Comparison
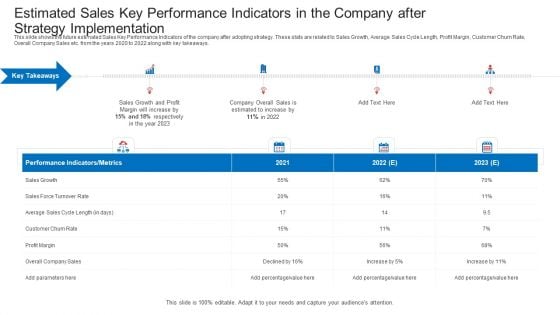
Estimated Sales Key Performance Indicators In The Company After Strategy Implementation Information PDF
This slide shows the future estimated Sales Key Performance Indicators of the company after adopting strategy. These stats are related to Sales Growth, Average Sales Cycle Length, Profit Margin, Customer Churn Rate, Overall Company Sales etc. from the years 2021 to 2023 along with key takeaways. This is a estimated sales key performance indicators in the company after strategy implementation information pdf template with various stages. Focus and dispense information on four stages using this creative set, that comes with editable features. It contains large content boxes to add your information on topics like performance, sales, growth, profit margin. You can also showcase facts, figures, and other relevant content using this PPT layout. Grab it now.
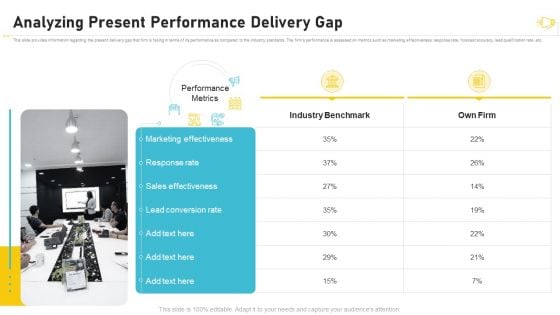
Buzz Marketing Strategies For Brand Promotion Analyzing Present Performance Delivery Gap Slides PDF
This slide provides information regarding the present delivery gap that firm is facing in terms of its performance as compared to the industry standards. The firms performance is assessed on metrics such as marketing effectiveness, response rate, forecast accuracy, lead qualification rate, etc. This is a buzz marketing strategies for brand promotion analyzing present performance delivery gap slides pdf template with various stages. Focus and dispense information on two stages using this creative set, that comes with editable features. It contains large content boxes to add your information on topics like marketing effectiveness, response rate, forecast accuracy, lead qualification rate. You can also showcase facts, figures, and other relevant content using this PPT layout. Grab it now.
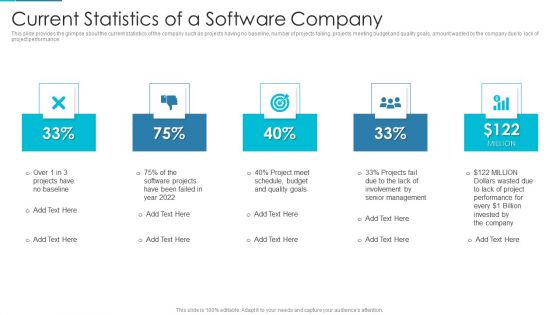
Project Management Outline For Schedule Performance Index Current Statistics Of A Software Company Diagrams PDF
This slide provides the glimpse about the current statistics of the company such as projects having no baseline, number of projects failing, projects meeting budget and quality goals, amount wasted by the company due to lack of project performance. This is a project management outline for schedule performance index current statistics of a software company diagrams pdf template with various stages. Focus and dispense information on five stages using this creative set, that comes with editable features. It contains large content boxes to add your information on topics like performance, management, budget, quality goals, lack of involvement. You can also showcase facts, figures, and other relevant content using this PPT layout. Grab it now.
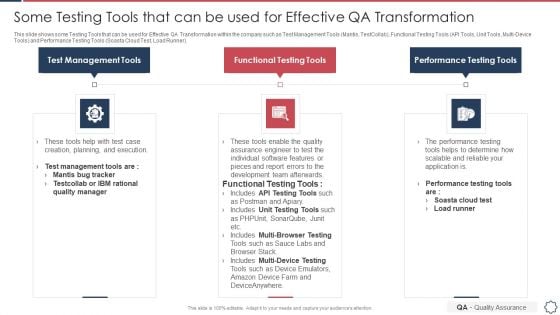
Quality Assurance Transformation Strategies To Improve Business Performance Efficiency Some Testing Tools Structure PDF
This slide shows some Testing Tools that can be used for Effective QA Transformation within the company such as Test Management Tools Mantis, TestCollab, Functional Testing Tools API Tools, Unit Tools, Multi Device Tools and Performance Testing Tools Soasta Cloud Test, Load Runner. This is a quality assurance transformation strategies to improve business performance efficiency some testing tools structure pdf template with various stages. Focus and dispense information on three stages using this creative set, that comes with editable features. It contains large content boxes to add your information on topics like test management tools, functional testing tools, performance testing tools. You can also showcase facts, figures, and other relevant content using this PPT layout. Grab it now.
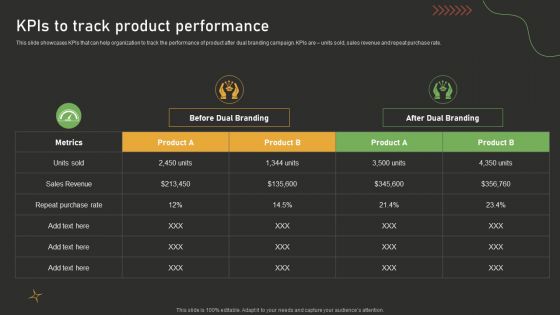
Kpis To Track Product Performance Dual Branding Campaign For Product Promotion Information PDF
This slide showcases KPIs that can help organization to track the performance of product after dual branding campaign. KPIs are units sold, sales revenue and repeat purchase rate.This Kpis To Track Product Performance Dual Branding Campaign For Product Promotion Information PDF is perfect for any presentation, be it in front of clients or colleagues. It is a versatile and stylish solution for organizing your meetings. The Kpis To Track Product Performance Dual Branding Campaign For Product Promotion Information PDF features a modern design for your presentation meetings. The adjustable and customizable slides provide unlimited possibilities for acing up your presentation. Slidegeeks has done all the homework before launching the product for you. So, do not wait, grab the presentation templates today
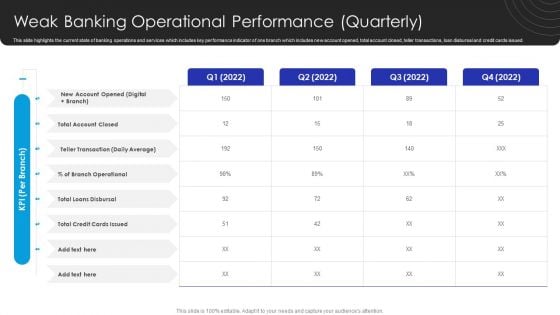
Operational Innovation In Banking Weak Banking Operational Performance Quarterly Clipart PDF
This slide highlights the current state of banking operations and services which includes key performance indicator of one branch which includes new account opened, total account closed, teller transactions, loan disbursal and credit cards issued. Are you searching for a Operational Innovation In Banking Weak Banking Operational Performance Quarterly Clipart PDF that is uncluttered, straightforward, and original Its easy to edit, and you can change the colors to suit your personal or business branding. For a presentation that expresses how much effort youve put in, this template is ideal With all of its features, including tables, diagrams, statistics, and lists, its perfect for a business plan presentation. Make your ideas more appealing with these professional slides. Download Operational Innovation In Banking Weak Banking Operational Performance Quarterly Clipart PDF from Slidegeeks today.
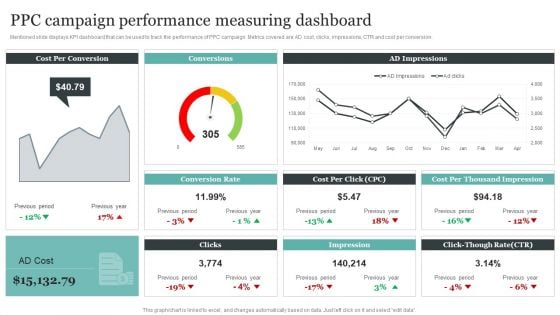
Comprehensive Personal Branding Guidelines Ppc Campaign Performance Measuring Dashboard Mockup PDF
Mentioned slide displays KPI dashboard that can be used to track the performance of PPC campaign. Metrics covered are AD cost, clicks, impressions, CTR and cost per conversion.This Comprehensive Personal Branding Guidelines Ppc Campaign Performance Measuring Dashboard Mockup PDF is perfect for any presentation, be it in front of clients or colleagues. It is a versatile and stylish solution for organizing your meetings. The Comprehensive Personal Branding Guidelines Ppc Campaign Performance Measuring Dashboard Mockup PDF features a modern design for your presentation meetings. The adjustable and customizable slides provide unlimited possibilities for acing up your presentation. Slidegeeks has done all the homework before launching the product for you. So, do not wait, grab the presentation templates today.
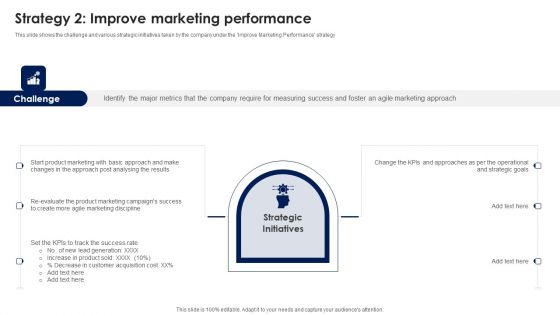
Strategy 2 Improve Marketing Performance Ppt PowerPoint Presentation File Pictures PDF
This slide shows the challenge and various strategic initiatives taken by the company under the Improve Marketing Performance strategy Are you searching for a Strategy 2 Improve Marketing Performance Ppt PowerPoint Presentation File Pictures PDF that is uncluttered, straightforward, and original Its easy to edit, and you can change the colors to suit your personal or business branding. For a presentation that expresses how much effort you have put in, this template is ideal With all of its features, including tables, diagrams, statistics, and lists, its perfect for a business plan presentation. Make your ideas more appealing with these professional slides. Download Strategy 2 Improve Marketing Performance Ppt PowerPoint Presentation File Pictures PDF from Slidegeeks today.
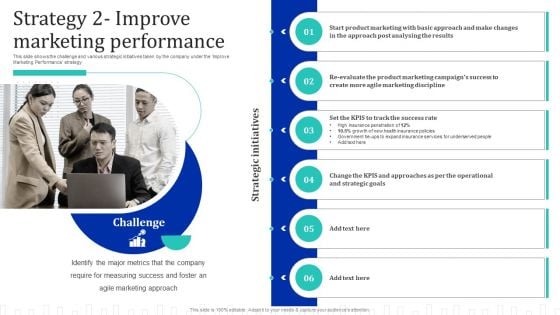
Approach Optimization For Brand Promotion Strategy Strategy 2 Improve Marketing Performance Pictures PDF
This slide shows the challenge and various strategic initiatives taken by the company under the Improve Marketing Performance strategy.Are you searching for a Approach Optimization For Brand Promotion Strategy Strategy 2 Improve Marketing Performance Pictures PDF that is uncluttered, straightforward, and original Its easy to edit, and you can change the colors to suit your personal or business branding. For a presentation that expresses how much effort you ve put in, this template is ideal With all of its features, including tables, diagrams, statistics, and lists, its perfect for a business plan presentation. Make your ideas more appealing with these professional slides. Download Approach Optimization For Brand Promotion Strategy Strategy 2 Improve Marketing Performance Pictures PDF from Slidegeeks today.
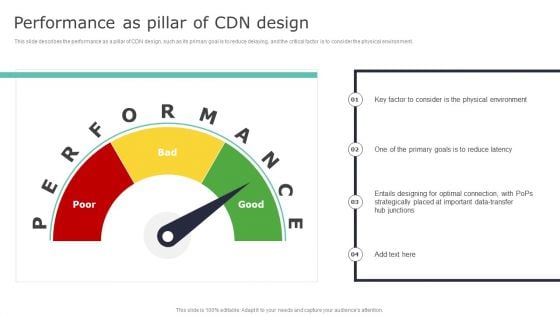
Deploying Content Distribution Network System Performance As Pillar Of CDN Design Introduction PDF
This slide describes the performance as a pillar of CDN design, such as its primary goal is to reduce delaying, and the critical factor is to consider the physical environment. Are you searching for a Deploying Content Distribution Network System Performance As Pillar Of CDN Design Introduction PDF that is uncluttered, straightforward, and original Its easy to edit, and you can change the colors to suit your personal or business branding. For a presentation that expresses how much effort youve put in, this template is ideal With all of its features, including tables, diagrams, statistics, and lists, its perfect for a business plan presentation. Make your ideas more appealing with these professional slides. Download Deploying Content Distribution Network System Performance As Pillar Of CDN Design Introduction PDF from Slidegeeks today.
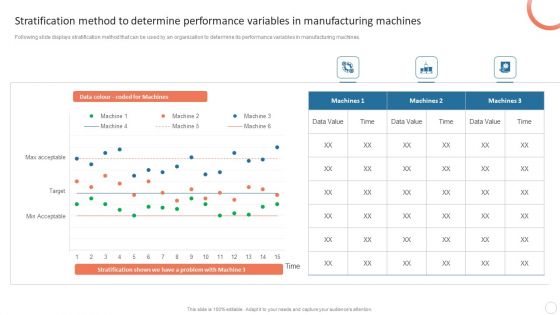
Quality Control Plan Stratification Method To Determine Performance Variables Guidelines PDF
Following slide displays stratification method that can be used by an organization to determine its performance variables in manufacturing machines. Are you searching for a Quality Control Plan Stratification Method To Determine Performance Variables Guidelines PDF that is uncluttered, straightforward, and original Its easy to edit, and you can change the colors to suit your personal or business branding. For a presentation that expresses how much effort youve put in, this template is ideal With all of its features, including tables, diagrams, statistics, and lists, its perfect for a business plan presentation. Make your ideas more appealing with these professional slides. Download Quality Control Plan Stratification Method To Determine Performance Variables Guidelines PDF from Slidegeeks today.
Implementing Ecommerce Marketing Services Plan Performance Metrics Of Online Advertising Icons PDF
This slide shows the performance metrics of online advertising that includes clicks, impressions, click through rate, cost per click, cost per thousand impressions and return on investment. This Implementing Ecommerce Marketing Services Plan Performance Metrics Of Online Advertising Icons PDF is perfect for any presentation, be it in front of clients or colleagues. It is a versatile and stylish solution for organizing your meetings. The Implementing Ecommerce Marketing Services Plan Performance Metrics Of Online Advertising Icons PDF features a modern design for your presentation meetings. The adjustable and customizable slides provide unlimited possibilities for acing up your presentation. Slidegeeks has done all the homework before launching the product for you. So, do not wait, grab the presentation templates today.
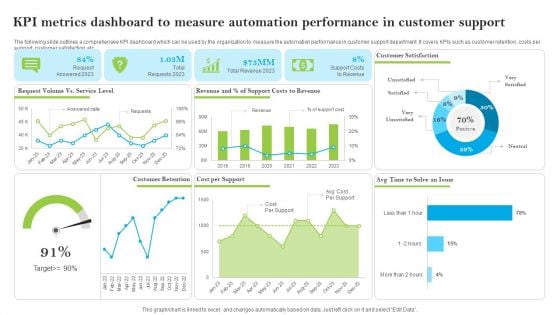
Introducing AI Tools KPI Metrics Dashboard To Measure Automation Performance Formats PDF
The following slide outlines a comprehensive KPI dashboard which can be used by the organization to measure the automation performance in customer support department. It covers KPIs such as customer retention, costs per support, customer satisfaction, etc. This Introducing AI Tools KPI Metrics Dashboard To Measure Automation Performance Formats PDF is perfect for any presentation, be it in front of clients or colleagues. It is a versatile and stylish solution for organizing your meetings. The Introducing AI Tools KPI Metrics Dashboard To Measure Automation Performance Formats PDF features a modern design for your presentation meetings. The adjustable and customizable slides provide unlimited possibilities for acing up your presentation. Slidegeeks has done all the homework before launching the product for you. So, dont wait, grab the presentation templates today.
5G Network Operations Performance Tracking Dashboard For 5G Architecture Demonstration PDF
This slide describes the performance tracking dashboard for 5G architecture by covering the details of subscribers, quality of experience, consumption, customer support, coverage, devices, and dimensions. Are you searching for a 5G Network Operations Performance Tracking Dashboard For 5G Architecture Demonstration PDF that is uncluttered, straightforward, and original. Its easy to edit, and you can change the colors to suit your personal or business branding. For a presentation that expresses how much effort youve put in, this template is ideal With all of its features, including tables, diagrams, statistics, and lists, its perfect for a business plan presentation. Make your ideas more appealing with these professional slides. Download 5G Network Operations Performance Tracking Dashboard For 5G Architecture Demonstration PDF from Slidegeeks today.
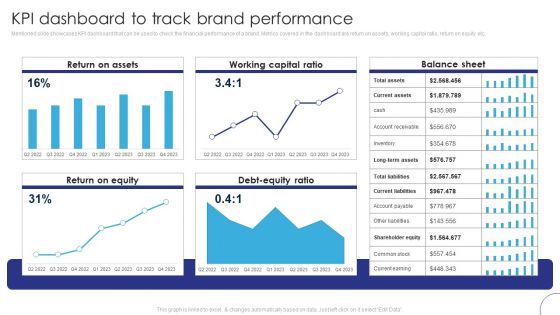
Implementing Brand Leadership Kpi Dashboard To Track Brand Performance Themes PDF
Mentioned slide showcases KPI dashboard that can be used to check the financial performance of a brand. Metrics covered in the dashboard are return on assets, working capital ratio, return on equity etc. This Implementing Brand Leadership Kpi Dashboard To Track Brand Performance Themes PDF is perfect for any presentation, be it in front of clients or colleagues. It is a versatile and stylish solution for organizing your meetings. The Implementing Brand Leadership Kpi Dashboard To Track Brand Performance Themes PDF features a modern design for your presentation meetings. The adjustable and customizable slides provide unlimited possibilities for acing up your presentation. Slidegeeks has done all the homework before launching the product for you. So, dont wait, grab the presentation templates today.
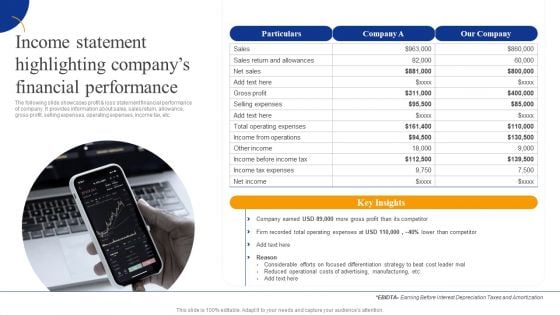
Income Statement Highlighting Companys Financial Performance Strategic Management For Competitive Portrait PDF
The following slide showcases profit loss statement financial performance of company. It provides information about sales, sales return, allowance, gross profit, selling expenses, operating expenses, income tax, etc.This Income Statement Highlighting Companys Financial Performance Strategic Management For Competitive Portrait PDF is perfect for any presentation, be it in front of clients or colleagues. It is a versatile and stylish solution for organizing your meetings. The Income Statement Highlighting Companys Financial Performance Strategic Management For Competitive Portrait PDF features a modern design for your presentation meetings. The adjustable and customizable slides provide unlimited possibilities for acing up your presentation. Slidegeeks has done all the homework before launching the product for you. So, do not wait, grab the presentation templates today
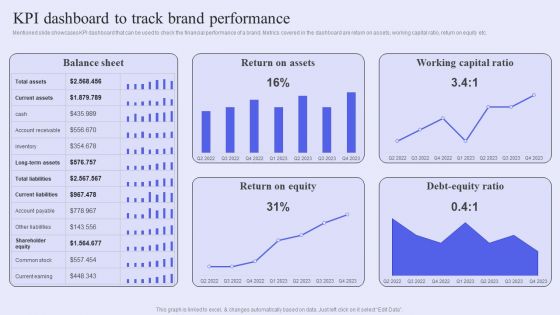
Brand Management Strategy To Increase Awareness KPI Dashboard To Track Brand Performance Slides PDF
Mentioned slide showcases KPI dashboard that can be used to check the financial performance of a brand. Metrics covered in the dashboard are return on assets, working capital ratio, return on equity etc. This Brand Management Strategy To Increase Awareness KPI Dashboard To Track Brand Performance Slides PDF is perfect for any presentation, be it in front of clients or colleagues. It is a versatile and stylish solution for organizing your meetings. The Brand Management Strategy To Increase Awareness KPI Dashboard To Track Brand Performance Slides PDF features a modern design for your presentation meetings. The adjustable and customizable slides provide unlimited possibilities for acing up your presentation. Slidegeeks has done all the homework before launching the product for you. So, dont wait, grab the presentation templates today
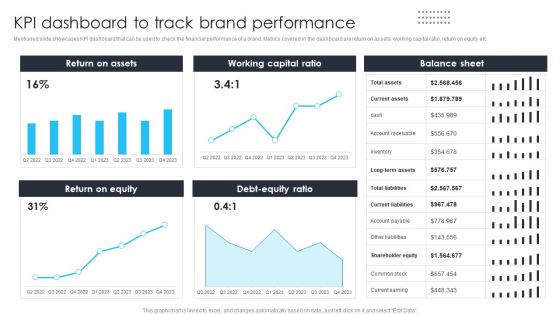
Building Brand Leadership Strategy To Dominate The Market KPI Dashboard To Track Brand Performance Formats PDF
Mentioned slide showcases KPI dashboard that can be used to check the financial performance of a brand. Metrics covered in the dashboard are return on assets, working capital ratio, return on equity etc.This Building Brand Leadership Strategy To Dominate The Market KPI Dashboard To Track Brand Performance Formats PDF is perfect for any presentation, be it in front of clients or colleagues. It is a versatile and stylish solution for organizing your meetings. The Building Brand Leadership Strategy To Dominate The Market KPI Dashboard To Track Brand Performance Formats PDF features a modern design for your presentation meetings. The adjustable and customizable slides provide unlimited possibilities for acing up your presentation. Slidegeeks has done all the homework before launching the product for you. So, dont wait, grab the presentation templates today
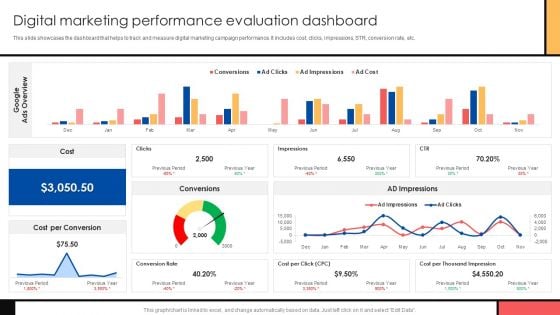
Guide To Create Advertising Campaign For Client Engagement Digital Marketing Performance Evaluation Dashboard Background PDF
This slide showcases the dashboard that helps to track and measure digital marketing campaign performance. It includes cost, clicks, impressions, STR, conversion rate, etc. This Guide To Create Advertising Campaign For Client Engagement Digital Marketing Performance Evaluation Dashboard Background PDF is perfect for any presentation, be it in front of clients or colleagues. It is a versatile and stylish solution for organizing your meetings. The Guide To Create Advertising Campaign For Client Engagement Digital Marketing Performance Evaluation Dashboard Background PDF features a modern design for your presentation meetings. The adjustable and customizable slides provide unlimited possibilities for acing up your presentation. Slidegeeks has done all the homework before launching the product for you. So, do not wait, grab the presentation templates today
How To Boost Brand Recognition Performance Evaluation Of Potential Social Media Icons PDF
This slide provides information regarding performance evaluation of potential social media influencer partner in terms of followers, average like, average comments, engagement rate, etc. This How To Boost Brand Recognition Performance Evaluation Of Potential Social Media Icons PDF is perfect for any presentation, be it in front of clients or colleagues. It is a versatile and stylish solution for organizing your meetings. The How To Boost Brand Recognition Performance Evaluation Of Potential Social Media Icons PDF features a modern design for your presentation meetings. The adjustable and customizable slides provide unlimited possibilities for acing up your presentation. Slidegeeks has done all the homework before launching the product for you. So, dont wait, grab the presentation templates today.
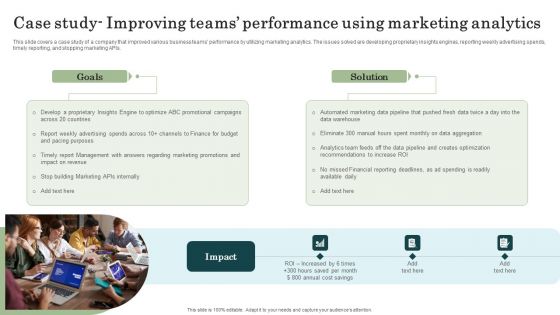
Marketing Success Metrics Case Study Improving Teams Performance Using Rules PDF
This slide covers a case study of a company that improved various business teams performance by utilizing marketing analytics. The issues solved are developing proprietary insights engines, reporting weekly advertising spends, timely reporting, and stopping marketing APIs. Are you searching for a Marketing Success Metrics Case Study Improving Teams Performance Using Rules PDF that is uncluttered, straightforward, and original Its easy to edit, and you can change the colors to suit your personal or business branding. For a presentation that expresses how much effort youve put in, this template is ideal With all of its features, including tables, diagrams, statistics, and lists, its perfect for a business plan presentation. Make your ideas more appealing with these professional slides. Download Marketing Success Metrics Case Study Improving Teams Performance Using Rules PDF from Slidegeeks today.
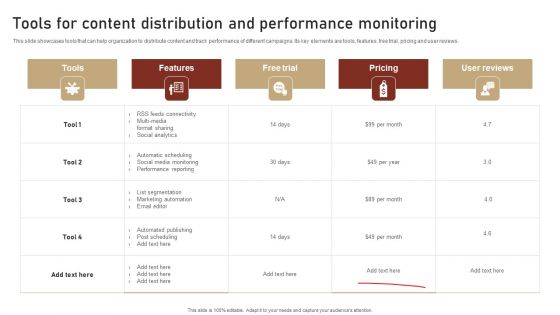
Content Delivery And Promotion Tools For Content Distribution And Performance Summary PDF
This slide showcases tools that can help organization to distribute content and track performance of different campaigns. Its key elements are tools, features, free trial, pricing and user reviews. If you are looking for a format to display your unique thoughts, then the professionally designed Content Delivery And Promotion Tools For Content Distribution And Performance Summary PDF is the one for you. You can use it as a Google Slides template or a PowerPoint template. Incorporate impressive visuals, symbols, images, and other charts. Modify or reorganize the text boxes as you desire. Experiment with shade schemes and font pairings. Alter, share or cooperate with other people on your work. Download Content Delivery And Promotion Tools For Content Distribution And Performance Summary PDF and find out how to give a successful presentation. Present a perfect display to your team and make your presentation unforgettable.
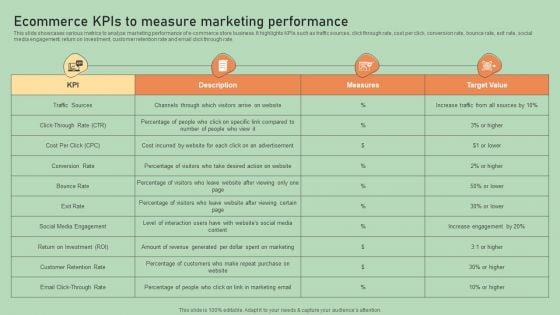
E Commerce Business Development Plan Ecommerce Kpis To Measure Marketing Performance Elements PDF
This slide showcases various metrics to analyze marketing performance of e-commerce store business. It highlights KPIs such as traffic sources, click through rate, cost per click, conversion rate, bounce rate, exit rate, social media engagement, return on investment, customer retention rate and email click through rate. Are you searching for a E Commerce Business Development Plan Ecommerce Kpis To Measure Marketing Performance Elements PDF that is uncluttered, straightforward, and original Its easy to edit, and you can change the colors to suit your personal or business branding. For a presentation that expresses how much effort you have put in, this template is ideal With all of its features, including tables, diagrams, statistics, and lists, its perfect for a business plan presentation. Make your ideas more appealing with these professional slides. Download E Commerce Business Development Plan Ecommerce Kpis To Measure Marketing Performance Elements PDF from Slidegeeks today.

Optimize Brand Valuation Improving Corporate Performance Through Leveraged Brand Inspiration PDF
This slide provides information regarding ways through which brand performance can be improved such as decoding customer mindset, revamping brand storytelling, enable consistency across all touchpoints. This Optimize Brand Valuation Improving Corporate Performance Through Leveraged Brand Inspiration PDF is perfect for any presentation, be it in front of clients or colleagues. It is a versatile and stylish solution for organizing your meetings. The Optimize Brand Valuation Improving Corporate Performance Through Leveraged Brand Inspiration PDF features a modern design for your presentation meetings. The adjustable and customizable slides provide unlimited possibilities for acing up your presentation. Slidegeeks has done all the homework before launching the product for you. So, do not wait, grab the presentation templates today.
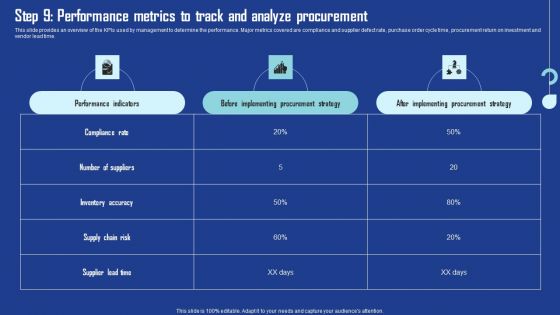
Step 9 Performance Metrics To Track And Analyze Procurement Diagrams PDF
This slide provides an overview of the KPIs used by management to determine the performance. Major metrics covered are compliance and supplier defect rate, purchase order cycle time, procurement return on investment and vendor lead time. Are you searching for a Step 9 Performance Metrics To Track And Analyze Procurement Diagrams PDF that is uncluttered, straightforward, and original Its easy to edit, and you can change the colors to suit your personal or business branding. For a presentation that expresses how much effort you have put in, this template is ideal. With all of its features, including tables, diagrams, statistics, and lists, its perfect for a business plan presentation. Make your ideas more appealing with these professional slides. Download Step 9 Performance Metrics To Track And Analyze Procurement Diagrams PDF from Slidegeeks today.
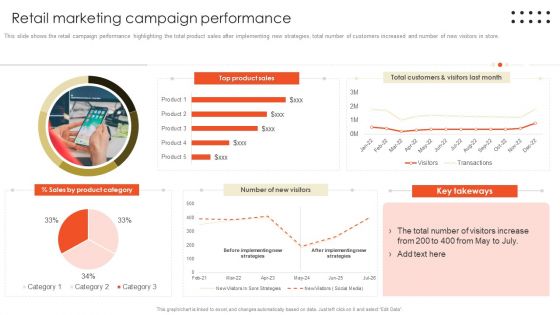
Retail Marketing Campaign Effective Techniques Retail Marketing Campaign Performance Topics PDF
This slide shows the retail campaign performance highlighting the total product sales after implementing new strategies, total number of customers increased and number of new visitors in store.Are you searching for a Retail Marketing Campaign Effective Techniques Retail Marketing Campaign Performance Topics PDF that is uncluttered, straightforward, and original Its easy to edit, and you can change the colors to suit your personal or business branding. For a presentation that expresses how much effort you have put in, this template is ideal. With all of its features, including tables, diagrams, statistics, and lists, its perfect for a business plan presentation. Make your ideas more appealing with these professional slides. Download Retail Marketing Campaign Effective Techniques Retail Marketing Campaign Performance Topics PDF from Slidegeeks today.

Umbrella Branding Measures To Boost Brand Awareness Improving Corporate Performance Through Leveraged Clipart PDF
This slide provides information regarding ways through which brand performance can be improved such as decoding customer mindset, revamping brand storytelling, enable consistency across all touchpoints. This Umbrella Branding Measures To Boost Brand Awareness Improving Corporate Performance Through Leveraged Clipart PDF is perfect for any presentation, be it in front of clients or colleagues. It is a versatile and stylish solution for organizing your meetings. The Umbrella Branding Measures To Boost Brand Awareness Improving Corporate Performance Through Leveraged Clipart PDF features a modern design for your presentation meetings. The adjustable and customizable slides provide unlimited possibilities for acing up your presentation. Slidegeeks has done all the homework before launching the product for you. So, do not wait, grab the presentation templates today
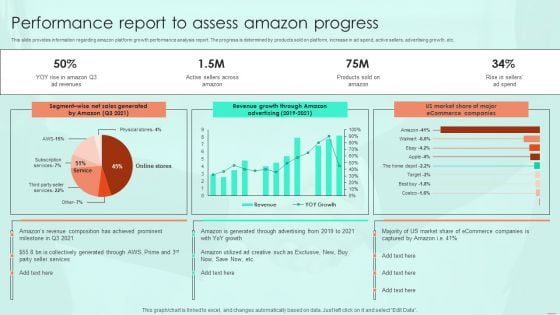
Performance Report To Assess Amazon Progress Ppt PowerPoint Presentation File Styles PDF
This slide provides information regarding amazon platform growth performance analysis report. The progress is determined by products sold on platform, increase in ad spend, active sellers, advertising growth, etc. Are you searching for a Performance Report To Assess Amazon Progress Ppt PowerPoint Presentation File Styles PDF that is uncluttered, straightforward, and original Its easy to edit, and you can change the colors to suit your personal or business branding. For a presentation that expresses how much effort you have put in, this template is ideal With all of its features, including tables, diagrams, statistics, and lists, its perfect for a business plan presentation. Make your ideas more appealing with these professional slides. Download Performance Report To Assess Amazon Progress Ppt PowerPoint Presentation File Styles PDF from Slidegeeks today.
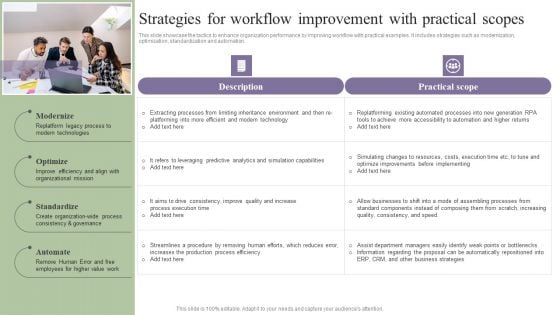
Deployment Of Process Automation To Increase Organisational Performance Strategies For Workflow Improvement Infographics PDF
This slide showcase the tactics to enhance organization performance by improving workflow with practical examples. It includes strategies such as modernization, optimization, standardization and automation. Are you searching for a Deployment Of Process Automation To Increase Organisational Performance Strategies For Workflow Improvement Infographics PDF that is uncluttered, straightforward, and original Its easy to edit, and you can change the colors to suit your personal or business branding. For a presentation that expresses how much effort you have put in, this template is ideal. With all of its features, including tables, diagrams, statistics, and lists, its perfect for a business plan presentation. Make your ideas more appealing with these professional slides. Download Deployment Of Process Automation To Increase Organisational Performance Strategies For Workflow Improvement Infographics PDF from Slidegeeks today.
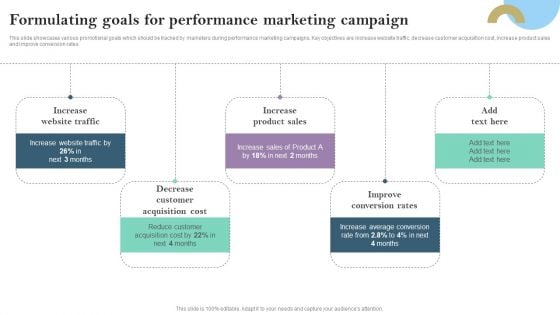
Formulating Goals For Performance Marketing Campaign Ppt PowerPoint Presentation File Example PDF
This slide showcases various promotional goals which should be tracked by marketers during performance marketing campaigns. Key objectives are increase website traffic, decrease customer acquisition cost, increase product sales and improve conversion rates Are you searching for a Formulating Goals For Performance Marketing Campaign Ppt PowerPoint Presentation File Example PDF that is uncluttered, straightforward, and original Its easy to edit, and you can change the colors to suit your personal or business branding. For a presentation that expresses how much effort you have put in, this template is ideal. With all of its features, including tables, diagrams, statistics, and lists, its perfect for a business plan presentation. Make your ideas more appealing with these professional slides. Download Formulating Goals For Performance Marketing Campaign Ppt PowerPoint Presentation File Example PDF from Slidegeeks today.
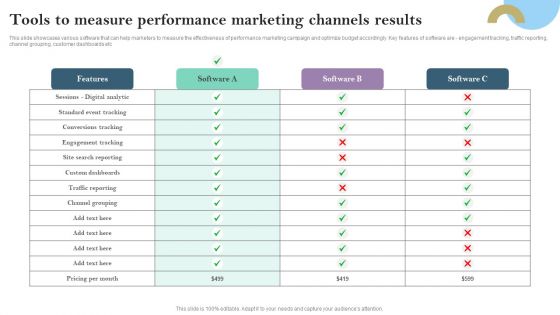
Tools To Measure Performance Marketing Channels Results Ppt PowerPoint Presentation File Diagrams PDF
This slide showcases various software that can help marketers to measure the effectiveness of performance marketing campaign and optimize budget accordingly. Key features of software are - engagement tracking, traffic reporting, channel grouping, customer dashboards etc Crafting an eye catching presentation has never been more straightforward. Let your presentation shine with this tasteful yet straightforward Tools To Measure Performance Marketing Channels Results Ppt PowerPoint Presentation File Diagrams PDF template. It offers a minimalistic and classy look that is great for making a statement. The colors have been employed intelligently to add a bit of playfulness while still remaining professional. Construct the ideal Tools To Measure Performance Marketing Channels Results Ppt PowerPoint Presentation File Diagrams PDF that effortlessly grabs the attention of your audience. Begin now and be certain to wow your customers.
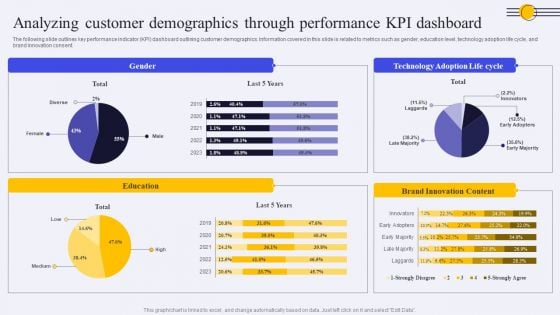
Analyzing Customer Demographics Through Performance KPI Dashboard Ppt PowerPoint Presentation File Model PDF
The following slide outlines key performance indicator KPI dashboard outlining customer demographics. Information covered in this slide is related to metrics such as gender, education level, technology adoption life cycle, and brand innovation consent. Are you searching for a Analyzing Customer Demographics Through Performance KPI Dashboard Ppt PowerPoint Presentation File Model PDF that is uncluttered, straightforward, and original Its easy to edit, and you can change the colors to suit your personal or business branding. For a presentation that expresses how much effort you have put in, this template is ideal. With all of its features, including tables, diagrams, statistics, and lists, its perfect for a business plan presentation. Make your ideas more appealing with these professional slides. Download Analyzing Customer Demographics Through Performance KPI Dashboard Ppt PowerPoint Presentation File Model PDF from Slidegeeks today.
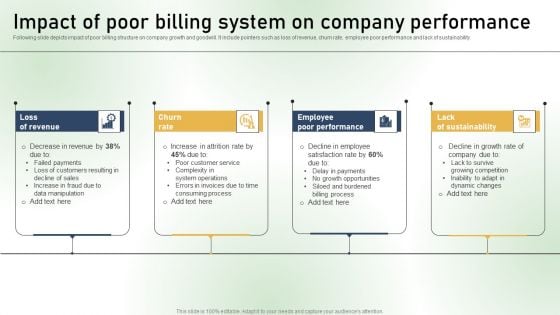
Impact Of Poor Billing System On Company Performance Ppt PowerPoint Presentation File Layouts PDF
Following slide depicts impact of poor billing structure on company growth and goodwill. It include pointers such as loss of revenue, churn rate, employee poor performance and lack of sustainability. Are you searching for a Impact Of Poor Billing System On Company Performance Ppt PowerPoint Presentation File Layouts PDF that is uncluttered, straightforward, and original Its easy to edit, and you can change the colors to suit your personal or business branding. For a presentation that expresses how much effort you have put in, this template is ideal. With all of its features, including tables, diagrams, statistics, and lists, its perfect for a business plan presentation. Make your ideas more appealing with these professional slides. Download Impact Of Poor Billing System On Company Performance Ppt PowerPoint Presentation File Layouts PDF from Slidegeeks today.
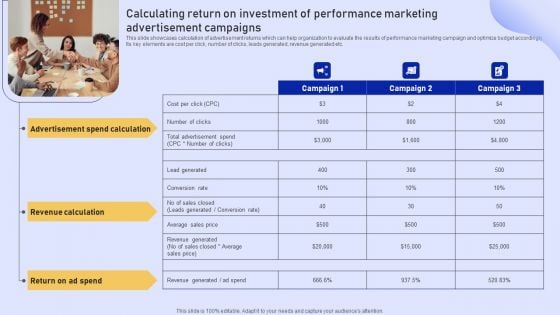
Online Marketing Strategy For Lead Generation Calculating Return On Investment Of Performance Marketing Clipart PDF
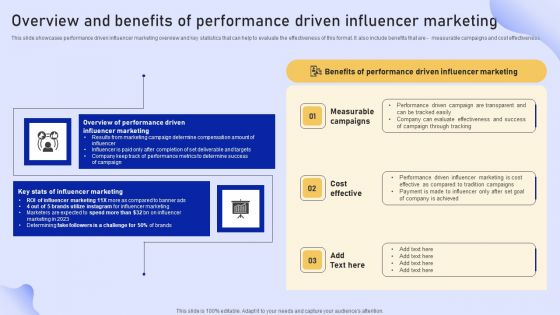
Online Marketing Strategy For Lead Generation Overview And Benefits Performance Driven Influencer Marketing Structure PDF
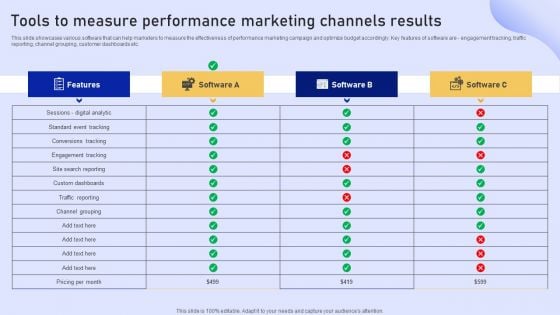
Online Marketing Strategy For Lead Generation Tools To Measure Performance Marketing Channels Results Elements PDF
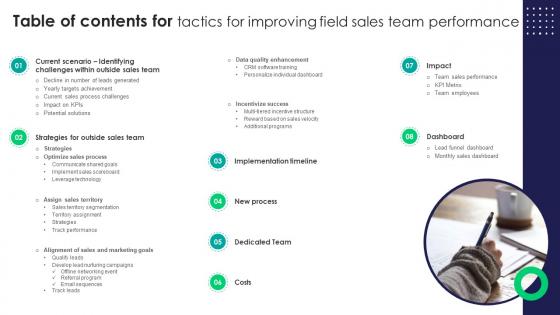
Table Of Contents For Tactics For Improving Field Sales Team Performance SA SS V
Are you searching for a Table Of Contents For Tactics For Improving Field Sales Team Performance SA SS V that is uncluttered, straightforward, and original Its easy to edit, and you can change the colors to suit your personal or business branding. For a presentation that expresses how much effort you have put in, this template is ideal With all of its features, including tables, diagrams, statistics, and lists, its perfect for a business plan presentation. Make your ideas more appealing with these professional slides. Download Table Of Contents For Tactics For Improving Field Sales Team Performance SA SS V from Slidegeeks today. Our Table Of Contents For Tactics For Improving Field Sales Team Performance SA SS V are topically designed to provide an attractive backdrop to any subject. Use them to look like a presentation pro.
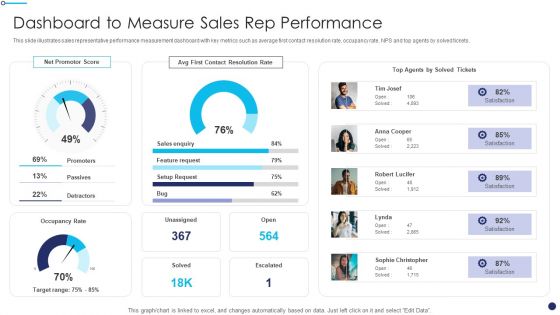
Effective Sales Technique For New Product Launch Dashboard To Measure Sales Rep Performance Themes PDF
This slide illustrates sales representative performance measurement dashboard with key metrics such as average first contact resolution rate, occupancy rate, NPS and top agents by solved tickets.Deliver and pitch your topic in the best possible manner with this Effective Sales Technique For New Product Launch Dashboard To Measure Sales Rep Performance Themes PDF Use them to share invaluable insights on Contact Resolution, Feature Request, Promoters and impress your audience. This template can be altered and modified as per your expectations. So, grab it now.
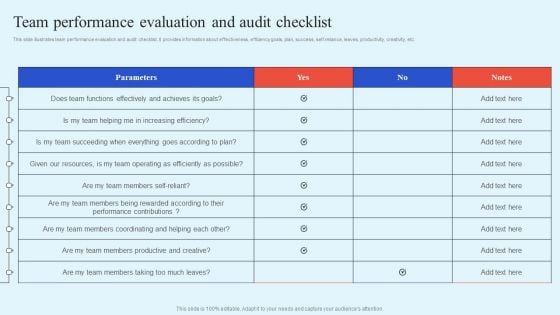
How Leaders Can Improve Team Effectiveness Team Performance Evaluation And Audit Checklist Brochure PDF
This slide illustrates team performance evaluation and audit checklist. It provides information about effectiveness, efficiency goals, plan, success, self-reliance, leaves, productivity, creativity, etc. Power up your presentations with our How Leaders Can Improve Team Effectiveness Team Performance Evaluation And Audit Checklist Brochure PDF single-slide PPT template. Our visually-stunning template will help you deliver your message with confidence. With easy-to-use editing options and fully customizable features, you can create polished and captivating presentations in no time. Say goodbye to boring slides and hello to impactful presentations with our top-quality template. Download now and get ready to wow your audience. singles
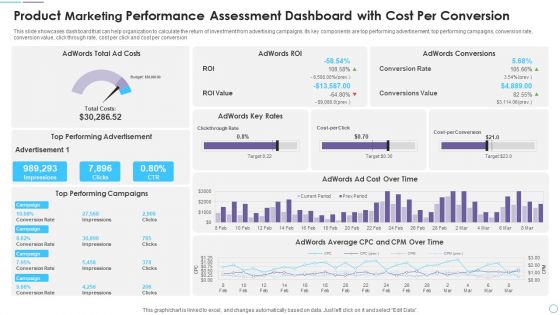
Product Marketing Performance Assessment Dashboard With Cost Per Conversion Professional PDF
This slide showcases dashboard that can help organization to calculate the return of investment from advertising campaigns. Its key components are top performing advertisement, top performing campaigns, conversion rate, conversion value, click through rate, cost per click and cost per conversion. Showcasing this set of slides titled Product Marketing Performance Assessment Dashboard With Cost Per Conversion Professional PDF. The topics addressed in these templates are Top Performing Advertisement, Top Performing Campaigns, AdWords Conversions. All the content presented in this PPT design is completely editable. Download it and make adjustments in color, background, font etc. as per your unique business setting.
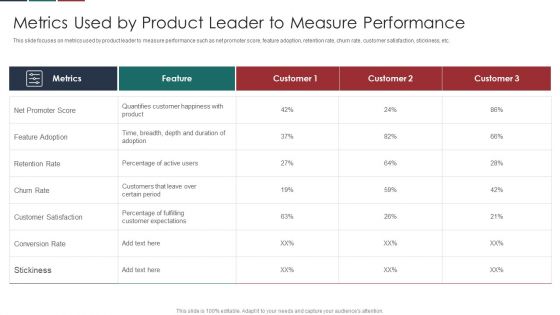
Deliver Efficiency Innovation Metrics Used By Product Leader To Measure Performance Microsoft PDF
This slide focuses on metrics used by product leader to measure performance such as net promoter score, feature adoption, retention rate, churn rate, customer satisfaction, stickiness, etc. Deliver and pitch your topic in the best possible manner with this Deliver Efficiency Innovation Metrics Used By Product Leader To Measure Performance Microsoft PDF. Use them to share invaluable insights on Feature Adoption, Churn Rate, Customer Satisfaction, Conversion Rate and impress your audience. This template can be altered and modified as per your expectations. So, grab it now.
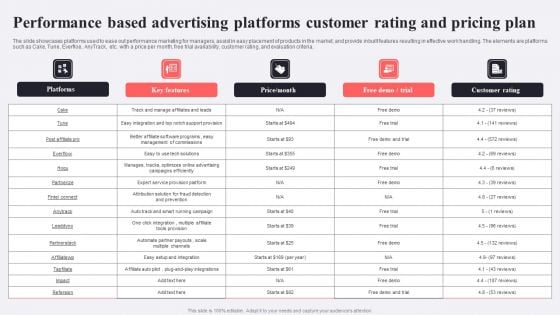
Performance Based Advertising Platforms Customer Rating And Pricing Plan Themes PDF
The slide showcases platforms used to ease out performance marketing for managers, assist in easy placement of products in the market, and provide inbuilt features resulting in effective work handling. The elements are platforms such as Cake, Tune, Everfloe, AnyTrack, etc. with a price per month, free trial availability, customer rating, and evaluation criteria. Showcasing this set of slides titled Performance Based Advertising Platforms Customer Rating And Pricing Plan Themes PDF. The topics addressed in these templates are Platforms, Key Features, Customer Rating. All the content presented in this PPT design is completely editable. Download it and make adjustments in color, background, font etc. as per your unique business setting.
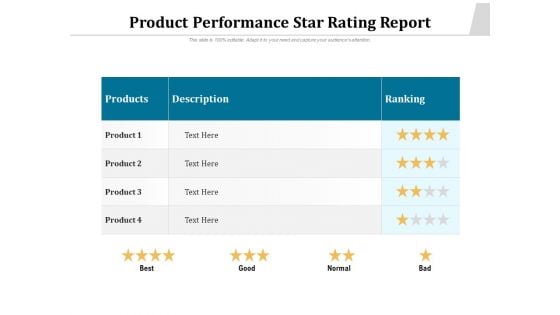
Product Performance Star Rating Report Ppt PowerPoint Presentation Portfolio Visual Aids PDF
Pitch your topic with ease and precision using this product performance star rating report ppt powerpoint presentation portfolio visual aids pdf. This layout presents information on products, description, ranking, best, good, normal, bad. It is also available for immediate download and adjustment. So, changes can be made in the color, design, graphics or any other component to create a unique layout.
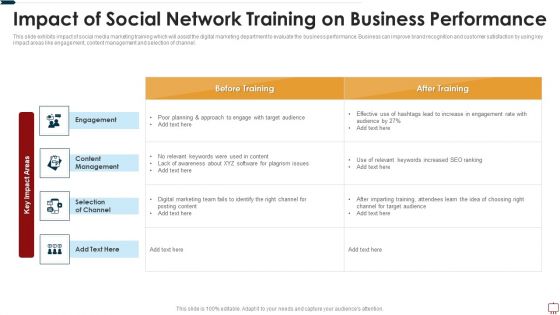
Impact Of Social Network Training On Business Performance Ppt Infographic Template Layouts PDF
This slide exhibits impact of social media marketing training which will assist the digital marketing department to evaluate the business performance. Business can improve brand recognition and customer satisfaction by using key impact areas like engagement, content management and selection of channel. Pitch your topic with ease and precision using this impact of social network training on business performance ppt infographic template layouts pdf. This layout presents information on engagement, content management, selection of channel. It is also available for immediate download and adjustment. So, changes can be made in the color, design, graphics or any other component to create a unique layout.
SFA Dashboard To Track Performance Ppt PowerPoint Presentation Icon Example File PDF
This Slide visually represents sales force automation dashboard to track performance which can be utilized by marketing managers to streamline the process of automated selling. It includes information about sales pipeline, competitors, opportunities, key competitors, etc. Pitch your topic with ease and precision using this sfa dashboard to track performance ppt powerpoint presentation icon example file pdf. This layout presents information on sales pipeline, sales pipeline by sales rep, key competitors, forecast by month, key opportunities. It is also available for immediate download and adjustment. So, changes can be made in the color, design, graphics or any other component to create a unique layout.
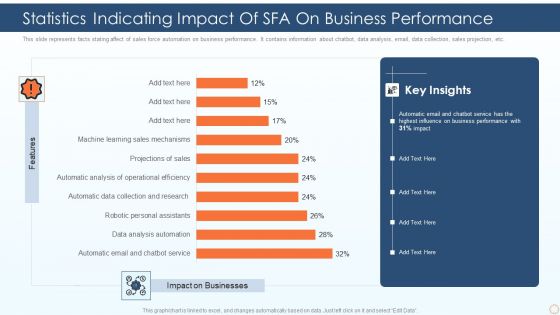
Statistics Indicating Impact Of SFA On Business Performance Ppt PowerPoint Presentation Gallery Outfit PDF
This slide represents facts stating affect of sales force automation on business performance. It contains information about chatbot, data analysis, email, data collection, sales projection, etc. Pitch your topic with ease and precision using this statistics indicating impact of sfa on business performance ppt powerpoint presentation gallery outfit pdf. This layout presents information on automatic email and chatbot service, data analysis automation, robotic personal assistants. It is also available for immediate download and adjustment. So, changes can be made in the color, design, graphics or any other component to create a unique layout.
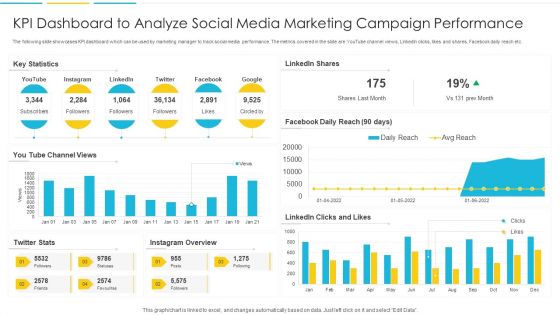
KPI Dashboard To Analyze Social Media Marketing Campaign Performance Rules PDF
The following slide showcases KPI dashboard which can be used by marketing manager to track social media performance. The metrics covered in the slide are YouTube channel views, LinkedIn clicks, likes and shares, Facebook daily reach etc. Pitch your topic with ease and precision using this KPI Dashboard To Analyze Social Media Marketing Campaign Performance Rules PDF. This layout presents information on Dashboard, Marketing, Analyze. It is also available for immediate download and adjustment. So, changes can be made in the color, design, graphics or any other component to create a unique layout.
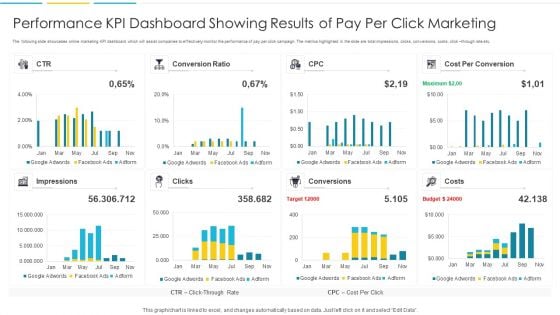
Performance KPI Dashboard Showing Results Of Pay Per Click Marketing Portrait PDF
The following slide showcases online marketing KPI dashboard which will assist companies to effectively monitor the performance of pay per click campaign. The metrics highlighted in the slide are total impressions, clicks, conversions, costs, click through rate etc. Pitch your topic with ease and precision using this Performance KPI Dashboard Showing Results Of Pay Per Click Marketing Portrait PDF. This layout presents information on Impressions, Target, Budget. It is also available for immediate download and adjustment. So, changes can be made in the color, design, graphics or any other component to create a unique layout.
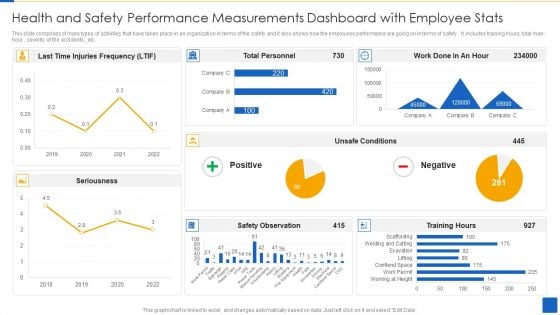
Health And Safety Performance Measurements Dashboard With Employee Stats Template PDF
This slide comprises of many types of activities that have taken place in an organization in terms of the safety and it also shows how the employees performance are going on in terms of safety . It includes training hours, total man-hour , severity of the accidents , etc.Pitch your topic with ease and precision using this Health And Safety Performance Measurements Dashboard With Employee Stats Template PDF This layout presents information on Safety Observation, Injuries Frequency, Unsafe Conditions It is also available for immediate download and adjustment. So, changes can be made in the color, design, graphics or any other component to create a unique layout.
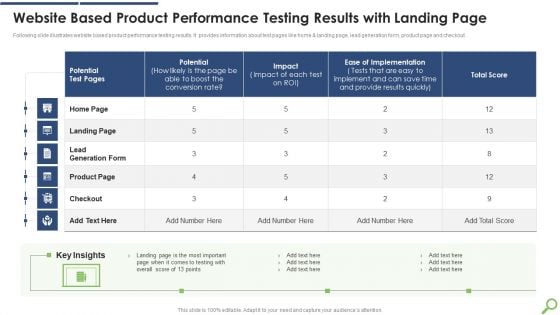
Website Based Product Performance Testing Results With Landing Page Mockup PDF
Following slide illustrates website based product performance testing results. It provides information about test pages like home and landing page, lead generation form, product page and checkout. Pitch your topic with ease and precision using this Website Based Product Performance Testing Results With Landing Page Mockup PDF This layout presents information on Provide Results, Potential Test, Ease Of Implementation It is also available for immediate download and adjustment. So, changes can be made in the color, design, graphics or any other component to create a unique layout.

Firm KPI Dashboard With Schedule Performance Index Ppt Visual Aids PDF
This graph or chart is linked to excel, and changes automatically based on data. Just left click on it and select Edit Data. Pitch your topic with ease and precision using this Firm KPI Dashboard With Schedule Performance Index Ppt Visual Aids PDF. This layout presents information on Project Cost Performance, Project Planning Stage, Monitor And Control. It is also available for immediate download and adjustment. So, changes can be made in the color, design, graphics or any other component to create a unique layout.
Objectives And Metrics To Measure Email Marketing Campaign Performance Icons PDF
The purpose of this slide is to showcase various objectives and KPIs of email marketing campaign. Marketers can track the success of campaign performance through click through rate CTR, unsubscribe rate, bounce rate and spam complaints rate. Pitch your topic with ease and precision using this Objectives And Metrics To Measure Email Marketing Campaign Performance Icons PDF. This layout presents information on Unsubscribe Rate, Bounce Rate, Spam Complaints Rate. It is also available for immediate download and adjustment. So, changes can be made in the color, design, graphics or any other component to create a unique layout.

Kpis To Measure International Growth Performance Ppt Infographics Graphic Tips PDF
This slide shows various KPIs which can be used to evaluate international growth performance. It includes revenue, e-commerce conversion rate, cost per acquisition, bounce rate, etc. Pitch your topic with ease and precision using this Kpis To Measure International Growth Performance Ppt Infographics Graphic Tips PDF. This layout presents information on Revenue, Cost Per Acquisition, Bounce Rate. It is also available for immediate download and adjustment. So, changes can be made in the color, design, graphics or any other component to create a unique layout.
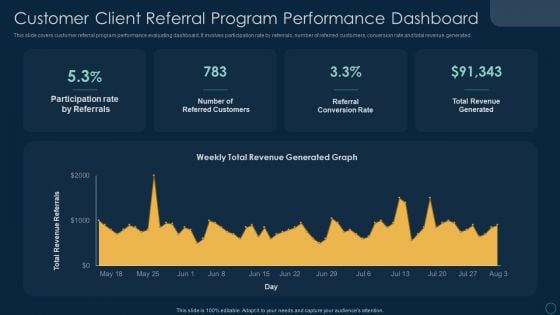
Customer Client Referral Program Performance Dashboard Ppt File Visual Aids PDF
This slide covers customer referral program performance evaluating dashboard. It involves participation rate by referrals, number of referred customers, conversion rate and total revenue generated. Pitch your topic with ease and precision using this Customer Client Referral Program Performance Dashboard Ppt File Visual Aids PDF. This layout presents information on Participation Rate Referrals, Number Referred Customers, Referral Conversion Rate. It is also available for immediate download and adjustment. So, changes can be made in the color, design, graphics or any other component to create a unique layout.
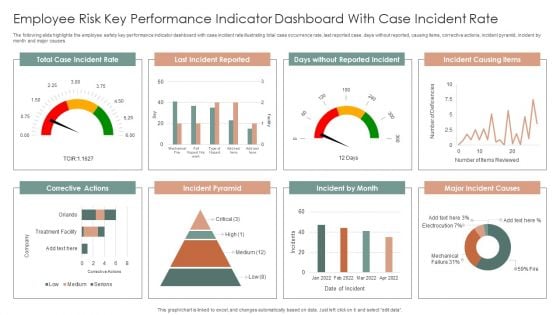
Employee Risk Key Performance Indicator Dashboard With Case Incident Rate Ppt Professional Information PDF
The following slide highlights the employee safety key performance indicator dashboard with case incident rate illustrating total case occurrence rate, last reported case, days without reported, causing items, corrective actions, incident pyramid, incident by month and major causes. Pitch your topic with ease and precision using this Employee Risk Key Performance Indicator Dashboard With Case Incident Rate Ppt Professional Information PDF. This layout presents information on Total Case, Incident Rate, Last Incident Reported, Incident Causing Items. It is also available for immediate download and adjustment. So, changes can be made in the color, design, graphics or any other component to create a unique layout.

Patient Health And Risk Key Performance Indicator Dashboard Ppt Infographic Template Summary PDF
The following slide highlights the patient health and safety key performance indicator dashboard illustrating admission by department, admission by cost, patient satisfaction, total patients, operations cost, patient density, total staff, waiting time, treatment satisfaction and treatment confidence. Pitch your topic with ease and precision using this Patient Health And Risk Key Performance Indicator Dashboard Ppt Infographic Template Summary PDF. This layout presents information on Admission By Department, Admission Vs Cost, Patient Satisfaction. It is also available for immediate download and adjustment. So, changes can be made in the color, design, graphics or any other component to create a unique layout.
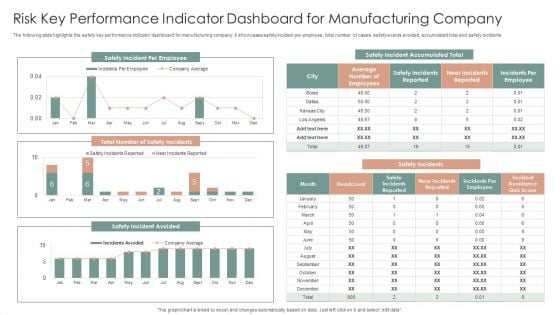
Risk Key Performance Indicator Dashboard For Manufacturing Company Ppt Gallery Graphics Design PDF
The following slide highlights the safety key performance indicator dashboard for manufacturing company. It showcases safety incident per employee, total number of cases, safety events avoided, accumulated total and safety incidents. Pitch your topic with ease and precision using this Risk Key Performance Indicator Dashboard For Manufacturing Company Ppt Gallery Graphics Design PDF. This layout presents information on Safety Incidents, Safety Incident Avoided, Safety Incident Accumulated. It is also available for immediate download and adjustment. So, changes can be made in the color, design, graphics or any other component to create a unique layout.
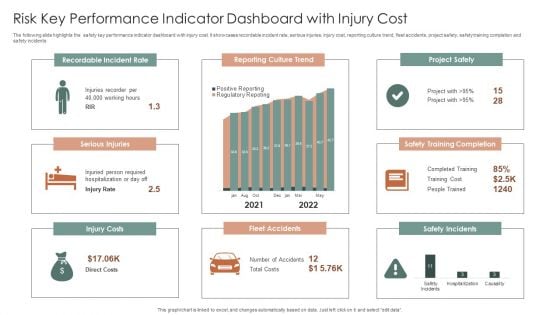
Risk Key Performance Indicator Dashboard With Injury Cost Ppt Summary Brochure PDF
The following slide highlights the safety key performance indicator dashboard with injury cost. It showcases recordable incident rate, serious injuries, injury cost, reporting culture trend, fleet accidents, project safety, safety training completion and safety incidents. Pitch your topic with ease and precision using this Risk Key Performance Indicator Dashboard With Injury Cost Ppt Summary Brochure PDF. This layout presents information on Recordable Incident Rate, Reporting Culture Trend, Project Safety. It is also available for immediate download and adjustment. So, changes can be made in the color, design, graphics or any other component to create a unique layout.
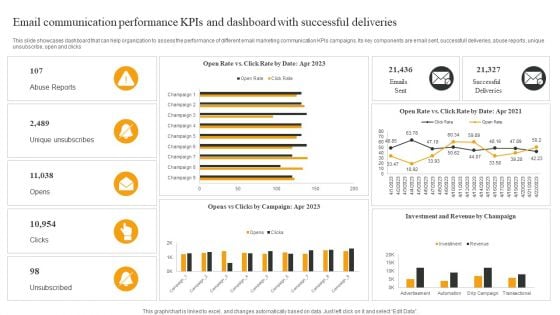
Email Communication Performance Kpis And Dashboard With Successful Deliveries Elements PDF
This slide showcases dashboard that can help organization to assess the performance of different email marketing communication KPIs campaigns. Its key components are email sent, successfull deliveries, abuse reports, unique unsubscribe, open and clicks. Showcasing this set of slides titled Email Communication Performance Kpis And Dashboard With Successful Deliveries Elements PDF. The topics addressed in these templates are Abuse Reports, Unique Unsubscribes, Opens. All the content presented in this PPT design is completely editable. Download it and make adjustments in color, background, font etc. as per your unique business setting.
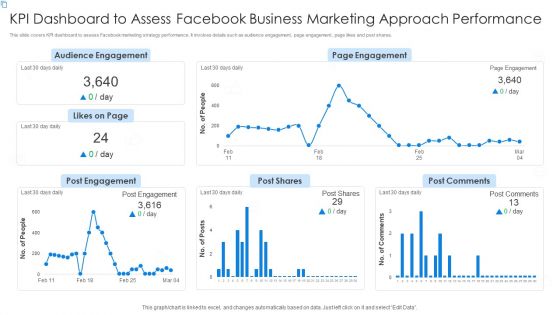
KPI Dashboard To Assess Facebook Business Marketing Approach Performance Portrait PDF
This slide covers KPI dashboard to assess Facebook marketing strategy performance. It involves details such as audience engagement, page engagement, page likes and post shares. Pitch your topic with ease and precision using this KPI Dashboard To Assess Facebook Business Marketing Approach Performance Portrait PDF. This layout presents information on Audience Engagement, Page Engagement, Post Comments. It is also available for immediate download and adjustment. So, changes can be made in the color, design, graphics or any other component to create a unique layout.


 Continue with Email

 Home
Home


