Performance Dashboard
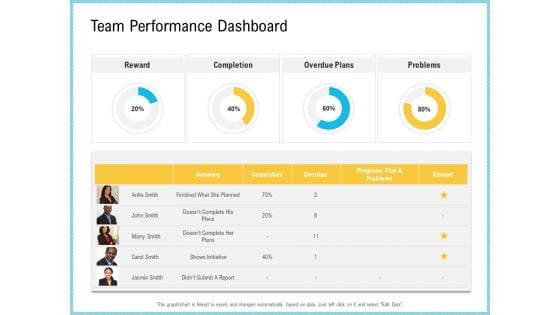
Team Collaboration Of Project Management Team Performance Dashboard Inspiration PDF
Deliver an awe-inspiring pitch with this creative team collaboration of project management team performance dashboard inspiration pdf bundle. Topics like completion, overdue plans, completion, progress, reward can be discussed with this completely editable template. It is available for immediate download depending on the needs and requirements of the user.
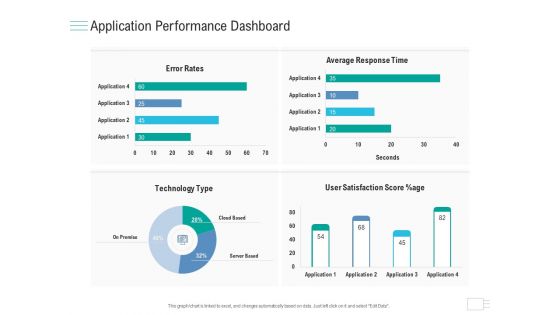
Business API Management Application Performance Dashboard Inspiration PDF
Deliver an awe-inspiring pitch with this creative business API management application performance dashboard inspiration pdf bundle. Topics like technology type, user satisfaction score, average response time, cloud based, server based can be discussed with this completely editable template. It is available for immediate download depending on the needs and requirements of the user.
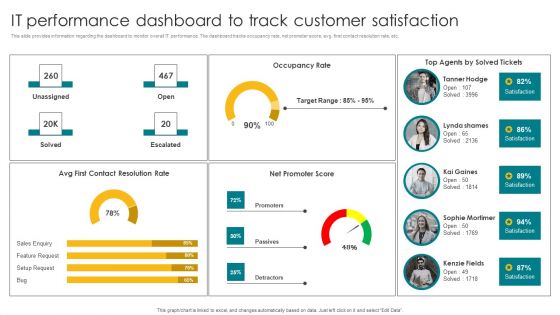
IT Performance Dashboard To Track Customer Satisfaction Elements PDF
This slide provides information regarding the dashboard to monitor overall IT performance. The dashboard tracks occupancy rate, net promoter score, avg. first contact resolution rate, etc. Boost your pitch with our creative IT Performance Dashboard To Track Customer Satisfaction Elements PDF. Deliver an awe inspiring pitch that will mesmerize everyone. Using these presentation templates you will surely catch everyones attention. You can browse the ppts collection on our website. We have researchers who are experts at creating the right content for the templates. So you do not have to invest time in any additional work. Just grab the template now and use them.
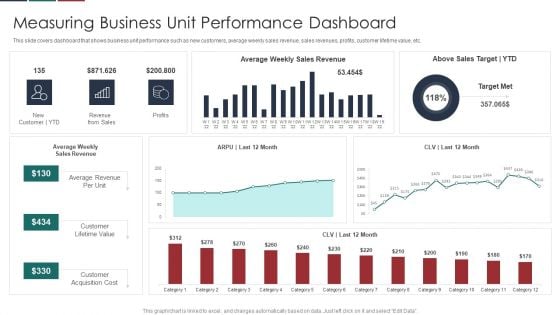
Deliver Efficiency Innovation Measuring Business Unit Performance Dashboard Background PDF
This slide covers dashboard that shows business unit performance such as new customers, average weekly sales revenue, sales revenues, profits, customer lifetime value, etc. Deliver an awe inspiring pitch with this creative Deliver Efficiency Innovation Measuring Business Unit Performance Dashboard Background PDF bundle. Topics like Customer Lifetime Value, Customer Acquisition Cost, Average Revenue Per Unit, Above Sales Target YTD can be discussed with this completely editable template. It is available for immediate download depending on the needs and requirements of the user.
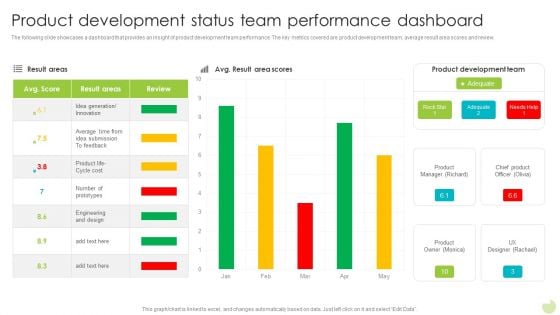
Product Development Status Team Performance Dashboard Template PDF
The following slide showcases a dashboard that provides an insight of product development team performance. The key metrics covered are product development team, average result area scores and review. Showcasing this set of slides titled Product Development Status Team Performance Dashboard Template PDF. The topics addressed in these templates are Average, Innovation, Product Development Team. All the content presented in this PPT design is completely editable. Download it and make adjustments in color, background, font etc. as per your unique business setting.
Application Performance Dashboard Mobile App Development Advertising Service Icons Pdf
This slide covers application performance in market KPIs and metrics such as impressions, clicks, searches for app, conversion rate etc. Find a pre designed and impeccable Application Performance Dashboard Mobile App Development Advertising Service Icons Pdf. The templates can ace your presentation without additional effort. You can download these easy to edit presentation templates to make your presentation stand out from others. So, what are you waiting for Download the template from Slidegeeks today and give a unique touch to your presentation. This slide covers application performance in market KPIs and metrics such as impressions, clicks, searches for app, conversion rate etc.

Quarterly Financial Performance Dashboard By Power BI Ppt Sample SS
This slide represents the pyramid showing the asset performance management. It includes details related to APM-centric, predictive, condition-based, preventive and reactive maintenance. Find a pre-designed and impeccable Quarterly Financial Performance Dashboard By Power BI Ppt Sample SS The templates can ace your presentation without additional effort. You can download these easy-to-edit presentation templates to make your presentation stand out from others. So, what are you waiting for Download the template from Slidegeeks today and give a unique touch to your presentation. This slide represents the pyramid showing the asset performance management. It includes details related to APM-centric, predictive, condition-based, preventive and reactive maintenance.
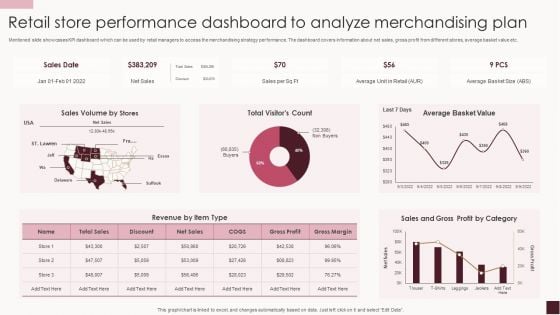
Retail Store Performance Dashboard To Analyze Merchandising Plan Structure PDF
Mentioned slide showcases KPI dashboard which can be used by retail managers to access the merchandising strategy performance. The dashboard covers information about net sales, gross profit from different stores, average basket value etc.Showcasing this set of slides titled Retail Store Performance Dashboard To Analyze Merchandising Plan Structure PDF. The topics addressed in these templates are Sales Volume, Average Basket, Gross Profit. All the content presented in this PPT design is completely editable. Download it and make adjustments in color, background, font etc. as per your unique business setting.
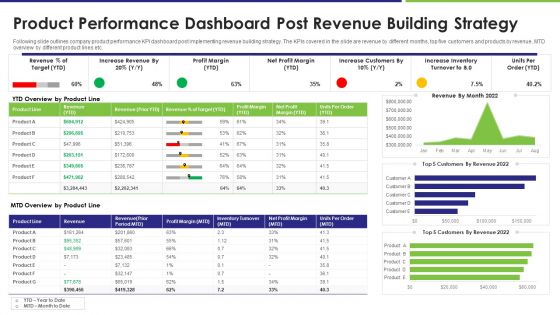
Product Performance Dashboard Post Revenue Building Strategy Brochure PDF
Following slide outlines company product performance KPI dashboard post implementing revenue building strategy. The KPIs covered in the slide are revenue by different months, top five customers and products by revenue, MTD overview by different product lines etc. Showcasing this set of slides titled product performance dashboard post revenue building strategy brochure pdf. The topics addressed in these templates are revenue, target, profit margin. All the content presented in this PPT design is completely editable. Download it and make adjustments in color, background, font etc. as per your unique business setting.
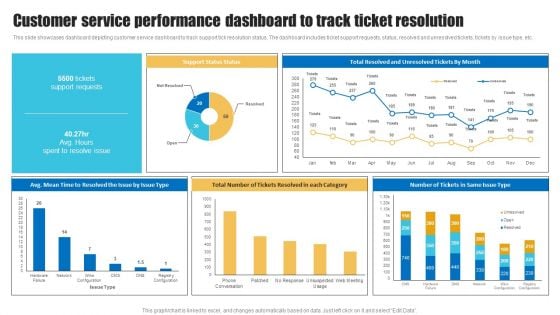
Customer Service Performance Dashboard To Track Ticket Resolution Clipart PDF
This slide showcases dashboard depicting customer service dashboard to track support tick resolution status. The dashboard includes ticket support requests, status, resolved and unresolved tickets, tickets by issue type, etc. Here you can discover an assortment of the finest PowerPoint and Google Slides templates. With these templates, you can create presentations for a variety of purposes while simultaneously providing your audience with an eye catching visual experience. Download Customer Service Performance Dashboard To Track Ticket Resolution Clipart PDF to deliver an impeccable presentation. These templates will make your job of preparing presentations much quicker, yet still, maintain a high level of quality. Slidegeeks has experienced researchers who prepare these templates and write high quality content for you. Later on, you can personalize the content by editing the Customer Service Performance Dashboard To Track Ticket Resolution Clipart PDF.
Devops Frequency And Deployment Performance Dashboard Icons PDF
This template covers DevOps deployment, change in value, lead time customer ticket software performance indicators. Presenting devops frequency and deployment performance dashboard icons pdf to provide visual cues and insights. Share and navigate important information on nine stages that need your due attention. This template can be used to pitch topics like customer, performance. In addtion, this PPT design contains high resolution images, graphics, etc, that are easily editable and available for immediate download.
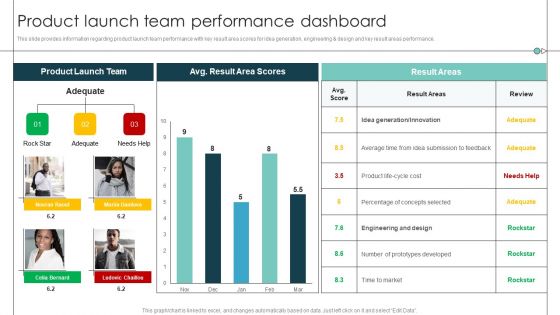
Product Launch Team Performance Dashboard Product Release Commencement Structure PDF
This slide provides information regarding product launch team performance with key result area scores for idea generation, engineering and design and key result areas performance. Deliver and pitch your topic in the best possible manner with this Product Launch Team Performance Dashboard Product Release Commencement Structure PDF. Use them to share invaluable insights on Average Time, Prototypes Developed, Percentage Concepts and impress your audience. This template can be altered and modified as per your expectations. So, grab it now.
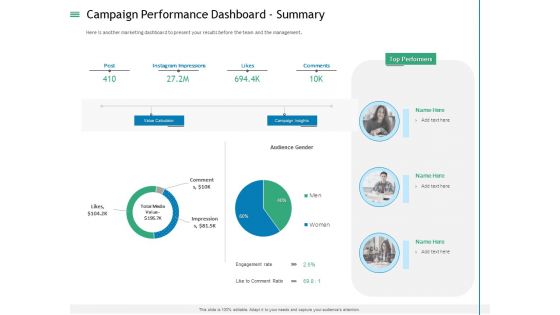
Measuring Influencer Marketing ROI Campaign Performance Dashboard Summary Topics PDF
Here is another marketing dashboard to present your results before the team and the management. Deliver and pitch your topic in the best possible manner with this measuring influencer marketing roi campaign performance dashboard summary topics pdf. Use them to share invaluable insights on value calculator, campaign insights, top performers, comments, instagram impressions and impress your audience. This template can be altered and modified as per your expectations. So, grab it now.
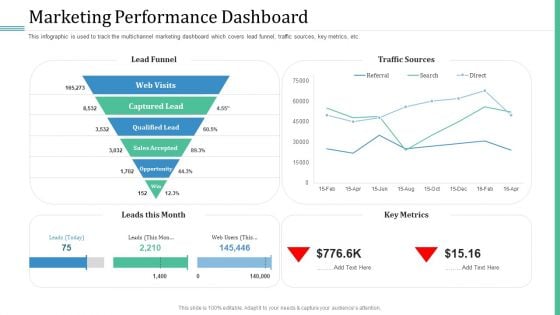
Alternative Distribution Advertising Platform Marketing Performance Dashboard Structure PDF
This infographic is used to track the multichannel marketing dashboard which covers lead funnel, traffic sources, key metrics, etc. Deliver an awe inspiring pitch with this creative alternative distribution advertising platform marketing performance dashboard structure pdf bundle. Topics like web visits, captured lead, qualified lead, sales accepted, opportunity can be discussed with this completely editable template. It is available for immediate download depending on the needs and requirements of the user.
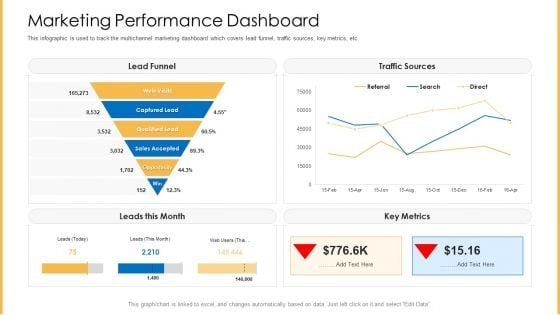
Amalgamation Marketing Pitch Deck Marketing Performance Dashboard Slides PDF
This infographic is used to track the multichannel marketing dashboard which covers lead funnel, traffic sources, key metrics, etc. Deliver an awe inspiring pitch with this creative amalgamation marketing pitch deck marketing performance dashboard slides pdf bundle. Topics like web visits, captured lead, qualified lead, sales accepted, opportunity can be discussed with this completely editable template. It is available for immediate download depending on the needs and requirements of the user.
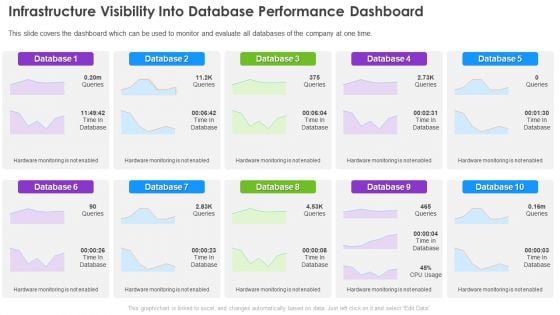
Infrastructure Supervision Infrastructure Visibility Into Database Performance Dashboard Structure PDF
This slide covers the dashboard which can be used to monitor and evaluate all databases of the company at one time. Deliver an awe inspiring pitch with this creative Infrastructure Supervision Infrastructure Visibility Into Database Performance Dashboard Structure PDF bundle. Topics like Database, Hardware monitoring can be discussed with this completely editable template. It is available for immediate download depending on the needs and requirements of the user.
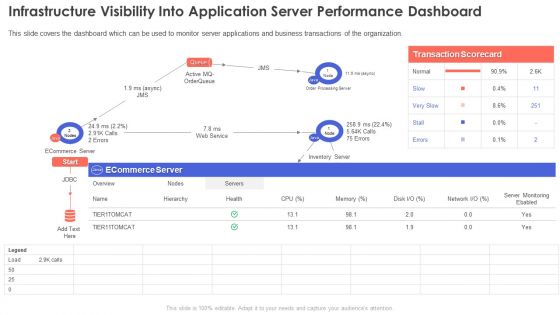
Infrastructure Visibility Into Application Server Performance Dashboard Inspiration PDF
This slide covers the dashboard which can be used to monitor server applications and business transactions of the organization.Deliver an awe inspiring pitch with this creative Infrastructure Visibility Into Application Server Performance Dashboard Inspiration PDF bundle. Topics like Transaction Scorecard, Ecommerce Server, Inventory Server can be discussed with this completely editable template. It is available for immediate download depending on the needs and requirements of the user.
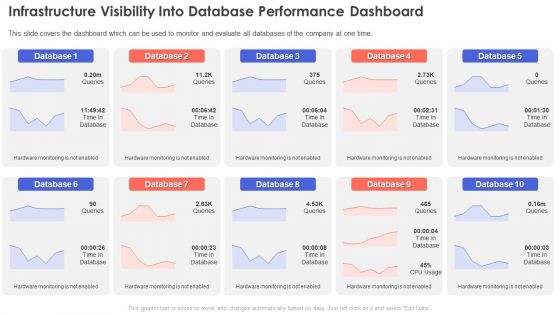
Infrastructure Visibility Into Database Performance Dashboard Portrait PDF
This slide covers the dashboard which can be used to monitor and evaluate all databases of the company at one time.Deliver and pitch your topic in the best possible manner with this Infrastructure Visibility Into Database Performance Dashboard Portrait PDF. Use them to share invaluable insights on Hardware Monitoring, Time In Database, Database and impress your audience. This template can be altered and modified as per your expectations. So, grab it now.
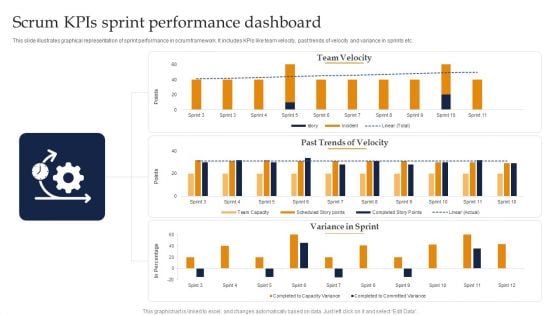
Scrum Kpis Sprint Performance Dashboard Ppt Portfolio Example Introduction PDF
This slide illustrates graphical representation of sprint performance in scrum framework. It includes KPIs like team velocity, past trends of velocity and variance in sprints etc. Showcasing this set of slides titled Scrum Kpis Sprint Performance Dashboard Ppt Portfolio Example Introduction PDF. The topics addressed in these templates are Team Velocity, Past Trends Velocity, Variance Sprint. All the content presented in this PPT design is completely editable. Download it and make adjustments in color, background, font etc. as per your unique business setting.

Employee Unsatisfactory Performance Dashboard With Training Costs Professional PDF
This slide contains the information on the employee performance in the company over the past years. It also includes the absenteeism rate, overtime hours, OLE, training costs, etc. Showcasing this set of slides titled Employee Unsatisfactory Performance Dashboard With Training Costs Professional PDF. The topics addressed in these templates are Absenteeism, Absenteeism Rate, Duration Training. All the content presented in this PPT design is completely editable. Download it and make adjustments in color, background, font etc. as per your unique business setting.
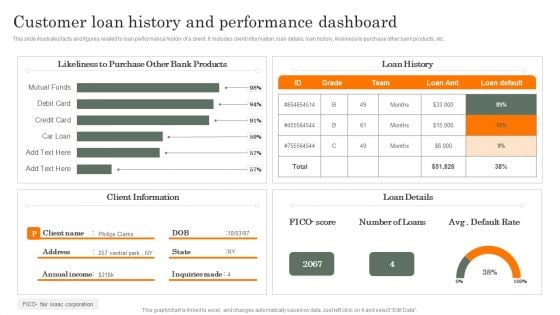
Customer Loan History And Performance Dashboard Microsoft PDF
This slide illustrates facts and figures related to loan performance history of a client. It includes client information, loan details, loan history, likeliness to purchase other bank products, etc.Showcasing this set of slides titled Customer Loan History And Performance Dashboard Microsoft PDF. The topics addressed in these templates are Likeliness, Purchase, Bank Products. All the content presented in this PPT design is completely editable. Download it and make adjustments in color, background, font etc. as per your unique business setting.

Call Center Kpis Agent Performance Dashboard Clipart PDF
This slide covers contact center agent performance metrics KPI dashboard. It involves metrics such as number of calls, average response time, average hold time, daily average transfer rate and agents with most hold time and transfer rate. Showcasing this set of slides titled Call Center Kpis Agent Performance Dashboard Clipart PDF. The topics addressed in these templates are Transfer Rate, Call Center, Hold Time. All the content presented in this PPT design is completely editable. Download it and make adjustments in color, background, font etc. as per your unique business setting.
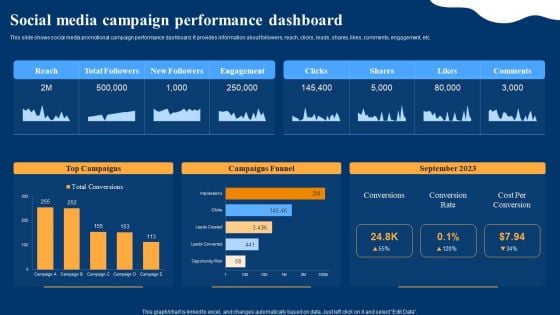
Optimizing Social Networks Social Media Campaign Performance Dashboard Guidelines PDF
This slide shows social media promotional campaign performance dashboard. It provides information about followers, reach, clicks, leads, shares, likes, comments, engagement, etc. Coming up with a presentation necessitates that the majority of the effort goes into the content and the message you intend to convey. The visuals of a PowerPoint presentation can only be effective if it supplements and supports the story that is being told. Keeping this in mind our experts created Optimizing Social Networks Social Media Campaign Performance Dashboard Guidelines PDF to reduce the time that goes into designing the presentation. This way, you can concentrate on the message while our designers take care of providing you with the right template for the situation.
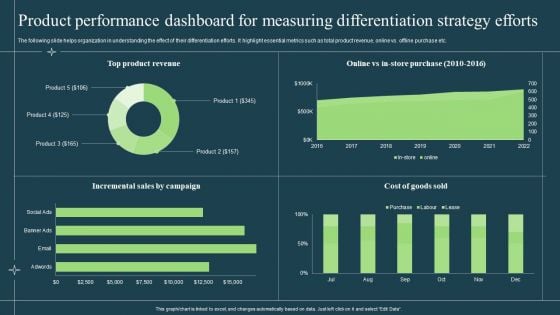
Product Performance Dashboard For Measuring Differentiation Strategy Efforts Diagrams PDF
The following slide helps organization in understanding the effect of their differentiation efforts. It highlight essential metrics such as total product revenue, online vs. offline purchase etc. Deliver an awe inspiring pitch with this creative Product Performance Dashboard For Measuring Differentiation Strategy Efforts Diagrams PDF bundle. Topics like Product, Incremental Sales, Cost Of Goods can be discussed with this completely editable template. It is available for immediate download depending on the needs and requirements of the user.
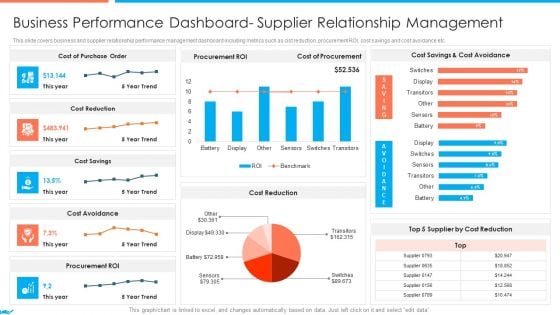
Supplier Association Management Techniques Business Performance Dashboard Portrait PDF
This slide covers business and supplier relationship performance management dashboard including metrics such as cist reduction, procurement ROI, cost savings and cost avoidance etc. Deliver an awe inspiring pitch with this creative icons slide for supplier association management techniques introduction pdf bundle. Topics like supplier association management techniques supplier performance management kpi dashboards guidelines pdf can be discussed with this completely editable template. It is available for immediate download depending on the needs and requirements of the user.
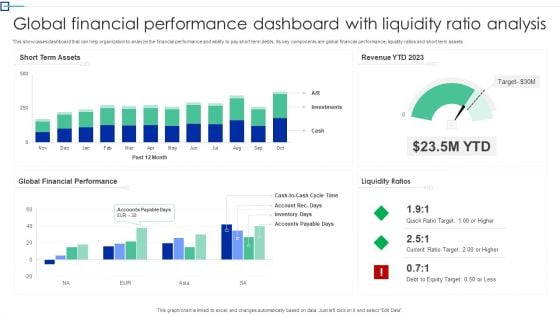
Global Financial Performance Dashboard With Liquidity Ratio Analysis Information PDF
This showcases dashboard that can help organization to analyze the financial performance and ability to pay short term debts. Its key components are global financial performance, liquidity ratios and short term assets. Pitch your topic with ease and precision using this Global Financial Performance Dashboard With Liquidity Ratio Analysis Information PDF. This layout presents information on Short Term Assets, Global Financial Performance, Liquidity Ratios. It is also available for immediate download and adjustment. So, changes can be made in the color, design, graphics or any other component to create a unique layout.
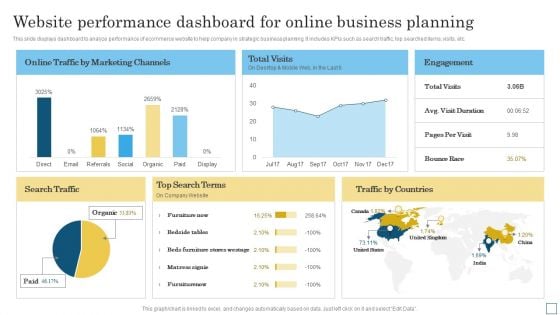
Website Performance Dashboard For Online Business Planning Graphics PDF
This slide displays dashboard to analyze performance of ecommerce website to help company in strategic business planning. It includes KPIs such as search traffic, top searched items, visits, etc. Showcasing this set of slides titled Website Performance Dashboard For Online Business Planning Graphics PDF. The topics addressed in these templates are Marketing Channels, Bounce Race, Search Traffic. All the content presented in this PPT design is completely editable. Download it and make adjustments in color, background, font etc. as per your unique business setting.
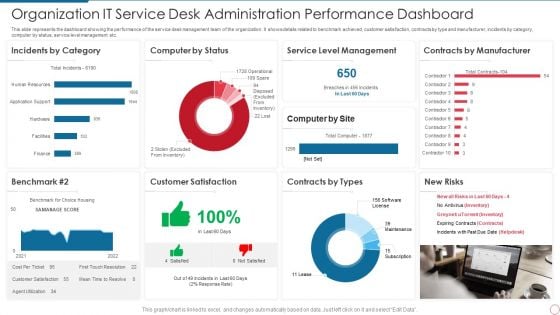
Organization IT Service Desk Administration Performance Dashboard Infographics PDF
This slide represents the dashboard showing the performance of the service desk management team of the organization. It shows details related to benchmark achieved, customer satisfaction, contracts by type and manufacturer, incidents by category, computer by status, service level management etc. Showcasing this set of slides titled Organization IT Service Desk Administration Performance Dashboard Infographics PDF. The topics addressed in these templates are Service, Management, Manufacturer. All the content presented in this PPT design is completely editable. Download it and make adjustments in color, background, font etc. as per your unique business setting.
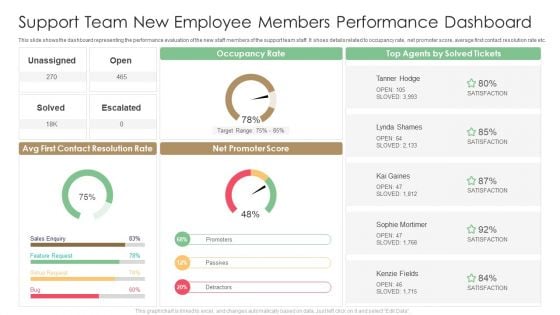
Support Team New Employee Members Performance Dashboard Designs PDF
This slide shows the dashboard representing the performance evaluation of the new staff members of the support team staff. It shoes details related to occupancy rate, net promoter score, average first contact resolution rate etc. Pitch your topic with ease and precision using this Support Team New Employee Members Performance Dashboard Designs PDF. This layout presents information on Target Range, Occupancy Rate, Contact Resolution Rate. It is also available for immediate download and adjustment. So, changes can be made in the color, design, graphics or any other component to create a unique layout.
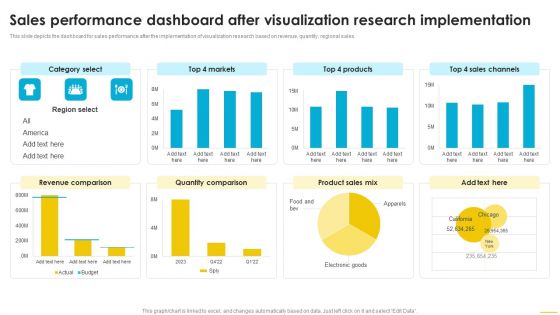
Sales Performance Dashboard After Visualization Research Implementation Introduction PDF
This slide depicts the dashboard for sales performance after the implementation of visualization research based on revenue, quantity, regional sales. Welcome to our selection of the Sales Performance Dashboard After Visualization Research Implementation Introduction PDF. These are designed to help you showcase your creativity and bring your sphere to life. Planning and Innovation are essential for any business that is just starting out. This collection contains the designs that you need for your everyday presentations. All of our PowerPoints are 100 percent editable, so you can customize them to suit your needs. This multi purpose template can be used in various situations. Grab these presentation templates today.
Sales Performance Dashboard With Average Lead Tracking Time Background PDF
This slide showcases dashboard for sales performance that can help organization to analyze the effectiveness of sales campaigns and average response time of lead. Its key components are average contract value, average sales cycle length, follow up contract rate and sales activity. Showcasing this set of slides titled Sales Performance Dashboard With Average Lead Tracking Time Background PDF. The topics addressed in these templates are Avg Contract Value, Sales Activity, Contract Rate. All the content presented in this PPT design is completely editable. Download it and make adjustments in color, background, font etc. as per your unique business setting.
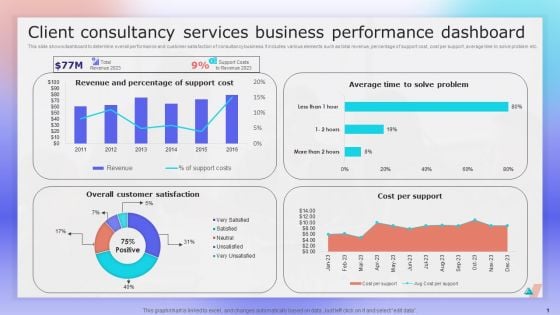
Client Consultancy Services Business Performance Dashboard Ppt File Layout PDF
This slide shows dashboard to determine overall performance and customer satisfaction of consultancy business. It includes various elements such as total revenue, percentage of support cost, cost per support, average time to solve problem etc. Showcasing this set of slides titled Client Consultancy Services Business Performance Dashboard Ppt File Layout PDF. The topics addressed in these templates are Revenue And Percentage, Support Cost, Cost Per Support. All the content presented in this PPT design is completely editable. Download it and make adjustments in color, background, font etc. as per your unique business setting.
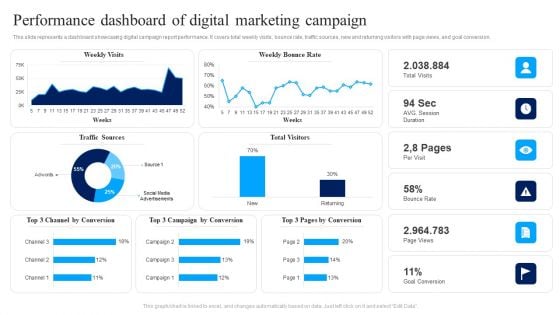
Performance Dashboard Of Digital Marketing Campaign Ppt Show Slide PDF
This slide represents a dashboard showcasing digital campaign report performance. It covers total weekly visits, bounce rate, traffic sources, new and returning visitors with page views, and goal conversion. Pitch your topic with ease and precision using this Performance Dashboard Of Digital Marketing Campaign Ppt Show Slide PDF. This layout presents information on Weekly Visits, Weekly Bounce Rate, Bounce Rate. It is also available for immediate download and adjustment. So, changes can be made in the color, design, graphics or any other component to create a unique layout.
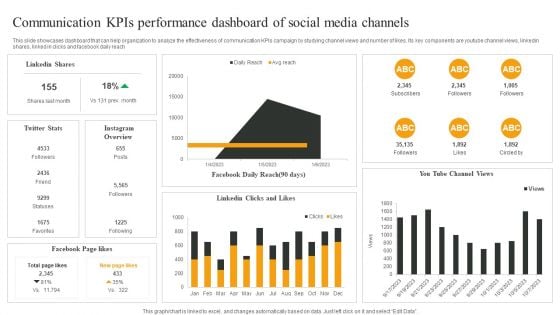
Communication Kpis Performance Dashboard Of Social Media Channels Mockup PDF
This slide showcases dashboard that can help organization to analyze the effectiveness of communication KPIs campaign by studying channel views and number of likes. Its key components are youtube channel views, linkedin shares, linked in clicks and facebook daily reach. Pitch your topic with ease and precision using this Communication Kpis Performance Dashboard Of Social Media Channels Mockup PDF. This layout presents information on Linkedin Shares, Facebook Page likes, Facebook Daily Reach. It is also available for immediate download and adjustment. So, changes can be made in the color, design, graphics or any other component to create a unique layout.
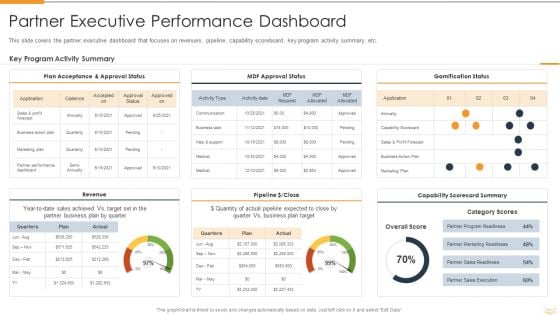
Strategic Partnership Management Plan Partner Executive Performance Dashboard Guidelines PDF
This slide covers the partner executive dashboard that focuses on revenues, pipeline, capability scoreboard, key program activity summary, etc. Deliver and pitch your topic in the best possible manner with this strategic partnership management plan partner executive performance dashboard guidelines pdf. Use them to share invaluable insights on plan acceptance and approval status, revenue, mdf approval status, gamification status, pipeline or close, capability scorecard summary and impress your audience. This template can be altered and modified as per your expectations. So, grab it now.
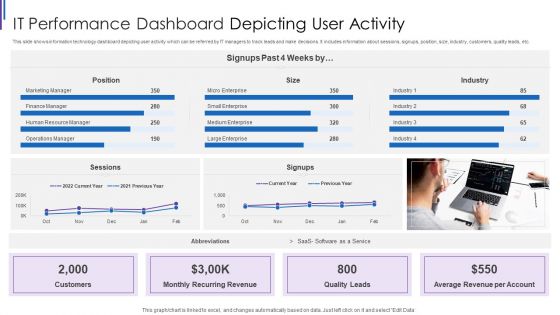
IT Performance Dashboard Depicting User Activity Inspiration PDF
This slide shows information technology dashboard depicting user activity which can be referred by IT managers to track leads and make decisions. It includes information about sessions, signups, position, size, industry, customers, quality leads, etc. Pitch your topic with ease and precision using this IT Performance Dashboard Depicting User Activity Inspiration PDF. This layout presents information on Monthly Recurring Revenue, Average Revenue Per, Account Quality Leads, Customers Position Sessions. It is also available for immediate download and adjustment. So, changes can be made in the color, design, graphics or any other component to create a unique layout.
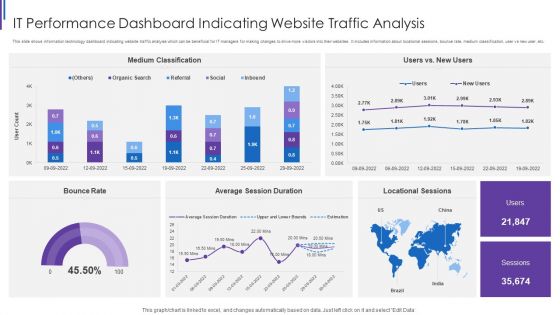
IT Performance Dashboard Indicating Website Traffic Analysis Background PDF
This slide shows information technology dashboard indicating website traffic analysis which can be beneficial for IT managers for making changes to drive more visitors into their websites. It includes information about locational sessions, bounce rate, medium classification, user vs new user, etc. Pitch your topic with ease and precision using this IT Performance Dashboard Indicating Website Traffic Analysis Background PDF. This layout presents information on Medium Classification Rate, Average Session Duration, Locational Sessions Bounce. It is also available for immediate download and adjustment. So, changes can be made in the color, design, graphics or any other component to create a unique layout.
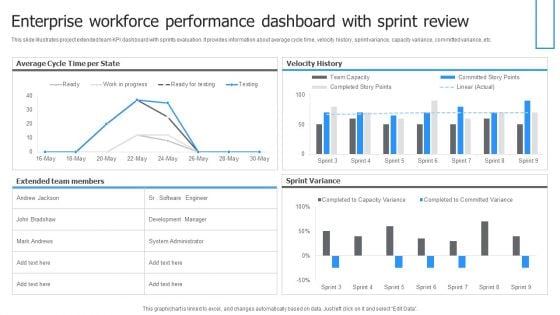
Enterprise Workforce Performance Dashboard With Sprint Review Themes PDF
This slide illustrates project extended team KPI dashboard with sprints evaluation. It provides information about average cycle time, velocity history, sprint variance, capacity variance, committed variance, etc. Showcasing this set of slides titled Enterprise Workforce Performance Dashboard With Sprint Review Themes PDF. The topics addressed in these templates are Velocity History, Sprint Variance, Average Cycle, Time Per State. All the content presented in this PPT design is completely editable. Download it and make adjustments in color, background, font etc. as per your unique business setting.
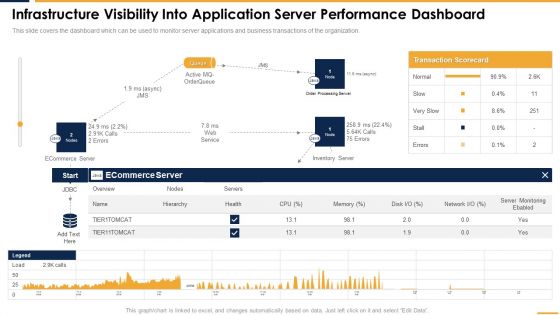
Infrastructure Visibility Into Application Server Performance Dashboard Structure PDF
This slide covers the dashboard which can be used to monitor server applications and business transactions of the organization. Coming up with a presentation necessitates that the majority of the effort goes into the content and the message you intend to convey. The visuals of a PowerPoint presentation can only be effective if it supplements and supports the story that is being told. Keeping this in mind our experts created Infrastructure Visibility Into Application Server Performance Dashboard Structure PDF to reduce the time that goes into designing the presentation. This way, you can concentrate on the message while our designers take care of providing you with the right template for the situation.
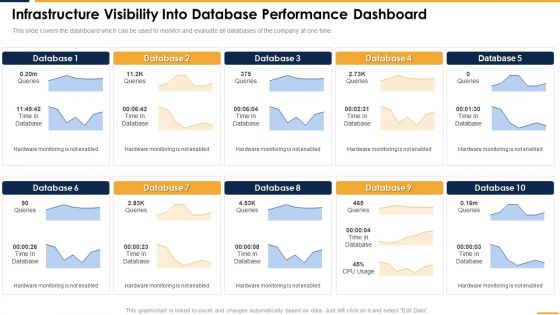
Infrastructure Visibility Into Database Performance Dashboard Rules PDF
This slide covers the dashboard which can be used to monitor and evaluate all databases of the company at one time. This modern and well arranged Infrastructure Visibility Into Database Performance Dashboard Rules PDF provides lots of creative possibilities. It is very simple to customize and edit with the Powerpoint Software. Just drag and drop your pictures into the shapes. All facets of this template can be edited with Powerpoint no extra software is necessary. Add your own material, put your images in the places assigned for them, adjust the colors, and then you can show your slides to the world, with an animated slide included.
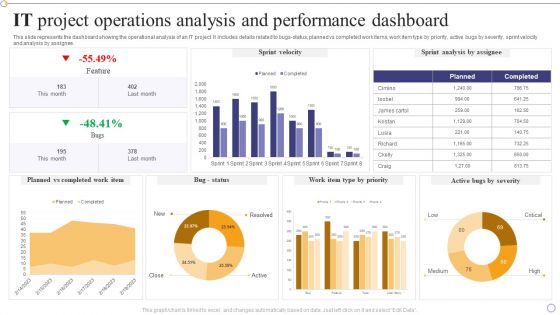
IT Project Operations Analysis And Performance Dashboard Themes PDF
This slide represents the dashboard showing the operational analysis of an IT project. It includes details related to bugs-status, planned vs completed work items, work item type by priority, active bugs by severity, sprint velocity and analysis by assignee.Showcasing this set of slides titled IT Project Operations Analysis And Performance Dashboard Themes PDF. The topics addressed in these templates are Planned Completed, Sprint Analysis, Feature. All the content presented in this PPT design is completely editable. Download it and make adjustments in color, background, font etc. as per your unique business setting.
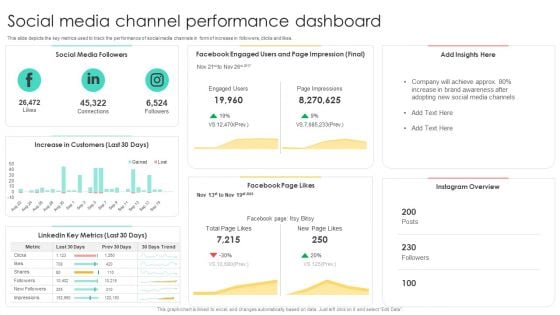
Media Advertising Social Media Channel Performance Dashboard Pictures PDF
This slide depicts the key metrics used to track the performance of social media channels in form of increase in followers, clicks and likes. This modern and well-arranged Media Advertising Social Media Channel Performance Dashboard Pictures PDF provides lots of creative possibilities. It is very simple to customize and edit with the Powerpoint Software. Just drag and drop your pictures into the shapes. All facets of this template can be edited with Powerpoint, no extra software is necessary. Add your own material, put your images in the places assigned for them, adjust the colors, and then you can show your slides to the world, with an animated slide included.
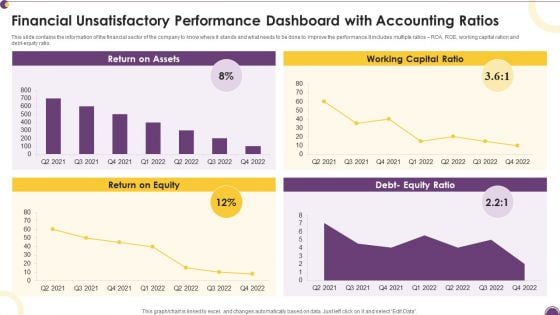
Financial Unsatisfactory Performance Dashboard With Accounting Ratios Diagrams PDF
This slide contains the information of the financial sector of the company to know where it stands and what needs to be done to improve the performance.It includes multiple ratios ROA, ROE, working capital ration and debt-equity ratio. Pitch your topic with ease and precision using this Financial Unsatisfactory Performance Dashboard With Accounting Ratios Diagrams PDF. This layout presents information on Return Assets, Working Capital, Return Equity. It is also available for immediate download and adjustment. So, changes can be made in the color, design, graphics or any other component to create a unique layout.
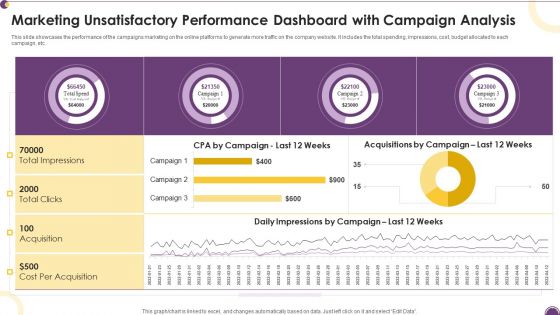
Marketing Unsatisfactory Performance Dashboard With Campaign Analysis Information PDF
This slide showcases the performance of the campaigns marketing on the online platforms to generate more traffic on the company website. It includes the total spending, impressions, cost, budget allocated to each campaign, etc.Pitch your topic with ease and precision using this Marketing Unsatisfactory Performance Dashboard With Campaign Analysis Information PDF. This layout presents information on Cost Acquisition, Total Clicks, Total Impressions. It is also available for immediate download and adjustment. So, changes can be made in the color, design, graphics or any other component to create a unique layout.
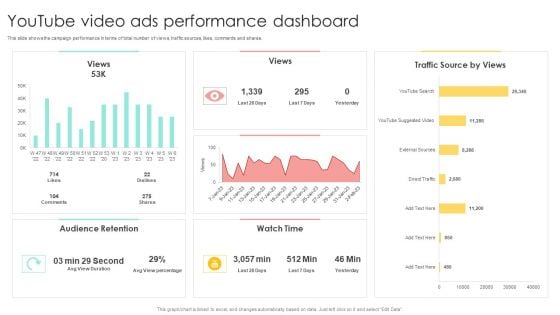
Media Advertising Youtube Video Ads Performance Dashboard Information PDF
This slide shows the campaign performance in terms of total number of views, traffic sources, likes, comments and shares. The best PPT templates are a great way to save time, energy, and resources. Slidegeeks have 100 percent editable powerpoint slides making them incredibly versatile. With these quality presentation templates, you can create a captivating and memorable presentation by combining visually appealing slides and effectively communicating your message. Download Media Advertising Youtube Video Ads Performance Dashboard Information PDF from Slidegeeks and deliver a wonderful presentation.
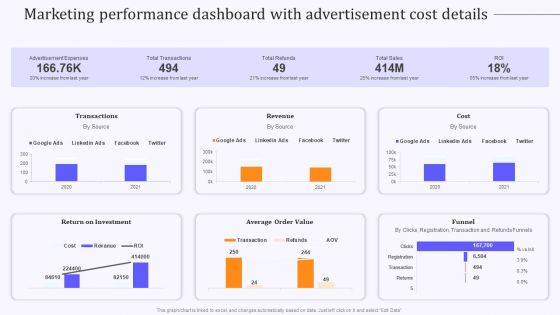
Product Marketing And Awareness Programs Marketing Performance Dashboard Information PDF
This graph or chart is linked to excel, and changes automatically based on data. Just left click on it and select Edit Data. Slidegeeks is one of the best resources for PowerPoint templates. You can download easily and regulate Product Marketing And Awareness Programs Marketing Performance Dashboard Information PDF for your personal presentations from our wonderful collection. A few clicks is all it takes to discover and get the most relevant and appropriate templates. Use our Templates to add a unique zing and appeal to your presentation and meetings. All the slides are easy to edit and you can use them even for advertisement purposes.
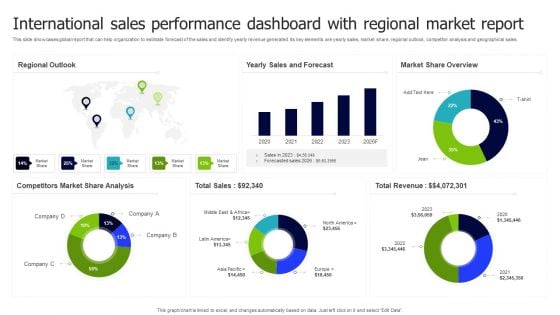
International Sales Performance Dashboard With Regional Market Report Inspiration PDF
This slide showcases global report that can help organization to estimate forecast of the sales and identify yearly revenue generated. Its key elements are yearly sales, market share, regional outlook, competitor analysis and geographical sales. Pitch your topic with ease and precision using this International Sales Performance Dashboard With Regional Market Report Inspiration PDF. This layout presents information on Regional Outlook, Sales And Forecast, Market Share Overview. It is also available for immediate download and adjustment. So, changes can be made in the color, design, graphics or any other component to create a unique layout.

IT Performance Dashboard Ppt PowerPoint Presentation Complete Deck With Slides
This IT Performance Dashboard Ppt PowerPoint Presentation Complete Deck With Slides acts as backup support for your ideas, vision, thoughts, etc. Use it to present a thorough understanding of the topic. This PPT slideshow can be utilized for both in-house and outside presentations depending upon your needs and business demands. Entailing twelve slides with a consistent design and theme, this template will make a solid use case. As it is intuitively designed, it suits every business vertical and industry. All you have to do is make a few tweaks in the content or any other component to design unique presentations. The biggest advantage of this complete deck is that it can be personalized multiple times once downloaded. The color, design, shapes, and other elements are free to modify to add personal touches. You can also insert your logo design in this PPT layout. Therefore a well-thought and crafted presentation can be delivered with ease and precision by downloading this IT Performance Dashboard Ppt PowerPoint Presentation Complete Deck With Slides PPT slideshow.
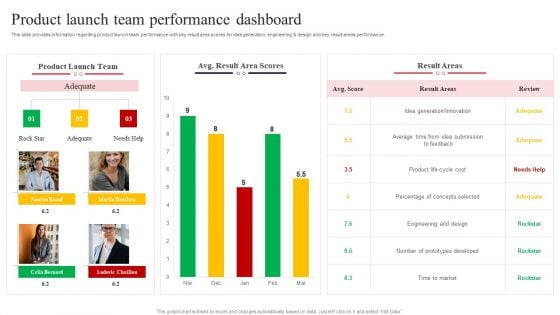
New Product Launch Product Launch Team Performance Dashboard Portrait PDF
This slide provides information regarding product launch team performance with key result area scores for idea generation, engineering AND design and key result areas performance. Retrieve professionally designed New Product Launch Product Launch Team Performance Dashboard Portrait PDF to effectively convey your message and captivate your listeners. Save time by selecting pre-made slideshows that are appropriate for various topics, from business to educational purposes. These themes come in many different styles, from creative to corporate, and all of them are easily adjustable and can be edited quickly. Access them as PowerPoint templates or as Google Slides themes. You dont have to go on a hunt for the perfect presentation because Slidegeeks got you covered from everywhere.
Stock Performance Dashboard Ppt PowerPoint Presentation Complete Deck With Slides
Improve your presentation delivery using this Stock Performance Dashboard Ppt PowerPoint Presentation Complete Deck With Slides. Support your business vision and objectives using this well-structured PPT deck. This template offers a great starting point for delivering beautifully designed presentations on the topic of your choice. Comprising Seven this professionally designed template is all you need to host discussion and meetings with collaborators. Each slide is self-explanatory and equipped with high-quality graphics that can be adjusted to your needs. Therefore, you will face no difficulty in portraying your desired content using this PPT slideshow. This PowerPoint slideshow contains every important element that you need for a great pitch. It is not only editable but also available for immediate download and utilization. The color, font size, background, shapes everything can be modified to create your unique presentation layout. Therefore, download it now.
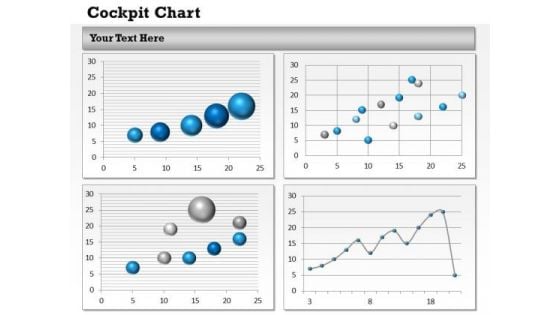
Business Diagram Performance Dashboards For Business Strategic Management
Be The Doer With Our Business Diagram Performance Dashboards For Business Strategic Management Powerpoint Templates. Put Your Thoughts Into Practice.
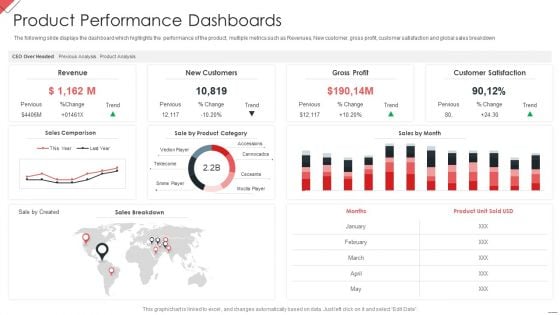
New Commodity Market Viability Review Product Performance Dashboards Guidelines PDF
The following slide displays the dashboard which highlights the performance of the product, multiple metrics such as Revenues, New customer, gross profit, customer satisfaction and global sales breakdown Deliver and pitch your topic in the best possible manner with this New Commodity Market Viability Review Product Performance Dashboards Guidelines PDF Use them to share invaluable insights on Gross Profit, Customer Satisfaction, Product Category and impress your audience. This template can be altered and modified as per your expectations. So, grab it now.
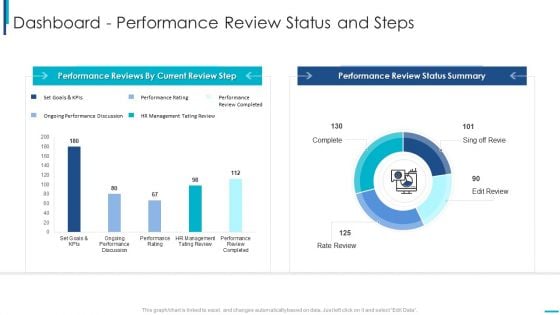
Skill Development Training To Strengthen Employee Performance Dashboard Performance Review Status And Steps Download PDF
Deliver an awe inspiring pitch with this creative skill development training to strengthen employee performance dashboard performance review status and steps download pdf bundle. Topics like goals, performance, management can be discussed with this completely editable template. It is available for immediate download depending on the needs and requirements of the user.
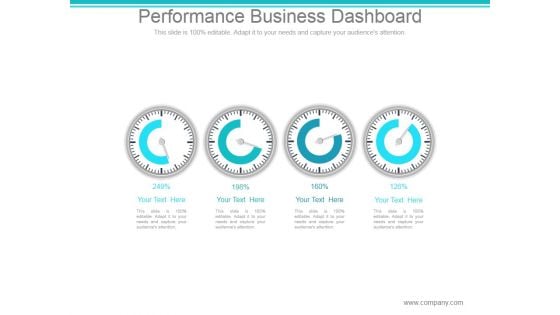
Performance Business Dashboard Ppt PowerPoint Presentation Visuals
This is a performance business dashboard ppt powerpoint presentation visuals. This is a four stage process. The stages in this process are dashboard, speedometer, report, business, marketing.
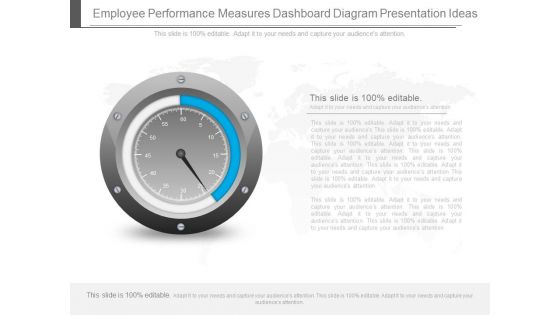
Employee Performance Measures Dashboard Diagram Presentation Ideas
This is a employee performance measures dashboard diagram presentation ideas. This is a one stage process. The stages in this process are business, marketing, dashboard, measuring.
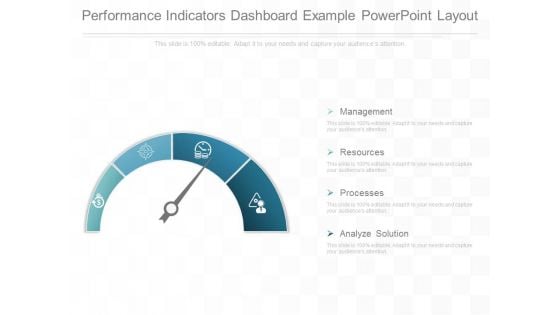
Performance Indicators Dashboard Example Powerpoint Layout
This is a performance indicators dashboard example powerpoint layout. This is a four stage process. The stages in this process are management, resources, processes, analyze solution.
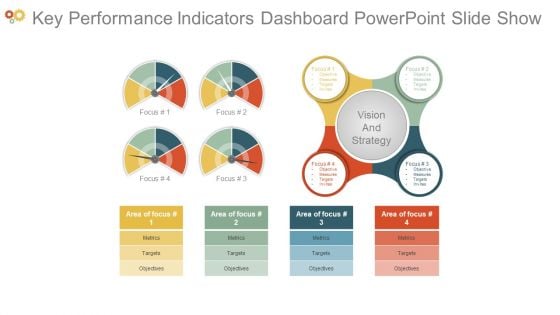
Key Performance Indicators Dashboard Powerpoint Slide Show
This is a key performance indicators dashboard powerpoint slide show. This is a four stage process. The stages in this process are focus, objective, measures, targets, invites, vision and strategy, area of focus, metrics, objectives.
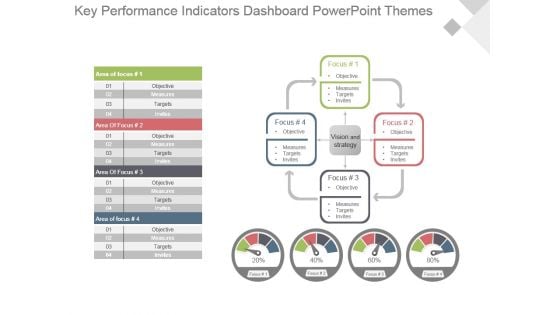
Key Performance Indicators Dashboard Powerpoint Themes
This is a key performance indicators dashboard powerpoint themes. This is a four stage process. The stages in this process are focus, objective, measures, targets, invites, vision and strategy, area of focus.
Sustainable Green Cloud Computing Performance Tracking Dashboard
This slide depicts the performance tracking dashboard for green cloud computing. This slide aims to showcase the performance tracking report of green cloud computing by covering parameters such as Power Use Effectiveness PUE, high-density zone, history, consumption, and Average Propensity to Consume APC consumption. The Sustainable Green Cloud Computing Performance Tracking Dashboard is a compilation of the most recent design trends as a series of slides. It is suitable for any subject or industry presentation, containing attractive visuals and photo spots for businesses to clearly express their messages. This template contains a variety of slides for the user to input data, such as structures to contrast two elements, bullet points, and slides for written information. Slidegeeks is prepared to create an impression. This slide depicts the performance tracking dashboard for green cloud computing. This slide aims to showcase the performance tracking report of green cloud computing by covering parameters such as Power Use Effectiveness PUE, high-density zone, history, consumption, and Average Propensity to Consume APC consumption.
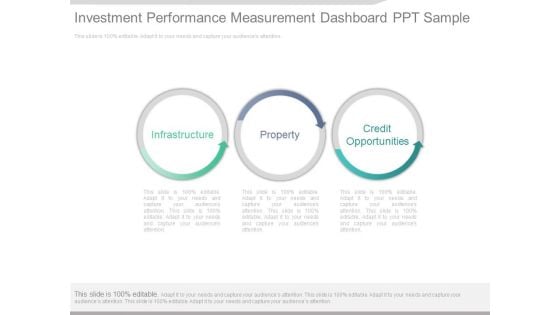
Investment Performance Measurement Dashboard Ppt Sample
This is an investment performance measurement dashboard ppt sample. This is a three stage process. The stages in this process are infrastructure, property, credit opportunities.


 Continue with Email

 Home
Home


