Performance Dashboard
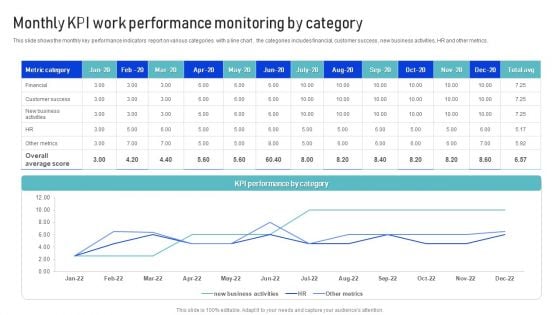
Monthly KPI Work Performance Monitoring By Category Microsoft PDF
This slide shows the monthly key performance indicators report on various categories with a line chart . the categories includes financial, customer success , new business activities, HR and other metrics. Pitch your topic with ease and precision using this Monthly KPI Work Performance Monitoring By Category Microsoft PDF. This layout presents information on Metrics, Financial, Customer Success. It is also available for immediate download and adjustment. So, changes can be made in the color, design, graphics or any other component to create a unique layout.
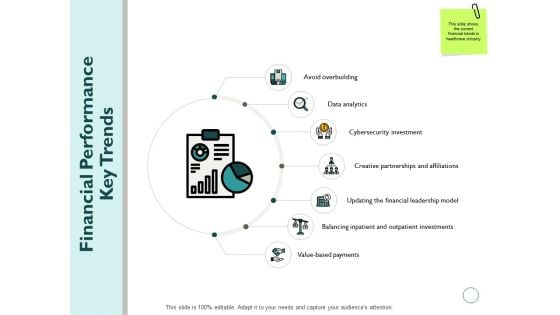
Financial Performance Key Trends Ppt PowerPoint Presentation Outline Ideas
Presenting this set of slides with name financial performance key trends ppt powerpoint presentation outline ideas. This is a seven stage process. The stages in this process are data analytics, cybersecurity investment, financial, leadership, management. This is a completely editable PowerPoint presentation and is available for immediate download. Download now and impress your audience.
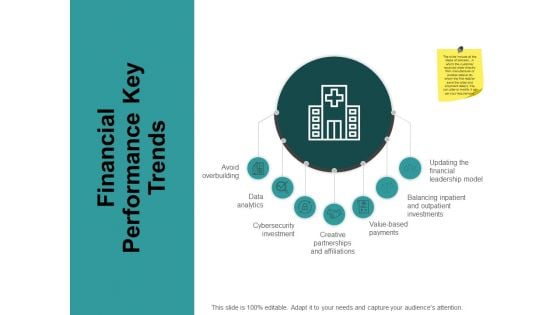
Financial Performance Key Trends Ppt PowerPoint Presentation Slides Deck
Presenting this set of slides with name financial performance key trends ppt powerpoint presentation slides deck. This is a seven stage process. The stages in this process are avoid overbuilding, data analytics, cybersecurity investment, balancing inpatient, affiliations. This is a completely editable PowerPoint presentation and is available for immediate download. Download now and impress your audience.
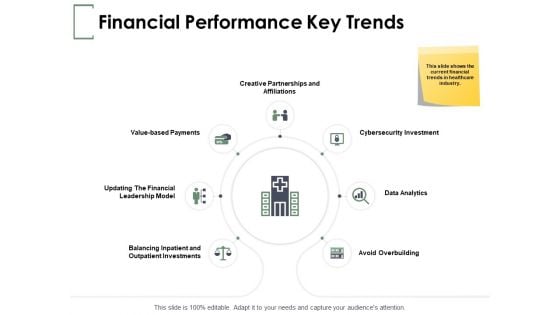
Financial Performance Key Trends Ppt PowerPoint Presentation Pictures Graphic Tips
Presenting this set of slides with name financial performance key trends ppt powerpoint presentation pictures graphic tips. This is a seven stage process. The stages in this process are affiliations, financial, investments, avoid overbuilding, data analytics. This is a completely editable PowerPoint presentation and is available for immediate download. Download now and impress your audience.
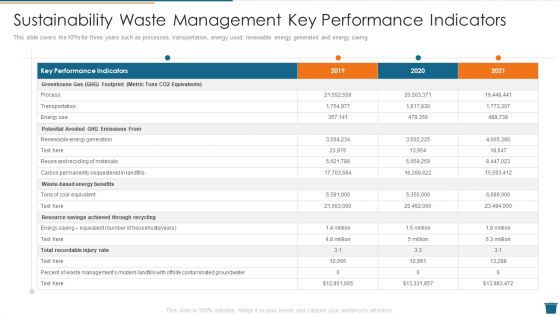
Sustainability Waste Management Key Performance Indicators Inspiration PDF
This slide covers the KPIs for three years such as processes, transportation, energy used, renewable energy generated and energy saving Deliver and pitch your topic in the best possible manner with this sustainability waste management key performance indicators inspiration pdf. Use them to share invaluable insights on recycling of materials, achieved, potential and impress your audience. This template can be altered and modified as per your expectations. So, grab it now.
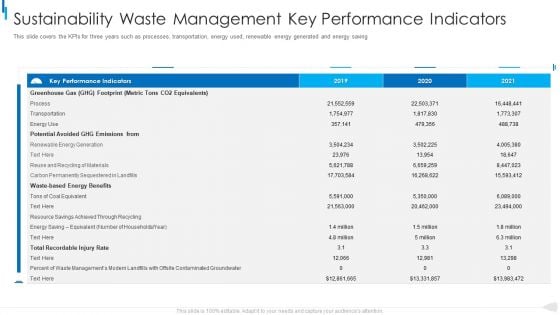
MSW Management Sustainability Waste Management Key Performance Indicators Download PDF
This slide covers the KPIs for three years such as processes, transportation, energy used, renewable energy generated and energy saving. Deliver and pitch your topic in the best possible manner with this MSW Management Sustainability Waste Management Key Performance Indicators Download Pdf. Use them to share invaluable insights on greenhouse, potential avoided, recordable and impress your audience. This template can be altered and modified as per your expectations. So, grab it now.
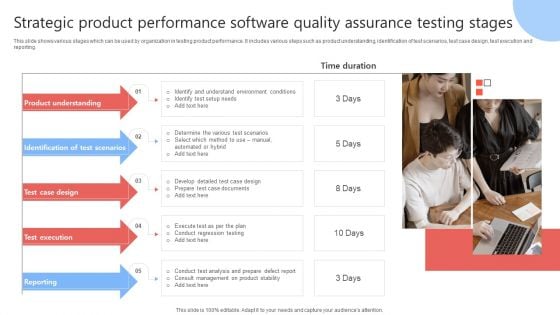
Strategic Product Performance Software Quality Assurance Testing Stages Infographics PDF
This slide shows various stages which can be used by organization in testing product performance. It includes various steps such as product understanding, identification of test scenarios, test case design, test execution and reporting. Presenting Strategic Product Performance Software Quality Assurance Testing Stages Infographics PDF to dispense important information. This template comprises five stages. It also presents valuable insights into the topics including Product Understanding, Identification Test Scenarios, Test Case Design. This is a completely customizable PowerPoint theme that can be put to use immediately. So, download it and address the topic impactfully.
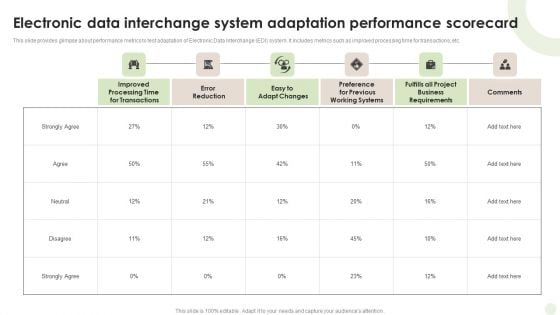
Electronic Data Interchange System Adaptation Performance Scorecard Diagrams PDF
Pitch your topic with ease and precision using this Electronic Data Interchange System Adaptation Performance Scorecard Diagrams PDF. This layout presents information on Improved Processing, Time Transactions, Error Reduction. It is also available for immediate download and adjustment. So, changes can be made in the color, design, graphics or any other component to create a unique layout.
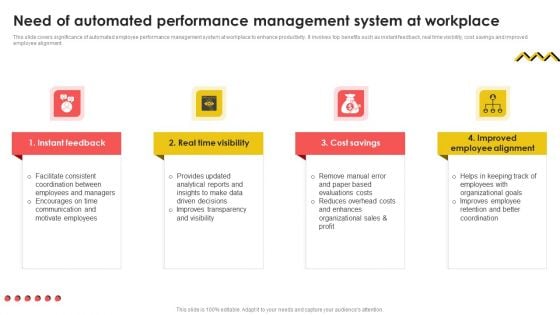
Need Of Automated Performance Management System At Workplace Infographics PDF
This slide covers significance of automated employee performance management system at workplace to enhance productivity. It involves top benefits such as instant feedback, real time visibility, cost savings and improved employee alignment. Do you have an important presentation coming up Are you looking for something that will make your presentation stand out from the rest Look no further than Need Of Automated Performance Management System At Workplace Infographics PDF. With our professional designs, you can trust that your presentation will pop and make delivering it a smooth process. And with Slidegeeks, you can trust that your presentation will be unique and memorable. So why wait Grab Need Of Automated Performance Management System At Workplace Infographics PDF today and make your presentation stand out from the rest.
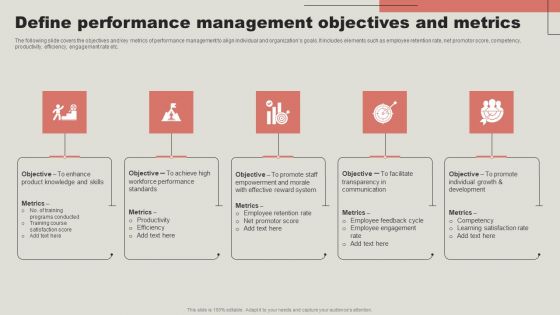
Define Performance Management Objectives And Metrics Template PDF
The following slide covers the objectives and key metrics of performance management to align individual and organizations goals. It includes elements such as employee retention rate, net promotor score, competency, productivity, efficiency, engagement rate etc. Do you have to make sure that everyone on your team knows about any specific topic I yes, then you should give Define Performance Management Objectives And Metrics Template PDF a try. Our experts have put a lot of knowledge and effort into creating this impeccable Define Performance Management Objectives And Metrics Template PDF. You can use this template for your upcoming presentations, as the slides are perfect to represent even the tiniest detail. You can download these templates from the Slidegeeks website and these are easy to edit. So grab these today.
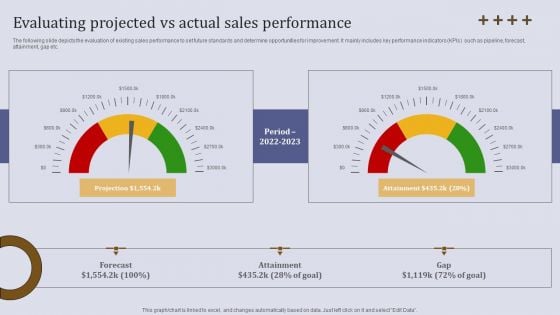
Evaluating Projected Vs Actual Sales Performance Ppt Ideas Template PDF
The following slide depicts the evaluation of existing sales performance to set future standards and determine opportunities for improvement. It mainly includes key performance indicators KPIs such as pipeline, forecast, attainment, gap etc. The Evaluating Projected Vs Actual Sales Performance Ppt Ideas Template PDF is a compilation of the most recent design trends as a series of slides. It is suitable for any subject or industry presentation, containing attractive visuals and photo spots for businesses to clearly express their messages. This template contains a variety of slides for the user to input data, such as structures to contrast two elements, bullet points, and slides for written information. Slidegeeks is prepared to create an impression.
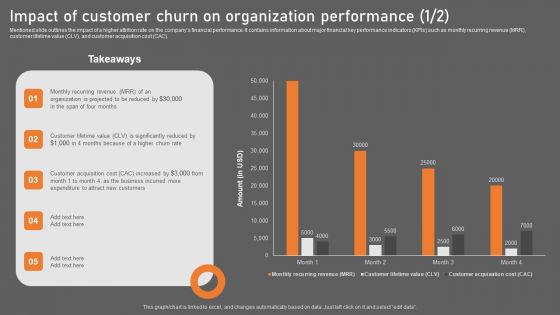
Impact Of Customer Churn On Organization Performance Background PDF
Mentioned slide outlines the impact of a higher attrition rate on the companys financial performance. It contains information about major financial key performance indicators KPIs such as monthly recurring revenue MRR, customer lifetime value CLV, and customer acquisition cost CAC. Take your projects to the next level with our ultimate collection of Impact Of Customer Churn On Organization Performance Background PDF. Slidegeeks has designed a range of layouts that are perfect for representing task or activity duration, keeping track of all your deadlines at a glance. Tailor these designs to your exact needs and give them a truly corporate look with your own brand colors they will make your projects stand out from the rest.
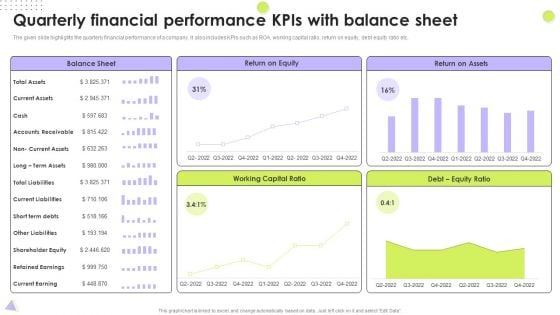
Quarterly Financial Performance Kpis With Balance Sheet Designs PDF
The given slide highlights the quarterly financial performance of a company. It also includes KPIs such as ROA, working capital ratio, return on equity, debt equity ratio etc. Pitch your topic with ease and precision using this Quarterly Financial Performance Kpis With Balance Sheet Designs PDF. This layout presents information on Total Liabilities, Return On Equity, Working Capital Ratio. It is also available for immediate download and adjustment. So, changes can be made in the color, design, graphics or any other component to create a unique layout.

Kpis To Analyse Content Performance Data Rules PDF
This slide shows KPIs to track and analyse performance of different types of content. It includes various indicators such as views, subscriptions, click through rates etc. for different contents articles, emails, social media, videos, podcasts and campaigns. Persuade your audience using this Kpis To Analyse Content Performance Data Rules PDF. This PPT design covers Six stages, thus making it a great tool to use. It also caters to a variety of topics including Articles, Email, Videos, Campaigns. Download this PPT design now to present a convincing pitch that not only emphasizes the topic but also showcases your presentation skills.
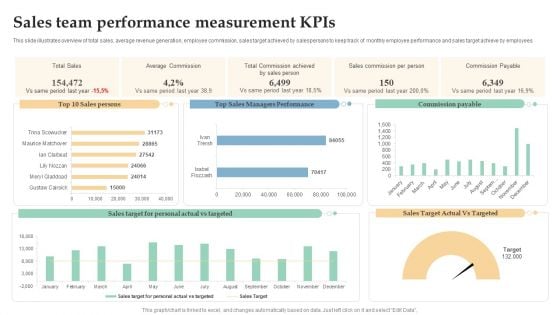
Sales Team Performance Measurement Kpis Ppt Professional Templates PDF
This slide illustrates overview of total sales, average revenue generation, employee commission, sales target achieved by salespersons to keep track of monthly employee performance and sales target achieve by employees. Showcasing this set of slides titled Sales Team Performance Measurement Kpis Ppt Professional Templates PDF. The topics addressed in these templates are Total Sales, Average Commission, Sales Commission, Per Person. All the content presented in this PPT design is completely editable. Download it and make adjustments in color, background, font etc. as per your unique business setting.
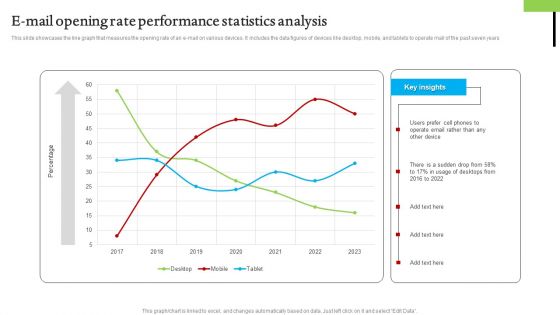
E Mail Opening Rate Performance Statistics Analysis Mockup PDF
This slide showcases the line graph that measures the opening rate of an e-mail on various devices. It includes the data figures of devices like desktop, mobile, and tablets to operate mail of the past seven years. Showcasing this set of slides titled E Mail Opening Rate Performance Statistics Analysis Mockup PDF. The topics addressed in these templates are E Mail Opening Rate, Performance Statistics Analysis. All the content presented in this PPT design is completely editable. Download it and make adjustments in color, background, font etc. as per your unique business setting.

Steps Of Sales Analysis To Improve Product Performance Rules PDF
This slide showcase sale analysis steps enhance product performance which help in finding vital trends, overview of data and increase accuracy for future decision making process. It include steps such as number, business, process, pricing, metrices and services.Presenting Steps Of Sales Analysis To Improve Product Performance Rules PDF to dispense important information. This template comprises six stages. It also presents valuable insights into the topics including Number, Pricing Of Product. This is a completely customizable PowerPoint theme that can be put to use immediately. So, download it and address the topic impactfully.
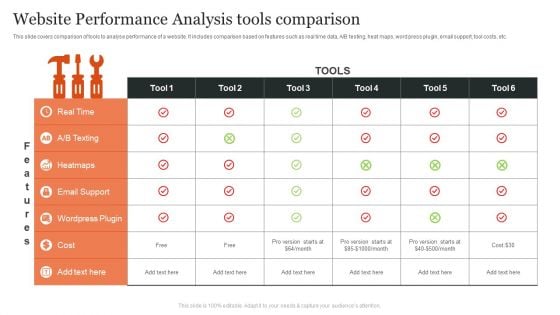
Website Performance Analysis Tools Comparison Ppt Show Background PDF
This slide covers comparison of tools to analyse performance of a website. It includes comparison based on features such as real time data, A or B testing, heat maps, word press plugin, email support, tool costs, etc.Pitch your topic with ease and precision using this Website Performance Analysis Tools Comparison Ppt Show Background PDF. This layout presents information on Real Time, Heatmaps, Email Support. It is also available for immediate download and adjustment. So, changes can be made in the color, design, graphics or any other component to create a unique layout.
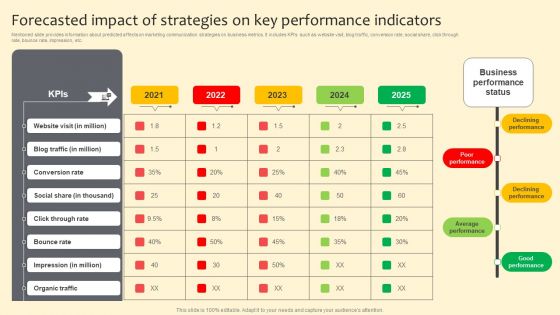
Forecasted Impact Of Strategies On Key Performance Indicators Slides PDF
Mentioned slide provides information about predicted affects on marketing communication strategies on business metrics. It includes KPIs such as website visit, blog traffic, conversion rate, social share, click through rate, bounce rate, impression, etc. Boost your pitch with our creative Forecasted Impact Of Strategies On Key Performance Indicators Slides PDF. Deliver an awe inspiring pitch that will mesmerize everyone. Using these presentation templates you will surely catch everyones attention. You can browse the ppts collection on our website. We have researchers who are experts at creating the right content for the templates. So you do not have to invest time in any additional work. Just grab the template now and use them.
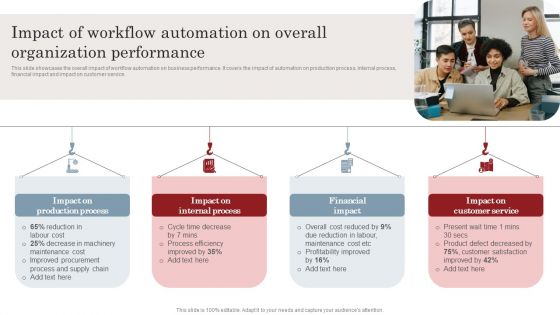
Impact Of Workflow Automation On Overall Organization Performance Infographics PDF
This slide showcases the overall impact of workflow automation on business performance. It covers the impact of automation on production process, internal process, financial impact and impact on customer service. Do you have to make sure that everyone on your team knows about any specific topic I yes, then you should give Impact Of Workflow Automation On Overall Organization Performance Infographics PDF a try. Our experts have put a lot of knowledge and effort into creating this impeccable Impact Of Workflow Automation On Overall Organization Performance Infographics PDF. You can use this template for your upcoming presentations, as the slides are perfect to represent even the tiniest detail. You can download these templates from the Slidegeeks website and these are easy to edit. So grab these today.
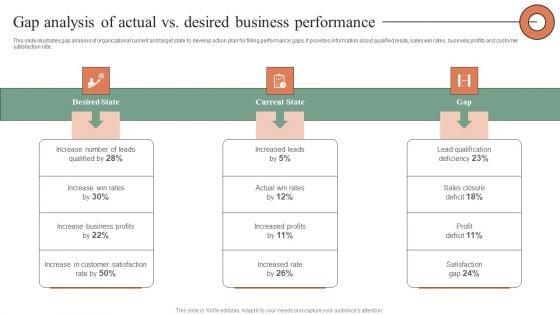
Gap Analysis Of Actual Vs Desired Business Performance Infographics PDF
This slide illustrates gap analysis of organizational current and target state to develop action plan for filling performance gaps. It provides information about qualified leads, sales win rates, business profits and customer satisfaction rate. Do you have to make sure that everyone on your team knows about any specific topic I yes, then you should give Gap Analysis Of Actual Vs Desired Business Performance Infographics PDF a try. Our experts have put a lot of knowledge and effort into creating this impeccable Gap Analysis Of Actual Vs Desired Business Performance Infographics PDF. You can use this template for your upcoming presentations, as the slides are perfect to represent even the tiniest detail. You can download these templates from the Slidegeeks website and these are easy to edit. So grab these today.
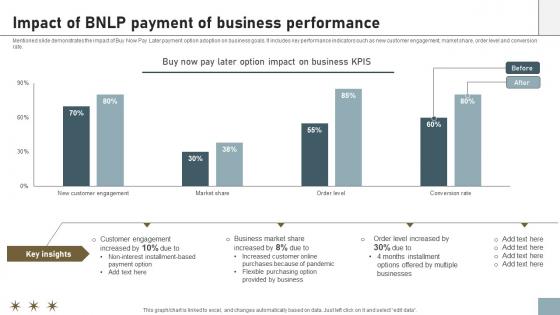
Online Payment Techniques Impact Of BNLP Payment Of Business Performance
Mentioned slide demonstrates the impact of Buy Now Pay Later payment option adoption on business goals. It includes key performance indicators such as new customer engagement, market share, order level and conversion rate. There are so many reasons you need a Online Payment Techniques Impact Of BNLP Payment Of Business Performance. The first reason is you can not spend time making everything from scratch, Thus, Slidegeeks has made presentation templates for you too. You can easily download these templates from our website easily. Mentioned slide demonstrates the impact of Buy Now Pay Later payment option adoption on business goals. It includes key performance indicators such as new customer engagement, market share, order level and conversion rate.
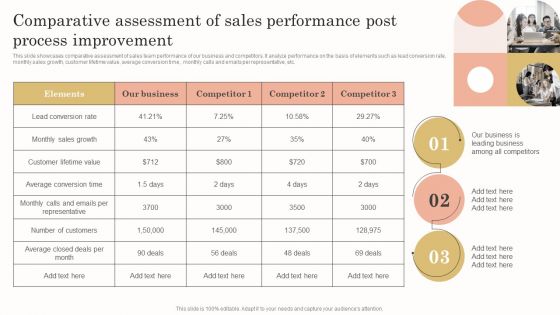
Comparative Assessment Of Sales Performance Post Process Improvement Infographics PDF
This slide showcases comparative assessment of sales team performance of our business and competitors. It analyze performance on the basis of elements such as lead conversion rate, monthly sales growth, customer lifetime value, average conversion time , monthly calls and emails per representative, etc. Want to ace your presentation in front of a live audience Our Comparative Assessment Of Sales Performance Post Process Improvement Infographics PDF can help you do that by engaging all the users towards you. Slidegeeks experts have put their efforts and expertise into creating these impeccable powerpoint presentations so that you can communicate your ideas clearly. Moreover, all the templates are customizable, and easy to edit and downloadable. Use these for both personal and commercial use.
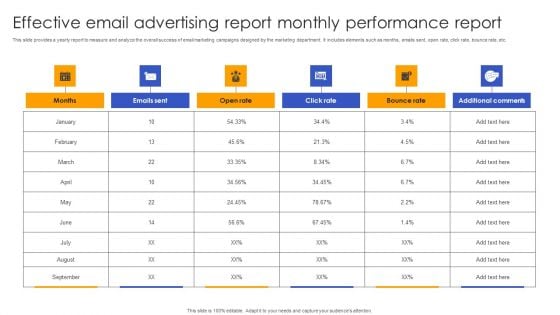
Effective Email Advertising Report Monthly Performance Report Graphics PDF
This slide provides a yearly report to measure and analyze the overall success of email marketing campaigns designed by the marketing department. It includes elements such as months, emails sent, open rate, click rate, bounce rate, etc. Showcasing this set of slides titled Effective Email Advertising Report Monthly Performance Report Graphics PDF. The topics addressed in these templates are Effective Email Advertising, Report Monthly Performance Report. All the content presented in this PPT design is completely editable. Download it and make adjustments in color, background, font etc. as per your unique business setting.
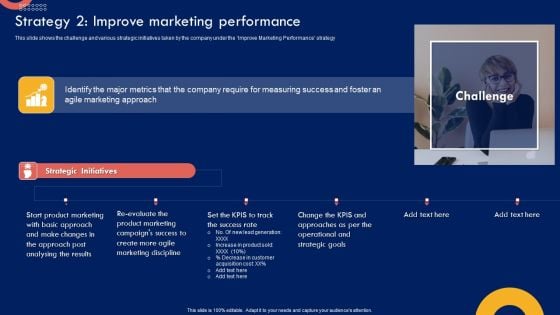
Product Marketing Leadership Strategy 2 Improve Marketing Performance Mockup PDF
This slide shows the challenge and various strategic initiatives taken by the company under the Improve Marketing Performance strategy. The Product Marketing Leadership Strategy 2 Improve Marketing Performance Mockup PDF is a compilation of the most recent design trends as a series of slides. It is suitable for any subject or industry presentation, containing attractive visuals and photo spots for businesses to clearly express their messages. This template contains a variety of slides for the user to input data, such as structures to contrast two elements, bullet points, and slides for written information. Slidegeeks is prepared to create an impression.
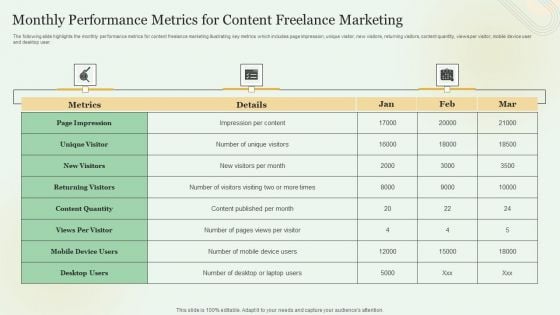
Monthly Performance Metrics For Content Freelance Marketing Ideas PDF
The following slide highlights the monthly performance metrics for content freelance marketing illustrating key metrics which includes page impression, unique visitor, new visitors, returning visitors, content quantity, views per visitor, mobile device user and desktop user. Showcasing this set of slides titled Monthly Performance Metrics For Content Freelance Marketing Ideas PDF. The topics addressed in these templates are Content Quantity, Mobile Device Users, Metrics. All the content presented in this PPT design is completely editable. Download it and make adjustments in color, background, font etc. as per your unique business setting.
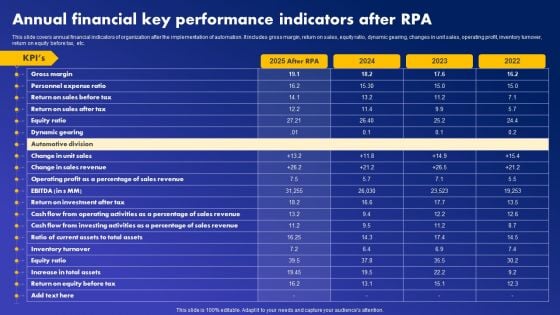
Annual Financial Key Performance Indicators After RPA Guidelines PDF
This slide covers annual financial indicators of organization after the implementation of automation. It includes gross margin, return on sales, equity ratio, dynamic gearing, changes in unit sales, operating profit, inventory turnover, return on equity before tax, etc. Create an editable Annual Financial Key Performance Indicators After RPA Guidelines PDF that communicates your idea and engages your audience. Whether you are presenting a business or an educational presentation, pre-designed presentation templates help save time. Annual Financial Key Performance Indicators After RPA Guidelines PDF is highly customizable and very easy to edit, covering many different styles from creative to business presentations. Slidegeeks has creative team members who have crafted amazing templates. So, go and get them without any delay.
Metrics For Measuring Strategic Customer Service Performance Analysis Icons PDF
This slide illustrate various type of customer service key performance indictors that is used to monitor business activities. It includes metrices such as average resolution time, customer service abandonment rate, customer retention rate, net promoter score and first contact resolution rate. Presenting Metrics For Measuring Strategic Customer Service Performance Analysis Icons PDF to dispense important information. This template comprises five stages. It also presents valuable insights into the topics including Average Resolution Time, Customer Retention Rate, Customer Service Abandonment Rate. This is a completely customizable PowerPoint theme that can be put to use immediately. So, download it and address the topic impactfully.
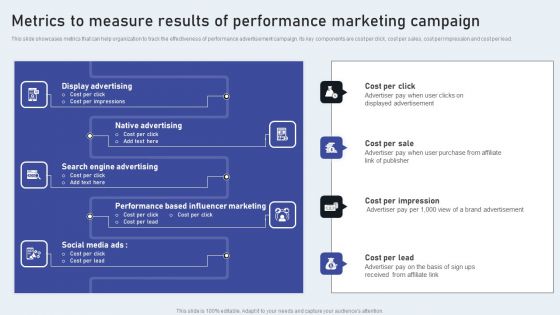
Metrics To Measure Results Of Performance Marketing Campaign Sample PDF
This slide showcases metrics that can help organization to track the effectiveness of performance advertisement campaign. Its key components are cost per click, cost per sales, cost per impression and cost per lead. Want to ace your presentation in front of a live audience Our Metrics To Measure Results Of Performance Marketing Campaign Sample PDF can help you do that by engaging all the users towards you. Slidegeeks experts have put their efforts and expertise into creating these impeccable powerpoint presentations so that you can communicate your ideas clearly. Moreover, all the templates are customizable, and easy-to-edit and downloadable. Use these for both personal and commercial use.
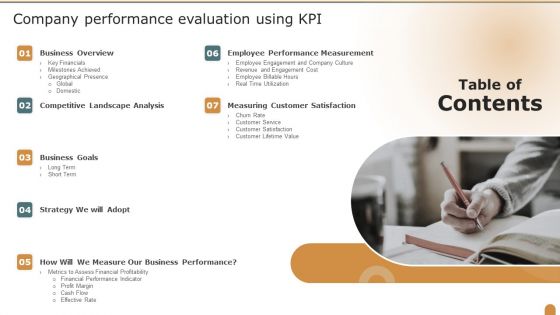
Table Of Contents Company Performance Evaluation Using KPI Infographics PDF
Presenting Table Of Contents Company Performance Evaluation Using KPI Infographics PDF to provide visual cues and insights. Share and navigate important information on seven stages that need your due attention. This template can be used to pitch topics like Business Overview, Business Goals, Competitive Landscape Analysis. In addtion, this PPT design contains high resolution images, graphics, etc, that are easily editable and available for immediate download.
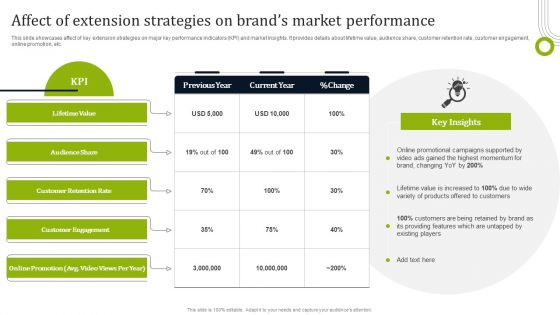
Affect Of Extension Strategies On Brands Market Performance Designs PDF
This slide showcases affect of key extension strategies on major key performance indicators KPI and market insights. It provides details about lifetime value, audience share, customer retention rate, customer engagement, online promotion, etc. Create an editable Affect Of Extension Strategies On Brands Market Performance Designs PDF that communicates your idea and engages your audience. Whether you are presenting a business or an educational presentation, pre-designed presentation templates help save time. Affect Of Extension Strategies On Brands Market Performance Designs PDF is highly customizable and very easy to edit, covering many different styles from creative to business presentations. Slidegeeks has creative team members who have crafted amazing templates. So, go and get them without any delay.
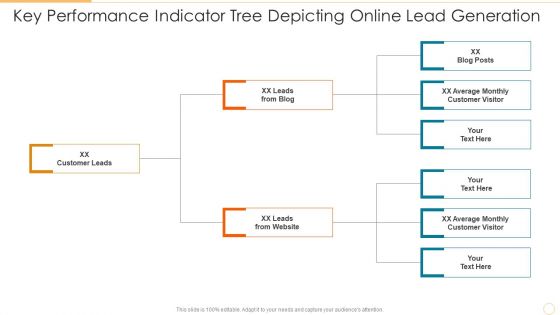
Key Performance Indicator Tree Depicting Online Lead Generation Information PDF
Persuade your audience using this key performance indicator tree depicting online lead generation information pdf. This PPT design covers three stages, thus making it a great tool to use. It also caters to a variety of topics including customer leads, leads from blog, leads from website. Download this PPT design now to present a convincing pitch that not only emphasizes the topic but also showcases your presentation skills.
Project Key Performance Indicator Tree Illustrating Customer Satisfaction Icons PDF
Persuade your audience using this project key performance indicator tree illustrating customer satisfaction icons pdf. This PPT design covers four stages, thus making it a great tool to use. It also caters to a variety of topics including total customer complaints, total customer notifications, customer satisfaction project. Download this PPT design now to present a convincing pitch that not only emphasizes the topic but also showcases your presentation skills.
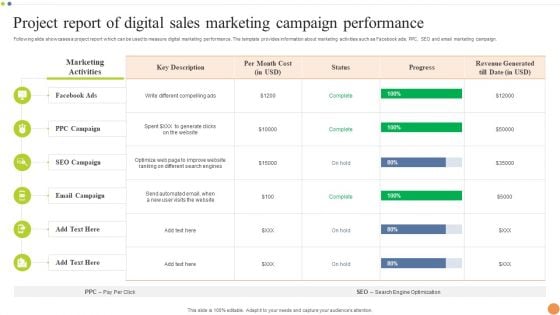
Project Report Of Digital Sales Marketing Campaign Performance Professional PDF
Following slide showcases a project report which can be used to measure digital marketing performance. The template provides information about marketing activities such as Facebook ads, PPC, SEO and email marketing campaign. Pitch your topic with ease and precision using this Project Report Of Digital Sales Marketing Campaign Performance Professional PDF. This layout presents information on Email Campaign, SEO Campaign, Marketing Activities. It is also available for immediate download and adjustment. So, changes can be made in the color, design, graphics or any other component to create a unique layout.
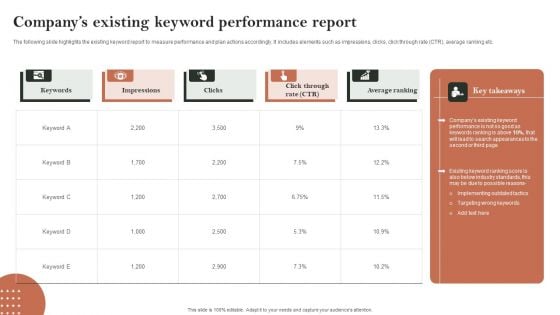
Search Engine Marketing Companys Existing Keyword Performance Report Topics PDF
The following slide highlights the existing keyword report to measure performance and plan actions accordingly. It includes elements such as impressions, clicks, click through rate CTR, average ranking etc. Boost your pitch with our creative Search Engine Marketing Companys Existing Keyword Performance Report Topics PDF. Deliver an awe-inspiring pitch that will mesmerize everyone. Using these presentation templates you will surely catch everyones attention. You can browse the ppts collection on our website. We have researchers who are experts at creating the right content for the templates. So you dont have to invest time in any additional work. Just grab the template now and use them.
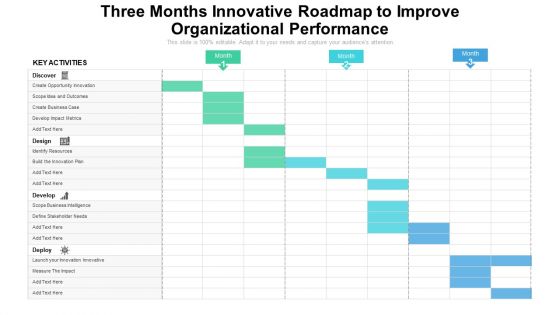
Three Months Innovative Roadmap To Improve Organizational Performance Infographics
We present our three months innovative roadmap to improve organizational performance infographics. This PowerPoint layout is easy to edit so you can change the font size, font type, color, and shape conveniently. In addition to this, the PowerPoint layout is Google Slides compatible, so you can share it with your audience and give them access to edit it. Therefore, download and save this well researched three months innovative roadmap to improve organizational performance infographics in different formats like PDF, PNG, and JPG to smoothly execute your business plan.
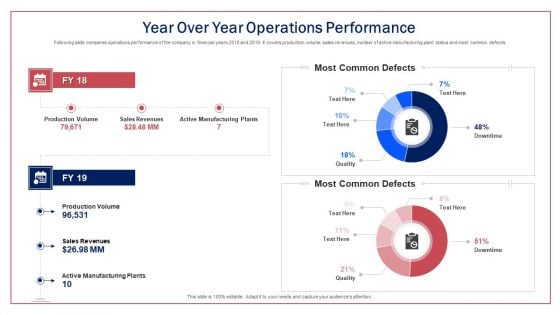
Year Over Year Operations Performance Ppt Infographic Template Shapes PDF
Following slide compares operations performance of the company in financial years 2018 and 2019. It covers production volume, sales revenues, number of active manufacturing plant status and most common defects.Deliver and pitch your topic in the best possible manner with this year over year operations performance ppt infographic template shapes pdf. Use them to share invaluable insights on most common defects, most common defects, active manufacturing plants, production volume and impress your audience. This template can be altered and modified as per your expectations. So, grab it now.
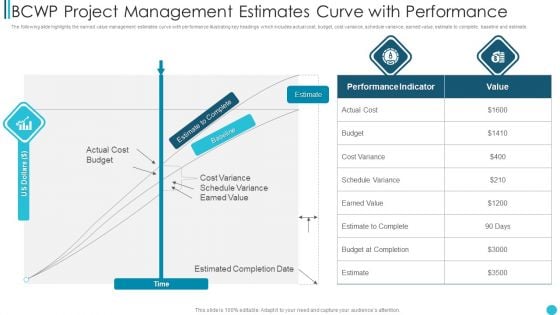
BCWP Project Management Estimates Curve With Performance Infographics PDF
The following slide highlights the earned value management estimates curve with performance illustrating key headings which includes actual cost, budget, cost variance, schedule variance, earned value, estimate to complete, baseline and estimate.Showcasing this set of slides titled BCWP Project Management Estimates Curve With Performance Infographics PDF The topics addressed in these templates are Cost Variance, Schedule Variance, Eames Value All the content presented in this PPT design is completely editable. Download it and make adjustments in color, background, font etc. as per your unique business setting.
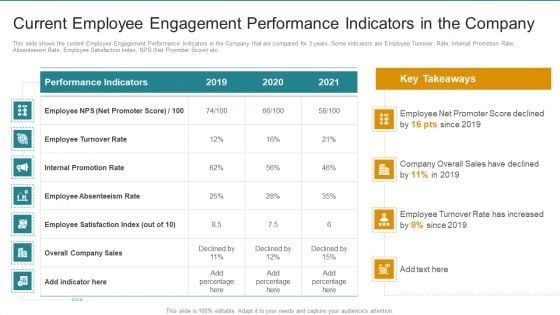
Current Employee Engagement Performance Indicators In The Company Infographics PDF
This slide shows the current Employee Engagement Performance Indicators in the Company that are compared for 3 years. Some indicators are Employee Turnover Rate, Internal Promotion Rate, Absenteeism Rate, Employee Satisfaction Index, NPS Net Promoter Score etc. Deliver an awe inspiring pitch with this creative Current Employee Engagement Performance Indicators In The Company Infographics PDF bundle. Topics like Net Promoter Score, Internal Promotion Rate, Employee Turnover Rate can be discussed with this completely editable template. It is available for immediate download depending on the needs and requirements of the user.
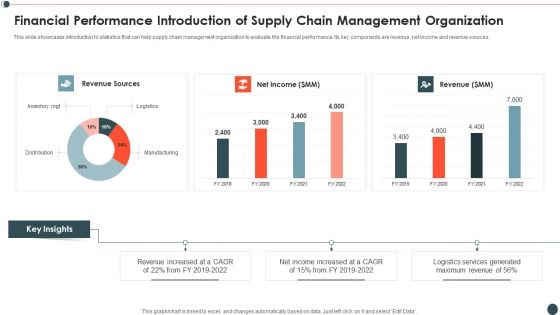
Financial Performance Introduction Of Supply Chain Management Organization Infographics PDF
This slide showcases introduction to statistics that can help supply chain management organization to evaluate the financial performance. Its key components are revenue, net income and revenue sources.Pitch your topic with ease and precision using this Financial Performance Introduction Of Supply Chain Management Organization Infographics PDF This layout presents information on Revenue Sources, Revenue Increased, Income Increased It is also available for immediate download and adjustment. So, changes can be made in the color, design, graphics or any other component to create a unique layout.
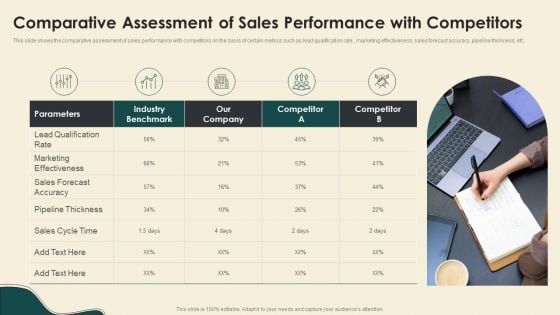
Comparative Assessment Of Sales Performance With Competitors Infographics PDF
This slide shows the comparative assessment of sales performance with competitors on the basis of certain metrics such as lead qualification rate, marketing effectiveness, sales forecast accuracy, pipeline thickness, etc. Presenting Comparative Assessment Of Sales Performance With Competitors Infographics PDF to provide visual cues and insights. Share and navigate important information on five stages that need your due attention. This template can be used to pitch topics like Industry Benchmark, Marketing Effectiveness, Sales Forecast Accuracy. In addtion, this PPT design contains high resolution images, graphics, etc, that are easily editable and available for immediate download.
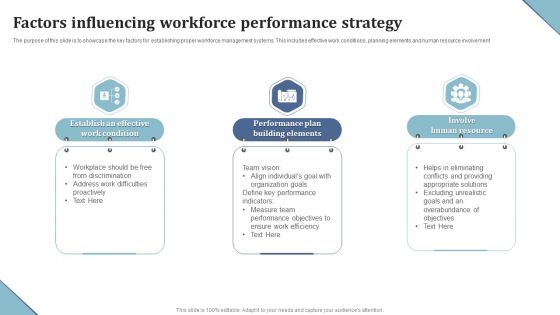
Factors Influencing Workforce Performance Strategy Ppt Infographics Graphics Pictures PDF
The purpose of this slide is to showcase the key factors for establishing proper workforce management systems. This includes effective work conditions, planning elements and human resource involvement. Persuade your audience using this Factors Influencing Workforce Performance Strategy Ppt Infographics Graphics Pictures PDF. This PPT design covers three stages, thus making it a great tool to use. It also caters to a variety of topics including Performance Plan, Building Elements, Involve Human Resource. Download this PPT design now to present a convincing pitch that not only emphasizes the topic but also showcases your presentation skills.
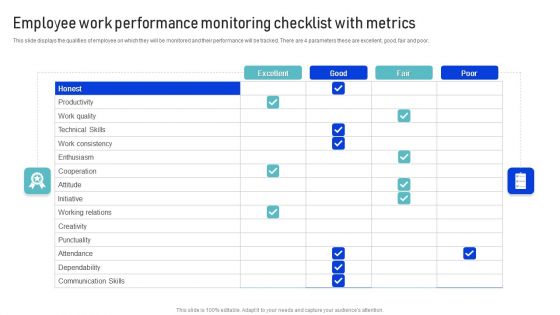
Employee Work Performance Monitoring Checklist With Metrics Infographics PDF
This slide displays the qualities of employee on which they will be monitored and their performance will be tracked. There are 4 parameters these are excellent, good, fair and poor. Showcasing this set of slides titled Employee Work Performance Monitoring Checklist With Metrics Infographics PDF. The topics addressed in these templates are Work Quality, Productivity, Communication Skills. All the content presented in this PPT design is completely editable. Download it and make adjustments in color, background, font etc. as per your unique business setting.
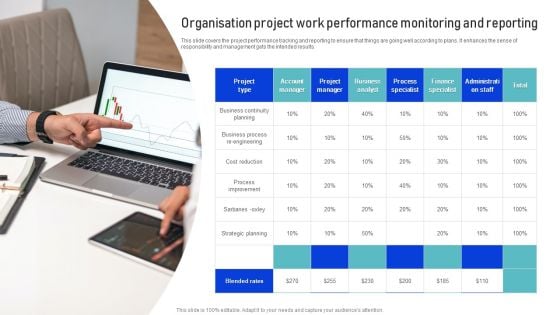
Organisation Project Work Performance Monitoring And Reporting Infographics PDF
This slide covers the project performance tracking and reporting to ensure that things are going well according to plans. It enhances the sense of responsibility and management gets the intended results. Presenting Organisation Project Work Performance Monitoring And Reporting Infographics PDF to dispense important information. This template comprises one stages. It also presents valuable insights into the topics including Business Continuity Planning, Strategic Planning, Business Analyst. This is a completely customizable PowerPoint theme that can be put to use immediately. So, download it and address the topic impactfully.
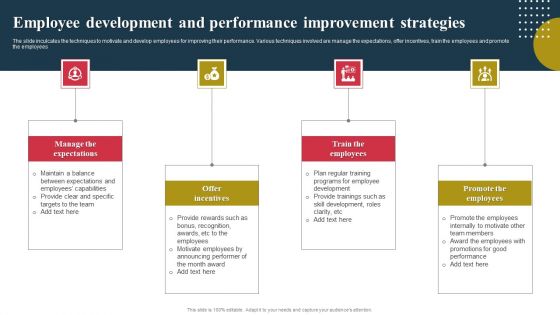
Employee Development And Performance Improvement Strategies Ppt Infographic Template PDF
The slide inculcates the techniques to motivate and develop employees for improving their performance. Various techniques involved are manage the expectations, offer incentives, train the employees and promote the employees. Persuade your audience using this Employee Development And Performance Improvement Strategies Ppt Infographic Template PDF. This PPT design covers four stages, thus making it a great tool to use. It also caters to a variety of topics including Manage Expectations, Offer Incentives, Train Employees, Promote Employees. Download this PPT design now to present a convincing pitch that not only emphasizes the topic but also showcases your presentation skills.
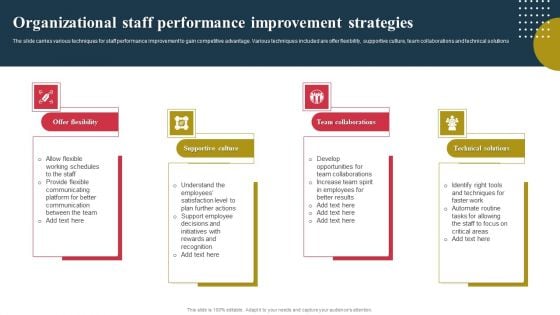
Organizational Staff Performance Improvement Strategies Ppt Infographic Template Format PDF
The slide carries various techniques for staff performance improvement to gain competitive advantage. Various techniques included are offer flexibility, supportive culture, team collaborations and technical solutions. Presenting Organizational Staff Performance Improvement Strategies Ppt Infographic Template Format PDF to dispense important information. This template comprises four stages. It also presents valuable insights into the topics including Offer Flexibility, Supportive Culture, Team Collaborations, Technical Solutions. This is a completely customizable PowerPoint theme that can be put to use immediately. So, download it and address the topic impactfully.
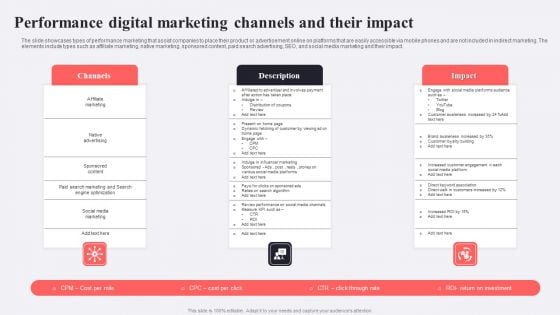
Performance Digital Marketing Channels And Their Impact Infographics PDF
The slide showcases types of performance marketing that assist companies to place their product or advertisement online on platforms that are easily accessible via mobile phones and are not included in indirect marketing. The elements include types such as affiliate marketing, native marketing, sponsored content, paid search advertising, SEO, and social media marketing and their impact. Showcasing this set of slides titled Performance Digital Marketing Channels And Their Impact Infographics PDF. The topics addressed in these templates are Channels, Impact, Affiliate Marketing. All the content presented in this PPT design is completely editable. Download it and make adjustments in color, background, font etc. as per your unique business setting.
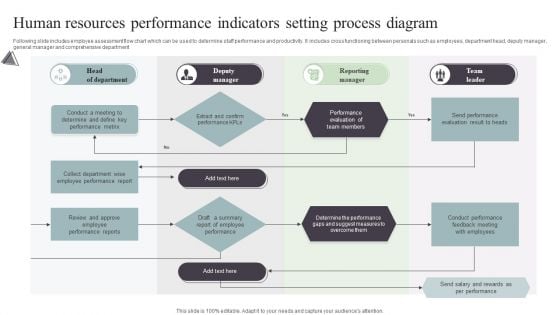
Human Resources Performance Indicators Setting Process Diagram Infographics PDF
Following slide includes employee assessment flow chart which can be used to determine staff performance and productivity. It includes cross functioning between personals such as employees, department head, deputy manager, general manager and comprehensive department. Presenting Human Resources Performance Indicators Setting Process Diagram Infographics PDF to dispense important information. This template comprises one stages. It also presents valuable insights into the topics including Head Of Department, Deputy Manager, Reporting Manager, Team Leader. This is a completely customizable PowerPoint theme that can be put to use immediately. So, download it and address the topic impactfully.
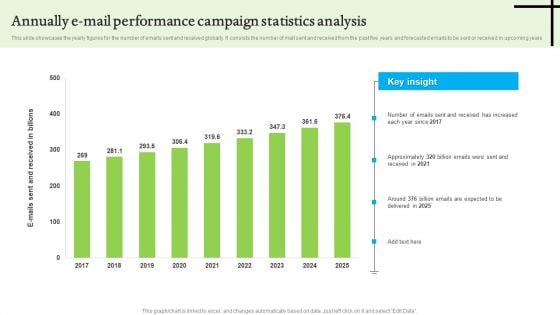
Annually E Mail Performance Campaign Statistics Analysis Infographics PDF
This slide showcases the yearly figures for the number of emails sent and received globally. It consists the number of mail sent and received from the past five years and forecasted emails to be sent or received in upcoming years. Showcasing this set of slides titled Annually E Mail Performance Campaign Statistics Analysis Infographics PDF. The topics addressed in these templates are Annually E Mail Performance, Campaign Statistics Analysis. All the content presented in this PPT design is completely editable. Download it and make adjustments in color, background, font etc. as per your unique business setting.
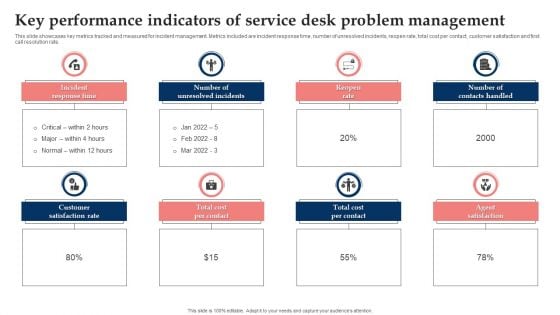
Key Performance Indicators Of Service Desk Problem Management Elements PDF
This slide showcases key metrics tracked and measured for incident management. Metrics included are incident response time, number of unresolved incidents, reopen rate, total cost per contact, customer satisfaction and first call resolution rate. Presenting Key Performance Indicators Of Service Desk Problem Management Elements PDF to dispense important information. This template comprises eight stages. It also presents valuable insights into the topics including Incident Response Time, Number Of Unresolved Incidents, Number Of Contacts Handled. This is a completely customizable PowerPoint theme that can be put to use immediately. So, download it and address the topic impactfully.
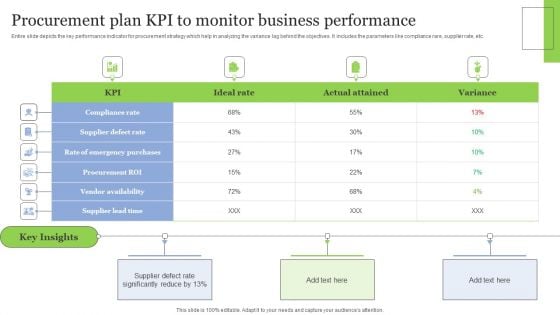
Procurement Plan Kpi To Monitor Business Performance Clipart PDF
Entire slide depicts the key performance indicator for procurement strategy which help in analyzing the variance lag behind the objectives. It includes the parameters like compliance rare, supplier rate, etc. Showcasing this set of slides titled Procurement Plan Kpi To Monitor Business Performance Clipart PDF. The topics addressed in these templates are Key Insights, Vendor Availability, Procurement ROI. All the content presented in this PPT design is completely editable. Download it and make adjustments in color, background, font etc. as per your unique business setting.
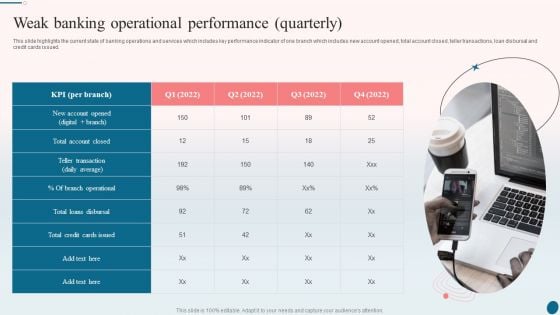
Banking Operations Management Weak Banking Operational Performance Quarterly Pictures PDF
This slide highlights the current state of banking operations and services which includes key performance indicator of one branch which includes new account opened, total account closed, teller transactions, loan disbursal and credit cards issued. This is a Banking Operations Management Weak Banking Operational Performance Quarterly Pictures PDF template with various stages. Focus and dispense information on one stages using this creative set, that comes with editable features. It contains large content boxes to add your information on topics like Average, Loans Disbursal, Credit Cards. You can also showcase facts, figures, and other relevant content using this PPT layout. Grab it now.
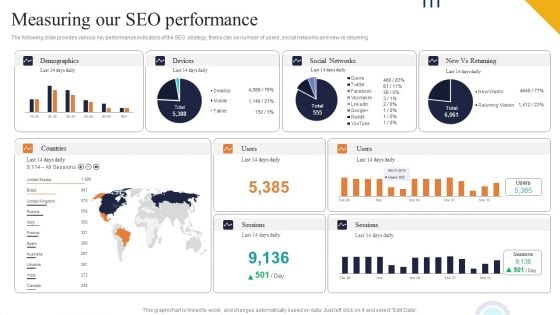
Measuring Our SEO Performance Ppt PowerPoint Presentation File Example PDF
The following slide provides various key performance indicators of the SEO strategy, these can be number of users, social networks and new vs returning If your project calls for a presentation, then Slidegeeks is your go to partner because we have professionally designed, easy to edit templates that are perfect for any presentation. After downloading, you can easily edit Measuring Our SEO Performance Ppt PowerPoint Presentation File Example PDF and make the changes accordingly. You can rearrange slides or fill them with different images. Check out all the handy templates
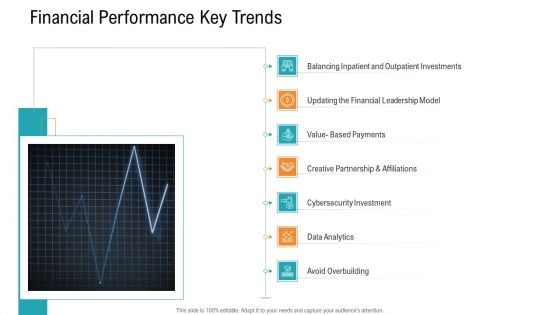
Hospital Management Financial Performance Key Trends Ppt Model Icons PDF
Deliver an awe inspiring pitch with this creative hospital management financial performance key trends ppt model icons pdf bundle. Topics like data analytics, avoid overbuilding, cybersecurity investment, value based payments, updating the financial leadership model can be discussed with this completely editable template. It is available for immediate download depending on the needs and requirements of the user.
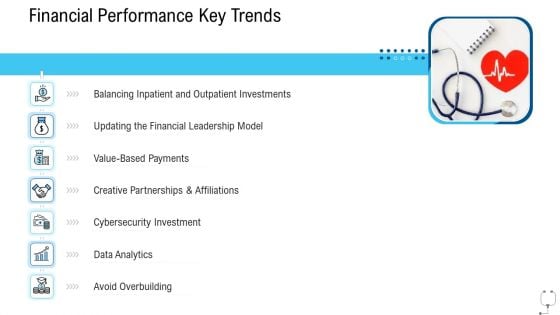
E Healthcare Management System Financial Performance Key Trends Formats PDF
Deliver an awe inspiring pitch with this creative e healthcare management system financial performance key trends formats pdf bundle. Topics like data analytics, avoid overbuilding, cybersecurity investment, value based payments, updating the financial leadership model can be discussed with this completely editable template. It is available for immediate download depending on the needs and requirements of the user.
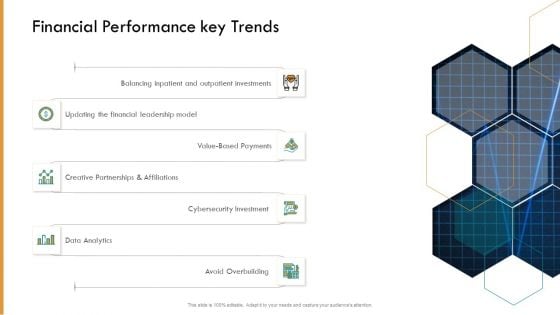
Healthcare Management Financial Performance Key Trends Ppt Slides Example PDF
Deliver an awe inspiring pitch with this creative healthcare management financial performance key trends ppt slides example pdf bundle. Topics like data analytics, avoid overbuilding, cybersecurity investment, value based payments, updating the financial leadership model can be discussed with this completely editable template. It is available for immediate download depending on the needs and requirements of the user.
Pharmaceutical Management Financial Performance Key Trends Ppt Outline Microsoft PDF
Deliver an awe inspiring pitch with this creative pharmaceutical management financial performance key trends ppt outline microsoft pdf bundle. Topics like data analytics, avoid overbuilding, cybersecurity investment, value based payments, updating the financial leadership model can be discussed with this completely editable template. It is available for immediate download depending on the needs and requirements of the user.
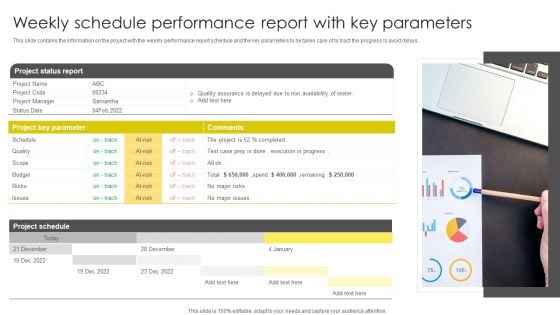
Weekly Schedule Performance Report With Key Parameters Portrait PDF
This slide contains the information on the project with the weekly performance report schedule and the key parameters to be taken care of to tract the progress to avoid delays. Presenting Weekly Schedule Performance Report With Key Parameters Portrait PDF to dispense important information. This template comprises one stages. It also presents valuable insights into the topics including Project Status Report, Project Key Parameter, Project Schedule. This is a completely customizable PowerPoint theme that can be put to use immediately. So, download it and address the topic impactfully.
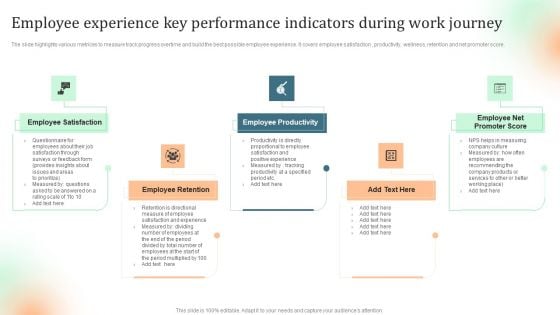
Employee Experience Key Performance Indicators During Work Journey Topics PDF
The slide highlights various metrices to measure track progress overtime and build the best possible employee experience. It covers employee satisfaction , productivity, wellness, retention and net promoter score. Presenting Employee Experience Key Performance Indicators During Work Journey Topics PDF to dispense important information. This template comprises five stages. It also presents valuable insights into the topics including Employee Productivity, Employee Retention, Employee Satisfaction. This is a completely customizable PowerPoint theme that can be put to use immediately. So, download it and address the topic impactfully.
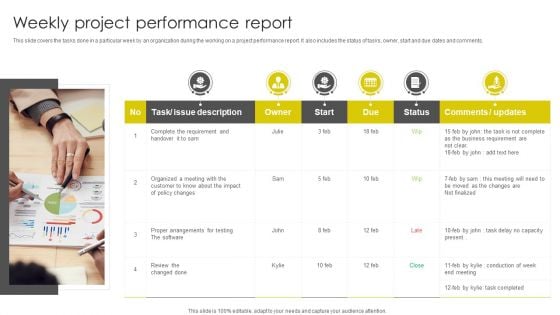
Weekly Project Performance Report Ppt Inspiration Ideas PDF
This slide covers the tasks done in a particular week by an organization during the working on a project performance report. It also includes the status of tasks, owner, start and due dates and comments. Persuade your audience using this Weekly Project Performance Report Ppt Inspiration Ideas PDF. This PPT design covers six stages, thus making it a great tool to use. It also caters to a variety of topics including Organized Meeting, Proper Arrangements, Testing Software. Download this PPT design now to present a convincing pitch that not only emphasizes the topic but also showcases your presentation skills.


 Continue with Email

 Home
Home


