Performance Dashboard
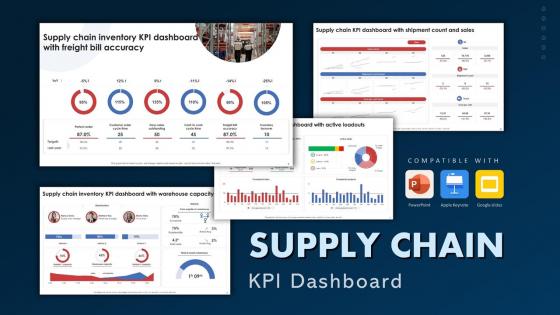
Supply Chain KPI Dashboard Powerpoint Ppt Template Bundles
Use this Supply Chain KPI Dashboard Powerpoint Ppt Template Bundles to ensure the business world gets to know you as a presentation expert with tremendous recall value. With its focus on providing the worlds best designs to highlight business ideas that have the potential to change the world, this PPT Template is sure to win you clients. The complete deck in Freight Bill KPI, Warehouse Capacity, Average Purchase Value, Supply Chain Metrics, Total Savings slides is a compendium of information, structured in a manner that provides the best framework for a presentation. Use this completely editable and customizable presentation to make an impact and improve your order book. Download now. Supply chain KPIs key performance indicators are metrics that measure the performance of a supply chain and help with decision-making. Our Supply Chain KPI Dashboard Powerpoint Ppt Template Bundles are topically designed to provide an attractive backdrop to any subject.
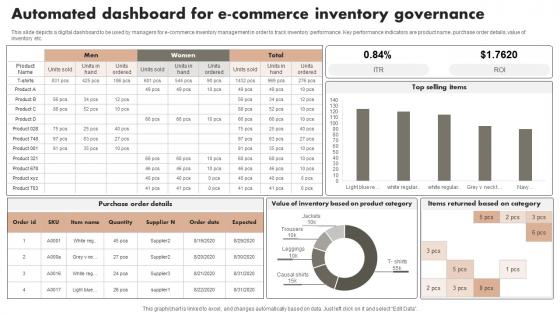
Automated Dashboard For E Commerce Inventory Governance Download Pdf
This slide depicts a digital dashboard to be used by managers for e commerce inventory management in order to track inventory performance. Key performance indicators are product name, purchase order details, value of inventory etc. Showcasing this set of slides titled Automated Dashboard For E Commerce Inventory Governance Download Pdf. The topics addressed in these templates are Governance, Automated, Commerce. All the content presented in this PPT design is completely editable. Download it and make adjustments in color, background, font etc. as per your unique business setting. This slide depicts a digital dashboard to be used by managers for e commerce inventory management in order to track inventory performance. Key performance indicators are product name, purchase order details, value of inventory etc.
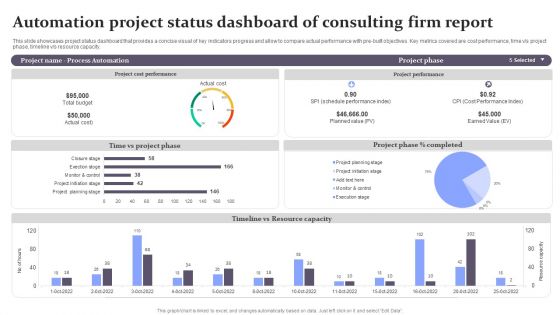
Automation Project Status Dashboard Of Consulting Firm Report Background PDF
This slide showcases project status dashboard that provides a concise visual of key indicators progress and allow to compare actual performance with pre-built objectives. Key metrics covered are cost performance, time v or s project phase, timeline v or s resource capacity. Showcasing this set of slides titled Automation Project Status Dashboard Of Consulting Firm Report Background PDF. The topics addressed in these templates are Project Phase, Planned Value, Cost Performance Index. All the content presented in this PPT design is completely editable. Download it and make adjustments in color, background, font etc. as per your unique business setting.
Plan Dashboard For Tracking Location Wise Revenue Diagrams PDF
This slide presents a dashboard which will assist managers to track the revenue of each branch having geographical presence in different corners of the world. The key performance indicators are total revenue, location wise rent, branch performance among many others.Pitch your topic with ease and precision using this Plan Dashboard For Tracking Location Wise Revenue Diagrams PDF. This layout presents information on Taxes Paid, Current Month, Branch Performance, Previous Quarter. It is also available for immediate download and adjustment. So, changes can be made in the color, design, graphics or any other component to create a unique layout.
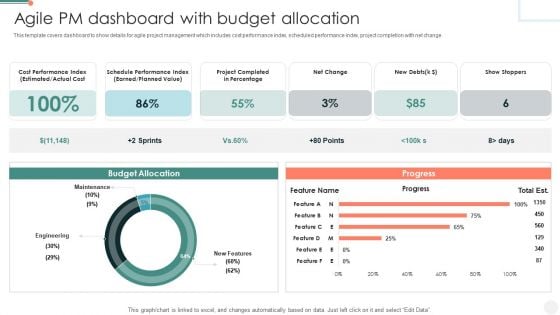
Agile PM Dashboard With Budget Allocation Guidelines PDF
This template covers dashboard to show details for agile project management which includes cost performance index, scheduled performance index, project completion with net change. Showcasing this set of slides titled Agile PM Dashboard With Budget Allocation Guidelines PDF. The topics addressed in these templates are Actual Cost, Budget Allocation, Agile Pm Dashboard. All the content presented in this PPT design is completely editable. Download it and make adjustments in color, background, font etc. as per your unique business setting.
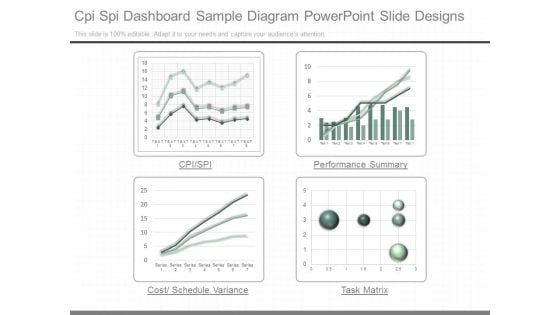
Cpi Spi Dashboard Sample Diagram Powerpoint Slide Designs
This is a cpi spi dashboard sample diagram powerpoint slide designs. This is a four stage process. The stages in this process are cpi spi, performance summary, cost schedule variance, task matrix.
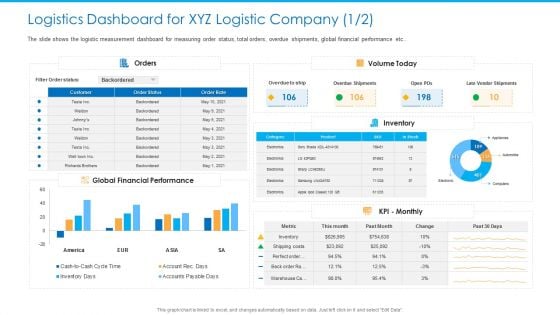
Logistics Dashboard For XYZ Logistic Company Orders Slides PDF
The slide shows the logistic measurement dashboard for measuring order status, total orders, overdue shipments, global financial performance etc.Deliver and pitch your topic in the best possible manner with this logistics dashboard for xyz logistic company orders slides pdf. Use them to share invaluable insights on global financial performance, overdue shipments, late vendor shipments and impress your audience. This template can be altered and modified as per your expectations. So, grab it now.
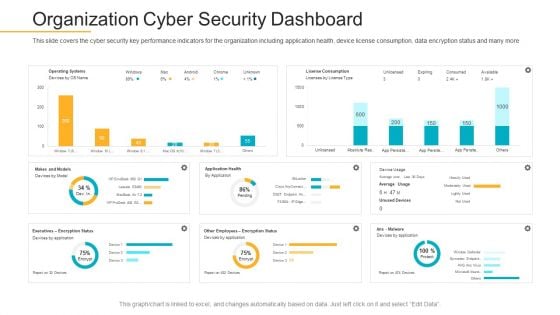
Data Breach Prevention Recognition Organization Cyber Security Dashboard Demonstration PDF
This slide covers the cyber security key performance indicators for the organization including application health, device license consumption, data encryption status and many more. Deliver and pitch your topic in the best possible manner with this data breach prevention recognition organization cyber security dashboard demonstration pdf. Use them to share invaluable insights on cyber security, key performance, organization and impress your audience. This template can be altered and modified as per your expectations. So, grab it now.
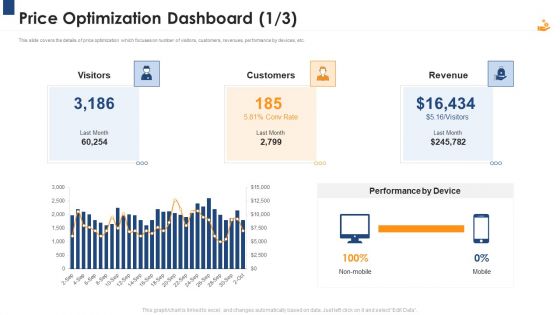
Income Management Tool Price Optimization Dashboard Customers Inspiration PDF
This slide covers the details of price optimization which focuses on number of visitors, customers, revenues, performance by devices, etc. Deliver and pitch your topic in the best possible manner with this income management tool price optimization dashboard customers inspiration pdf. Use them to share invaluable insights on visitors, customers, revenue, performance by device and impress your audience. This template can be altered and modified as per your expectations. So, grab it now.
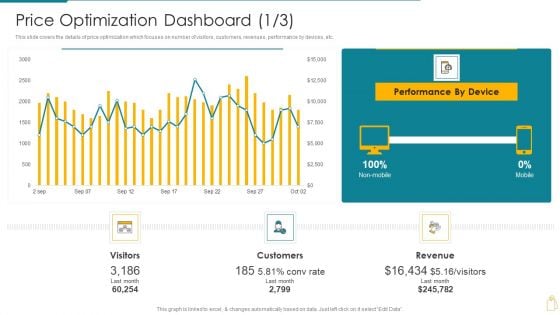
Price Optimization Dashboard Cost And Income Optimization Guidelines PDF
This slide covers the details of price optimization which focuses on number of visitors, customers, revenues, performance by devices, etc. Deliver an awe inspiring pitch with this creative Price Optimization Dashboard Cost And Income Optimization Guidelines PDF bundle. Topics like visitors, customers, revenue, performance device can be discussed with this completely editable template. It is available for immediate download depending on the needs and requirements of the user.
Monthly Sales KPI Dashboard For Tracking Brand Recommendation Progress Background PDF
Following slide demonstrates key performance indicator dashboard for tracking monthly sales to monitor business performance. It includes components such as monthly execution cost, sales, state wise events, Brand market, and programs. Showcasing this set of slides titled Monthly Sales KPI Dashboard For Tracking Brand Recommendation Progress Background PDF. The topics addressed in these templates are Products Sold, Engagements, Events, Active Markets, Sampled, Attendance. All the content presented in this PPT design is completely editable. Download it and make adjustments in color, background, font etc. as per your unique business setting.
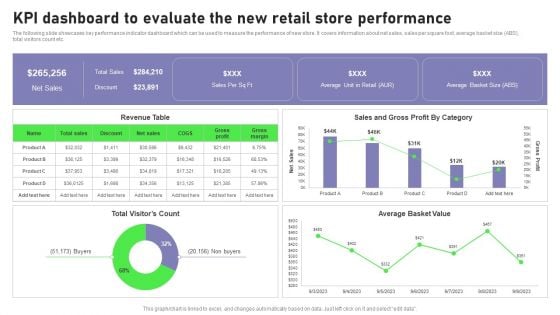
Retail Outlet Opening To Enhance Product Sale Kpi Dashboard To Evaluate The New Retail Guidelines PDF
The following slide showcases key performance indicator dashboard which can be used to measure the performance of new store. It covers information about net sales, sales per square foot, average basket size ABS, total visitors count etc. There are so many reasons you need a Retail Outlet Opening To Enhance Product Sale Kpi Dashboard To Evaluate The New Retail Guidelines PDF. The first reason is you can not spend time making everything from scratch, Thus, Slidegeeks has made presentation templates for you too. You can easily download these templates from our website easily.
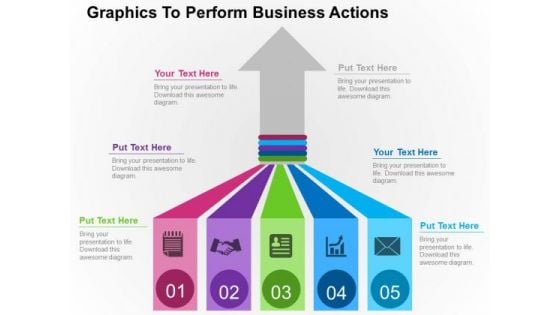
Graphics To Perform Business Actions PowerPoint Template
The above template displays arrow Infographic with five steps. This diagram helps to exhibit steps to perform business action. Adjust the above diagram in your business presentations to visually support your content.
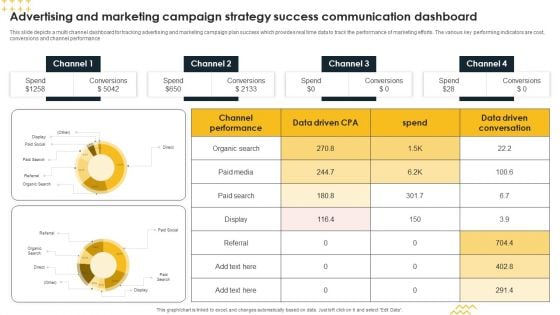
Advertising And Marketing Campaign Strategy Success Communication Dashboard Inspiration PDF
This slide depicts a multi channel dashboard for tracking advertising and marketing campaign plan success which provides real time data to track the performance of marketing efforts. The various key performing indicators are cost, conversions and channel performance Showcasing this set of slides titled Advertising And Marketing Campaign Strategy Success Communication Dashboard Inspiration PDF. The topics addressed in these templates are Conversions, Spend, Channel. All the content presented in this PPT design is completely editable. Download it and make adjustments in color, background, font etc. as per your unique business setting.
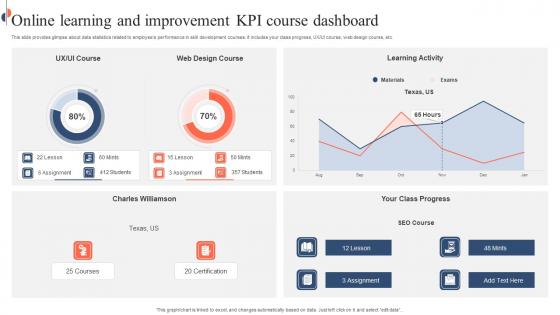
Online Learning And Improvement KPI Course Dashboard Mockup Pdf
This slide provides glimpse about data statistics related to employee performance in skill development courses. It includes your class progress, UX or UI course, web design course, etc. Showcasing this set of slides titled Online Learning And Improvement KPI Course Dashboard Mockup Pdf. The topics addressed in these templates are Online Learning, KPI Course Dashboard, Skill Development Courses. All the content presented in this PPT design is completely editable. Download it and make adjustments in color, background, font etc. as per your unique business setting. This slide provides glimpse about data statistics related to employee performance in skill development courses. It includes your class progress, UX or UI course, web design course, etc.
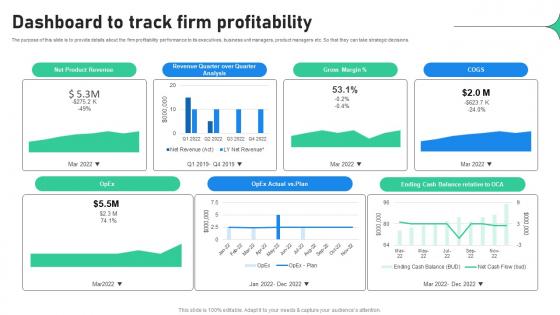
Dashboard To Track Firm Profitability Increasing Profitability Through Better Product
The purpose of this slide is to provide details about the firm profitability performance to its executives, business unit managers, product managers etc. So that they can take strategic decisions. From laying roadmaps to briefing everything in detail, our templates are perfect for you. You can set the stage with your presentation slides. All you have to do is download these easy-to-edit and customizable templates. Dashboard To Track Firm Profitability Increasing Profitability Through Better Product will help you deliver an outstanding performance that everyone would remember and praise you for. Do download this presentation today. The purpose of this slide is to provide details about the firm profitability performance to its executives, business unit managers, product managers etc. So that they can take strategic decisions.
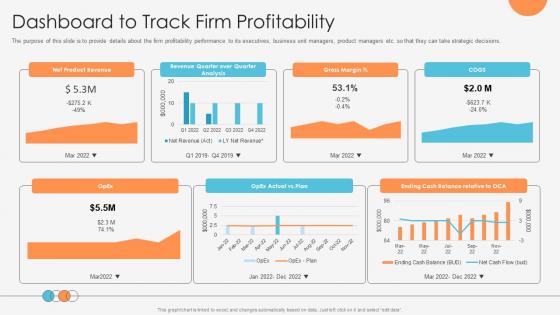
Enhancing Profitability Modelling Dashboard To Track Firm Profitability
The purpose of this slide is to provide details about the firm profitability performance to its executives, business unit managers, product managers etc. so that they can take strategic decisions. From laying roadmaps to briefing everything in detail, our templates are perfect for you. You can set the stage with your presentation slides. All you have to do is download these easy-to-edit and customizable templates. Enhancing Profitability Modelling Dashboard To Track Firm Profitability will help you deliver an outstanding performance that everyone would remember and praise you for. Do download this presentation today. The purpose of this slide is to provide details about the firm profitability performance to its executives, business unit managers, product managers etc. so that they can take strategic decisions.
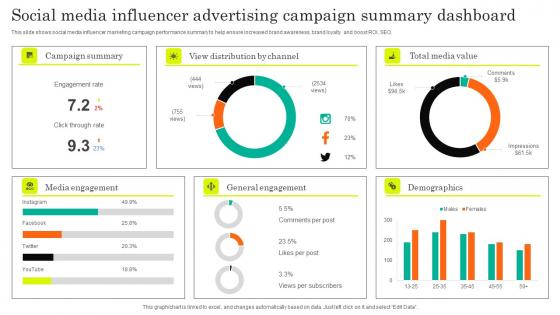
Social Media Influencer Advertising Campaign Summary Dashboard Formats Pdf
This slide shows social media influencer marketing campaign performance summary to help ensure increased brand awareness, brand loyalty and boost ROI, SEO. Showcasing this set of slides titled Social Media Influencer Advertising Campaign Summary Dashboard Formats Pdf. The topics addressed in these templates are Summary, Engagement, Demographics. All the content presented in this PPT design is completely editable. Download it and make adjustments in color, background, font etc. as per your unique business setting. This slide shows social media influencer marketing campaign performance summary to help ensure increased brand awareness, brand loyalty and boost ROI, SEO.
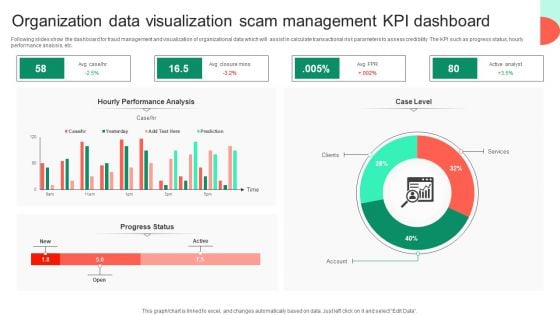
Organization Data Visualization Scam Management KPI Dashboard Rules PDF
Following slides show the dashboard for fraud management and visualization of organizational data which will assist in calculate transactional risk parameters to assess credibility. The KPI such as progress status, hourly performance analysis, etc. Showcasing this set of slides titled Organization Data Visualization Scam Management KPI Dashboard Rules PDF. The topics addressed in these templates are Hourly Performance Analysis, Services, Organization Data Visualization. All the content presented in this PPT design is completely editable. Download it and make adjustments in color, background, font etc. as per your unique business setting.
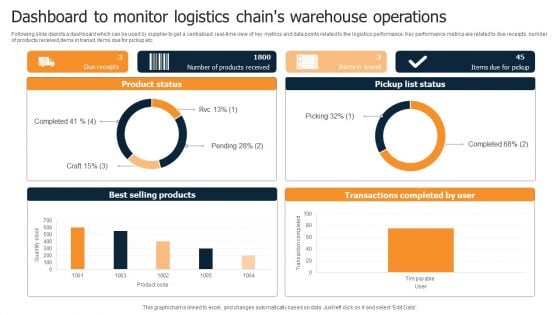
Dashboard To Monitor Logistics Chains Warehouse Operations Diagrams PDF
Following slide depicts a dashboard which can be used by supplier to get a centralized, real-time view of key metrics and data points related to the logistics performance. Key performance metrics are related to due receipts, number of products received,items in transit, items due for pickup etc. Pitch your topic with ease and precision using this Dashboard To Monitor Logistics Chains Warehouse Operations Diagrams PDF. This layout presents information on Product Status, Pickup List Status, Best Selling Products. It is also available for immediate download and adjustment. So, changes can be made in the color, design, graphics or any other component to create a unique layout.
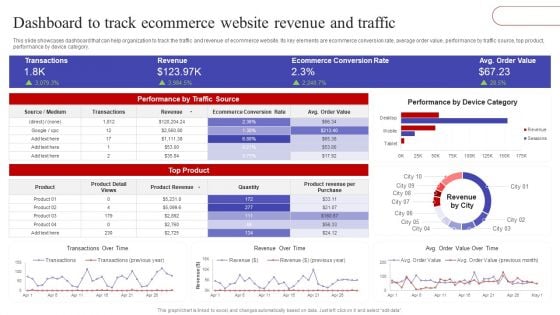
Dashboard To Track Ecommerce Website Revenue And Traffic Rules PDF
This slide showcases dashboard that can help organization to track the traffic and revenue of ecommerce website. Its key elements are ecommerce conversion rate, average order value, performance by traffic source, top product, performance by device category. There are so many reasons you need a Dashboard To Track Ecommerce Website Revenue And Traffic Rules PDF. The first reason is you can not spend time making everything from scratch, Thus, Slidegeeks has made presentation templates for you too. You can easily download these templates from our website easily.
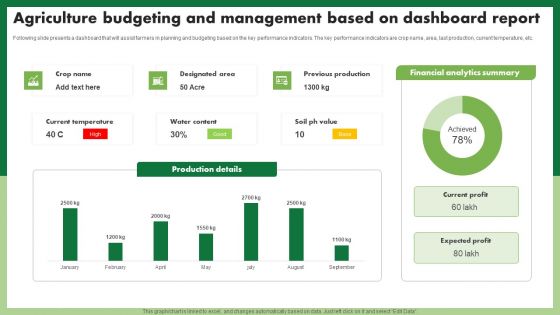
Agriculture Budgeting And Management Based On Dashboard Report Topics PDF
Following slide presents a dashboard that will assist farmers in planning and budgeting based on the key performance indicators. The key performance indicators are crop name, area, last production, current temperature, etc. Showcasing this set of slides titled Agriculture Budgeting And Management Based On Dashboard Report Topics PDF. The topics addressed in these templates are Production Details. All the content presented in this PPT design is completely editable. Download it and make adjustments in color, background, font etc. as per your unique business setting.
Salesman Principles Playbook Sales Management Activities Tracking Dashboard Ideas PDF
This slide provides information regarding various metrics catered to track sales team performance in terms of average revenue per account, win rate, NPS, along with sales representative performance tracking through number of opportunities created, lead response time, etc. Deliver and pitch your topic in the best possible manner with this salesman principles playbook sales management activities tracking dashboard ideas pdf Use them to share invaluable insights on sales management activities tracking dashboard and impress your audience. This template can be altered and modified as per your expectations. So, grab it now.
Sales Management Playbook Sales Management Activities Tracking Dashboard Themes PDF
This slide provides information regarding various metrics catered to track sales team performance in terms of average revenue per account, win rate, NPS, along with sales representative performance tracking through number of opportunities created, lead response time, etc. Deliver an awe inspiring pitch with this creative Sales Management Playbook Sales Management Activities Tracking Dashboard Themes PDF bundle. Topics like Sales Management Activities Tracking Dashboard can be discussed with this completely editable template. It is available for immediate download depending on the needs and requirements of the user.
Project Metrics Dashboard With Revenues And Expenses Icons PDF
This slide shows the project management dashboard which covers the name, priorities, indicators and status which includes strategic priorities, research and development, administration, performance management, etc. With purchases in last 30 days and tasks. Showcasing this set of slides titled Project Metrics Dashboard With Revenues And Expenses Icons PDF. The topics addressed in these templates are Performance Management, Research And Development, Strategic Priorities. All the content presented in this PPT design is completely editable. Download it and make adjustments in color, background, font etc. as per your unique business setting.
Dashboard For Tracking Sales Target Metrics Introduction PDF
This slide presents KPI dashboard for tracking Sales Target Metrics achievement monthly and region wise helpful in adjusting activities as per ongoing performance. It includes average weekly sales revenue, average sales target, annual sales growth, regional sales performance and average revenue per unit that should be regularly tracked. Showcasing this set of slides titled Dashboard For Tracking Sales Target Metrics Introduction PDF. The topics addressed in these templates are Average Revenue, Per Unit, Average Weekly, Sales Revenue. All the content presented in this PPT design is completely editable. Download it and make adjustments in color, background, font etc. as per your unique business setting.
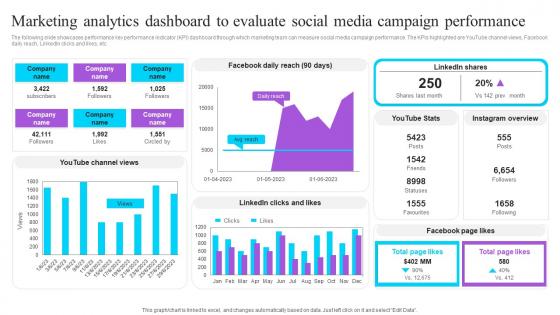
Marketing Analytics Dashboard To Evaluate Social Effective GTM Techniques Structure PDF
The following slide showcases performance key performance indicator KPI dashboard through which marketing team can measure social media campaign performance. The KPIs highlighted are YouTube channel views, Facebook daily reach, LinkedIn clicks and likes, etc. The best PPT templates are a great way to save time, energy, and resources. Slidegeeks have 100 percent editable powerpoint slides making them incredibly versatile. With these quality presentation templates, you can create a captivating and memorable presentation by combining visually appealing slides and effectively communicating your message. Download Marketing Analytics Dashboard To Evaluate Social Effective GTM Techniques For Startup Business Elements PDF from Slidegeeks and deliver a wonderful presentation. The following slide showcases performance key performance indicator KPI dashboard through which marketing team can measure social media campaign performance. The KPIs highlighted are YouTube channel views, Facebook daily reach, LinkedIn clicks and likes, etc.
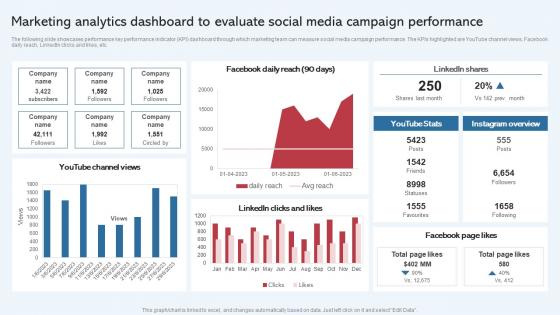
Marketing Analytics Dashboard To Evaluate Social Effective Startup Promotion Structure Rules Pdf
The following slide showcases performance key performance indicator KPI dashboard through which marketing team can measure social media campaign performance. The KPIs highlighted are YouTube channel views, Facebook daily reach, LinkedIn clicks and likes, etc. The best PPT templates are a great way to save time, energy, and resources. Slidegeeks have 100 percent editable powerpoint slides making them incredibly versatile. With these quality presentation templates, you can create a captivating and memorable presentation by combining visually appealing slides and effectively communicating your message. Download Marketing Analytics Dashboard To Evaluate Social Effective Startup Promotion Structure Rules Pdf from Slidegeeks and deliver a wonderful presentation. The following slide showcases performance key performance indicator KPI dashboard through which marketing team can measure social media campaign performance. The KPIs highlighted are YouTube channel views, Facebook daily reach, LinkedIn clicks and likes, etc.
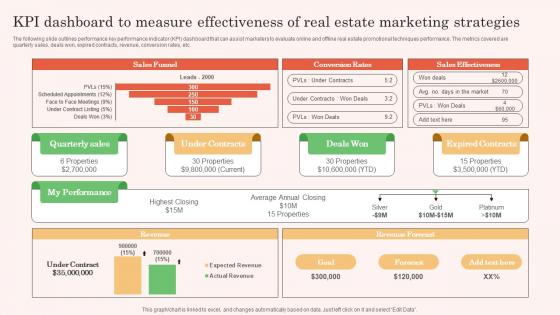
KPI Dashboard To Measure Effectivenesss Real Estate Property Marketing Themes Pdf
The following slide outlines performance key performance indicator KPI dashboard that can assist marketers to evaluate online and offline real estate promotional techniques performance. The metrics covered are quarterly sales, deals won, expired contracts, revenue, conversion rates, etc. Take your projects to the next level with our ultimate collection of KPI Dashboard To Measure Effectivenesss Real Estate Property Marketing Themes Pdf. Slidegeeks has designed a range of layouts that are perfect for representing task or activity duration, keeping track of all your deadlines at a glance. Tailor these designs to your exact needs and give them a truly corporate look with your own brand colors they all make your projects stand out from the rest. The following slide outlines performance key performance indicator KPI dashboard that can assist marketers to evaluate online and offline real estate promotional techniques performance. The metrics covered are quarterly sales, deals won, expired contracts, revenue, conversion rates, etc.
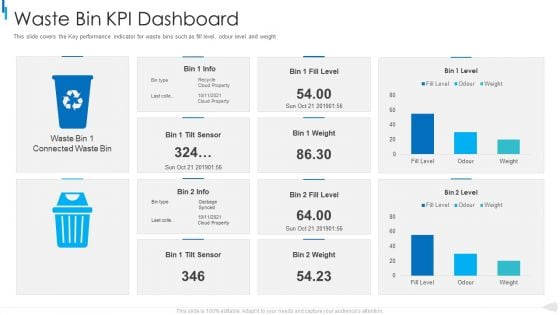
MSW Management Waste Bin Kpi Dashboard Clipart PDF
This slide covers the Key performance indicator for waste bins such as fill level, odour level and weight. Deliver an awe inspiring pitch with this creative MSW Management Waste Bin Kpi Dashboard Clipart Pdf bundle. Topics like waste bin kpi dashboard can be discussed with this completely editable template. It is available for immediate download depending on the needs and requirements of the user.
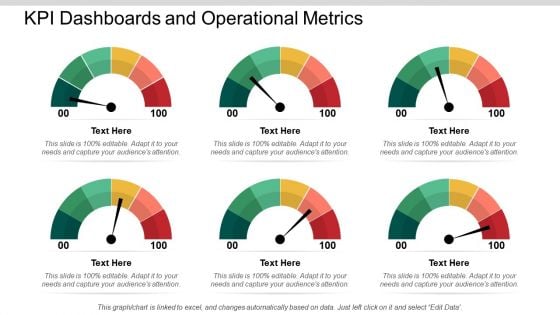
KPI Dashboards And Operational Metrics Ppt PowerPoint Presentation Portfolio Infographics
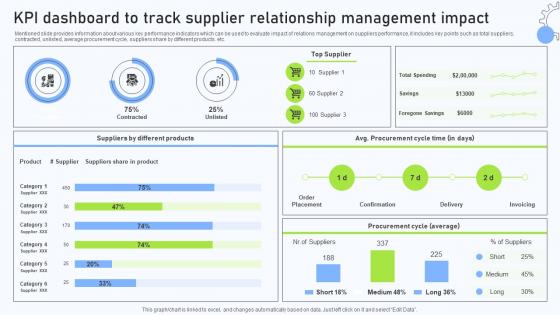
Relationship Management Automation KPI Dashboard To Track Supplier Relationship
Mentioned slide provides information about various key performance indicators which can be used to evaluate impact of relations management on suppliers performance, it includes key points such as total suppliers, contracted, unlisted, average procurement cycle, suppliers share by different products. etc. This Relationship Management Automation KPI Dashboard To Track Supplier Relationship is perfect for any presentation, be it in front of clients or colleagues. It is a versatile and stylish solution for organizing your meetings. The Relationship Management Automation KPI Dashboard To Track Supplier Relationship features a modern design for your presentation meetings. The adjustable and customizable slides provide unlimited possibilities for acing up your presentation. Slidegeeks has done all the homework before launching the product for you. So, do not wait, grab the presentation templates today Mentioned slide provides information about various key performance indicators which can be used to evaluate impact of relations management on suppliers performance, it includes key points such as total suppliers, contracted, unlisted, average procurement cycle, suppliers share by different products. etc.
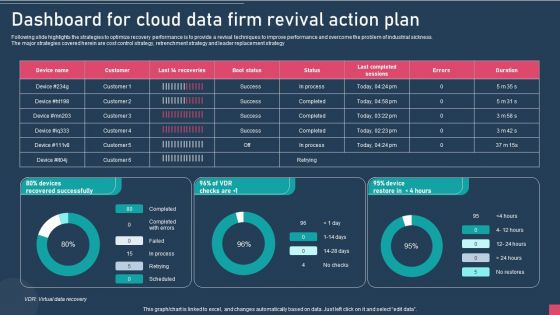
Dashboard For Cloud Data Firm Revival Action Plan Summary PDF
Following slide highlights the strategies to optimize recovery performance is to provide a revival techniques to improve performance and overcome the problem of industrial sickness. The major strategies covered herein are cost control strategy, retrenchment strategy and leader replacement strategy. Pitch your topic with ease and precision using this Dashboard For Cloud Data Firm Revival Action Plan Summary PDF. This layout presents information on Device, Success, Process. It is also available for immediate download and adjustment. So, changes can be made in the color, design, graphics or any other component to create a unique layout.

Virtual Assets Investment Guide Cryptocurrency Portfolio Investment Dashboard Guidelines PDF
Identifying the metrics which help in analyzing the product performance play a crucial role when it comes to tracking performance. The following slide highlights such manor KPIs, these are total sell, total buy, etc. Deliver an awe inspiring pitch with this creative Virtual Assets Investment Guide Cryptocurrency Portfolio Investment Dashboard Guidelines PDF bundle. Topics like Bitcoin BTC, Total Sell, Total Buy can be discussed with this completely editable template. It is available for immediate download depending on the needs and requirements of the user.
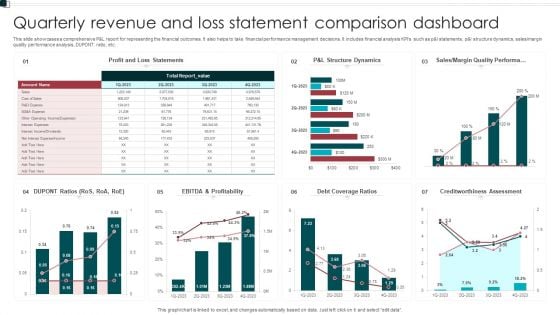
Quarterly Revenue And Loss Statement Comparison Dashboard Portrait PDF
This slide showcases a comprehensive P and L report for representing the financial outcomes. It also helps to take financial performance management decisions. It includes financial analysis KPIs such as p and l statements, p and l structure dynamics, sales or margin quality performance analysis, DUPONT ratio, etc. Showcasing this set of slides titled Quarterly Revenue And Loss Statement Comparison Dashboard Portrait PDF. The topics addressed in these templates are Profitability, Debt Coverage Ratios, Margin Quality Performa. All the content presented in this PPT design is completely editable. Download it and make adjustments in color, background, font etc. as per your unique business setting.
Sales Techniques Playbook Sales Management Activities Tracking Dashboard Introduction PDF
This slide provides information regarding various metrics catered to track sales team performance in terms of average revenue per account, win rate, NPS, along with sales representative performance tracking through number of opportunities created, lead response time, etc. Deliver an awe inspiring pitch with this creative sales techniques playbook sales management activities tracking dashboard introduction pdf bundle. Topics like growth, sales can be discussed with this completely editable template. It is available for immediate download depending on the needs and requirements of the user.
Key Blocks For Project Management Dashboard Ppt Icon Tips PDF
This slide illustrates graphical representations of facts and figures related to project drivers. It includes stakeholders engagement, feedback and response rate, business units performance etc. Showcasing this set of slides titled Key Blocks For Project Management Dashboard Ppt Icon Tips PDF. The topics addressed in these templates are Stakeholders Engagement Score, Business Units Performance, Effective Communication Score. All the content presented in this PPT design is completely editable. Download it and make adjustments in color, background, font etc. as per your unique business setting.

PMO KPI Dashboard With Completion Timeline Background PDF
Showcasing this set of slides titled PMO KPI Dashboard With Completion Timeline Background PDF The topics addressed in these templates are Projects Completion Timeline, Projects Performance Snapshot, Project Health All the content presented in this PPT design is completely editable. Download it and make adjustments in color, background, font etc. as per your unique business setting.
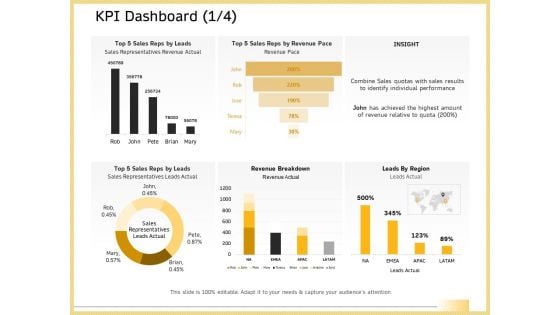
B2B Marketing KPI Dashboard INSIGHT Ppt Ideas Information PDF
Deliver an awe-inspiring pitch with this creative b2b marketing kpi dashboard insight ppt ideas information pdf bundle. Topics like revenue breakdown, leads region, sales reps leads, sales representatives leads actual, sales results identify individual performance can be discussed with this completely editable template. It is available for immediate download depending on the needs and requirements of the user.
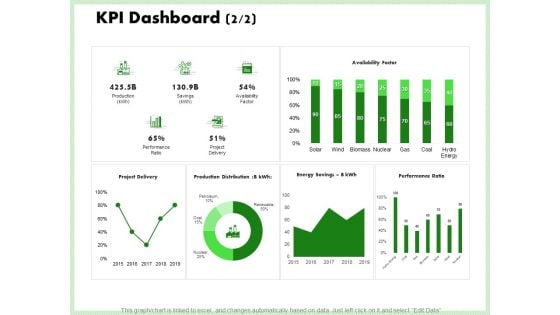
Eco Friendly And Feasibility Management KPI Dashboard Project Information PDF
Deliver and pitch your topic in the best possible manner with this eco friendly and feasibility management kpi dashboard project information pdf. Use them to share invaluable insights on 2015 to 2019, production distribution, project delivery, performance ratio, savings and impress your audience. This template can be altered and modified as per your expectations. So, grab it now.
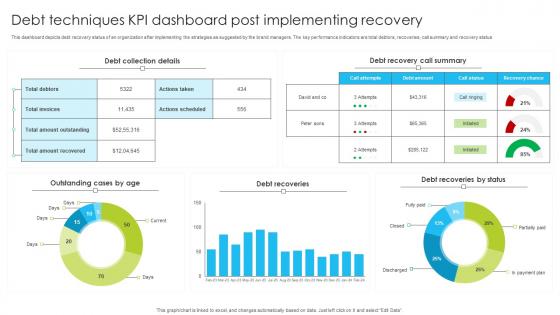
Debt Techniques KPI Dashboard Post Implementing Recovery Information Pdf
This dashboard depicts debt recovery status of an organization after implementing the strategies as suggested by the brand managers. The key performance indicators are total debtors, recoveries, call summary and recovery status. Showcasing this set of slides titled Debt Techniques KPI Dashboard Post Implementing Recovery Information Pdf. The topics addressed in these templates are Debt Techniques, KPI Dashboard, Post Implementing Recovery. All the content presented in this PPT design is completely editable. Download it and make adjustments in color, background, font etc. as per your unique business setting. This dashboard depicts debt recovery status of an organization after implementing the strategies as suggested by the brand managers. The key performance indicators are total debtors, recoveries, call summary and recovery status.
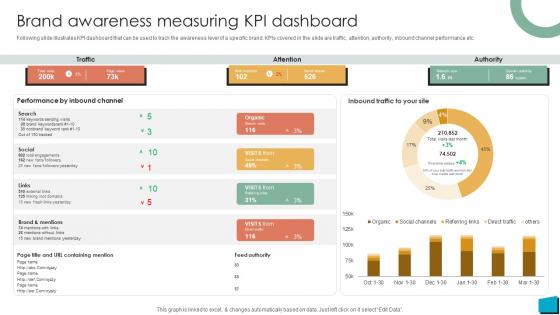
Brand Authority Brand Awareness Measuring KPI Dashboard Strategy SS V
Following slide illustrates KPI dashboard that can be used to track the awareness level of a specific brand. KPIs covered in the slide are traffic, attention, authority, inbound channel performance etc. Do you have to make sure that everyone on your team knows about any specific topic I yes, then you should give Brand Authority Brand Awareness Measuring KPI Dashboard Strategy SS V a try. Our experts have put a lot of knowledge and effort into creating this impeccable Brand Authority Brand Awareness Measuring KPI Dashboard Strategy SS V. You can use this template for your upcoming presentations, as the slides are perfect to represent even the tiniest detail. You can download these templates from the Slidegeeks website and these are easy to edit. So grab these today Following slide illustrates KPI dashboard that can be used to track the awareness level of a specific brand. KPIs covered in the slide are traffic, attention, authority, inbound channel performance etc.
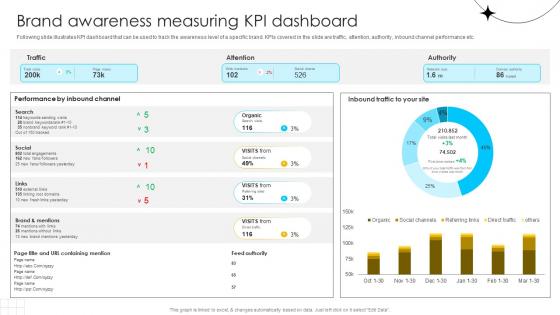
Brand Influence Brand Awareness Measuring KPI Dashboard Strategy SS V
Following slide illustrates KPI dashboard that can be used to track the awareness level of a specific brand. KPIs covered in the slide are traffic, attention, authority, inbound channel performance etc. Do you have to make sure that everyone on your team knows about any specific topic I yes, then you should give Brand Influence Brand Awareness Measuring KPI Dashboard Strategy SS V a try. Our experts have put a lot of knowledge and effort into creating this impeccable Brand Influence Brand Awareness Measuring KPI Dashboard Strategy SS V. You can use this template for your upcoming presentations, as the slides are perfect to represent even the tiniest detail. You can download these templates from the Slidegeeks website and these are easy to edit. So grab these today Following slide illustrates KPI dashboard that can be used to track the awareness level of a specific brand. KPIs covered in the slide are traffic, attention, authority, inbound channel performance etc.
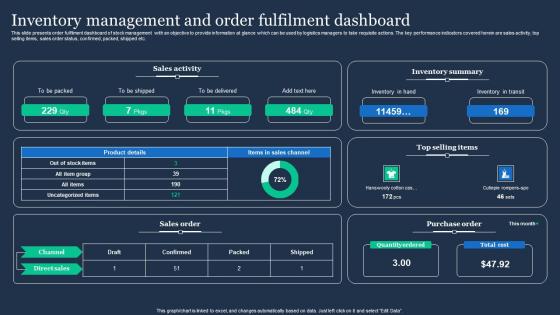
Inventory Management And Order Fulfilment Dashboard Slides Pdf
This slide presents order fulfilment dashboard of stock management with an objective to provide information at glance which can be used by logistics managers to take requisite actions. The key performance indicators covered herein are sales activity, top selling items, sales order status, confirmed, packed, shipped etc. Pitch your topic with ease and precision using this Inventory Management And Order Fulfilment Dashboard Slides Pdf. This layout presents information on Sales Activity, Inventory Summary, Sales Order. It is also available for immediate download and adjustment. So, changes can be made in the color, design, graphics or any other component to create a unique layout. This slide presents order fulfilment dashboard of stock management with an objective to provide information at glance which can be used by logistics managers to take requisite actions. The key performance indicators covered herein are sales activity, top selling items, sales order status, confirmed, packed, shipped etc.
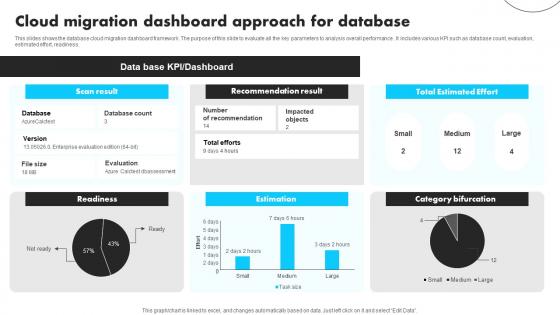
Cloud Migration Dashboard Approach For Database Guidelines Pdf
This slides shows the database cloud migration dashboard framework. The purpose of this slide to evaluate all the key parameters to analysis overall performance . It includes various KPI such as database count, evaluation, estimated effort, readiness. Pitch your topic with ease and precision using this Cloud Migration Dashboard Approach For Database Guidelines Pdf This layout presents information on Recommendation Result, Total Estimated Effort, Estimation It is also available for immediate download and adjustment. So, changes can be made in the color, design, graphics or any other component to create a unique layout. This slides shows the database cloud migration dashboard framework. The purpose of this slide to evaluate all the key parameters to analysis overall performance . It includes various KPI such as database count, evaluation, estimated effort, readiness.
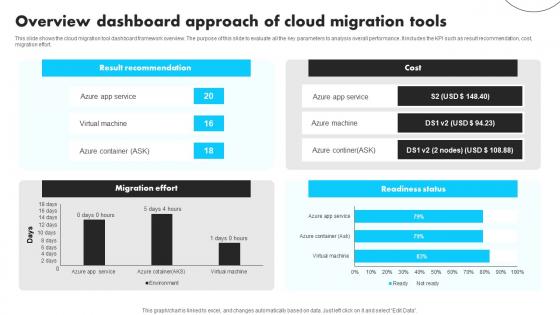
Overview Dashboard Approach Of Cloud Migration Tools Graphics Pdf
This slide shows the cloud migration tool dashboard framework overview. The purpose of this slide to evaluate all the key parameters to analysis overall performance .It includes the KPI such as result recommendation, cost, migration effort. Showcasing this set of slides titled Overview Dashboard Approach Of Cloud Migration Tools Graphics Pdf The topics addressed in these templates are Result Recommendation, Migration Effort, Readiness Status All the content presented in this PPT design is completely editable. Download it and make adjustments in color, background, font etc. as per your unique business setting. This slide shows the cloud migration tool dashboard framework overview. The purpose of this slide to evaluate all the key parameters to analysis overall performance .It includes the KPI such as result recommendation, cost, migration effort.
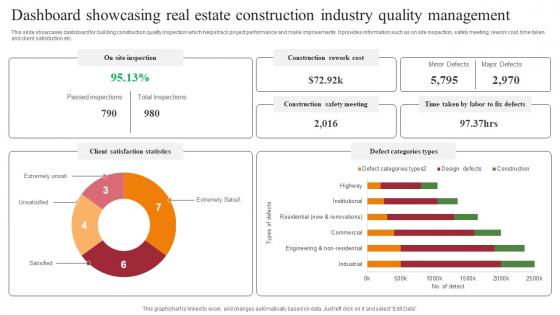
Dashboard Showcasing Real Estate Construction Industry Quality Management Topics Pdf
This slide showcases dashboard for building construction quality inspection which helps track project performance and make improvements. It provides information such as on site inspection, safety meeting, rework cost, time taken and client satisfaction etc. Pitch your topic with ease and precision using this Dashboard Showcasing Real Estate Construction Industry Quality Management Topics Pdf. This layout presents information on Client Satisfaction Statistics, Defect Categories Types. It is also available for immediate download and adjustment. So, changes can be made in the color, design, graphics or any other component to create a unique layout. This slide showcases dashboard for building construction quality inspection which helps track project performance and make improvements. It provides information such as on site inspection, safety meeting, rework cost, time taken and client satisfaction etc.
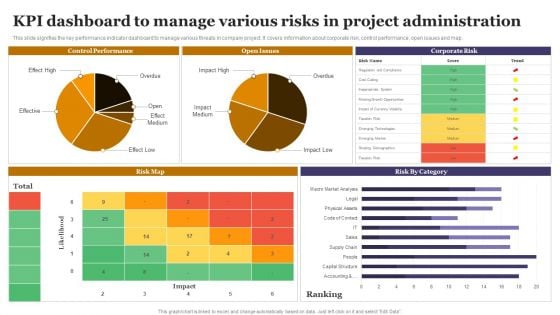
KPI Dashboard To Manage Various Risks In Project Administration Sample PDF
This slide signifies the key performance indicator dashboard to manage various threats in company project. It covers information about corporate risk, control performance, open issues and map. Showcasing this set of slides titled KPI Dashboard To Manage Various Risks In Project Administration Sample PDF. The topics addressed in these templates are Control Performance, Open Issues, Corporate Risk. All the content presented in this PPT design is completely editable. Download it and make adjustments in color, background, font etc. as per your unique business setting.
Cryptocurrency Portfolio Tracking Dashboard Summary Cryptocurrency Management With Blockchain
This slide represents the cryptocurrency performance indicators for the individual. The key components include invested money, profit and loss, rate of investment ROI, current valuation of money, etc.Formulating a presentation can take up a lot of effort and time, so the content and message should always be the primary focus. The visuals of the PowerPoint can enhance the presenters message, so our Cryptocurrency Portfolio Tracking Dashboard Summary Cryptocurrency Management With Blockchain was created to help save time. Instead of worrying about the design, the presenter can concentrate on the message while our designers work on creating the ideal templates for whatever situation is needed. Slidegeeks has experts for everything from amazing designs to valuable content, we have put everything into Cryptocurrency Portfolio Tracking Dashboard Summary Cryptocurrency Management With Blockchain. This slide represents the cryptocurrency performance indicators for the individual. The key components include invested money, profit and loss, rate of investment ROI, current valuation of money, etc.
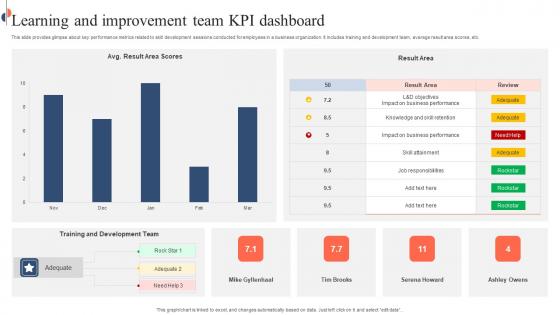
Learning And Improvement Team KPI Dashboard Slides Pdf
This slide provides glimpse about key performance metrics related to skill development sessions conducted for employees in a business organization. It includes training and development team, average result area scores, etc. Pitch your topic with ease and precision using this Learning And Improvement Team KPI Dashboard Slides Pdf. This layout presents information on Learning And Improvement Team, KPI Dashboard, Development Team. It is also available for immediate download and adjustment. So, changes can be made in the color, design, graphics or any other component to create a unique layout. This slide provides glimpse about key performance metrics related to skill development sessions conducted for employees in a business organization. It includes training and development team, average result area scores, etc.
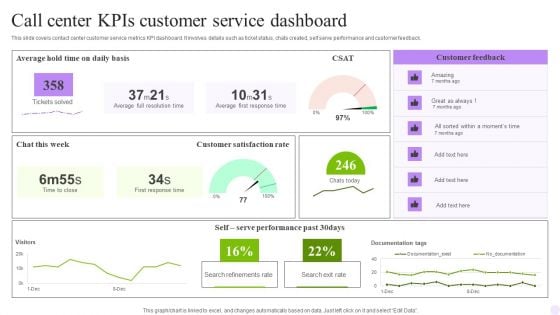
Call Center Kpis Customer Service Dashboard Pictures PDF
This slide covers contact center customer service metrics KPI dashboard. It involves details such as ticket status, chats created, self serve performance and customer feedback. Pitch your topic with ease and precision using this Call Center Kpis Customer Service Dashboard Pictures PDF. This layout presents information on Response Time, Customer, Dashboard. It is also available for immediate download and adjustment. So, changes can be made in the color, design, graphics or any other component to create a unique layout.
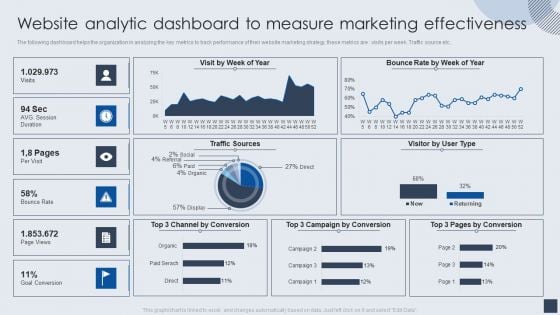
Website Analytic Dashboard To Measure Marketing Effectiveness Demonstration PDF
The following dashboard helps the organization in analyzing the key metrics to track performance of their website marketing strategy, these metrics are visits per week. Traffic source etc. Deliver and pitch your topic in the best possible manner with this Website Analytic Dashboard To Measure Marketing Effectiveness Demonstration PDF. Use them to share invaluable insights on Website Analytic Dashboard, Measure Marketing Effectiveness and impress your audience. This template can be altered and modified as per your expectations. So, grab it now.
Data Breach Prevention Status Tracking Dashboard Data Fortification Strengthening Defenses
This slide represents the critical cyber security performance indicators for the organization. The key components include application health, encryption status, license consumption, windows defender, etc.Are you in need of a template that can accommodate all of your creative concepts This one is crafted professionally and can be altered to fit any style. Use it with Google Slides or PowerPoint. Include striking photographs, symbols, depictions, and other visuals. Fill, move around, or remove text boxes as desired. Test out color palettes and font mixtures. Edit and save your work, or work with colleagues. Download Data Breach Prevention Status Tracking Dashboard Data Fortification Strengthening Defenses and observe how to make your presentation outstanding. Give an impeccable presentation to your group and make your presentation unforgettable. This slide represents the critical cyber security performance indicators for the organization. The key components include application health, encryption status, license consumption, windows defender, etc.
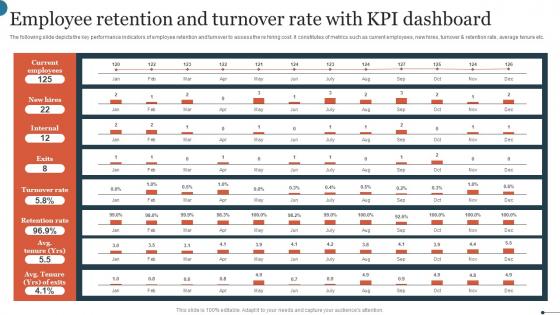
Employee Retention And Turnover Rate With KPI Dashboard Graphics Pdf
The following slide depicts the key performance indicators of employee retention and turnover to assess the re hiring cost. It constitutes of metrics such as current employees, new hires, turnover and retention rate, average tenure etc. Showcasing this set of slides titled Employee Retention And Turnover Rate With KPI Dashboard Graphics Pdf. The topics addressed in these templates are Current Employees, Turnover Rate, Retention Rate. All the content presented in this PPT design is completely editable. Download it and make adjustments in color, background, font etc. as per your unique business setting. The following slide depicts the key performance indicators of employee retention and turnover to assess the re hiring cost. It constitutes of metrics such as current employees, new hires, turnover and retention rate, average tenure etc.
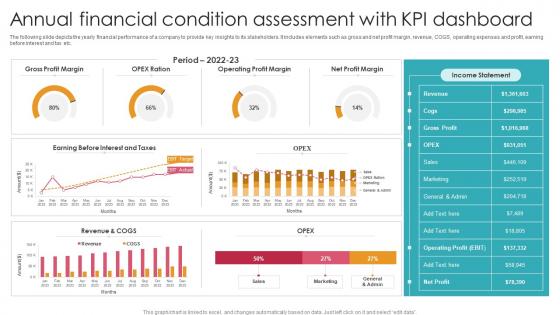
Annual Financial Condition Assessment With KPI Dashboard Ideas Pdf
The following slide depicts the yearly financial performance of a company to provide key insights to its stakeholders. It includes elements such as gross and net profit margin, revenue, COGS, operating expenses and profit, earning before interest and tax etc. Showcasing this set of slides titled Annual Financial Condition Assessment With KPI Dashboard Ideas Pdf. The topics addressed in these templates are Gross Profit Margin, Operating Profit Margin, Net Profit Margin. All the content presented in this PPT design is completely editable. Download it and make adjustments in color, background, font etc. as per your unique business setting. The following slide depicts the yearly financial performance of a company to provide key insights to its stakeholders. It includes elements such as gross and net profit margin, revenue, COGS, operating expenses and profit, earning before interest and tax etc.
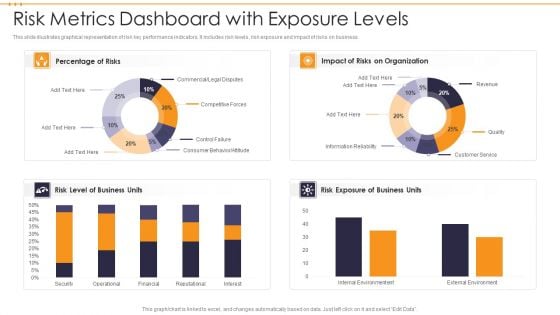
Risk Metrics Dashboard With Exposure Levels Template PDF
This slide illustrates graphical representation of risk key performance indicators. It includes risk levels, risk exposure and impact of risks on business. Pitch your topic with ease and precision using this Risk Metrics Dashboard With Exposure Levels Template PDF. This layout presents information on Risk Metrics Dashboard With Exposure Levels. It is also available for immediate download and adjustment. So, changes can be made in the color, design, graphics or any other component to create a unique layout.
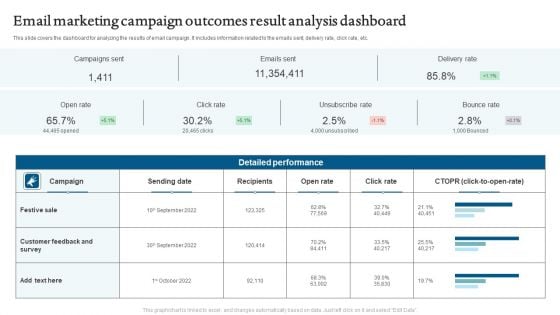
Email Marketing Campaign Outcomes Result Analysis Dashboard Mockup PDF
This slide covers the dashboard for analyzing the email campaign metrics. It includes information related to engagement a key performance indicator KPIs. Pitch your topic with ease and precision using this Email Marketing Campaign Outcomes Result Analysis Dashboard Mockup PDF. This layout presents information on Campaigns Sent, Emails Sent, Delivery Rate. It is also available for immediate download and adjustment. So, changes can be made in the color, design, graphics or any other component to create a unique layout.
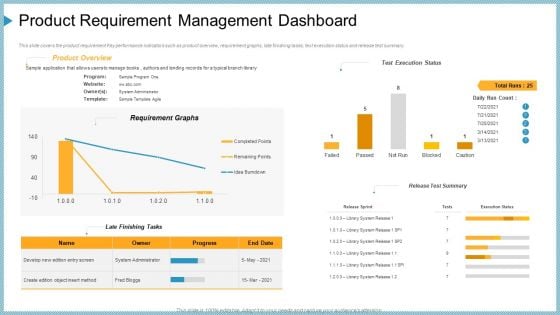
Product Requirement Management Dashboard Ppt File Slide PDF
This slide covers the product requirement Key performance indicators such as product overview, requirement graphs, late finishing tasks, text execution status and release test summary. Deliver an awe-inspiring pitch with this creative product requirement management dashboard ppt file slide pdf bundle. Topics like product requirement management dashboard can be discussed with this completely editable template. It is available for immediate download depending on the needs and requirements of the user.
Waste Bin Kpi Dashboard Ppt PowerPoint Presentation Icon Show PDF
This slide covers the Key performance indicator for waste bins such as fill level, odour level and weight. Deliver an awe inspiring pitch with this creative waste bin kpi dashboard ppt powerpoint presentation icon show pdf bundle. Topics like waste bin kpi dashboard can be discussed with this completely editable template. It is available for immediate download depending on the needs and requirements of the user.
Waste Management Tracking Dashboard Ppt PowerPoint Presentation File Information PDF
This slide covers the key performance indicators for waste management including waste trucks tracker, green house gasses emissions, energy used and many more. Deliver an awe inspiring pitch with this creative waste management tracking dashboard ppt powerpoint presentation file information pdf bundle. Topics like waste management tracking dashboard can be discussed with this completely editable template. It is available for immediate download depending on the needs and requirements of the user.


 Continue with Email

 Home
Home


