Performance Dashboard
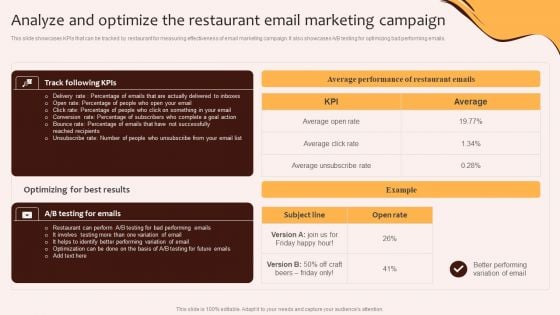
Digital Marketing Plan For Restaurant Business Analyze And Optimize The Restaurant Email Mockup PDF
This slide showcases KPIs that can be tracked by restaurant for measuring effectiveness of email marketing campaign. It also showcases A or B testing for optimizing bad performing emails.Do you have an important presentation coming up Are you looking for something that will make your presentation stand out from the rest Look no further than Digital Marketing Plan For Restaurant Business Analyze And Optimize The Restaurant Email Mockup PDF. With our professional designs, you can trust that your presentation will pop and make delivering it a smooth process. And with Slidegeeks, you can trust that your presentation will be unique and memorable. So why wait Grab Digital Marketing Plan For Restaurant Business Analyze And Optimize The Restaurant Email Mockup PDF today and make your presentation stand out from the rest.
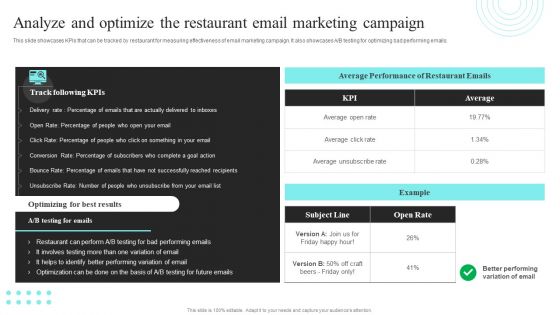
Strategic Promotional Guide For Restaurant Business Advertising Analyze And Optimize The Restaurant Email Marketing Campaign Portrait PDF
This slide showcases KPIs that can be tracked by restaurant for measuring effectiveness of email marketing campaign. It also showcases A B testing for optimizing bad performing emails. If you are looking for a format to display your unique thoughts, then the professionally designed Strategic Promotional Guide For Restaurant Business Advertising Analyze And Optimize The Restaurant Email Marketing Campaign Portrait PDF is the one for you. You can use it as a Google Slides template or a PowerPoint template. Incorporate impressive visuals, symbols, images, and other charts. Modify or reorganize the text boxes as you desire. Experiment with shade schemes and font pairings. Alter, share or cooperate with other people on your work. Download Strategic Promotional Guide For Restaurant Business Advertising Analyze And Optimize The Restaurant Email Marketing Campaign Portrait PDF and find out how to give a successful presentation. Present a perfect display to your team and make your presentation unforgettable.
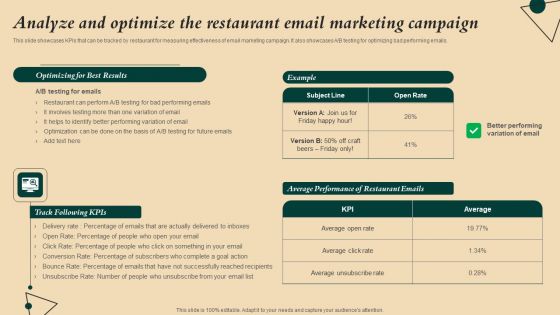
Coffeehouse Promotion Techniques To Boost Revenue Analyze And Optimize The Restaurant Email Ideas PDF
This slide showcases KPIs that can be tracked by restaurant for measuring effectiveness of email marketing campaign. It also showcases A B testing for optimizing bad performing emails. Create an editable Coffeehouse Promotion Techniques To Boost Revenue Analyze And Optimize The Restaurant Email Ideas PDF that communicates your idea and engages your audience. Whether you are presenting a business or an educational presentation, pre-designed presentation templates help save time. Coffeehouse Promotion Techniques To Boost Revenue Analyze And Optimize The Restaurant Email Ideas PDF is highly customizable and very easy to edit, covering many different styles from creative to business presentations. Slidegeeks has creative team members who have crafted amazing templates. So, go and get them without any delay.
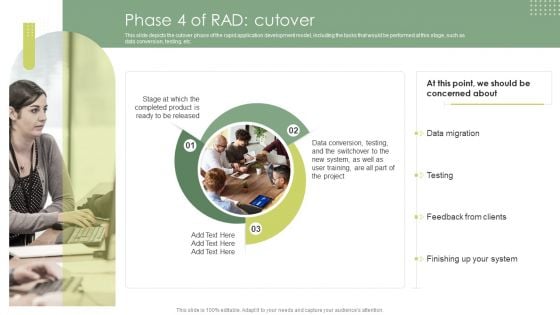
Phase 4 Of Rad Cutover Rapid Application Building RAB Model Graphics PDF
This slide depicts the cutover phase of the rapid application development model, including the tasks that would be performed at this stage, such as data conversion, testing, etc.Are you in need of a template that can accommodate all of your creative concepts This one is crafted professionally and can be altered to fit any style. Use it with Google Slides or PowerPoint. Include striking photographs, symbols, depictions, and other visuals. Fill, move around, or remove text boxes as desired. Test out color palettes and font mixtures. Edit and save your work, or work with colleagues. Download Phase 4 Of Rad Cutover Rapid Application Building RAB Model Graphics PDF and observe how to make your presentation outstanding. Give an impeccable presentation to your group and make your presentation unforgettable.
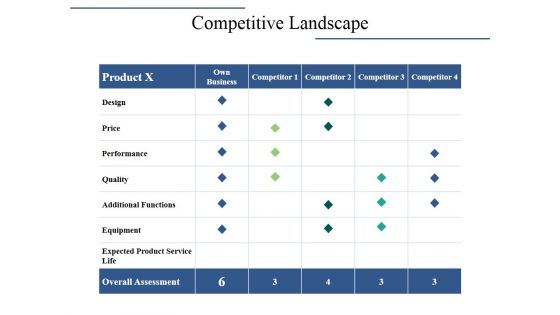
Competitive Landscape Ppt PowerPoint Presentation Infographics Visual Aids
This is a competitive landscape ppt powerpoint presentation infographics visual aids. This is a four stage process. The stages in this process are design, price, performance, quality, equipment.

Determinants Of Product Quality Ppt PowerPoint Presentation Infographic Template Files
This is a determinants of product quality ppt powerpoint presentation infographic template files. This is a seven stage process. The stages in this process are performance, reliability, durability, evaluation, safety.
Risk Categories Ppt PowerPoint Presentation Icon Mockup
This is a risk categories ppt powerpoint presentation icon mockup. This is a six stage process. The stages in this process are product performance, data accuracy, consumer service.
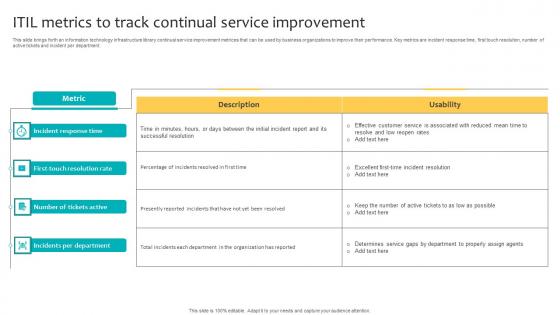
ITIL Metrics To Track Continual Service Improvement Infographics Pdf
This slide brings forth an information technology infrastructure library continual service improvement metrices that can be used by business organizations to improve their performance. Key metrics are incident response time, first touch resolution, number of active tickets and incident per department. Pitch your topic with ease and precision using this ITIL Metrics To Track Continual Service Improvement Infographics Pdf. This layout presents information on Incident Response Time, Number Of Tickets Active, Incidents Per Department. It is also available for immediate download and adjustment. So, changes can be made in the color, design, graphics or any other component to create a unique layout. This slide brings forth an information technology infrastructure library continual service improvement metrices that can be used by business organizations to improve their performance. Key metrics are incident response time, first touch resolution, number of active tickets and incident per department.
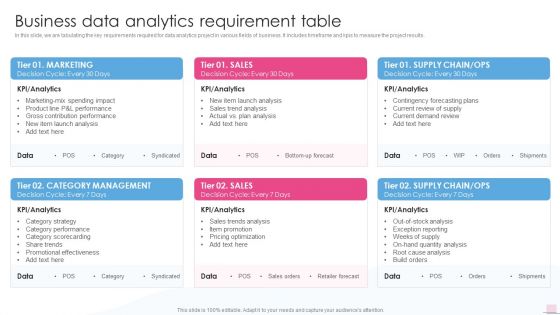
Business Data Analytics Requirement Table Business Analysis Modification Toolkit Rules PDF
This is a Business Data Analytics Requirement Table Business Analysis Modification Toolkit Rules PDF template with various stages. Focus and dispense information on six stages using this creative set, that comes with editable features. It contains large content boxes to add your information on topics like Contribution Performance, Category Performance, Category Scorecarding. You can also showcase facts, figures, and other relevant content using this PPT layout. Grab it now.

Assessment And Market Position Of Competitors Product Product Range Ppt PowerPoint Presentation Pictures Design Ideas
This is a assessment and market position of competitors product product range ppt powerpoint presentation pictures design ideas. This is a five stage process. The stages in this process are design, price, performance, quality, additional functions.
Assessment And Market Position Of Competitors Product Product Range Ppt PowerPoint Presentation Pictures Icons
This is a assessment and market position of competitors product product range ppt powerpoint presentation pictures icons. This is a four stage process. The stages in this process are design, price, performance, quality, additional functions.
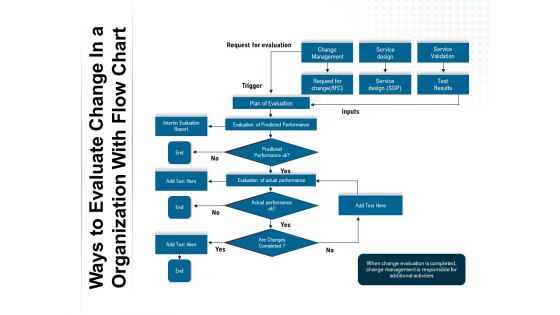
Ways To Evaluate Change In A Organization With Flow Chart Ppt PowerPoint Presentation Professional Example Introduction PDF
Presenting this set of slides with name ways to evaluate change in a organization with flow chart ppt powerpoint presentation professional example introduction pdf. This is a one stage process. The stages in this process are request for evaluation, plan of evaluation, evaluation of predicted performance, predicted performance, evaluation of actual performance, actual performance, interim evaluation report, changes completed, change management, service design, service validation. This is a completely editable PowerPoint presentation and is available for immediate download. Download now and impress your audience.
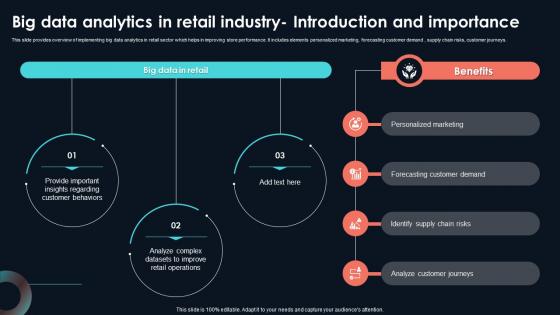
Big Data Analytics In Retail Industry Developing Strategic Insights Using Big Data Analytics SS V
This slide provides overview of implementing big data analytics in retail sector which helps in improving store performance. It includes elements personalized marketing, forecasting customer demand , supply chain risks, customer journeys. Are you in need of a template that can accommodate all of your creative concepts This one is crafted professionally and can be altered to fit any style. Use it with Google Slides or PowerPoint. Include striking photographs, symbols, depictions, and other visuals. Fill, move around, or remove text boxes as desired. Test out color palettes and font mixtures. Edit and save your work, or work with colleagues. Download Big Data Analytics In Retail Industry Developing Strategic Insights Using Big Data Analytics SS V and observe how to make your presentation outstanding. Give an impeccable presentation to your group and make your presentation unforgettable. This slide provides overview of implementing big data analytics in retail sector which helps in improving store performance. It includes elements personalized marketing, forecasting customer demand , supply chain risks, customer journeys.
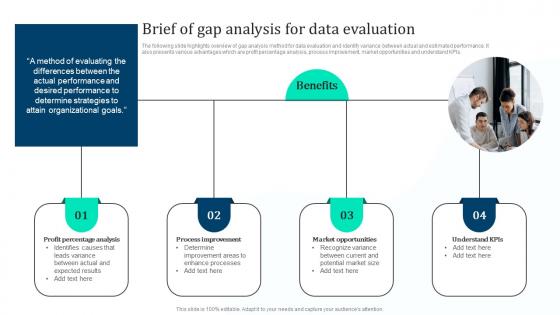
Brief Of Gap Analysis Data Marketing Intelligence Guide Data Gathering Clipart Pdf
The following slide highlights overview of gap analysis method for data evaluation and identify variance between actual and estimated performance. It also presents various advantages which are profit percentage analysis, process improvement, market opportunities and understand KPIs. Slidegeeks is one of the best resources for PowerPoint templates. You can download easily and regulate Brief Of Gap Analysis Data Marketing Intelligence Guide Data Gathering Clipart Pdf for your personal presentations from our wonderful collection. A few clicks is all it takes to discover and get the most relevant and appropriate templates. Use our Templates to add a unique zing and appeal to your presentation and meetings. All the slides are easy to edit and you can use them even for advertisement purposes. The following slide highlights overview of gap analysis method for data evaluation and identify variance between actual and estimated performance. It also presents various advantages which are profit percentage analysis, process improvement, market opportunities and understand KPIs.
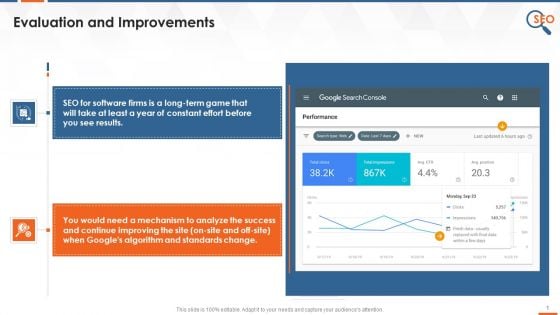
IT Company SEO Approach Regularly Update Website Training Ppt
This slide covers evaluation and improvements strategy for IT or SaaS or software companies. It also depicts that SEO for IT companies is long term and includes ways to improve the performance.
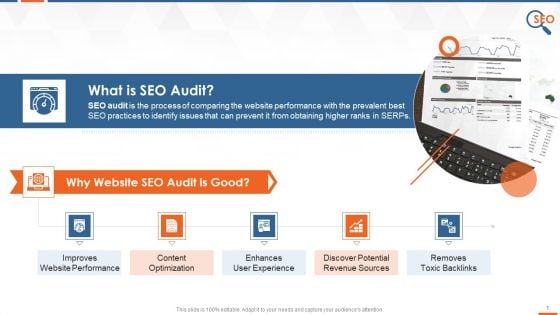
What Is SEO Audit And Its Significance Training Ppt
This slide provides information regarding the SEO audit. It also covers details of its importance in improving website performance, content optimization, enhancing user experience, discovering potential revenue sources, and removing toxic backlinks.
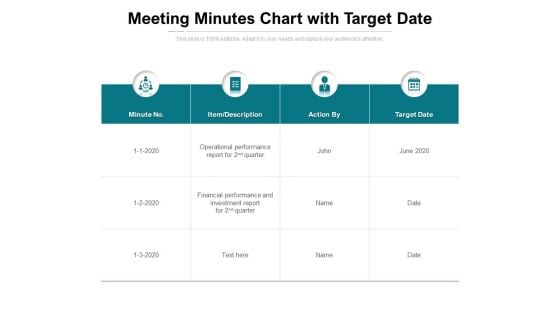
Meeting Minutes Chart With Target Date Ppt PowerPoint Presentation Portfolio
Presenting this set of slides with name meeting minutes chart with target date ppt powerpoint presentation portfolio. The topics discussed in these slides are operational performance, financial performance, investment report. This is a completely editable PowerPoint presentation and is available for immediate download. Download now and impress your audience.
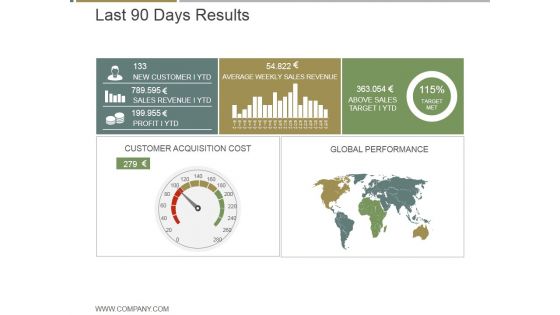
Last 90 Days Results Ppt PowerPoint Presentation Graphics
This is a last 90 days results ppt powerpoint presentation graphics. This is a five stage process. The stages in this process are new customer ytd, average weekly sales revenue, above sales target i ytd, customer acquisition cost, global performance.
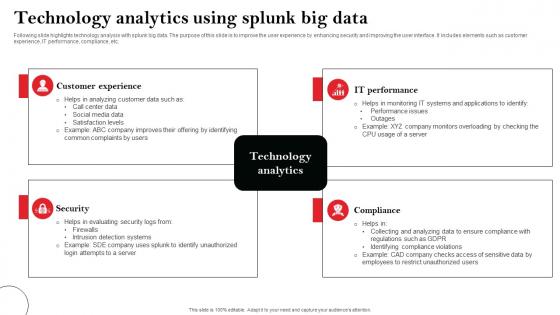
Technology Analytics Using Splunk Big Data Microsoft Pdf
Following slide highlights technology analysis with splunk big data. The purpose of this slide is to improve the user experience by enhancing security and improving the user interface. It includes elements such as customer experience, IT performance, compliance, etc. Pitch your topic with ease and precision using this Technology Analytics Using Splunk Big Data Microsoft Pdf This layout presents information on Customer Experience, Security, Compliance It is also available for immediate download and adjustment. So, changes can be made in the color, design, graphics or any other component to create a unique layout. Following slide highlights technology analysis with splunk big data. The purpose of this slide is to improve the user experience by enhancing security and improving the user interface. It includes elements such as customer experience, IT performance, compliance, etc.
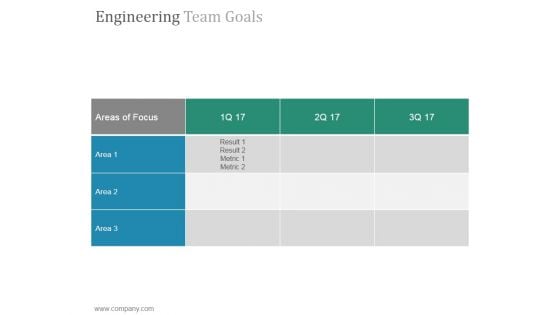
Engineering Team Goals Ppt PowerPoint Presentation Templates
This is a engineering team goals ppt powerpoint presentation templates. This is a three stage process. The stages in this process are areas of focus, tables, analysis, business, performance.
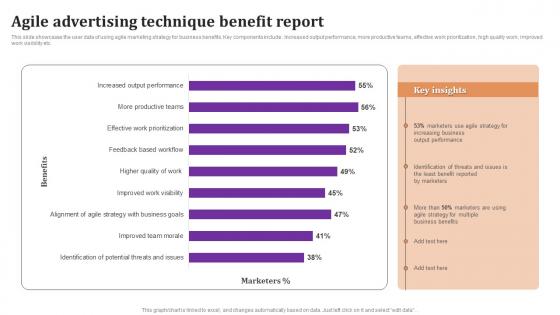
Agile Advertising Technique Benefit Report Professional Pdf
This slide showcases the user data of using agile marketing strategy for business benefits. Key components include Increased output performance, more productive teams, effective work prioritization, high quality work, improved work visibility etc. Showcasing this set of slides titled Agile Advertising Technique Benefit Report Professional Pdf The topics addressed in these templates are Agile Advertising Technique, Benefit Report All the content presented in this PPT design is completely editable. Download it and make adjustments in color, background, font etc. as per your unique business setting. This slide showcases the user data of using agile marketing strategy for business benefits. Key components include Increased output performance, more productive teams, effective work prioritization, high quality work, improved work visibility etc.
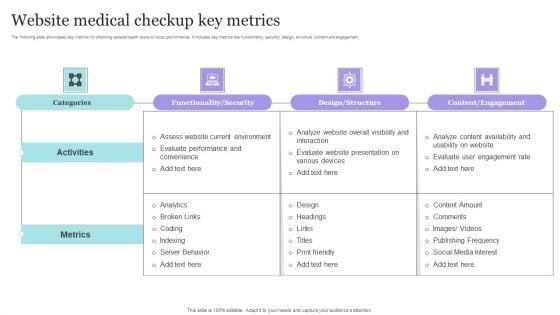
Website Medical Checkup Key Metrics Themes PDF
The following slide showcases key metrics for checking website health score to boost performance. It includes key metrics like functionality, security, design, structure, content and engagement. Pitch your topic with ease and precision using this Website Medical Checkup Key Metrics Themes PDF. This layout presents information on Evaluate Performance, Environment, Metrics. It is also available for immediate download and adjustment. So, changes can be made in the color, design, graphics or any other component to create a unique layout.
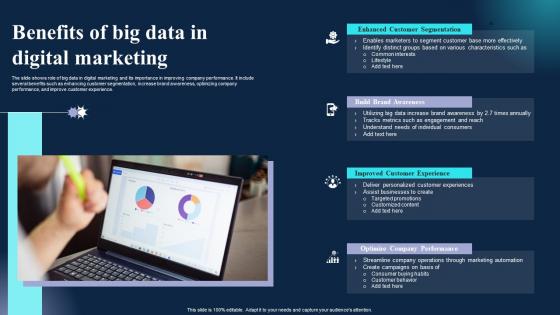
Benefits Of Big Data In Digital Marketing Template Pdf
The slide shows role of big data in digital marketing and its importance in improving company performance. It include several benefits such as enhancing customer segmentation, increase brand awareness, optimizing company performance, and improve customer experience. Showcasing this set of slides titled Benefits Of Big Data In Digital Marketing Template Pdf. The topics addressed in these templates are Customer Segmentation, Awareness, Experience. All the content presented in this PPT design is completely editable. Download it and make adjustments in color, background, font etc. as per your unique business setting. The slide shows role of big data in digital marketing and its importance in improving company performance. It include several benefits such as enhancing customer segmentation, increase brand awareness, optimizing company performance, and improve customer experience.
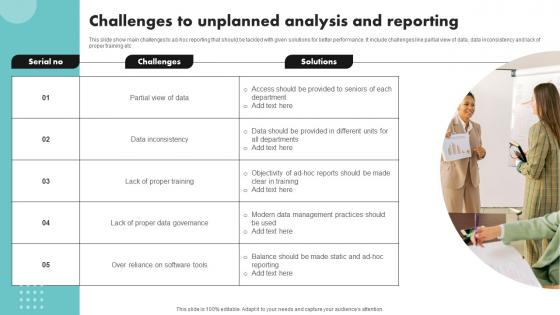
Challenges To Unplanned Analysis And Reporting Pictures Pdf
This slide show main challenges to ad-hoc reporting that should be tackled with given solutions for better performance. It include challenges like partial view of data, data inconsistency and lack of proper training etc Showcasing this set of slides titled Challenges To Unplanned Analysis And Reporting Pictures Pdf The topics addressed in these templates are Partial View Of Data, Data Inconsistency, Lack Of Proper Training All the content presented in this PPT design is completely editable. Download it and make adjustments in color, background, font etc. as per your unique business setting. This slide show main challenges to ad-hoc reporting that should be tackled with given solutions for better performance. It include challenges like partial view of data, data inconsistency and lack of proper training etc
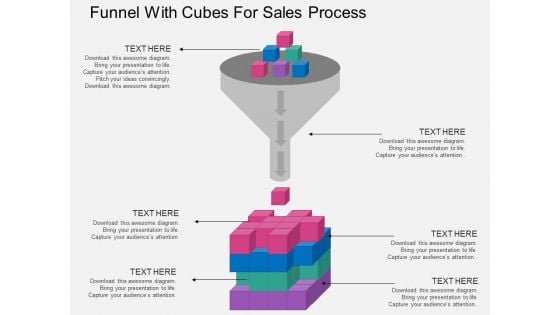
Funnel With Cubes For Sales Process Powerpoint Template
This PowerPoint template contains funnel diagram with cubes. This diagram may be used to display strategy for sales process. Earn appreciation with our slide. Your listeners will surely laud your performance.
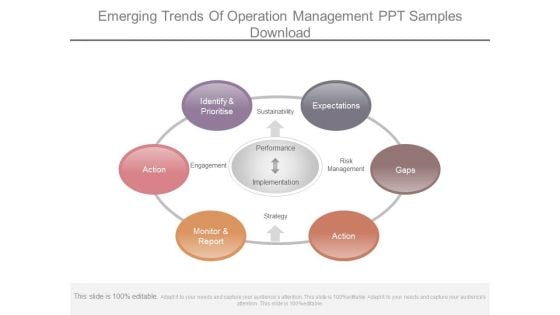
Emerging Trends Of Operation Management Ppt Samples Download
This is a emerging trends of operation management ppt samples download. This is a six stage process. The stages in this process are expectations, gaps, action, monitor and report, identify and prioritise, sustainability, engagement, risk management, strategy, performance, implementation.
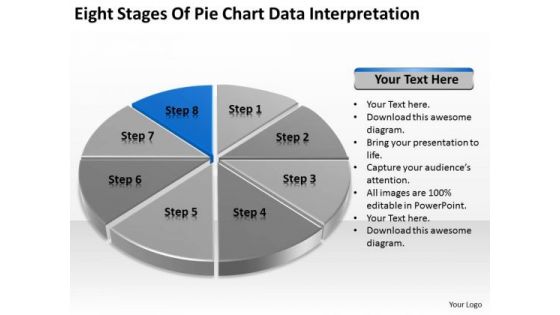
Eight Stages Of Pie Chart Data Interpretation Detailed Business Plan PowerPoint Templates
We present our eight stages of pie chart data interpretation detailed business plan PowerPoint templates.Download and present our Competition PowerPoint Templates because You can Stir your ideas in the cauldron of our PowerPoint Templates and Slides. Cast a magic spell on your audience. Download and present our Marketing PowerPoint Templates because You should Kick up a storm with our PowerPoint Templates and Slides. The heads of your listeners will swirl with your ideas. Download and present our Arrows PowerPoint Templates because Your ideas provide food for thought. Our PowerPoint Templates and Slides will help you create a dish to tickle the most discerning palate. Present our Circle Charts PowerPoint Templates because You can Stir your ideas in the cauldron of our PowerPoint Templates and Slides. Cast a magic spell on your audience. Download our Business PowerPoint Templates because You can Score a slam dunk with our PowerPoint Templates and Slides. Watch your audience hang onto your every word.Use these PowerPoint slides for presentations relating to chart, graph, pie, 3d, diagram, graphic, icon, control, business, data, profit, market, sales, display, corporate, concept, render, success, presentation, finance, report, marketing, accounting, management, piece, strategy, money, growth, company, competition, progress, account, sheet, part, information, investment, improvement, banking, index, financial, reflect, results, performance, exchange. The prominent colors used in the PowerPoint template are Blue, Black, Gray. Exult in the comfort of our Eight Stages Of Pie Chart Data Interpretation Detailed Business Plan PowerPoint Templates. Experience the convenience they deliver.

Process Safety Management Kpis Ppt Example
This is a process safety management kpis ppt example. This is a four stage process. The stages in this process are prevent major incidents, improve reliability, avoid complacency, communicate performance.
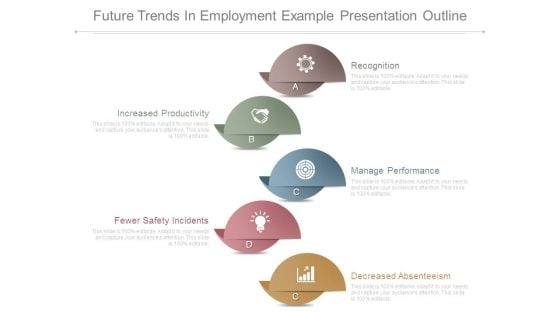
Future Trends In Employment Example Presentation Outline
This is a future trends in employment example presentation outline. This is a five stage process. The stages in this process are recognition, increased productivity, manage performance, decreased absenteeism, fewer safety incidents.
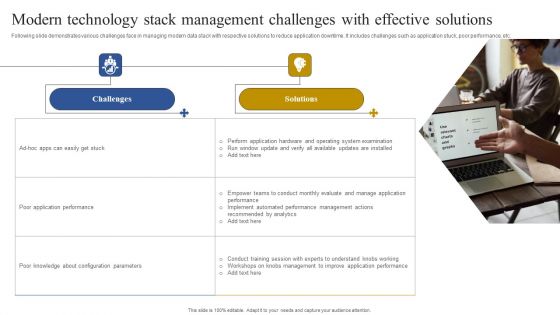
Modern Technology Stack Management Challenges With Effective Solutions Mockup PDF
Following slide demonstrates various challenges face in managing modern data stack with respective solutions to reduce application downtime. It includes challenges such as application stuck, poor performance, etc. Persuade your audience using this Modern Technology Stack Management Challenges With Effective Solutions Mockup PDF. This PPT design covers two stages, thus making it a great tool to use. It also caters to a variety of topics including Application Performance, Implement Automated Performance, Operating System Examination. Download this PPT design now to present a convincing pitch that not only emphasizes the topic but also showcases your presentation skills.
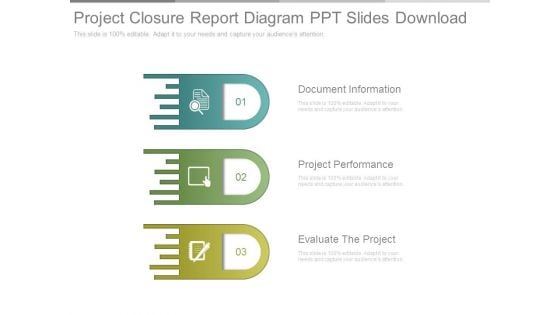
Project Closure Report Diagram Ppt Slides Download
This is a project closure report diagram ppt slides download. This is a three stage process. The stages in this process are document information, project performance, evaluate the project.
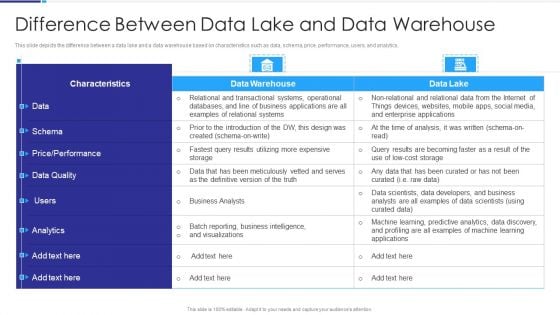
Data Lake Architecture Difference Between Data Lake And Data Warehouse Inspiration PDF
This slide depicts the difference between a data lake and a data warehouse based on characteristics such as data, schema, price, performance, users, and analytics. Deliver an awe inspiring pitch with this creative Data Lake Architecture Difference Between Data Lake And Data Warehouse Inspiration PDF bundle. Topics like Data, Price, Performance, Analytics, Data Warehouse can be discussed with this completely editable template. It is available for immediate download depending on the needs and requirements of the user.
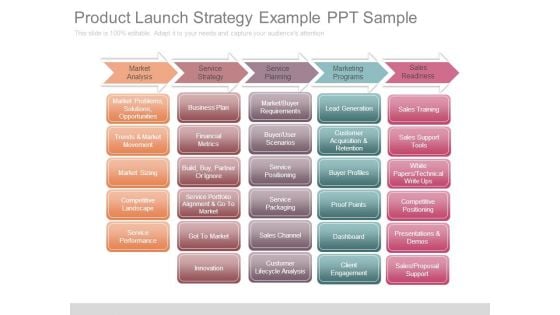
Product Launch Strategy Example Ppt Sample
This is a product launch strategy example ppt sample. This is a five stage process. The stages in this process are market analysis, service strategy, service planning, marketing programs, sales readiness, market problems solutions opportunities, trends and market movement, market sizing, competitive landscape, service performance, business plan, financial metrics, build buy partner or ignore, service portfolio alignment and go to market, got to market, innovation, market buyer requirements, buyer user scenarios, service positioning, service packaging, sales channel, customer lifecycle analysis, lead generation, customer acquisition and retention, buyer profiles, proof points, dashboard, client engagement, sales training, sales support tools, white papers technical write ups, competitive positioning, presentations and demos, sales proposal support.
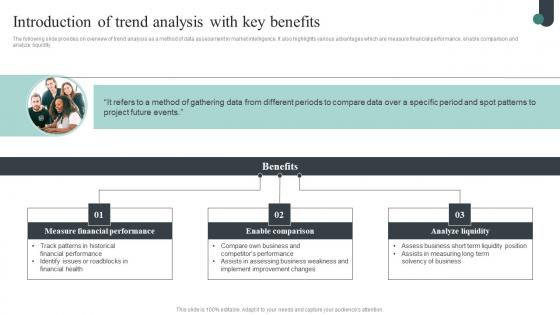
Introduction Of Trend Analysis Competitive Intelligence Guide To Determine Market Portrait Pdf
The following slide provides on overview of trend analysis as a method of data assessment in market intelligence. It also highlights various advantages which are measure financial performance, enable comparison and analyze liquidity. Do you know about Slidesgeeks Introduction Of Trend Analysis Competitive Intelligence Guide To Determine Market Portrait Pdf These are perfect for delivering any kind od presentation. Using it, create PowerPoint presentations that communicate your ideas and engage audiences. Save time and effort by using our pre-designed presentation templates that are perfect for a wide range of topic. Our vast selection of designs covers a range of styles, from creative to business, and are all highly customizable and easy to edit. Download as a PowerPoint template or use them as Google Slides themes. The following slide provides on overview of trend analysis as a method of data assessment in market intelligence. It also highlights various advantages which are measure financial performance, enable comparison and analyze liquidity.
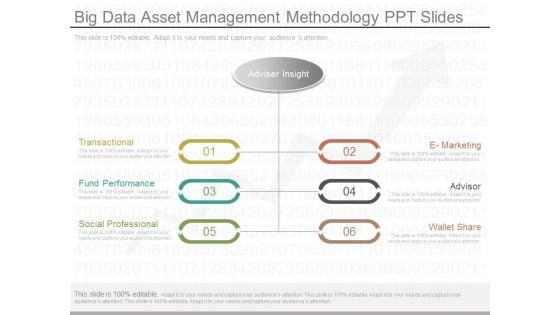
Big Data Asset Management Methodology Ppt Slides
This is a big data asset management methodology ppt slides. This is a six stage process. The stages in this process are transactional, fund performance, social professional, e marketing, advisor, wallet share, adviser insight.
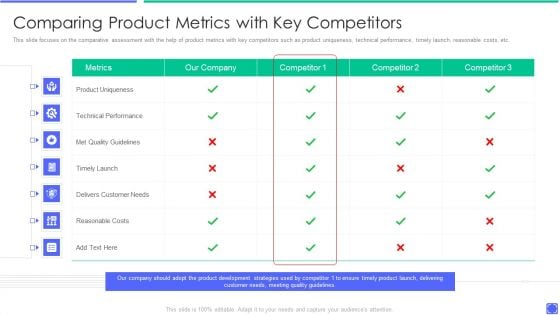
Best Techniques To Enhance New Product Management Efficiency Comparing Product Metrics Themes PDF
This slide focuses on the comparative assessment with the help of product metrics with key competitors such as product uniqueness, technical performance, timely launch, reasonable costs, etc. Deliver an awe inspiring pitch with this creative best techniques to enhance new product management efficiency comparing product metrics themes pdf bundle. Topics like product uniqueness, technical performance, delivers customer needs can be discussed with this completely editable template. It is available for immediate download depending on the needs and requirements of the user.
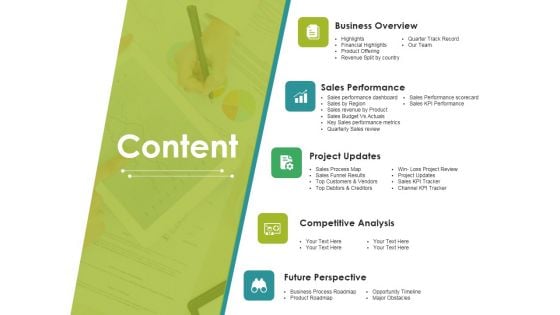
Content Ppt PowerPoint Presentation Infographics
This is a content ppt powerpoint presentation infographics. This is a five stage process. The stages in this process are business overview, sales performance, project updates, competitive analysis, future perspective.
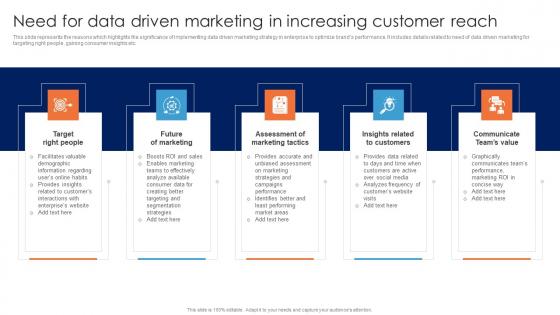
Need For Data Driven Marketing In Increasing Guide For Data Driven Advertising Pictures Pdf
This slide represents the reasons which highlights the significance of implementing data driven marketing strategy in enterprise to optimize brands performance. It includes details related to need of data driven marketing for targeting right people, gaining consumer insights etc.If your project calls for a presentation, then Slidegeeks is your go-to partner because we have professionally designed, easy-to-edit templates that are perfect for any presentation. After downloading, you can easily edit Need For Data Driven Marketing In Increasing Guide For Data Driven Advertising Pictures Pdf and make the changes accordingly. You can rearrange slides or fill them with different images. Check out all the handy templates This slide represents the reasons which highlights the significance of implementing data driven marketing strategy in enterprise to optimize brands performance. It includes details related to need of data driven marketing for targeting right people, gaining consumer insights etc.
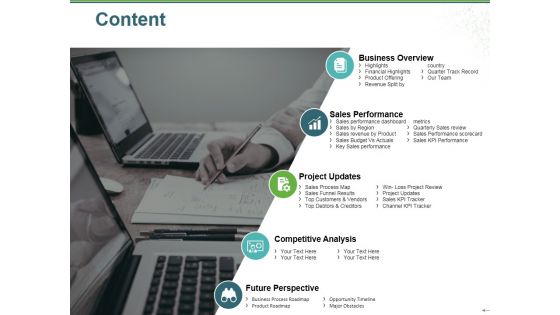
Content Ppt PowerPoint Presentation Infographic Template Objects
This is a content ppt powerpoint presentation infographic template objects. This is a five stage process. The stages in this process are business overview, sales performance, project updates, competitive analysis, future perspective.
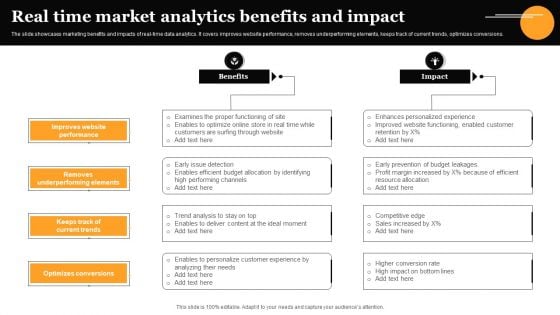
Real Time Market Analytics Benefits And Impact Infographics PDF
The slide showcases marketing benefits and impacts of real-time data analytics. It covers improves website performance, removes underperforming elements, keeps track of current trends, optimizes conversions. Presenting Real Time Market Analytics Benefits And Impact Infographics PDF to dispense important information. This template comprises four stages. It also presents valuable insights into the topics including Improves Website Performance, Removes Underperforming Elements, Optimizes Conversions. This is a completely customizable PowerPoint theme that can be put to use immediately. So, download it and address the topic impactfully.
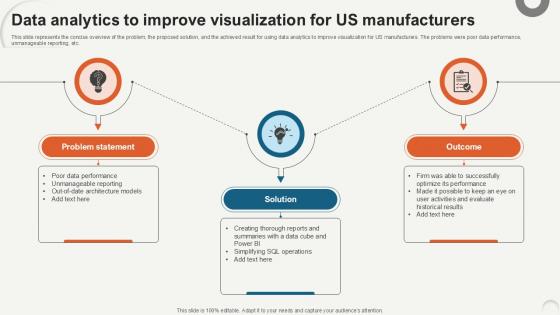
Data Analytics To Improve Visualization Data Analytics For Informed Decision Ppt PowerPoint
This slide represents the concise overview of the problem, the proposed solution, and the achieved result for using data analytics to improve visualization for US manufacturers. The problems were poor data performance, unmanageable reporting, etc. Whether you have daily or monthly meetings, a brilliant presentation is necessary. Data Analytics To Improve Visualization Data Analytics For Informed Decision Ppt PowerPoint can be your best option for delivering a presentation. Represent everything in detail using Data Analytics To Improve Visualization Data Analytics For Informed Decision Ppt PowerPoint and make yourself stand out in meetings. The template is versatile and follows a structure that will cater to your requirements. All the templates prepared by Slidegeeks are easy to download and edit. Our research experts have taken care of the corporate themes as well. So, give it a try and see the results. This slide represents the concise overview of the problem, the proposed solution, and the achieved result for using data analytics to improve visualization for US manufacturers. The problems were poor data performance, unmanageable reporting, etc.
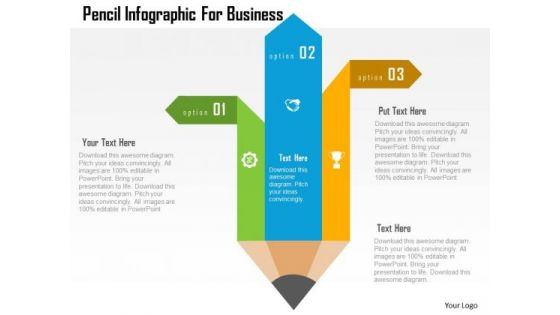
Business Diagram Pencil Infographic For Business Presentation Template
The above template contains diagram of pencil infographic. This diagram may be used to display market research information. Earn appreciation with our slide. Your listeners will surely laud your performance.
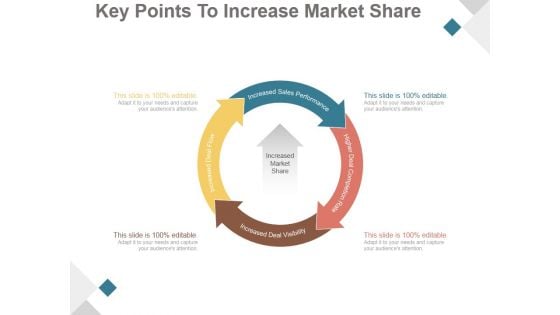
Key Points To Increase Market Share Ppt PowerPoint Presentation Infographics
This is a key points to increase market share ppt powerpoint presentation infographics. This is a four stage process. The stages in this process are increased sales performance, higher deal completion rate, increased deal visibility, increased deal flow.

Table Of Content Template 2 Ppt PowerPoint Presentation Infographics Professional
This is a table of content template 2 ppt powerpoint presentation infographics professional. This is a six stage process. The stages in this process are financial performance, client and project updates, competitors analysis, future roadmap, csr miscellaneous activities.
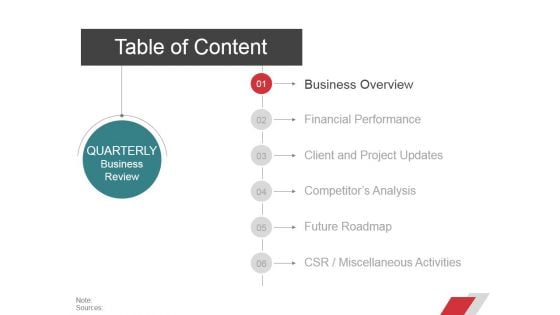
Table Of Content Template Ppt PowerPoint Presentation Infographic Template Summary
This is a table of content template ppt powerpoint presentation infographic template summary. This is a six stage process. The stages in this process are business overview, financial performance, client and project updates, competitors analysis, future roadmap.
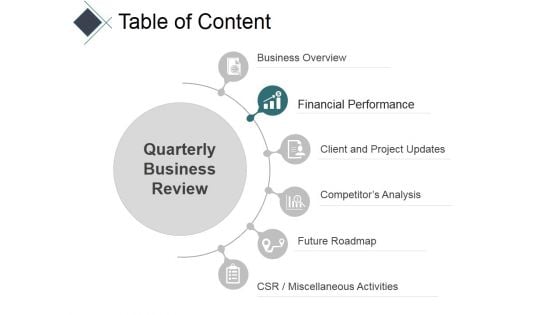
Table Of Content Template 1 Ppt PowerPoint Presentation Infographics Display
This is a table of content template 1 ppt powerpoint presentation infographics display. This is a six stage process. The stages in this process are business overview, financial performance, client and project updates, competitors analysis, future roadmap.
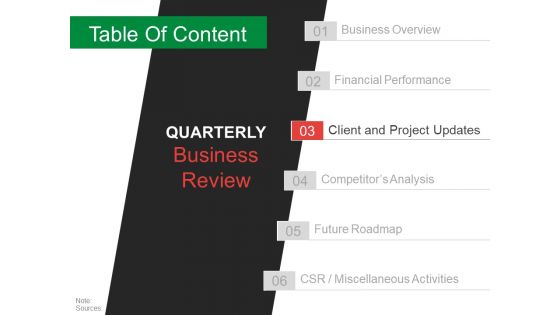
Table Of Content Template 4 Ppt PowerPoint Presentation Infographic Template
This is a table of content template 4 ppt powerpoint presentation infographic template. This is a six stage process. The stages in this process are business overview, financial performance, client and project updates, competitor s analysis, future roadmap.
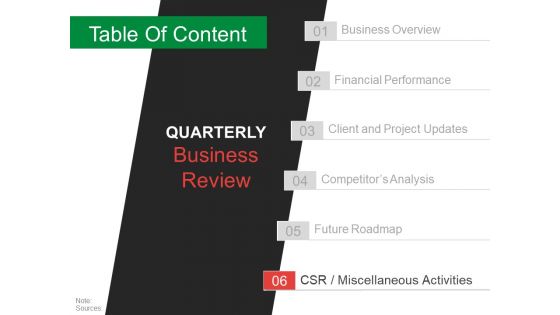
Table Of Content Template 7 Ppt PowerPoint Presentation Professional Infographics
This is a table of content template 7 ppt powerpoint presentation professional infographics. This is a six stage process. The stages in this process are business overview, financial performance, client and project updates, competitor s analysis, future roadmap.
Internal Analysis Organizational Culture Ppt PowerPoint Presentation Infographic Template Guidelines
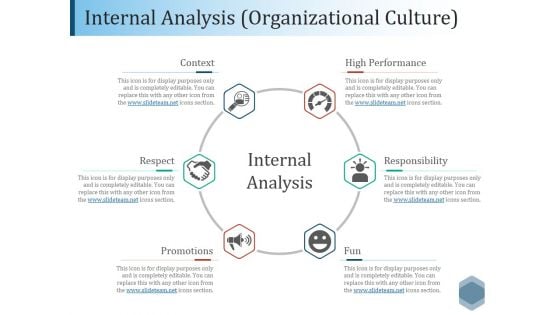
This is a internal analysis organizational culture ppt powerpoint presentation infographic template guidelines. This is a six stage process. The stages in this process are high performance, responsibility, fun, promotions, respect.

Determinants Of Product Quality Ppt PowerPoint Presentation Infographics Graphic Tips
This is a determinants of product quality ppt powerpoint presentation infographics graphic tips. This is a seven stage process. The stages in this process are performance, reliability, durability, evaluation, safety.
Determinants Of Product Quality Ppt PowerPoint Presentation Infographics Design Templates
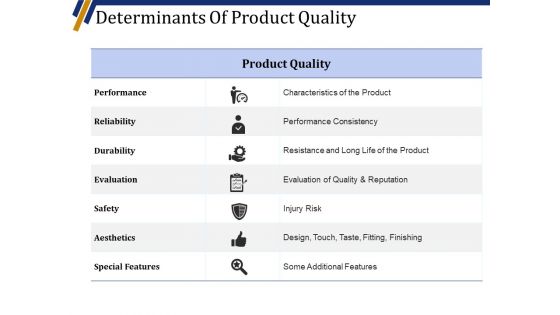
This is a determinants of product quality ppt powerpoint presentation infographics design templates. This is a seven stage process. The stages in this process are performance, reliability, durability, evaluation, safety.
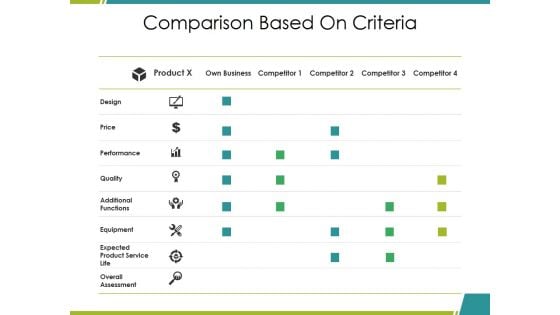
Comparison Based On Criteria Ppt PowerPoint Presentation Infographics Elements
This is a comparison based on criteria ppt powerpoint presentation infographics elements. This is a four stage process. The stages in this process are design, price, performance, product, competitor.
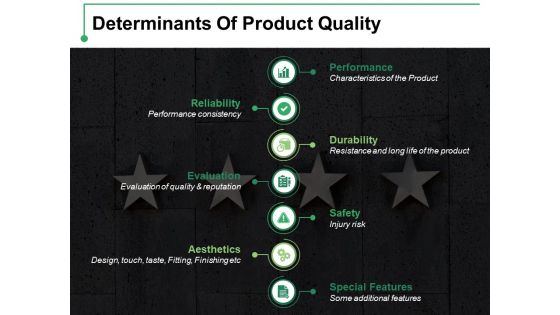
Determinants Of Product Quality Ppt PowerPoint Presentation Infographic Template Outline
This is a determinants of product quality ppt powerpoint presentation infographic template outline. This is a seven stage process. The stages in this process are performance, durability, safety, reliability, evaluation.
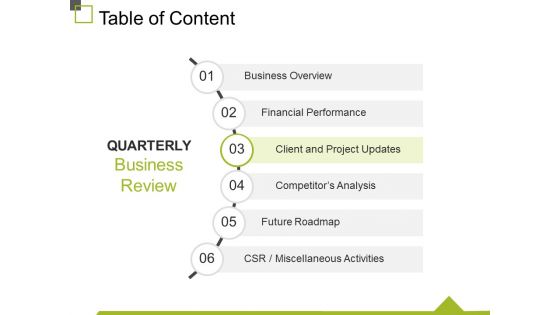
Table Of Content Template 4 Ppt PowerPoint Presentation Infographics Maker
This is a table of content template 1 ppt powerpoint presentation outline template. This is a six stage process. The stages in this process are business overview, financial performance, client and project updates, competitor s analysis, future roadmap.
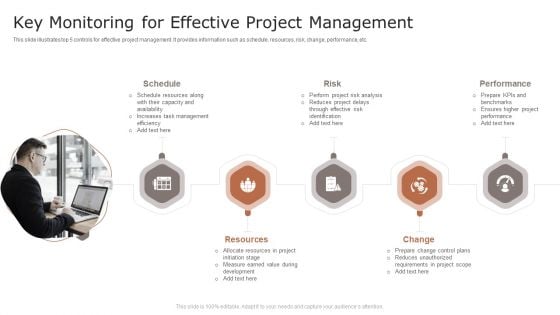
Key Monitoring For Effective Project Management Ppt Summary Infographics PDF
This slide illustrates top 5 controls for effective project management. It provides information such as schedule, resources, risk, change, performance, etc. Presenting Key Monitoring For Effective Project Management Ppt Summary Infographics PDF to dispense important information. This template comprises five stages. It also presents valuable insights into the topics including Schedule, Risk, Performance, Resources, Change. This is a completely customizable PowerPoint theme that can be put to use immediately. So, download it and address the topic impactfully.

Managing Sales Activities And Results Ppt Inspiration
This is a managing sales activities and results ppt inspiration. This is a four stage process. The stages in this process are define key metrics, manage performance, refine sales accountability system, dissect buying, selling process, science of sales management.
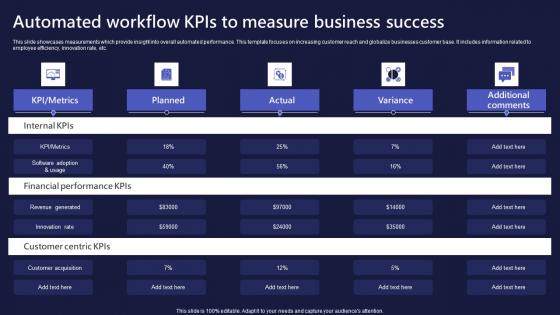
Automated Workflow Kpis To Measure Business Success Elements Pdf
This slide showcases measurements which provide insight into overall automated performance. This template focuses on increasing customer reach and globalize businesses customer base. It includes information related to employee efficiency, innovation rate, etc.Pitch your topic with ease and precision using this Automated Workflow Kpis To Measure Business Success Elements Pdf This layout presents information on Financial Performance, Customer Centric, Internal Kpis It is also available for immediate download and adjustment. So, changes can be made in the color, design, graphics or any other component to create a unique layout. This slide showcases measurements which provide insight into overall automated performance. This template focuses on increasing customer reach and globalize businesses customer base. It includes information related to employee efficiency, innovation rate, etc.
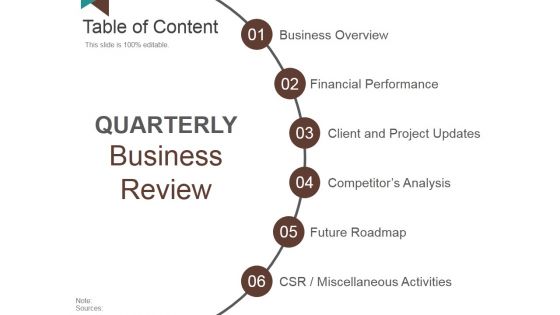
Table Of Content Template 7 Ppt PowerPoint Presentation Infographic Template Gridlines
This is a table of content template 7 ppt powerpoint presentation infographic template gridlines. This is a six stage process. The stages in this process are financial performance, client and project updates, competitors analysis, future roadmap, csr miscellaneous activities.
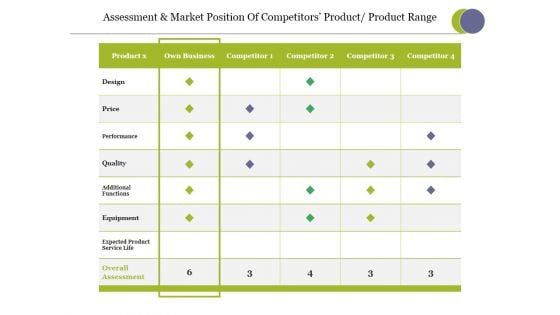
Assessment And Market Position Of Competitors Product Product Range Ppt PowerPoint Presentation Infographic Template Summary
This is a assessment and market position of competitors product product range ppt powerpoint presentation infographic template summary. This is a four stage process. The stages in this process are design, price, performance, quality, additional functions, equipment.
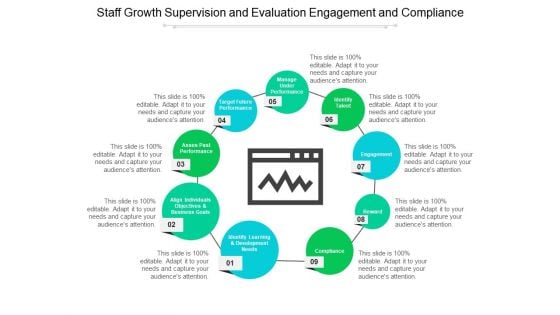
Staff Growth Supervision And Evaluation Engagement And Compliance Ppt PowerPoint Presentation Infographic Template Background Image
This is a staff growth supervision and evaluation engagement and compliance ppt powerpoint presentation infographic template background image. This is a nine stage process. The stages in this process are employee engagement, employee performance, employee evaluation.


 Continue with Email

 Home
Home


