Performance Icon
Global Product Rationalization Diagram Presentation Ideas
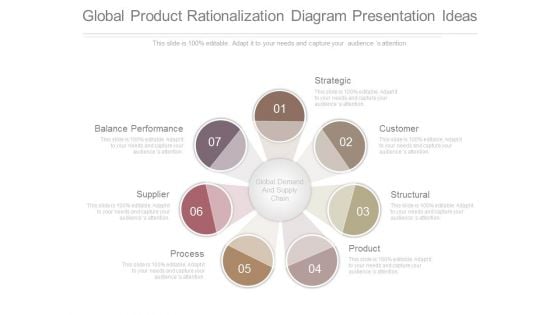
This is a global product rationalization diagram presentation ideas. This is a seven stage process. The stages in this process are strategic, customer, structural, product, process, supplier, balance performance, global demand and supply chain.
Corporate Planning Cycle Sample Diagram Powerpoint Slides
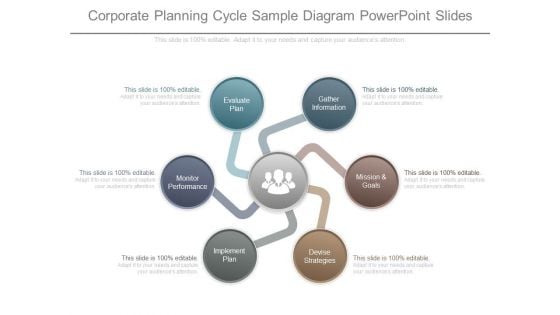
This is a corporate planning cycle sample diagram powerpoint slides. This is a six stage process. The stages in this process are gather information, mission and goals, devise strategies, implement plan, monitor performance, evaluate plan.
Business Intelligence In Entrepreneurship Ppt Presentation Diagrams
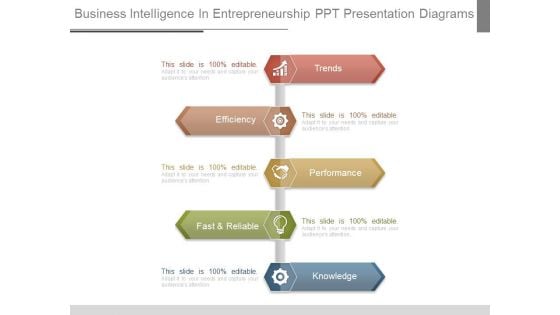
This is a business intelligence in entrepreneurship ppt presentation diagrams. This is a five stage process. The stages in this process are trends, efficiency, performance, fast and reliable, knowledge.
Wealth Management Techniques Sample Diagram Slides
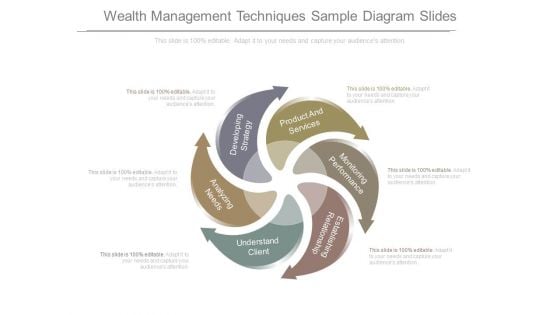
This is a wealth management techniques sample diagram slides. This is a six stage process. The stages in this process are developing strategy, product and services, monitoring performance, analyzing needs, establishing relationship, understand client.
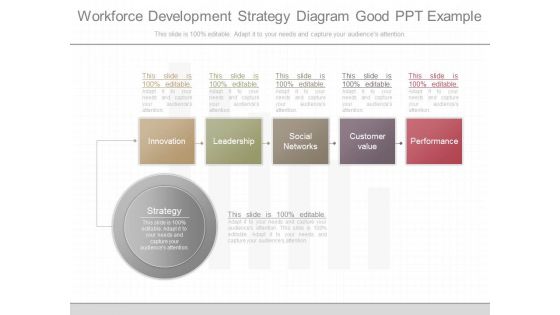
Workforce Development Strategy Diagram Good Ppt Example
This is a workforce development strategy diagram good ppt example. This is a six stage process. The stages in this process are innovation, leadership, social networks, customer value, performance, strategy.
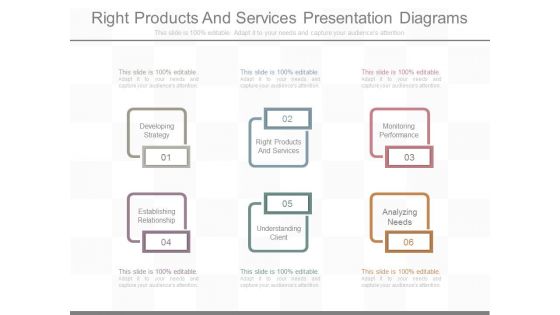
Right Products And Services Presentation Diagrams
This is a right products and services presentation diagrams. This is a six stage process. The stages in this process are developing strategy, right products and services, monitoring performance, establishing relationship, understanding client, analyzing needs.
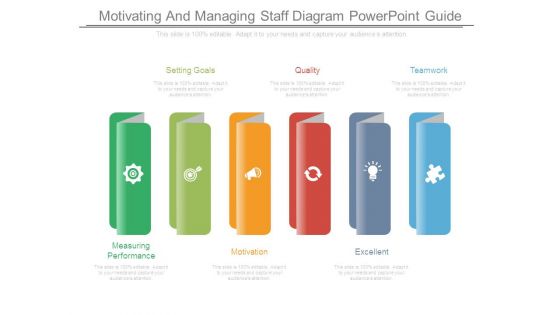
Motivating And Managing Staff Diagram Powerpoint Guide
This is a motivating and managing staff diagram powerpoint guide. This is a six stage process. The stages in this process are setting goals, quality, teamwork, measuring performance, motivation, excellent.
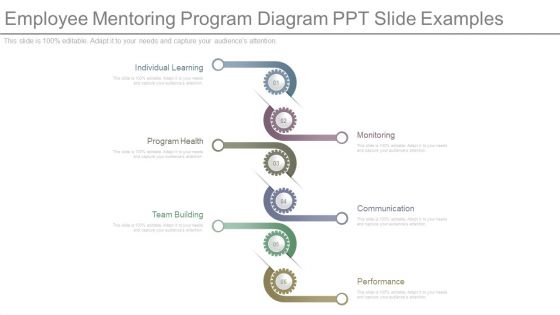
Employee Mentoring Program Diagram Ppt Slide Examples
This is a employee mentoring program diagram ppt slide examples. This is a six stage process. The stages in this process are individual learning, program health, team building, monitoring, communication, performance.
Swot Analysis Ppt Diagram Powerpoint Slides Rules
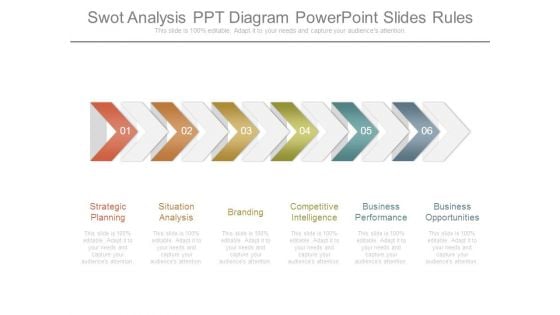
This is a swot analysis ppt diagram powerpoint slides rules. This is a six stage process. The stages in this process are strategic planning, situation analysis, branding, competitive intelligence, business performance, business opportunities.
Business Management Consulting Services Diagram Powerpoint Slide
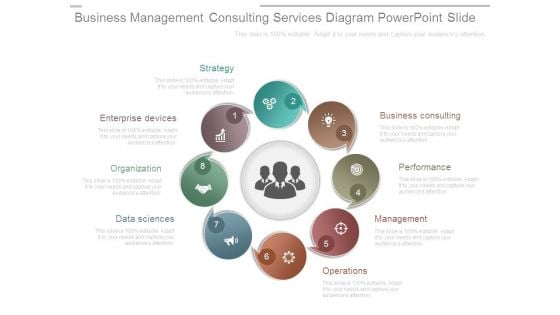
This is a business management consulting services diagram powerpoint slide. This is a eight stage process. The stages in this process are strategy, business consulting, performance, management, operations, data sciences, organization, enterprise devices.
Annual Planning Calendar Diagram Powerpoint Guide
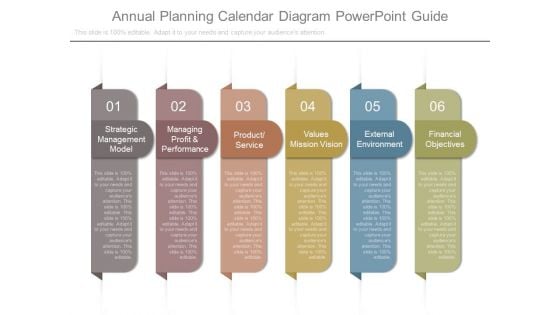
This is a annual planning calendar diagram powerpoint guide. This is a six stage process. The stages in this process are strategic management model, managing profit and performance, product service, values mission vision, external environment, financial objectives.
Financial Asset Management Diagram Ppt Example
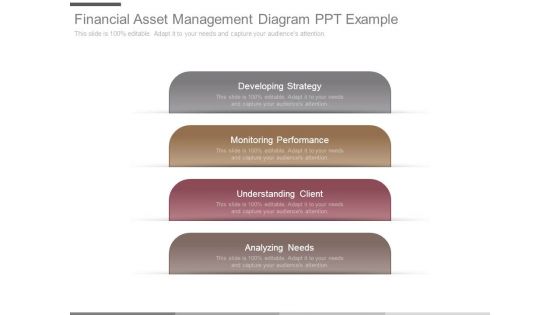
This is a financial asset management diagram ppt example. This is a four stage process. The stages in this process are developing strategy, monitoring performance, understanding client, analyzing needs.
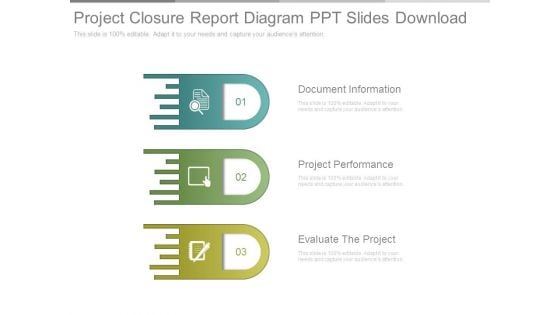
Project Closure Report Diagram Ppt Slides Download
This is a project closure report diagram ppt slides download. This is a three stage process. The stages in this process are document information, project performance, evaluate the project.
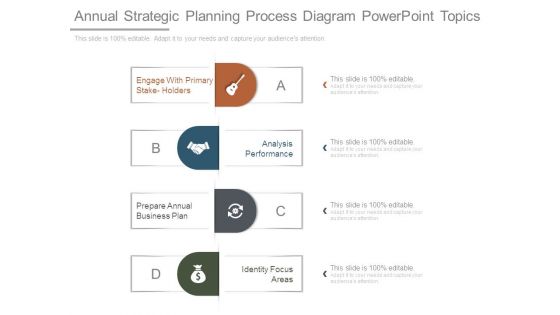
Annual Strategic Planning Process Diagram Powerpoint Topics
This is a annual strategic planning process diagram powerpoint topics. This is a four stage process. The stages in this process are engage with primary stake holders, analysis performance, prepare annual business plan, identity focus areas.
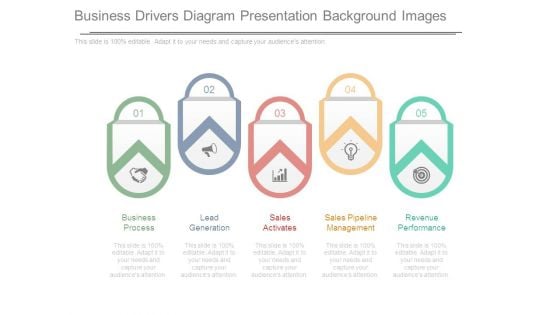
Business Drivers Diagram Presentation Background Images
This is a business drivers diagram presentation background images. This is a five stage process. The stages in this process are business process, lead generation, sales activates, sales pipeline management, revenue performance.
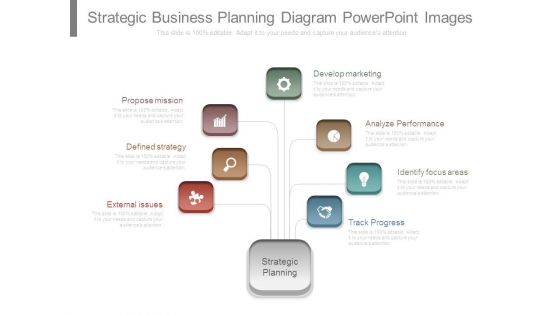
Strategic Business Planning Diagram Powerpoint Images
This is a strategic business planning diagram powerpoint images. This is a seven stage process. The stages in this process are propose mission, defined strategy, external issues, develop marketing, analyze performance, identify focus areas, track progress, strategic planning.
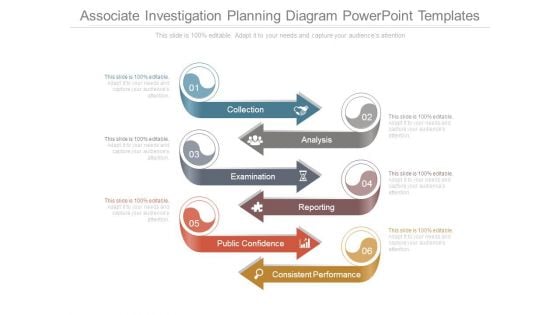
Associate Investigation Planning Diagram Powerpoint Templates
This is a associate investigation planning diagram powerpoint templates. This is a six stage process. The stages in this process are collection, analysis, examination, reporting, public confidence, consistent performance.
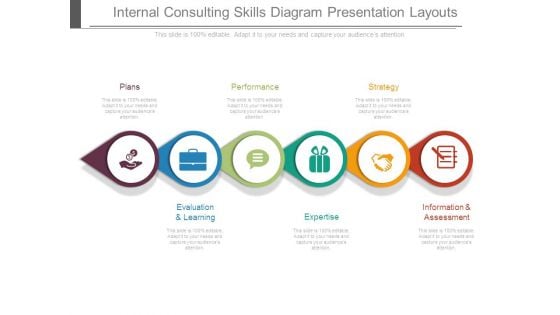
Internal Consulting Skills Diagram Presentation Layouts
This is a internal consulting skills diagram presentation layouts. This is a six stage process. The stages in this process are plans, performance, strategy, evaluation and learning, expertise, information and assessment.
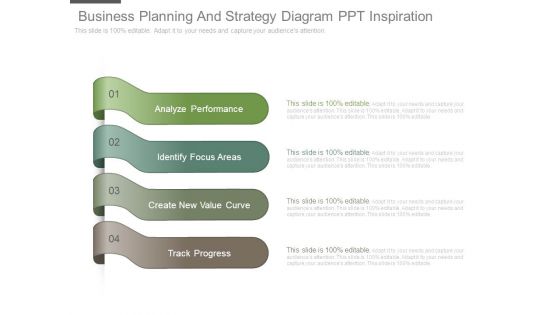
Business Planning And Strategy Diagram Ppt Inspiration
This is a business planning and strategy diagram ppt inspiration. This is a four stage process. The stages in this process are analyze performance, identify focus areas, create new value curve, track progress.
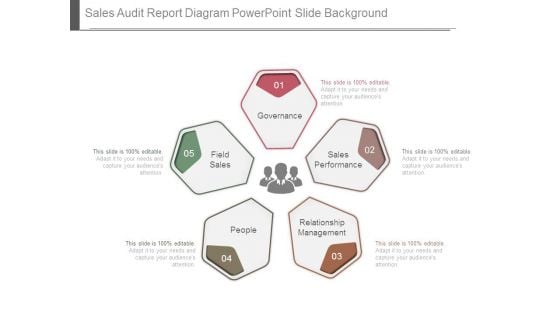
Sales Audit Report Diagram Powerpoint Slide Background
This is a sales audit report diagram powerpoint slide background. This is a five stage process. The stages in this process are field sales, people, relationship management, sales performance, governance.
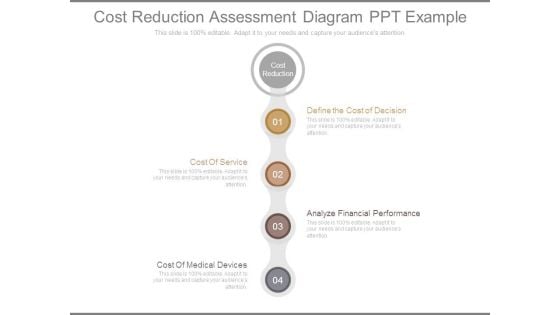
Cost Reduction Assessment Diagram Ppt Example
This is a cost reduction assessment diagram ppt example. This is a four stage process. The stages in this process are define the cost of decision, cost of service, analyze financial performance, cost of medical devices.
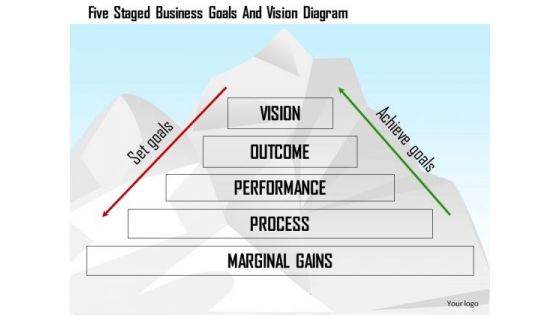
Business Diagram Five Staged Business Goals And Vision Diagram Presentation Template
This slide depicts diagram for set goals and achieve goals. It contains stages of vision, outcome. Performance, process and marginal gains. It will make your presentation look professional and keep your audience mesmerized.
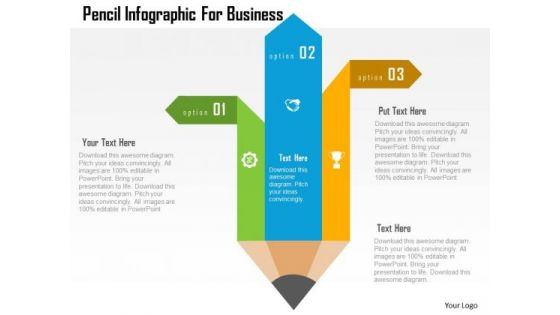
Business Diagram Pencil Infographic For Business Presentation Template
The above template contains diagram of pencil infographic. This diagram may be used to display market research information. Earn appreciation with our slide. Your listeners will surely laud your performance.
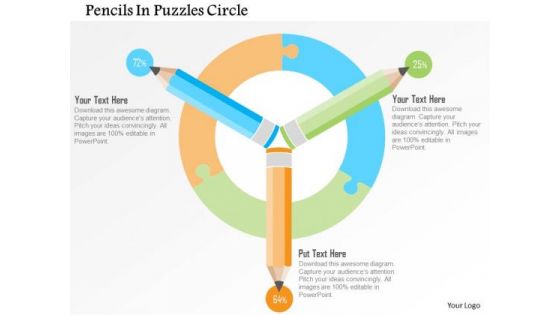
Business Diagram Pencils In Puzzles Circle Presentation Template
The above template contains diagram of pencil infographic. This diagram may be used to display market research information. Earn appreciation with our slide. Your listeners will surely laud your performance.
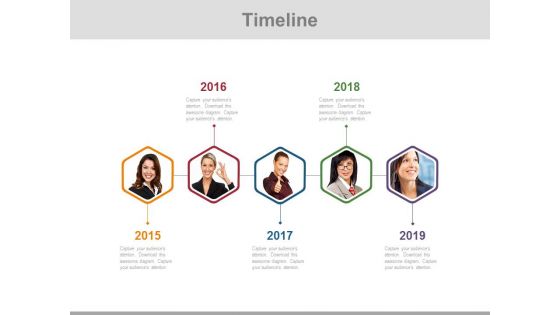
Linear Timeline Diagram With Employee Pictures Powerpoint Slides
This PowerPoint timeline slide design can be used to display year wise employee?s performance. It contain timeline diagram with employee pictures. This timeline template can be used in presentations where you need to display business strategy and planning.
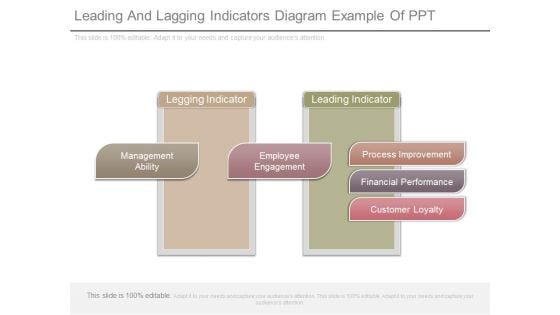
Leading And Lagging Indicators Diagram Example Of Ppt
This is a leading and lagging indicators diagram example of ppt. This is a two stage process. The stages in this process are legging indicator, management ability, employee engagement, leading indicator, process improvement, financial performance, customer loyalty.
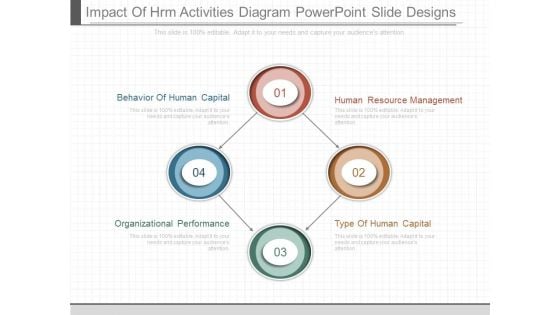
Impact Of Hrm Activities Diagram Powerpoint Slide Designs
This is a impact of hrm activities diagram powerpoint slide designs. This is a four stage process. The stages in this process are human resource management, type of human capital, organizational performance, behavior of human capital.
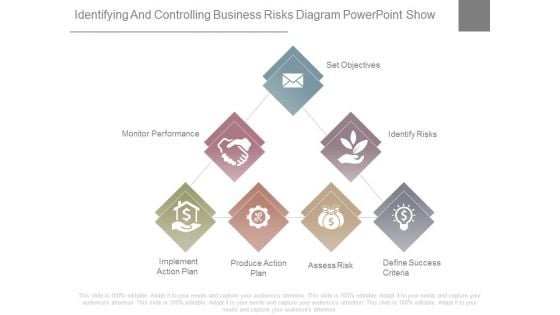
Identifying And Controlling Business Risks Diagram Powerpoint Show
This is a identifying and controlling business risks diagram powerpoint show. This is a seven stage process. The stages in this process are monitor performance, set objectives, identify risks, implement action plan, produce action plan, assess risk, define success criteria.
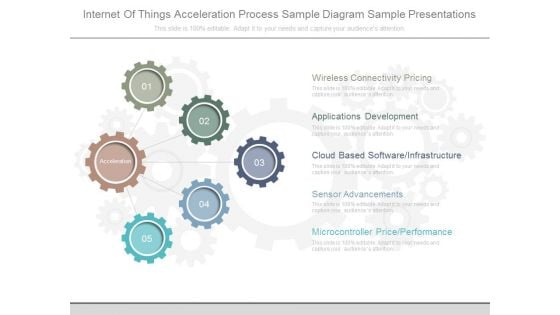
Internet Of Things Acceleration Process Sample Diagram Sample Presentations
This is a internet of things acceleration process sample diagram sample presentations. This is a five stage process. The stages in this process are wireless connectivity pricing, applications development, cloud based software infrastructure, sensor advancements, microcontroller price performance, acceleration.
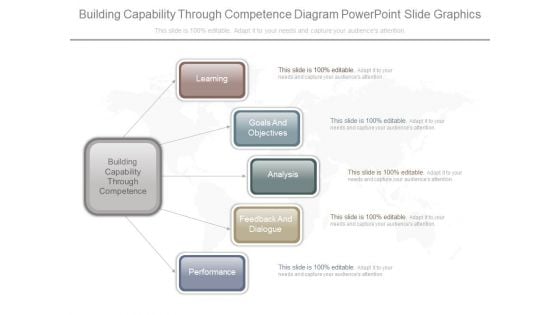
Building Capability Through Competence Diagram Powerpoint Slide Graphics
This is a building capability through competence diagram powerpoint slide graphics. This is a five stage process. The stages in this process are building capability through competence, learning, goals and, objectives, analysis, feedback and, dialogue, performance.
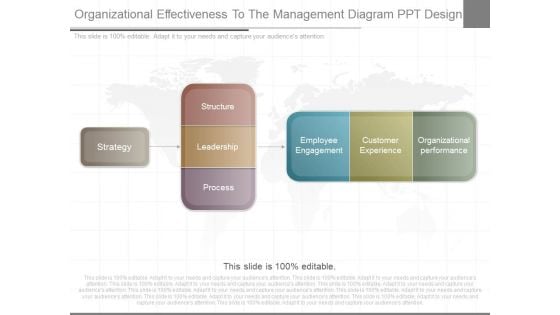
Organizational Effectiveness To The Management Diagram Ppt Design
This is a organizational effectiveness to the management diagram ppt design. This is a three stage process. The stages in this process are strategy, structure, leadership, process, employee engagement, customer experience, organizational performance.

Process Of Cro Analysis Sample Diagram Powerpoint Image
This is a process of cro analysis sample diagram powerpoint image. This is a four stage process. The stages in this process are review performance, development and testing, research and analysis, design variations.
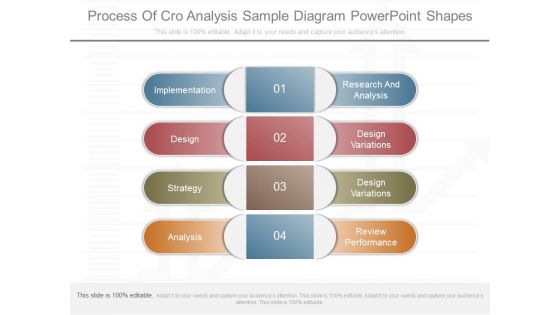
Process Of Cro Analysis Sample Diagram Powerpoint Shapes
This is a process of cro analysis sample diagram powerpoint shapes. This is a four stage process. The stages in this process are implementation, design, strategy, analysis, research and analysis, design variations, design variations, review performance.

Elements Of Business Control Process Diagram Powerpoint Layout
This is a elements of business control process diagram powerpoint layout. This is a four stage process. The stages in this process are the control process, communication result, monitor and record performance, corrective action, fix the standards.
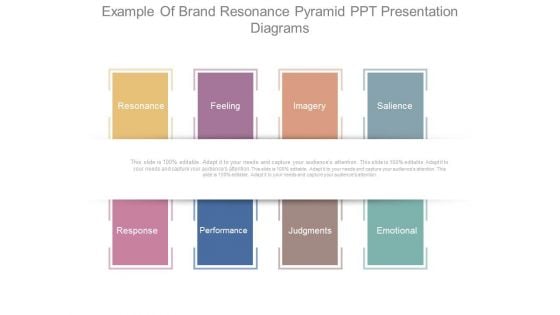
Example Of Brand Resonance Pyramid Ppt Presentation Diagrams
This is a example of brand resonance pyramid ppt presentation diagrams. This is a eight stage process. The stages in this process are resonance, feeling, imagery, salience, response, performance, judgments, emotional.
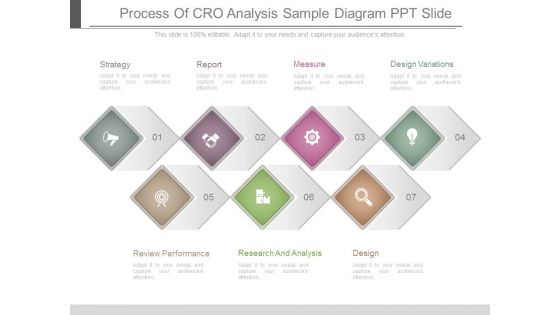
Process Of Cro Analysis Sample Diagram Ppt Slide
This is a process of cro analysis sample diagram ppt slide. This is a seven stage process. The stages in this process are strategy, report, measure, design variations, design, research and analysis, review performance.
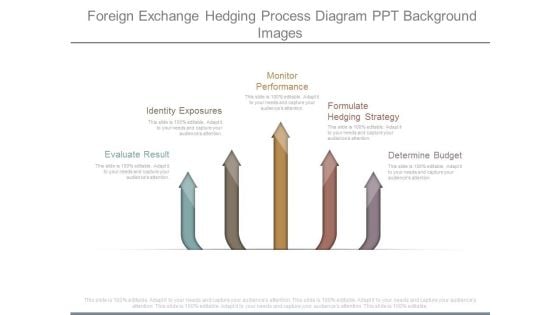
Foreign Exchange Hedging Process Diagram Ppt Background Images
This is a foreign exchange hedging process diagram ppt background images. This is a five stage process. The stages in this process are evaluate result, identity exposures, monitor performance, formulate hedging strategy, determine budget.

Example Of Optimized Investment Sample Diagram Powerpoint Graphics
This is a example of optimized investment sample diagram powerpoint graphics. This is a eight stage process. The stages in this process are customer, performance, profit, capital protection, leverage, yield enhancement, sales, brand growth.
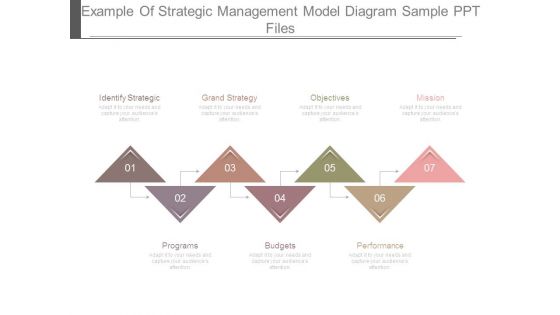
Example Of Strategic Management Model Diagram Sample Ppt Files
This is a example of strategic management model diagram sample ppt files. This is a seven stage process. The stages in this process are identify strategic, grand strategy, objectives, mission, programs, budgets, performance.
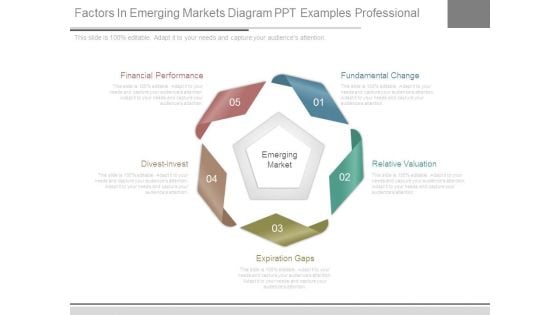
Factors In Emerging Markets Diagram Ppt Examples Professional
This is a factors in emerging markets diagram ppt examples professional. This is a five stage process. The stages in this process are financial performance, fundamental change, relative valuation, expiration gaps, divest invest, emerging market.
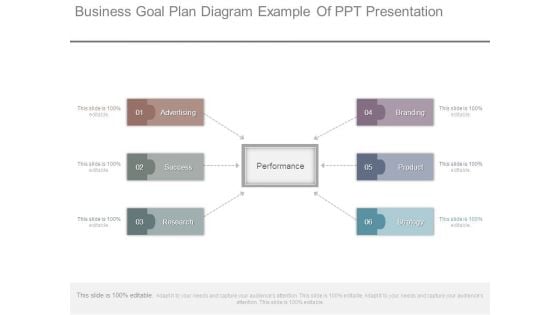
Business Goal Plan Diagram Example Of Ppt Presentation
This is a business goal plan diagram example of ppt presentation. This is a six stage process. The stages in this process are advertising, success, research, branding, product, strategy, performance.
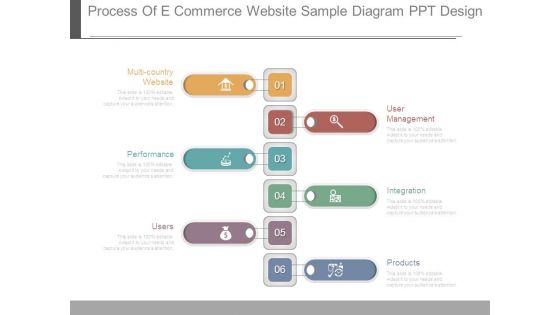
Process Of E Commerce Website Sample Diagram Ppt Design
This is a process of e commerce website sample diagram ppt design. This is a six stage process. The stages in this process are multi country website, performance, users, user management, integration, products.
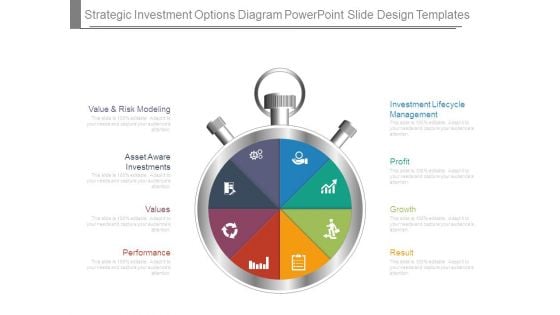
Strategic Investment Options Diagram Powerpoint Slide Design Templates
This is a strategic investment options diagram powerpoint slide design templates. This is a eight stage process. The stages in this process are value and risk modeling, asset aware investments, values, performance, investment lifecycle management, profit, growth, result.
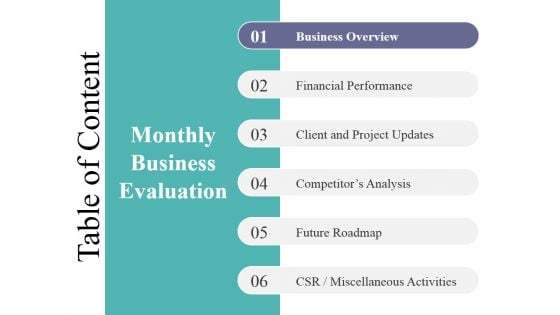
Table Of Content Template 2 Ppt PowerPoint Presentation Model Diagrams
This is a table of content template 2 ppt powerpoint presentation model diagrams. This is a six stage process. The stages in this process are business overview, financial performance, client and project updates, competitors analysis, future roadmap, csr miscellaneous activities.

Honey Bee Collecting Pollen Nature PowerPoint Themes And PowerPoint Slides 0211
Microsoft PowerPoint Theme and Slide with bee collecting honey on yellow flower Exult in the happiness of your performance. Convey your emotions through our Honey Bee Collecting Pollen Nature PowerPoint Themes And PowerPoint Slides 0211.
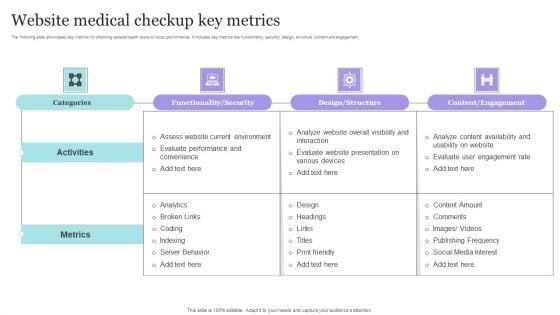
Website Medical Checkup Key Metrics Themes PDF
The following slide showcases key metrics for checking website health score to boost performance. It includes key metrics like functionality, security, design, structure, content and engagement. Pitch your topic with ease and precision using this Website Medical Checkup Key Metrics Themes PDF. This layout presents information on Evaluate Performance, Environment, Metrics. It is also available for immediate download and adjustment. So, changes can be made in the color, design, graphics or any other component to create a unique layout.
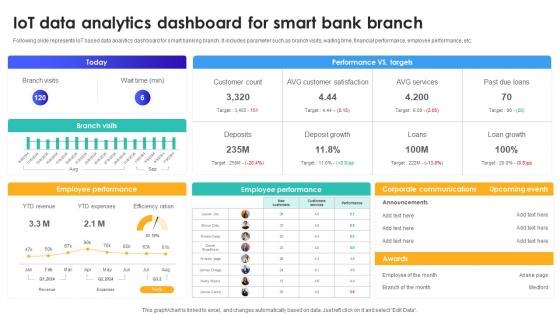
IoT Data Analytics Dashboard For Smart Bank Branch IoT In Banking For Digital Future IoT SS V
Following slide represents IoT based data analytics dashboard for smart banking branch. It includes parameter such as branch visits, waiting time, financial performance, employee performance, etc. Do you have an important presentation coming up Are you looking for something that will make your presentation stand out from the rest Look no further than IoT Data Analytics Dashboard For Smart Bank Branch IoT In Banking For Digital Future IoT SS V. With our professional designs, you can trust that your presentation will pop and make delivering it a smooth process. And with Slidegeeks, you can trust that your presentation will be unique and memorable. So why wait Grab IoT Data Analytics Dashboard For Smart Bank Branch IoT In Banking For Digital Future IoT SS V today and make your presentation stand out from the rest Following slide represents IoT based data analytics dashboard for smart banking branch. It includes parameter such as branch visits, waiting time, financial performance, employee performance, etc.
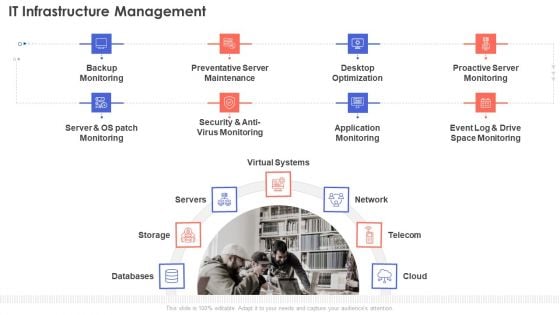
IT Infrastructure Management Diagrams PDF
This slide covers the store category wherein focus will be on performance, availability, service level compliance and event data.Presenting IT Infrastructure Management Diagrams PDF to provide visual cues and insights. Share and navigate important information on four stages that need your due attention. This template can be used to pitch topics like Performance, Level Compliance, Availability Response. In addtion, this PPT design contains high resolution images, graphics, etc, that are easily editable and available for immediate download.
Types Of Reinforcement Learning Negative Reinforcement Role Of Reinforcement Diagrams Pdf
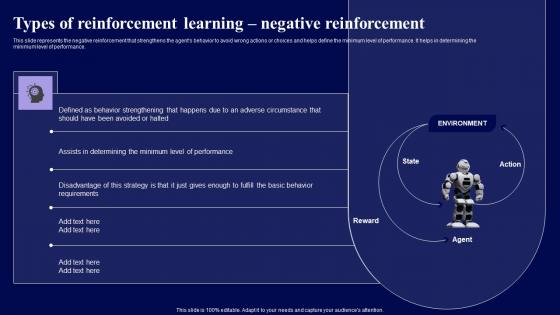
This slide represents the negative reinforcement that strengthens the agents behavior to avoid wrong actions or choices and helps define the minimum level of performance. It helps in determining the minimum level of performance. There are so many reasons you need a Types Of Reinforcement Learning Negative Reinforcement Role Of Reinforcement Diagrams Pdf The first reason is you can not spend time making everything from scratch, Thus, Slidegeeks has made presentation templates for you too. You can easily download these templates from our website easily. This slide represents the negative reinforcement that strengthens the agents behavior to avoid wrong actions or choices and helps define the minimum level of performance. It helps in determining the minimum level of performance.
Key Elements To Develop Effective Strategic Reporting Diagrams PDF
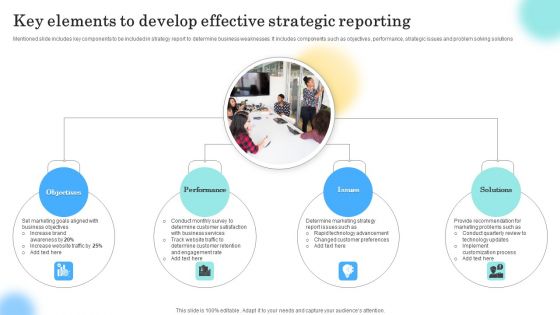
Mentioned slide includes key components to be included in strategy report to determine business weaknesses. It includes components such as objectives, performance, strategic issues and problem solving solutions Presenting Key Elements To Develop Effective Strategic Reporting Diagrams PDF to dispense important information. This template comprises four stages. It also presents valuable insights into the topics including Objectives, Performance, Issues . This is a completely customizable PowerPoint theme that can be put to use immediately. So, download it and address the topic impactfully.

Example Of Brand Resonance Model Ppt Presentation Powerpoint Templates
This is a example of brand resonance model ppt presentation powerpoint templates. This is a two stage process. The stages in this process are brand resonance model, performance, feelings, imagery, salience, judgments.
Operating Model Internal Lenses Ppt PowerPoint Presentation Model Backgrounds
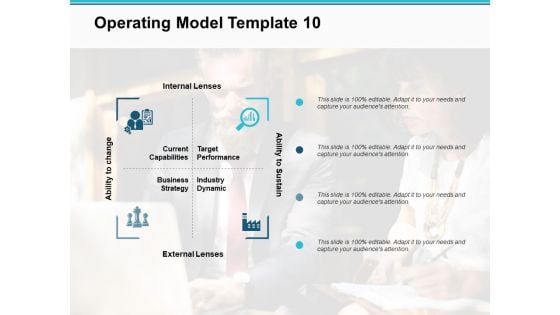
This is a operating model internal lenses ppt powerpoint presentation model backgrounds. This is a four stage process. The stages in this process are target performance, external lenses, internal lenses, business strategy, current capabilities.
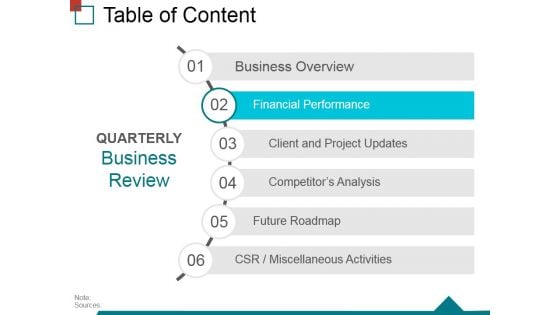
Table Of Content Template 2 Ppt PowerPoint Presentation Ideas Rules
This is a table of content template 2 ppt powerpoint presentation ideas rules. This is a six stage process. The stages in this process are business overview, financial performance, client and project updates, competitors analysis, future roadmap, csr miscellaneous activities.
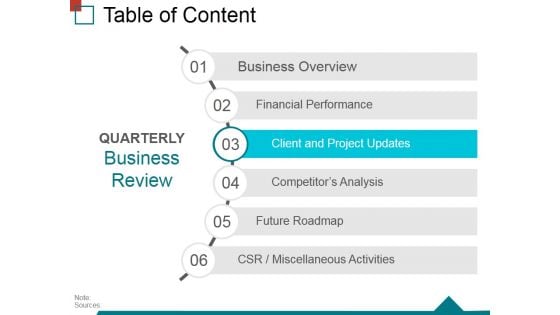
Table Of Content Template 3 Ppt PowerPoint Presentation Model Slide
This is a table of content template 3 ppt powerpoint presentation model slide. This is a six stage process. The stages in this process are business overview, financial performance, client and project updates, competitors analysis, future roadmap, csr miscellaneous activities.
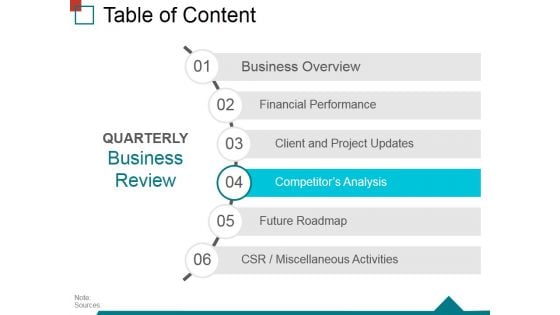
Table Of Content Template 4 Ppt PowerPoint Presentation Layouts Example
This is a table of content template 4 ppt powerpoint presentation layouts example. This is a six stage process. The stages in this process are business overview, financial performance, client and project updates, competitors analysis, future roadmap, csr miscellaneous activities.
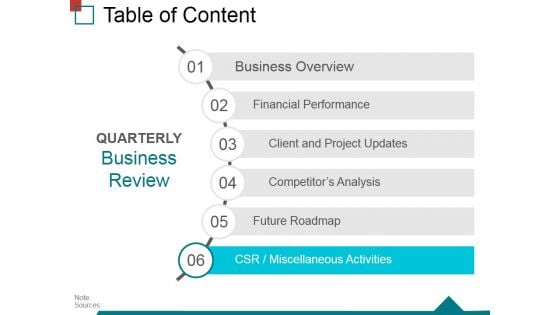
Table Of Content Template 6 Ppt PowerPoint Presentation Inspiration Grid
This is a table of content template 6 ppt powerpoint presentation inspiration grid. This is a six stage process. The stages in this process are business overview, financial performance, client and project updates, competitors analysis, future roadmap, csr miscellaneous activities.
Funnel With Cubes For Sales Process Powerpoint Template
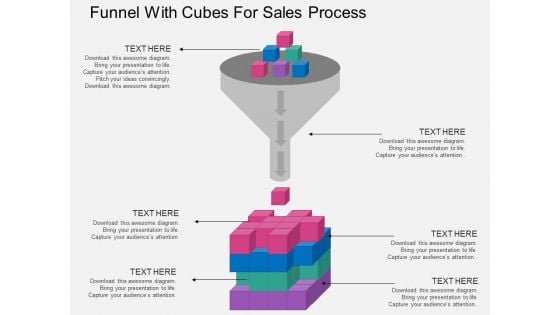
This PowerPoint template contains funnel diagram with cubes. This diagram may be used to display strategy for sales process. Earn appreciation with our slide. Your listeners will surely laud your performance.

Nature Balance And Protection Powerpoint Templates
The above template contains diagram of circles Infographic. This diagram slide may be used to display nature, balance and protection concepts. Earn appreciation with our slide and your listeners will surely laud your performance.
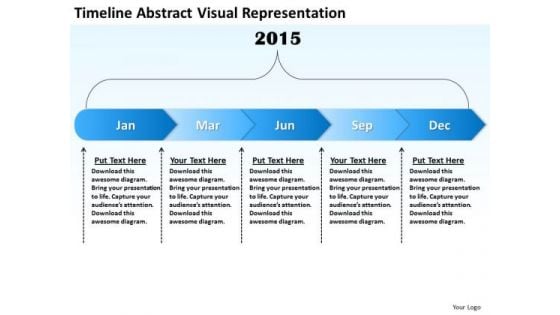
Business Process Flow Diagrams Timeline Abstract Visual Representation Ppt PowerPoint Slides
We present our business process flow diagrams timeline abstract visual representation ppt PowerPoint Slides.Use our Business PowerPoint Templates because Our PowerPoint Templates and Slides will give you great value for your money. Be assured of finding the best projection to highlight your words. Download and present our Process and Flows PowerPoint Templates because Our PowerPoint Templates and Slides will fulfill your every need. Use them and effectively satisfy the desires of your audience. Download our Shapes PowerPoint Templates because Our PowerPoint Templates and Slides help you pinpoint your timelines. Highlight the reasons for your deadlines with their use. Download our Arrows PowerPoint Templates because Our PowerPoint Templates and Slides are designed to help you succeed. They have all the ingredients you need. Use our Shapes PowerPoint Templates because Our PowerPoint Templates and Slides has conjured up a web of all you need with the help of our great team. Use them to string together your glistening ideas.Use these PowerPoint slides for presentations relating to abstract, algorithm, algorithmic, analysis, analyze, chart, cluster, clustering, connections, data, dataset, decision, depth, edge, elements, else, equal, graph, layers, level, messaging, mining,multiple, networking, nodes, objects, parent, path, pen, representation, root, route, routing, sampling, science, scientific, social, structure, subset, system, technology, traverse, visual. The prominent colors used in the PowerPoint template are Blue, Blue light, White. Be a peak performer with our Business Process Flow Diagrams Timeline Abstract Visual Representation Ppt PowerPoint Slides. They will make you look good.
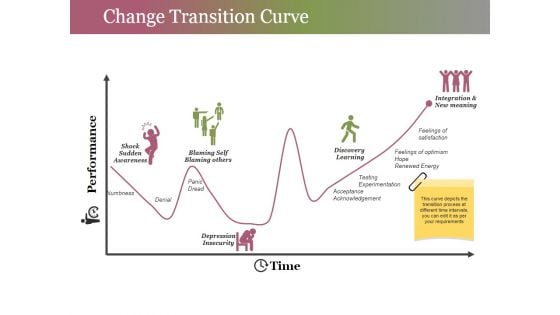
Change Transition Curve Ppt PowerPoint Presentation Gallery Graphics
This is a change transition curve ppt powerpoint presentation gallery graphics. This is a one stage process. The stages in this process are numbness, denial, panic, dread, time, performance.

 Home
Home