Performance Management System
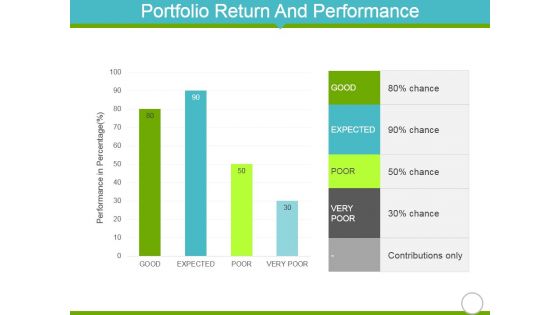
Portfolio Return And Performance Template 2 Ppt PowerPoint Presentation Summary Example
This is a portfolio return and performance template 2 ppt powerpoint presentation summary example. This is a four stage process. The stages in this process are good, expected, poor, very poor, chance.
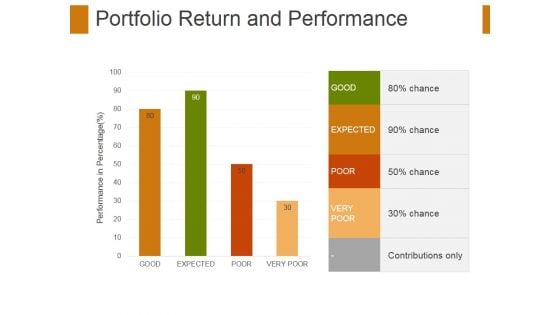
Portfolio Return And Performance Template 2 Ppt PowerPoint Presentation File Mockup
This is a portfolio return and performance template 2 ppt powerpoint presentation file mockup. This is a four stage process. The stages in this process are business, finance, marketing, strategy, analysis.
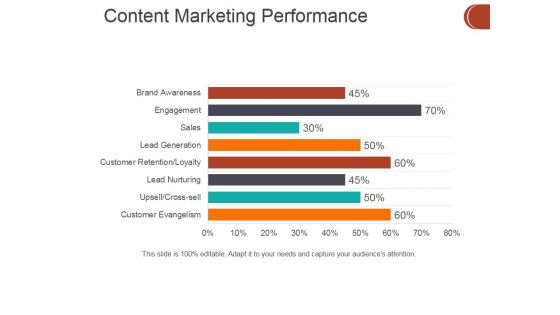
Content Marketing Performance Template 1 Ppt PowerPoint Presentation Infographic Template Brochure
This is a content marketing performance template 1 ppt powerpoint presentation infographic template brochure. This is a eight stage process. The stages in this process are business, finance, marketing, strategy, analysis.
Website Performance Review Template 2 Ppt PowerPoint Presentation Icon Master Slide
This is a website performance review template 2 ppt powerpoint presentation icon master slide. This is a three stage process. The stages in this process are cost, visits, conversion rate.
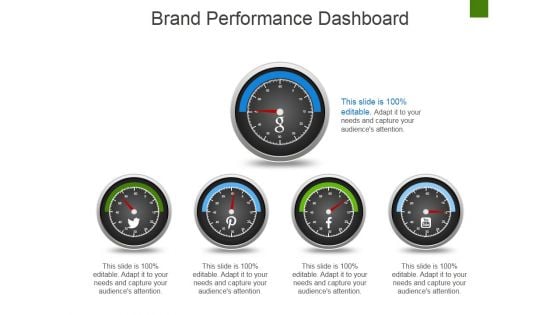
Brand Performance Dashboard Template 1 Ppt PowerPoint Presentation Infographic Template Vector
This is a brand performance dashboard template 1 ppt powerpoint presentation infographic template vector. This is a five stage process. The stages in this process are dashboard, measurement, analysis, strategy, business.
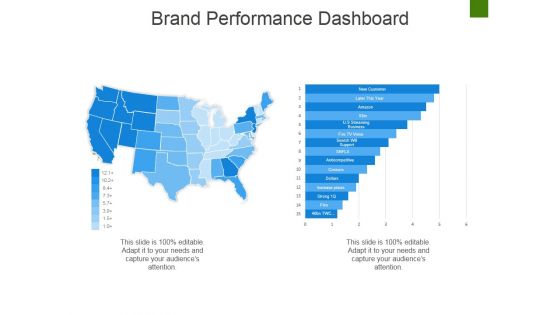
Brand Performance Dashboard Template 2 Ppt PowerPoint Presentation Show Designs Download
This is a brand performance dashboard template 2 ppt powerpoint presentation show designs download. This is a two stage process. The stages in this process are business, location, geography, information, strategy.

Customer Satisfaction And Performance Metrics Ppt PowerPoint Presentation Complete Deck With Slides
This is a customer satisfaction and performance metrics ppt powerpoint presentation complete deck with slides. This is a one stage process. The stages in this process are customer, service, marketing, planning, strategy.

Project Conclusion Report Performance Analysis Ppt PowerPoint Presentation Slides Design Templates
This is a project conclusion report performance analysis ppt powerpoint presentation slides design templates. This is a three stage process. The stages in this process are business, marketing, table, compare, analysis.
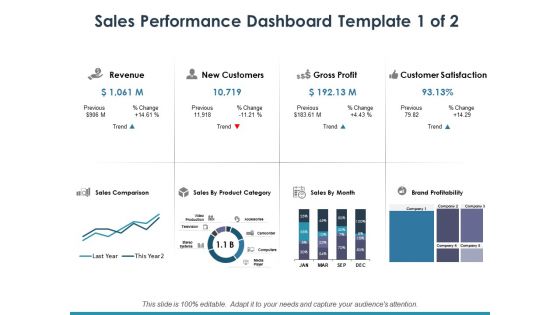
Sales Performance Dashboard Template 1 Ppt PowerPoint Presentation Infographic Template Maker
This is a sales performance dashboard template 1 ppt powerpoint presentation infographic template maker. This is a eight stage process. The stages in this process are dollar, business, finance, marketing.
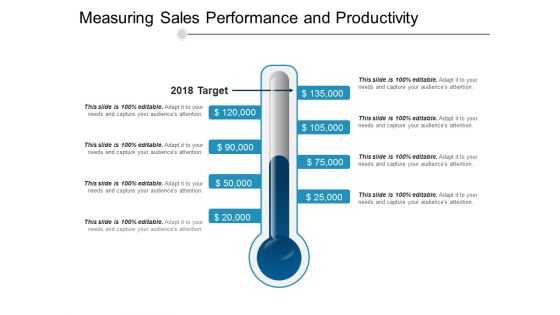
Measuring Sales Performance And Productivity Ppt PowerPoint Presentation Infographic Template Sample
This is a measuring sales performance and productivity ppt powerpoint presentation infographic template sample. This is a eight stage process. The stages in this process are sales objectives, sales goal, achieving sales target.

Reaching Business Goals Performance Indicator Ppt PowerPoint Presentation Pictures Infographic Template
This is a reaching business goals performance indicator ppt powerpoint presentation pictures infographic template. This is a one stage process. The stages in this process are sales objectives, sales goal, achieving sales target.
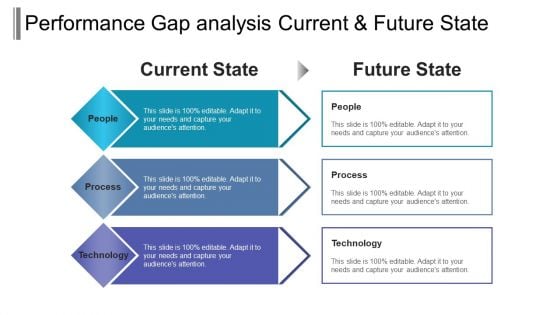
Performance Gap Analysis Current And Future State Ppt PowerPoint Presentation Layouts Slide Download
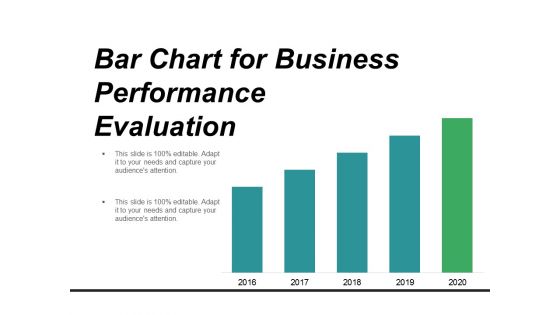
Bar Chart For Business Performance Evaluation Ppt PowerPoint Presentation Infographics Professional
This is a bar chart for business performance evaluation ppt powerpoint presentation infographics professional. This is a five stage process. The stages in this process are metrics icon, kpis icon, statistics icon.
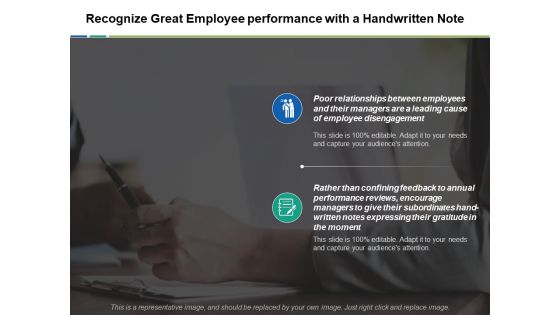
Recognize Great Employee Performance With A Handwritten Note Ppt PowerPoint Presentation Gallery Backgrounds
This is a recognize great employee performance with a handwritten note ppt powerpoint presentation gallery backgrounds. This is a two stage process. The stages in this process are recognize, encourage, innovation, planning, marketing, strategy.

Key Performance Indicator Analytics Dashboard Ppt PowerPoint Presentation Model Example Topics
This is a key performance indicator analytics dashboard ppt powerpoint presentation model example topics. This is a five stage process. The stages in this process are kpi proposal, kpi plan, kpi scheme.
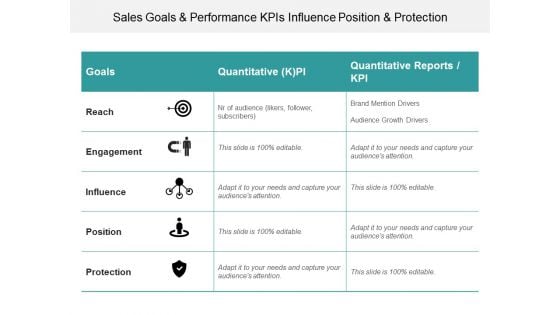
Sales Goals And Performance Kpis Influence Position And Protection Ppt PowerPoint Presentation Styles Inspiration
This is a sales goals and performance kpis influence position and protection ppt powerpoint presentation styles inspiration. This is a three stage process. The stages in this process are kpi proposal, kpi plan, kpi scheme.
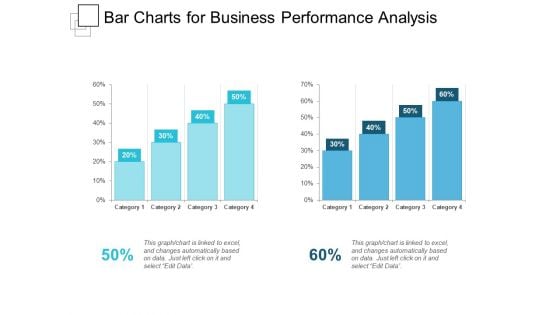
Bar Charts For Business Performance Analysis Ppt PowerPoint Presentation Show Slideshow
This is a bar charts for business performance analysis ppt powerpoint presentation show slideshow. This is a two stage process. The stages in this process are compare, comparison of two, competitive analysis.
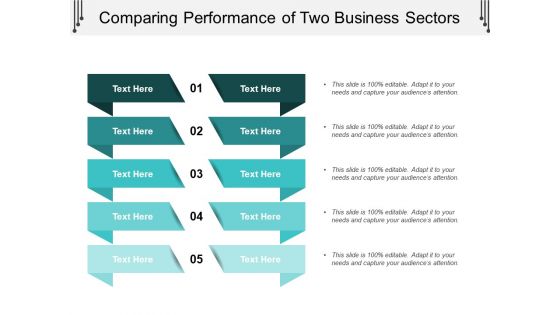
Comparing Performance Of Two Business Sectors Ppt PowerPoint Presentation Layouts Design Templates
This is a comparing performance of two business sectors ppt powerpoint presentation layouts design templates. This is a five stage process. The stages in this process are compare, comparison of two, competitive analysis.
Four Points Performance Comparison Of Two Business Sectors Ppt PowerPoint Presentation Layouts Icons
This is a four points performance comparison of two business sectors ppt powerpoint presentation layouts icons. This is a four stage process. The stages in this process are compare, comparison of two, competitive analysis.
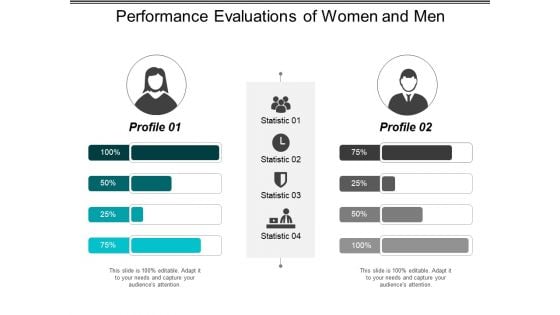
Performance Evaluations Of Women And Men Ppt PowerPoint Presentation File Design Ideas
This is a performance evaluations of women and men ppt powerpoint presentation file design ideas. This is a two stage process. The stages in this process are compare, comparison of two, competitive analysis.
Three Points Performance Comparison Of Two Business Sectors Ppt PowerPoint Presentation Icon Graphic Tips
This is a three points performance comparison of two business sectors ppt powerpoint presentation icon graphic tips. This is a three stage process. The stages in this process are compare, comparison of two, competitive analysis.
Pie Chart For Measuring Marketing Performance Ppt PowerPoint Presentation Icon Format
This is a pie chart for measuring marketing performance ppt powerpoint presentation icon format. This is a eight stage process. The stages in this process are b2b marketing strategy, b2b marketing plan, b2b marketing approach.
Financial Performance Report Vector Icon Ppt Powerpoint Presentation Pictures Background Image
This is a financial performance report vector icon ppt powerpoint presentation pictures background image. This is a four stage process. The stages in this process are financial statements icon, accounting ratio icon, balance sheet icon.
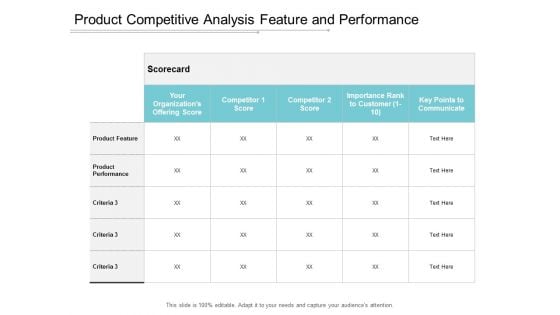
Product Competitive Analysis Feature And Performance Ppt Powerpoint Presentation Show Graphics Design
This is a product competitive analysis feature and performance ppt powerpoint presentation show graphics design. This is a five stage process. The stages in this process are competitive analysis, product differentiation, product competition.
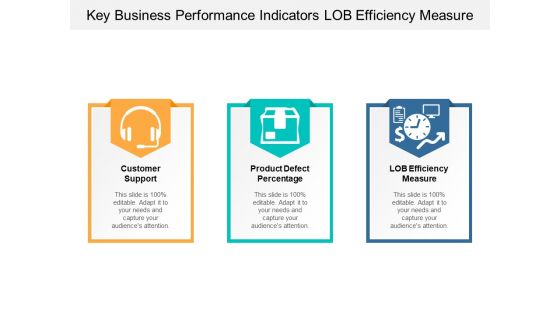
Key Business Performance Indicators Lob Efficiency Measure Ppt Powerpoint Presentation Infographics File Formats
This is a key business performance indicators lob efficiency measure ppt powerpoint presentation infographics file formats. This is a three stage process. The stages in this process are dashboard, kpi, metrics.
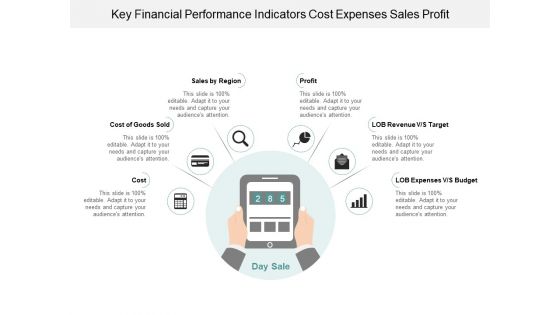
Key Financial Performance Indicators Cost Expenses Sales Profit Ppt Powerpoint Presentation Infographic Template Graphic Images
This is a key financial performance indicators cost expenses sales profit ppt powerpoint presentation infographic template graphic images. This is a six stage process. The stages in this process are dashboard, kpi, metrics.
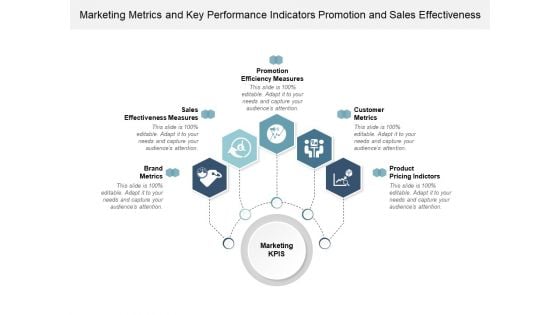
Marketing Metrics And Key Performance Indicators Promotion And Sales Effectiveness Ppt Powerpoint Presentation Infographics Graphics Example
This is a marketing metrics and key performance indicators promotion and sales effectiveness ppt powerpoint presentation infographics graphics example. This is a five stage process. The stages in this process are dashboard, kpi, metrics.
Performance Indicators Of Business Icons Ppt Powerpoint Presentation Infographics Graphics Template
This is a performance indicators of business icons ppt powerpoint presentation infographics graphics template. This is a four stage process. The stages in this process are dashboard, kpi, metrics.
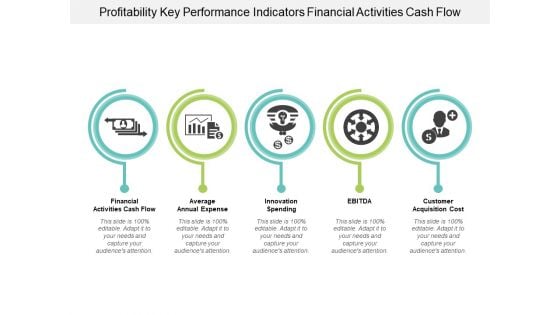
Profitability Key Performance Indicators Financial Activities Cash Flow Ppt Powerpoint Presentation Portfolio Clipart Images
This is a profitability key performance indicators financial activities cash flow ppt powerpoint presentation portfolio clipart images. This is a five stage process. The stages in this process are dashboard, kpi, metrics.
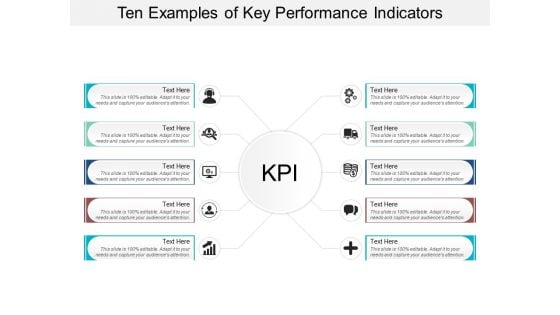
Ten Examples Of Key Performance Indicators Ppt Powerpoint Presentation Layouts Professional
This is a ten examples of key performance indicators ppt powerpoint presentation layouts professional. This is a ten stage process. The stages in this process are dashboard, kpi, metrics.
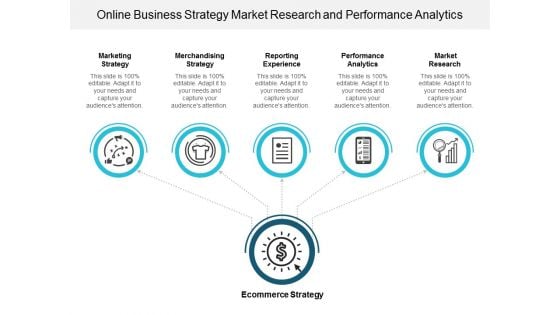
Online Business Strategy Market Research And Performance Analytics Ppt Powerpoint Presentation Infographics Images
This is a online business strategy market research and performance analytics ppt powerpoint presentation infographics images. This is a five stage process. The stages in this process are ecommerce, mercantilism, commercialism.
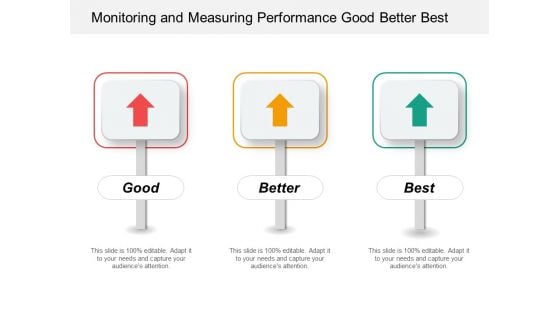
Monitoring And Measuring Performance Good Better Best Ppt Powerpoint Presentation Gallery Graphics
This is a monitoring and measuring performance good better best ppt powerpoint presentation gallery graphics. This is a three stage process. The stages in this process are good better best, good great superb, good great excellent.
Performance Tracking Good Better Best With Icons Ppt Powerpoint Presentation Show Graphics
This is a performance tracking good better best with icons ppt powerpoint presentation show graphics. This is a three stage process. The stages in this process are good better best, good great superb, good great excellent.
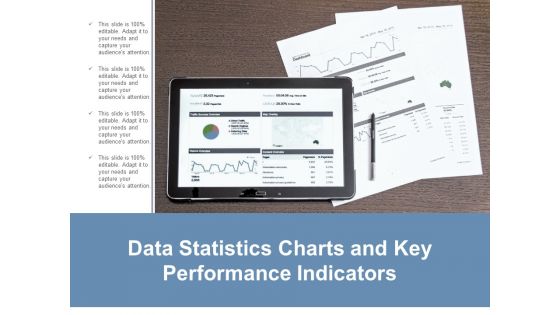
Data Statistics Charts And Key Performance Indicators Ppt Powerpoint Presentation Layouts Guide
This is a data statistics charts and key performance indicators ppt powerpoint presentation layouts guide. This is a four stage process. The stages in this process are business metrics, business kpi, business dashboard.
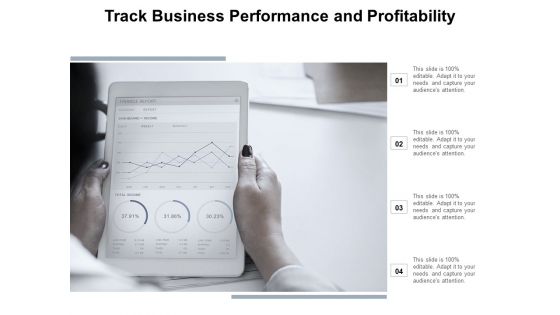
Track Business Performance And Profitability Ppt Powerpoint Presentation File Master Slide
This is a track business performance and profitability ppt powerpoint presentation file master slide. This is a four stage process. The stages in this process are business metrics, business kpi, business dashboard.
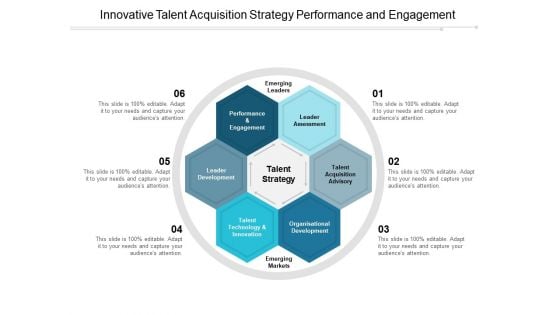
Innovative Talent Acquisition Strategy Performance And Engagement Ppt PowerPoint Presentation Slides Background
This is a innovative talent acquisition strategy performance and engagement ppt powerpoint presentation slides background. This is a six stage process. The stages in this process are talent strategy, talent plan, talent approach.
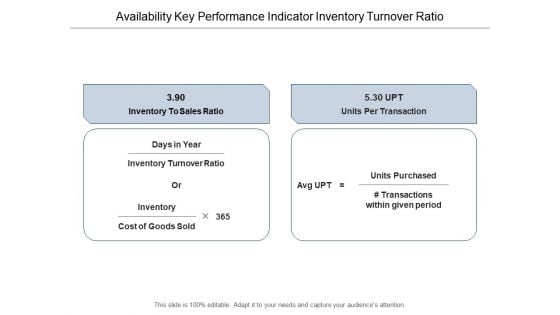
Availability Key Performance Indicator Inventory Turnover Ratio Ppt Powerpoint Presentation Layouts Graphics Download
This is a availability key performance indicator inventory turnover ratio ppt powerpoint presentation layouts graphics download. This is a two stage process. The stages in this process are availability kpi, availability dashboard, availability metrics.
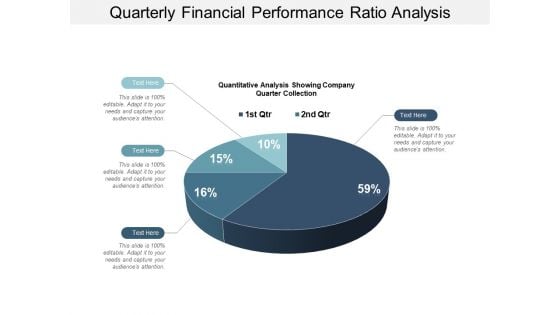
Quarterly Financial Performance Ratio Analysis Ppt PowerPoint Presentation Model Format Ideas
This is a quarterly financial performance ratio analysis ppt powerpoint presentation model format ideas. This is a four stage process. The stages in this process are financial analysis, quantitative, statistical modelling.
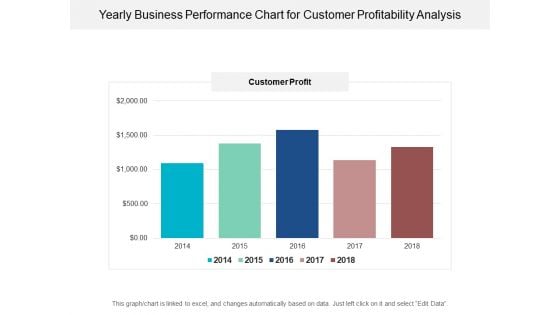
Yearly Business Performance Chart For Customer Profitability Analysis Ppt PowerPoint Presentation Ideas Picture
This is a yearly business performance chart for customer profitability analysis ppt powerpoint presentation ideas picture. This is a five stage process. The stages in this process are financial analysis, quantitative, statistical modelling.
2018 Year In Review Performance Assessment Ppt PowerPoint Presentation Layouts Graphics Example
This is a 2018 year in review performance assessment ppt powerpoint presentation layouts graphics example. This is a four stage process. The stages in this process are year in review, yearly highlights, countdowns.

Business Review And Performance Assessment Dashboards Ppt PowerPoint Presentation Infographics Show
This is a business review and performance assessment dashboards ppt powerpoint presentation infographics show. This is a four stage process. The stages in this process are year in review, yearly highlights, countdowns.

Year End Performance Analysis Economic Development And Growth Ppt PowerPoint Presentation Infographic Template Shapes
This is a year end performance analysis economic development and growth ppt powerpoint presentation infographic template shapes. This is a seven stage process. The stages in this process are year in review, yearly highlights, countdowns.
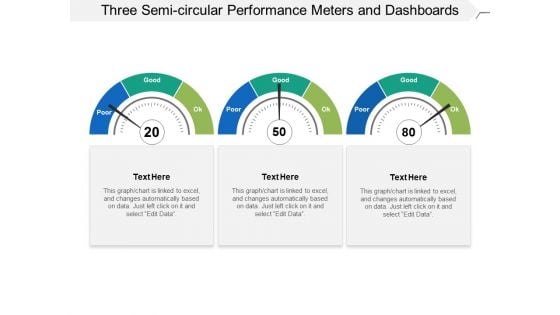
Three Semi Circular Performance Meters And Dashboards Ppt PowerPoint Presentation Slides Influencers
This is a three semi circular performance meters and dashboards ppt powerpoint presentation slides influencers. This is a three stage process. The stages in this process are fuel gauge, gas gauge, fuel containers.
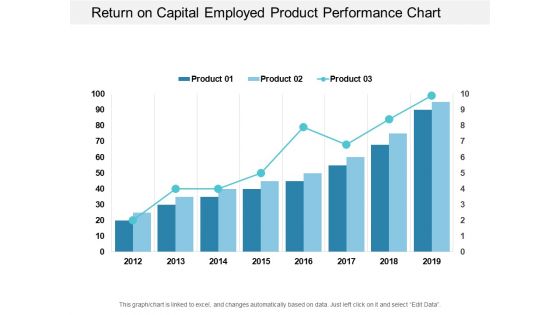
Return On Capital Employed Product Performance Chart Ppt PowerPoint Presentation Portfolio Visuals
This is a return on capital employed product performance chart ppt powerpoint presentation portfolio visuals. This is a three stage process. The stages in this process are accounting ratio, roce, return on capital employed.
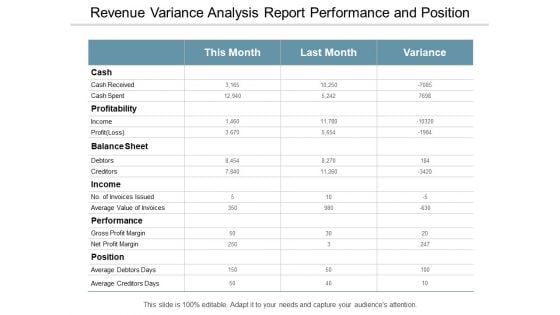
Revenue Variance Analysis Report Performance And Position Ppt PowerPoint Presentation Sample
This is a revenue variance analysis report performance and position ppt powerpoint presentation sample. This is a three stage process. The stages in this process are accounting review, accounting report, accounting statement.
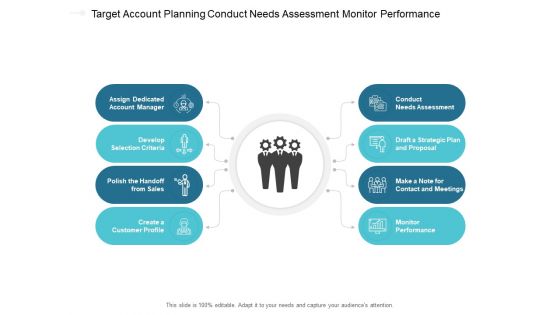
Target Account Planning Conduct Needs Assessment Monitor Performance Ppt PowerPoint Presentation Ideas Images Cpb
This is a target account planning conduct needs assessment monitor performance ppt powerpoint presentation ideas images cpb. This is a eight stage process. The stages in this process are account plan, sales planning, account strategy.
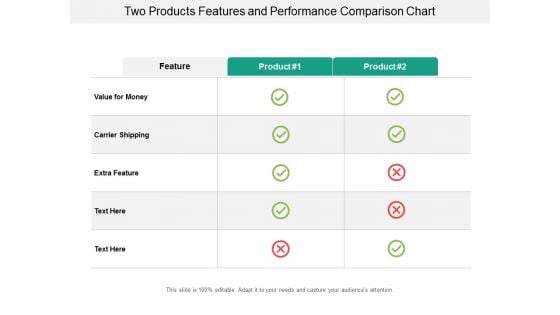
Two Products Features And Performance Comparison Chart Ppt Powerpoint Presentation Ideas Layout Ideas
This is a two products features and performance comparison chart ppt powerpoint presentation ideas layout ideas. This is a two stage process. The stages in this process are product differentiation, product comparison, brand differentiation.
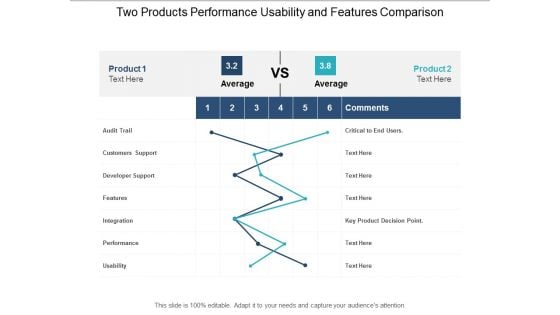
Two Products Performance Usability And Features Comparison Ppt Powerpoint Presentation Infographic Template Portrait
This is a two products performance usability and features comparison ppt powerpoint presentation infographic template portrait. This is a two stage process. The stages in this process are product differentiation, product comparison, brand differentiation.
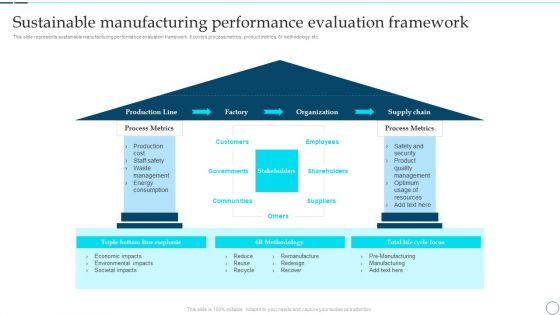
Deployment Of Smart Factory Solutions Sustainable Manufacturing Performance Evaluation Framework Professional PDF
This slide represents sustainable manufacturing performance evaluation framework. It covers process metrics, product metrics, 6r methodology etc. Deliver and pitch your topic in the best possible manner with this Deployment Of Smart Factory Solutions Sustainable Manufacturing Performance Evaluation Framework Professional PDF. Use them to share invaluable insights on Organization, Supply Chain, Process Metrics and impress your audience. This template can be altered and modified as per your expectations. So, grab it now.
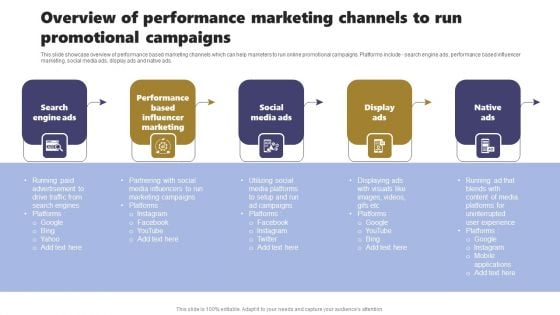
Acquiring Clients Through Search Engine And Native Ads Overview Of Performance Marketing Channels Run Elements PDF
This slide showcase overview of performance based marketing channels which can help marketers to run online promotional campaigns. Platforms include - search engine ads, performance based influencer marketing, social media ads, display ads and native ads. Slidegeeks has constructed Acquiring Clients Through Search Engine And Native Ads Overview Of Performance Marketing Channels Run Elements PDF after conducting extensive research and examination. These presentation templates are constantly being generated and modified based on user preferences and critiques from editors. Here, you will find the most attractive templates for a range of purposes while taking into account ratings and remarks from users regarding the content. This is an excellent jumping off point to explore our content and will give new users an insight into our top notch PowerPoint Templates.
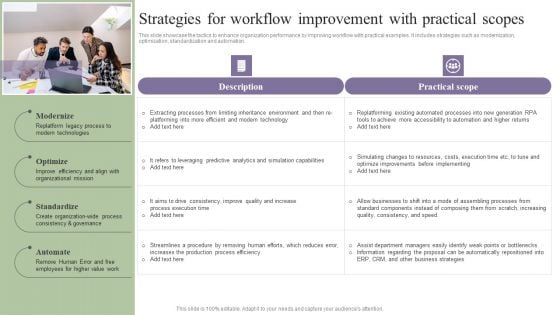
Deployment Of Process Automation To Increase Organisational Performance Strategies For Workflow Improvement Infographics PDF
This slide showcase the tactics to enhance organization performance by improving workflow with practical examples. It includes strategies such as modernization, optimization, standardization and automation. Are you searching for a Deployment Of Process Automation To Increase Organisational Performance Strategies For Workflow Improvement Infographics PDF that is uncluttered, straightforward, and original Its easy to edit, and you can change the colors to suit your personal or business branding. For a presentation that expresses how much effort you have put in, this template is ideal. With all of its features, including tables, diagrams, statistics, and lists, its perfect for a business plan presentation. Make your ideas more appealing with these professional slides. Download Deployment Of Process Automation To Increase Organisational Performance Strategies For Workflow Improvement Infographics PDF from Slidegeeks today.
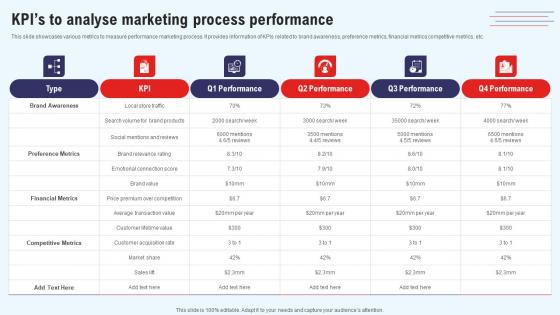
Efficient Marketing Process For Business Kpis To Analyse Marketing Process Performance Elements Pdf
This slide showcases various metrics to measure performance marketing process. It provides information of KPIs related to brand awareness, preference metrics, financial metrics competitive metrics, etc. This modern and well-arranged Efficient Marketing Process For Business Kpis To Analyse Marketing Process Performance Elements Pdf provides lots of creative possibilities. It is very simple to customize and edit with the Powerpoint Software. Just drag and drop your pictures into the shapes. All facets of this template can be edited with Powerpoint no extra software is necessary. Add your own material, put your images in the places assigned for them, adjust the colors, and then you can show your slides to the world, with an animated slide included. This slide showcases various metrics to measure performance marketing process. It provides information of KPIs related to brand awareness, preference metrics, financial metrics competitive metrics, etc.
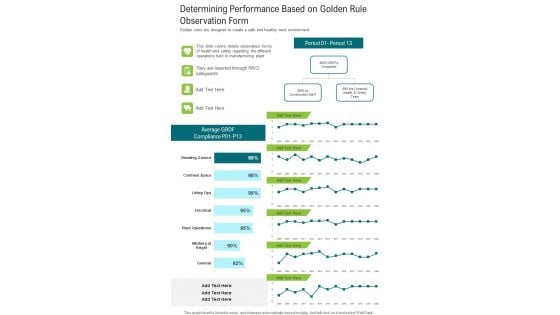
Determining Performance Based On Golden Rule Observation Form One Pager Documents
Golden rules are designed to create a safe and healthy work environment. Presenting you an exemplary Determining Performance Based On Golden Rule Observation Form One Pager Documents. Our one-pager comprises all the must-have essentials of an inclusive document. You can edit it with ease, as its layout is completely editable. With such freedom, you can tweak its design and other elements to your requirements. Download this Determining Performance Based On Golden Rule Observation Form One Pager Documents brilliant piece now.
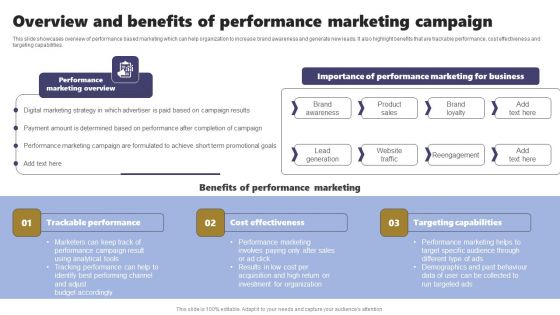
Acquiring Clients Through Search Engine And Native Ads Overview And Benefits Of Performance Marketing Elements PDF
This slide showcases overview of performance based marketing which can help organization to increase brand awareness and generate new leads. It also highlight benefits that are trackable performance, cost effectiveness and targeting capabilities. Welcome to our selection of the Acquiring Clients Through Search Engine And Native Ads Overview And Benefits Of Performance Marketing Elements PDF. These are designed to help you showcase your creativity and bring your sphere to life. Planning and Innovation are essential for any business that is just starting out. This collection contains the designs that you need for your everyday presentations. All of our PowerPoints are 100 percent editable, so you can customize them to suit your needs. This multi purpose template can be used in various situations. Grab these presentation templates today.

Improving Organizational Process Induction Procedure Current Performance Of The Team Topics PDF
This slide provides the current performance of the company in comparison with industry average. Major KPIs covered in this are customer progression, customer response time, time to complete onboarding, product adoption rate, and escalation response time. Deliver and pitch your topic in the best possible manner with this improving organizational process induction procedure current performance of the team topics pdf. Use them to share invaluable insights on customer progression, customer response rate, product and impress your audience. This template can be altered and modified as per your expectations. So, grab it now.
Impact Of Disengaged Workforce On Company Performance Ppt Icon Outline PDF
The following slide showcases the effect of low employee engagement to boost productivity and optimize overall output. It mainly includes impact on work, co-workers, customers, productivity, business performance etc. Formulating a presentation can take up a lot of effort and time, so the content and message should always be the primary focus. The visuals of the PowerPoint can enhance the presenters message, so our Impact Of Disengaged Workforce On Company Performance Ppt Icon Outline PDF was created to help save time. Instead of worrying about the design, the presenter can concentrate on the message while our designers work on creating the ideal templates for whatever situation is needed. Slidegeeks has experts for everything from amazing designs to valuable content, we have put everything into Impact Of Disengaged Workforce On Company Performance Ppt Icon Outline PDF.
Handle Project Escalations Project Performance Tracking And Reporting Ppt Inspiration Background Image PDF
This slide provides the glimpse about the fourth step of issue and escalation process which covers the project name, start and finish, work duration, costs, etc. Deliver an awe inspiring pitch with this creative handle project escalations project performance tracking and reporting ppt inspiration background image pdf bundle. Topics like project performance tracking and reporting can be discussed with this completely editable template. It is available for immediate download depending on the needs and requirements of the user.
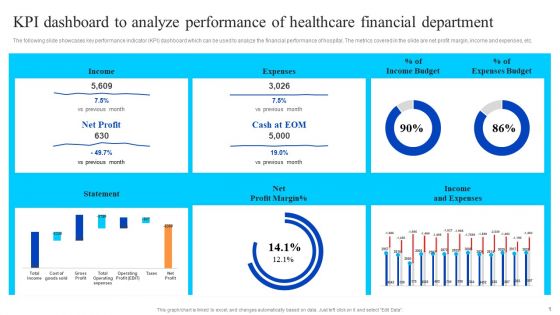
KPI Dashboard To Analyze Performance Of Healthcare Financial Department Summary PDF
The following slide showcases key performance indicator KPI dashboard which can be used to analyze the financial performance of hospital. The metrics covered in the slide are net profit margin, income and expenses, etc. Do you have an important presentation coming up Are you looking for something that will make your presentation stand out from the rest Look no further than KPI Dashboard To Analyze Performance Of Healthcare Financial Department Summary PDF. With our professional designs, you can trust that your presentation will pop and make delivering it a smooth process. And with Slidegeeks, you can trust that your presentation will be unique and memorable. So why wait Grab KPI Dashboard To Analyze Performance Of Healthcare Financial Department Summary PDF today and make your presentation stand out from the rest.
Critical Initiatives To Deploy Product And Customer Performance Tracking Dashboard Guidelines PDF
This slide provides information regarding dashboard utilized by firm to monitor performance of products offered and customer associated. The performance is tracked through revenues generated, new customer acquired, customer satisfaction, sales comparison, etc. Do you have an important presentation coming up Are you looking for something that will make your presentation stand out from the rest Look no further than Critical Initiatives To Deploy Product And Customer Performance Tracking Dashboard Guidelines PDF. With our professional designs, you can trust that your presentation will pop and make delivering it a smooth process. And with Slidegeeks, you can trust that your presentation will be unique and memorable. So why wait Grab Critical Initiatives To Deploy Product And Customer Performance Tracking Dashboard Guidelines PDF today and make your presentation stand out from the rest.
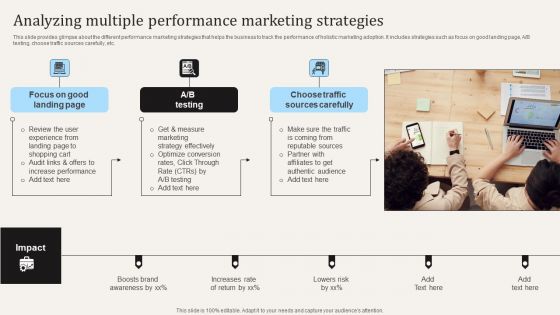
Analyzing Multiple Performance Marketing Strategies Ppt PowerPoint Presentation File Professional PDF
This slide provides glimpse about the different performance marketing strategies that helps the business to track the performance of holistic marketing adoption. It includes strategies such as focus on good landing page, A B testing, choose traffic sources carefully, etc. Do you have an important presentation coming up Are you looking for something that will make your presentation stand out from the rest Look no further than Analyzing Multiple Performance Marketing Strategies Ppt PowerPoint Presentation File Professional PDF. With our professional designs, you can trust that your presentation will pop and make delivering it a smooth process. And with Slidegeeks, you can trust that your presentation will be unique and memorable. So why wait Grab Analyzing Multiple Performance Marketing Strategies Ppt PowerPoint Presentation File Professional PDF today and make your presentation stand out from the rest.


 Continue with Email

 Home
Home


