Performance Plan
Data Breach Prevention Status Tracking Dashboard Data Breach Prevention Information Pdf
This slide represents the critical cyber security performance indicators for the organization. The key components include application health, encryption status, license consumption, windows defender, etc. Crafting an eye-catching presentation has never been more straightforward. Let your presentation shine with this tasteful yet straightforward Data Breach Prevention Status Tracking Dashboard Data Breach Prevention Information Pdf template. It offers a minimalistic and classy look that is great for making a statement. The colors have been employed intelligently to add a bit of playfulness while still remaining professional. Construct the ideal Data Breach Prevention Status Tracking Dashboard Data Breach Prevention Information Pdf that effortlessly grabs the attention of your audience Begin now and be certain to wow your customers This slide represents the critical cyber security performance indicators for the organization. The key components include application health, encryption status, license consumption, windows defender, etc.
Managing It Services Spending Tracking Dashboard Gen Tech Stack Playbook Inspiration Pdf
This slide provides information regarding the management of the digital services performance and IT spending tracking dashboard in terms of ROI, spend vs. budget, IT costs software, hardware, personnel and goals, IT spending in terms of revenues, etc. If your project calls for a presentation, then Slidegeeks is your go-to partner because we have professionally designed, easy-to-edit templates that are perfect for any presentation. After downloading, you can easily edit Managing It Services Spending Tracking Dashboard Gen Tech Stack Playbook Inspiration Pdf and make the changes accordingly. You can rearrange slides or fill them with different images. Check out all the handy templates This slide provides information regarding the management of the digital services performance and IT spending tracking dashboard in terms of ROI, spend vs. budget, IT costs software, hardware, personnel and goals, IT spending in terms of revenues, etc.
Global Islamic Finance Industry Analysis A Detailed Knowledge Of Islamic Finance Icons Pdf
This slide consists of a dashboard used for analyzing Islamic finance development from 2014 to 2020. It includes key performance indicators such as asset growth, components of Islamic finance, and asset distribution. Coming up with a presentation necessitates that the majority of the effort goes into the content and the message you intend to convey. The visuals of a PowerPoint presentation can only be effective if it supplements and supports the story that is being told. Keeping this in mind our experts created Global Islamic Finance Industry Analysis A Detailed Knowledge Of Islamic Finance Icons Pdf to reduce the time that goes into designing the presentation. This way, you can concentrate on the message while our designers take care of providing you with the right template for the situation. This slide consists of a dashboard used for analyzing Islamic finance development from 2014 to 2020. It includes key performance indicators such as asset growth, components of Islamic finance, and asset distribution.
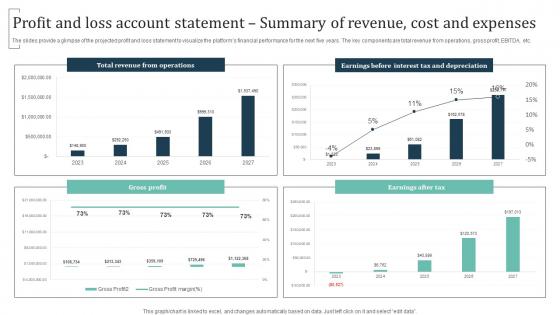
Profit And Loss Account Statement Summary Of Revenue Group Training Business Rules Pdf
The slides provide a glimpse of the projected profit and loss statement to visualize the platforms financial performance for the next five years. The key components are total revenue from operations, gross profit, EBITDA, etc. There are so many reasons you need a Profit And Loss Account Statement Summary Of Revenue Group Training Business Rules Pdf The first reason is you can not spend time making everything from scratch, Thus, Slidegeeks has made presentation templates for you too. You can easily download these templates from our website easily. The slides provide a glimpse of the projected profit and loss statement to visualize the platforms financial performance for the next five years. The key components are total revenue from operations, gross profit, EBITDA, etc.
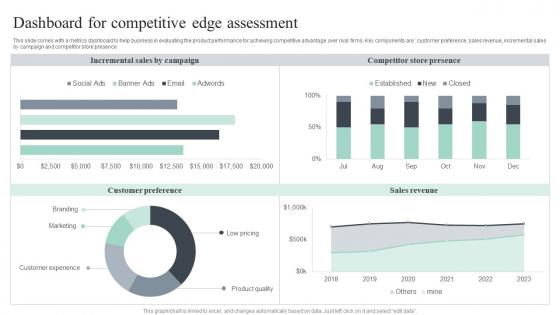
Dashboard For Competitive Edge Assessment Themes Pdf
This slide comes with a metrics dashboard to help business in evaluating the product performance for achieving competitive advantage over rival firms. Key components are customer preference, sales revenue, incremental sales by campaign and competitor store presence Pitch your topic with ease and precision using this Dashboard For Competitive Edge Assessment Themes Pdf. This layout presents information on Incremental Sales, Competitor Store Presence, Sales Revenue. It is also available for immediate download and adjustment. So, changes can be made in the color, design, graphics or any other component to create a unique layout. This slide comes with a metrics dashboard to help business in evaluating the product performance for achieving competitive advantage over rival firms. Key components are customer preference, sales revenue, incremental sales by campaign and competitor store presence
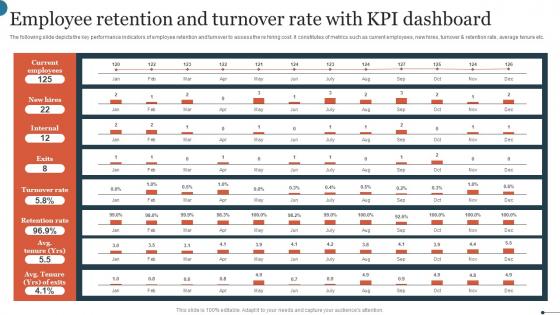
Employee Retention And Turnover Rate With KPI Dashboard Graphics Pdf
The following slide depicts the key performance indicators of employee retention and turnover to assess the re hiring cost. It constitutes of metrics such as current employees, new hires, turnover and retention rate, average tenure etc. Showcasing this set of slides titled Employee Retention And Turnover Rate With KPI Dashboard Graphics Pdf. The topics addressed in these templates are Current Employees, Turnover Rate, Retention Rate. All the content presented in this PPT design is completely editable. Download it and make adjustments in color, background, font etc. as per your unique business setting. The following slide depicts the key performance indicators of employee retention and turnover to assess the re hiring cost. It constitutes of metrics such as current employees, new hires, turnover and retention rate, average tenure etc.
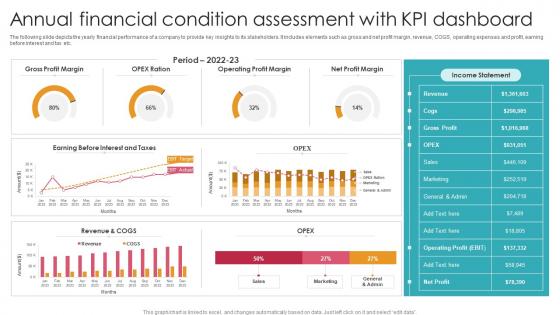
Annual Financial Condition Assessment With KPI Dashboard Ideas Pdf
The following slide depicts the yearly financial performance of a company to provide key insights to its stakeholders. It includes elements such as gross and net profit margin, revenue, COGS, operating expenses and profit, earning before interest and tax etc. Showcasing this set of slides titled Annual Financial Condition Assessment With KPI Dashboard Ideas Pdf. The topics addressed in these templates are Gross Profit Margin, Operating Profit Margin, Net Profit Margin. All the content presented in this PPT design is completely editable. Download it and make adjustments in color, background, font etc. as per your unique business setting. The following slide depicts the yearly financial performance of a company to provide key insights to its stakeholders. It includes elements such as gross and net profit margin, revenue, COGS, operating expenses and profit, earning before interest and tax etc.
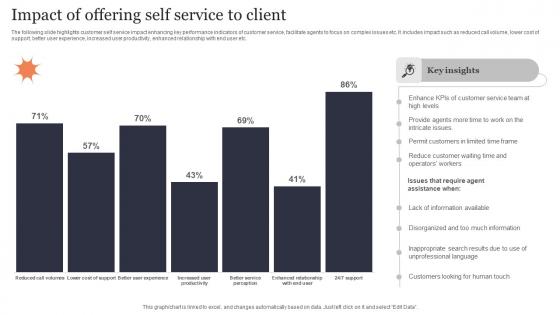
Impact Of Offering Self Service To Client Structure Pdf
The following slide highlights customer self service impact enhancing key performance indicators of customer service, facilitate agents to focus on complex issues etc. It includes impact such as reduced call volume, lower cost of support, better user experience, increased user productivity, enhanced relationship with end user etc. Showcasing this set of slides titled Impact Of Offering Self Service To Client Structure Pdf. The topics addressed in these templates are Impact Of Offering, Self Service. All the content presented in this PPT design is completely editable. Download it and make adjustments in color, background, font etc. as per your unique business setting. The following slide highlights customer self service impact enhancing key performance indicators of customer service, facilitate agents to focus on complex issues etc. It includes impact such as reduced call volume, lower cost of support, better user experience, increased user productivity, enhanced relationship with end user etc.
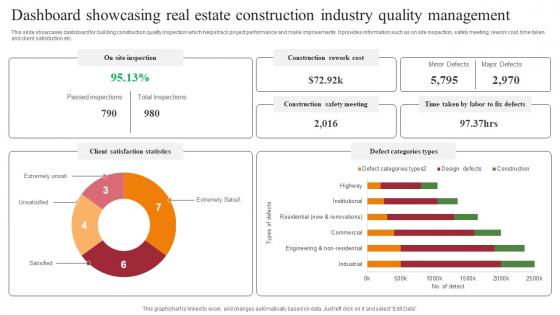
Dashboard Showcasing Real Estate Construction Industry Quality Management Topics Pdf
This slide showcases dashboard for building construction quality inspection which helps track project performance and make improvements. It provides information such as on site inspection, safety meeting, rework cost, time taken and client satisfaction etc. Pitch your topic with ease and precision using this Dashboard Showcasing Real Estate Construction Industry Quality Management Topics Pdf. This layout presents information on Client Satisfaction Statistics, Defect Categories Types. It is also available for immediate download and adjustment. So, changes can be made in the color, design, graphics or any other component to create a unique layout. This slide showcases dashboard for building construction quality inspection which helps track project performance and make improvements. It provides information such as on site inspection, safety meeting, rework cost, time taken and client satisfaction etc.
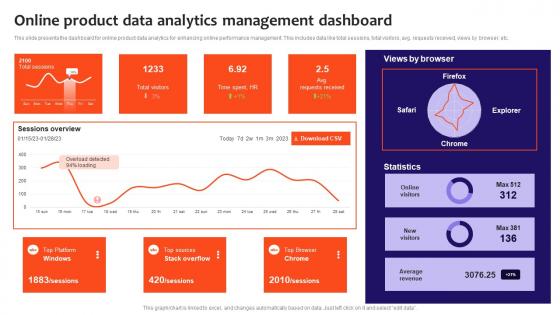
Online Product Data Analytics Management Dashboard Information Pdf
This slide presents the dashboard for online product data analytics for enhancing online performance management. This includes data like total sessions, total visitors, avg. requests received, views by browser, etc. Showcasing this set of slides titled Online Product Data Analytics Management Dashboard Information Pdf. The topics addressed in these templates are Online Product Data Analytics, Management Dashboard. All the content presented in this PPT design is completely editable. Download it and make adjustments in color, background, font etc. as per your unique business setting. This slide presents the dashboard for online product data analytics for enhancing online performance management. This includes data like total sessions, total visitors, avg. requests received, views by browser, etc.
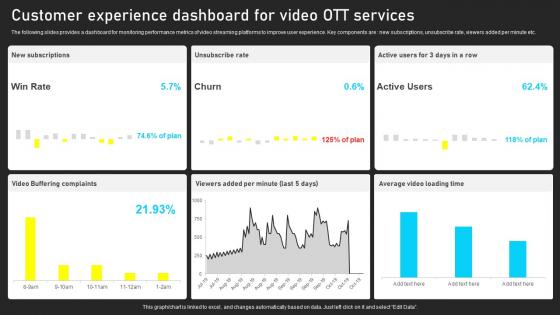
Customer Experience Dashboard For Video OTT Ervices Introduction Pdf
The following slides provides a dashboard for monitoring performance metrics of video streaming platforms to improve user experience. Key components are new subscriptions, unsubscribe rate, viewers added per minute etc. Pitch your topic with ease and precision using this Customer Experience Dashboard For Video OTT Ervices Introduction Pdf. This layout presents information on Customer Experience Dashboard, Video OTT Services. It is also available for immediate download and adjustment. So, changes can be made in the color, design, graphics or any other component to create a unique layout. The following slides provides a dashboard for monitoring performance metrics of video streaming platforms to improve user experience. Key components are new subscriptions, unsubscribe rate, viewers added per minute etc.
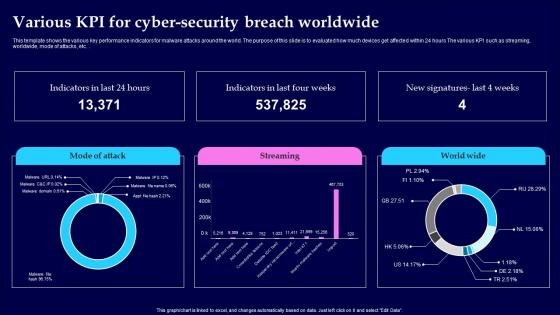
Various KPI For Cyber Security Breach Worldwide Pictures Pdf
This template shows the various key performance indicators for malware attacks around the world. The purpose of this slide is to evaluated how much devices get affected within 24 hours The various KPI such as streaming, worldwide, mode of attacks, etc. Showcasing this set of slides titled Various KPI For Cyber Security Breach Worldwide Pictures Pdf The topics addressed in these templates are Cyber Security Breach, Worldwide All the content presented in this PPT design is completely editable. Download it and make adjustments in color, background, font etc. as per your unique business setting. This template shows the various key performance indicators for malware attacks around the world. The purpose of this slide is to evaluated how much devices get affected within 24 hours The various KPI such as streaming, worldwide, mode of attacks, etc.
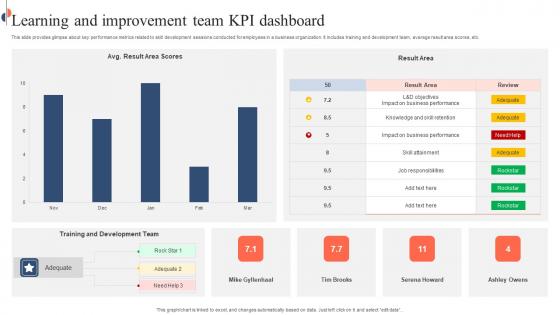
Learning And Improvement Team KPI Dashboard Slides Pdf
This slide provides glimpse about key performance metrics related to skill development sessions conducted for employees in a business organization. It includes training and development team, average result area scores, etc. Pitch your topic with ease and precision using this Learning And Improvement Team KPI Dashboard Slides Pdf. This layout presents information on Learning And Improvement Team, KPI Dashboard, Development Team. It is also available for immediate download and adjustment. So, changes can be made in the color, design, graphics or any other component to create a unique layout. This slide provides glimpse about key performance metrics related to skill development sessions conducted for employees in a business organization. It includes training and development team, average result area scores, etc.
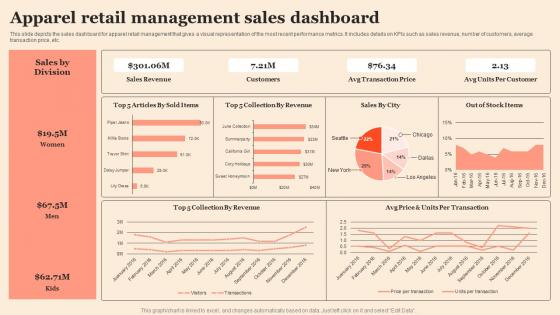
Apparel Retail Management Sales Dashboard Professional Pdf
This slide depicts the sales dashboard for apparel retail management that gives a visual representation of the most recent performance metrics. It includes details on KPIs such as sales revenue, number of customers, average transaction price, etc.Pitch your topic with ease and precision using this Apparel Retail Management Sales Dashboard Professional Pdf This layout presents information on Sales Revenue, Transaction Price, Units Per Customer It is also available for immediate download and adjustment. So, changes can be made in the color, design, graphics or any other component to create a unique layout. This slide depicts the sales dashboard for apparel retail management that gives a visual representation of the most recent performance metrics. It includes details on KPIs such as sales revenue, number of customers, average transaction price, etc.
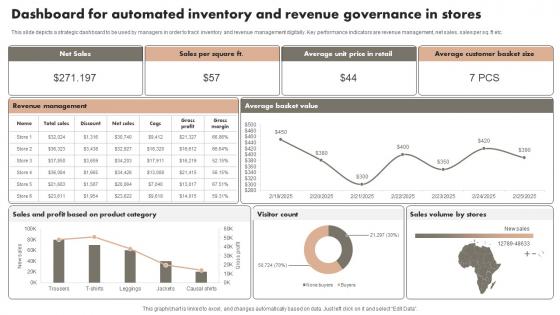
Dashboard For Automated Inventory And Revenue Governance In Stores Microsoft Pdf
This slide depicts a strategic dashboard to be used by managers in order to track inventory and revenue management digitally. Key performance indicators are revenue management, net sales, sales per sq. ft etc. Pitch your topic with ease and precision using this Dashboard For Automated Inventory And Revenue Governance In Stores Microsoft Pdf. This layout presents information on Net Sales, Stores, Category. It is also available for immediate download and adjustment. So, changes can be made in the color, design, graphics or any other component to create a unique layout. This slide depicts a strategic dashboard to be used by managers in order to track inventory and revenue management digitally. Key performance indicators are revenue management, net sales, sales per sq. ft etc.
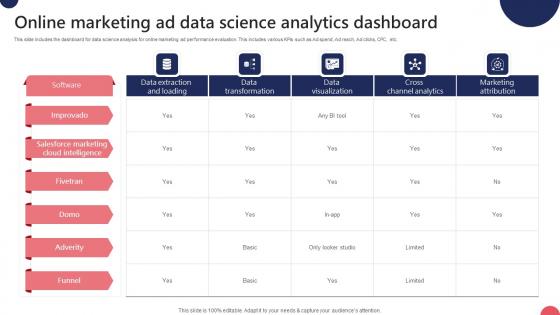
Online Marketing Ad Data Science Analytics Dashboard Ppt Inspiration Guidelines Pdf
This slide includes the dashboard for data science analysis for online marketing ad performance evaluation. This includes various KPIs such as Ad spend, Ad reach, Ad clicks, CPC, etc. Pitch your topic with ease and precision using this Online Marketing Ad Data Science Analytics Dashboard Ppt Inspiration Guidelines Pdf. This layout presents information on Ad Spend, Cost Per Thousand, Cost Per Click. It is also available for immediate download and adjustment. So, changes can be made in the color, design, graphics or any other component to create a unique layout. This slide includes the dashboard for data science analysis for online marketing ad performance evaluation. This includes various KPIs such as Ad spend, Ad reach, Ad clicks, CPC, etc.
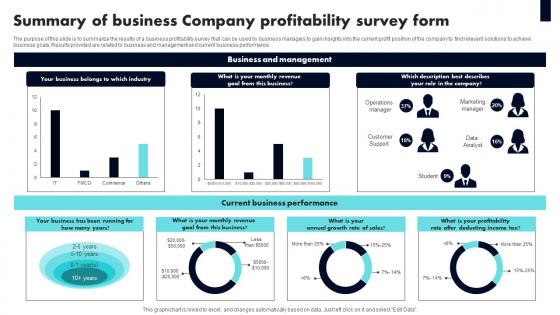
Summary Of Business Company Profitability Survey Form Survey Ss
The purpose of this slide is to summarize the results of a business profitability survey that can be used by business managers to gain insights into the current profit position of the company to find relevant solutions to achieve business goals. Results provided are related to business and management and current business performance Pitch your topic with ease and precision using this Summary Of Business Company Profitability Survey Form Survey Ss This layout presents information on Business Belongs, Revenue, Company It is also available for immediate download and adjustment. So, changes can be made in the color, design, graphics or any other component to create a unique layout. The purpose of this slide is to summarize the results of a business profitability survey that can be used by business managers to gain insights into the current profit position of the company to find relevant solutions to achieve business goals. Results provided are related to business and management and current business performance
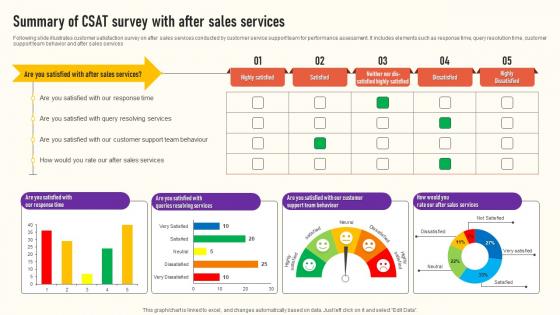
Summary Of CSAT Survey With After Sales Services Survey Ss
Following slide illustrates customer satisfaction survey on after sales services conducted by customer service support team for performance assessment. It includes elements such as response time, query resolution time, customer support team behavior and after sales services Pitch your topic with ease and precision using this Summary Of CSAT Survey With After Sales Services Survey Ss This layout presents information on Highly Satisfied, Dissatisfied, Highly Dissatisfied It is also available for immediate download and adjustment. So, changes can be made in the color, design, graphics or any other component to create a unique layout. Following slide illustrates customer satisfaction survey on after sales services conducted by customer service support team for performance assessment. It includes elements such as response time, query resolution time, customer support team behavior and after sales services
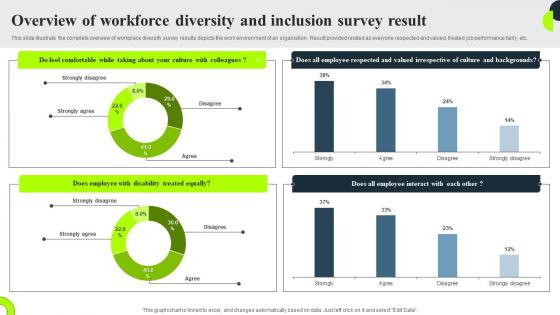
Overview Of Workforce Diversity And Inclusion Survey Result Survey Ss
This slide illustrate the complete overview of workplace diversity survey results depicts the work environment of an organistion . Result provided related as everyone respected and valued, treated job performance fairly, etc. Showcasing this set of slides titled Overview Of Workforce Diversity And Inclusion Survey Result Survey Ss The topics addressed in these templates are Comfortable, Disability Treated Equally, Valued Irrespective All the content presented in this PPT design is completely editable. Download it and make adjustments in color, background, font etc. as per your unique business setting. This slide illustrate the complete overview of workplace diversity survey results depicts the work environment of an organistion . Result provided related as everyone respected and valued, treated job performance fairly, etc.
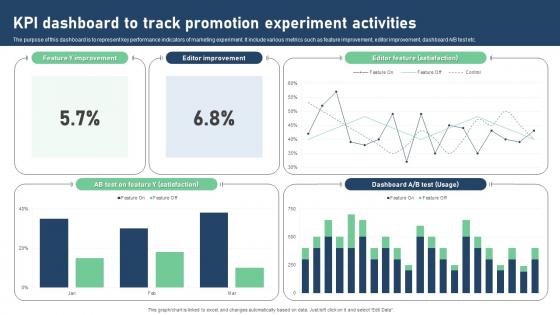
Kpi Dashboard To Track Promotion Experiment Activities Portrait Pdf
The purpose of this dashboard is to represent key performance indicators of marketing experiment. It include various metrics such as feature improvement, editor improvement, dashboard A or B test etc. Pitch your topic with ease and precision using this Kpi Dashboard To Track Promotion Experiment Activities Portrait Pdf. This layout presents information on KPI Dashboard, Track Promotion, Experiment Activities, Editor Improvement. It is also available for immediate download and adjustment. So, changes can be made in the color, design, graphics or any other component to create a unique layout. The purpose of this dashboard is to represent key performance indicators of marketing experiment. It include various metrics such as feature improvement, editor improvement, dashboard A or B test etc.
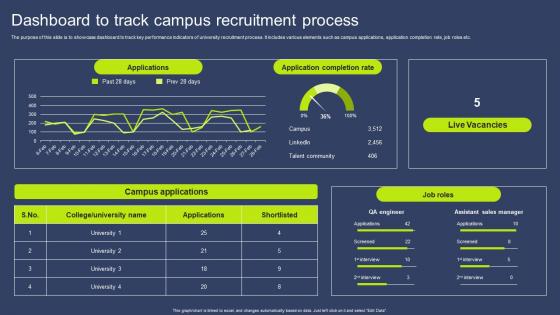
Dashboard To Track Campus Recruitment Process Clipart Pdf
The purpose of this slide is to showcase dashboard to track key performance indicators of university recruitment process. It includes various elements such as campus applications, application completion rate, job roles etc. Showcasing this set of slides titled Dashboard To Track Campus Recruitment Process Clipart Pdf. The topics addressed in these templates are Applications, Application Completion Rate, Live Vacancies. All the content presented in this PPT design is completely editable. Download it and make adjustments in color, background, font etc. as per your unique business setting. The purpose of this slide is to showcase dashboard to track key performance indicators of university recruitment process. It includes various elements such as campus applications, application completion rate, job roles etc.
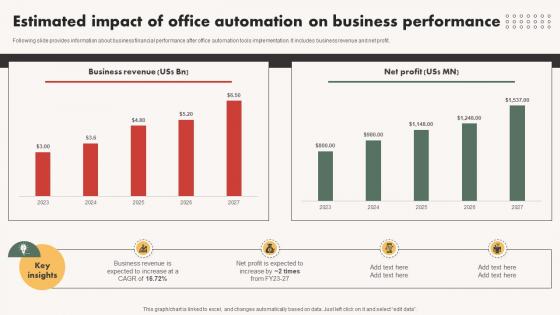
Automated Communication System Estimated Impact Of Office Automation On Business
Following slide provides information about business financial performance after office automation tools implementation. It includes business revenue and net profit. Are you in need of a template that can accommodate all of your creative concepts This one is crafted professionally and can be altered to fit any style. Use it with Google Slides or PowerPoint. Include striking photographs, symbols, depictions, and other visuals. Fill, move around, or remove text boxes as desired. Test out color palettes and font mixtures. Edit and save your work, or work with colleagues. Download Automated Communication System Estimated Impact Of Office Automation On Business and observe how to make your presentation outstanding. Give an impeccable presentation to your group and make your presentation unforgettable. Following slide provides information about business financial performance after office automation tools implementation. It includes business revenue and net profit.

Profit And Loss Account Statement Summary Of Revenue Cost Lawn Care BP SS V
The slides provide a glimpse of the projected profit and loss statement to visualize the platforms financial performance for the next five years. The key components are total revenue from operations, gross profit, EBITDA, etc. The Profit And Loss Account Statement Summary Of Revenue Cost Lawn Care BP SS V is a compilation of the most recent design trends as a series of slides. It is suitable for any subject or industry presentation, containing attractive visuals and photo spots for businesses to clearly express their messages. This template contains a variety of slides for the user to input data, such as structures to contrast two elements, bullet points, and slides for written information. Slidegeeks is prepared to create an impression. The slides provide a glimpse of the projected profit and loss statement to visualize the platforms financial performance for the next five years. The key components are total revenue from operations, gross profit, EBITDA, etc.
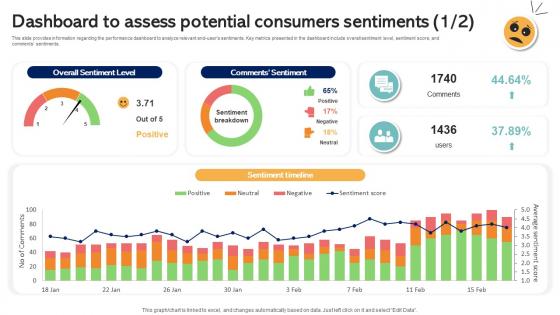
Dashboard To Assess Potential Consumers Sentiments Emotionally Intelligent Insights Leveraging AI SS V
This slide provides information regarding the performance dashboard to analyze relevant end-users sentiments. Key metrics presented in the dashboard include overall sentiment level, sentiment score, and comments sentiments. Do you have an important presentation coming up Are you looking for something that will make your presentation stand out from the rest Look no further than Dashboard To Assess Potential Consumers Sentiments Emotionally Intelligent Insights Leveraging AI SS V. With our professional designs, you can trust that your presentation will pop and make delivering it a smooth process. And with Slidegeeks, you can trust that your presentation will be unique and memorable. So why wait Grab Dashboard To Assess Potential Consumers Sentiments Emotionally Intelligent Insights Leveraging AI SS V today and make your presentation stand out from the rest This slide provides information regarding the performance dashboard to analyze relevant end-users sentiments. Key metrics presented in the dashboard include overall sentiment level, sentiment score, and comments sentiments.
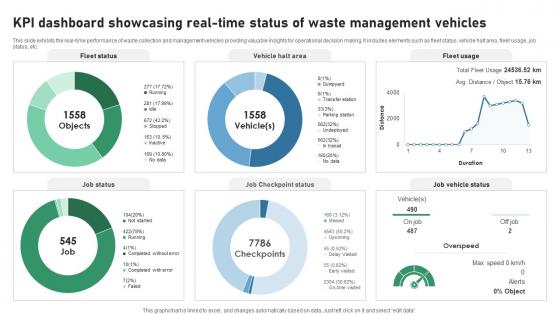
KPI Dashboard Showcasing Real Time Status Of Waste IOT Applications In Smart Waste IoT SS V
This slide exhibits the real-time performance of waste collection and management vehicles providing valuable insights for operational decision making. It includes elements such as fleet status, vehicle halt area, fleet usage, job status, etc. Take your projects to the next level with our ultimate collection of KPI Dashboard Showcasing Real Time Status Of Waste IOT Applications In Smart Waste IoT SS V. Slidegeeks has designed a range of layouts that are perfect for representing task or activity duration, keeping track of all your deadlines at a glance. Tailor these designs to your exact needs and give them a truly corporate look with your own brand colors they will make your projects stand out from the rest This slide exhibits the real-time performance of waste collection and management vehicles providing valuable insights for operational decision making. It includes elements such as fleet status, vehicle halt area, fleet usage, job status, etc.
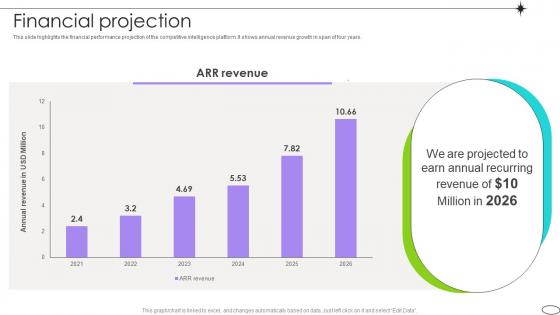
Financial Projection Competitive Landscape Analysis Platform Pitch Deck
This slide highlights the financial performance projection of the competitive intelligence platform. It shows annual revenue growth in span of four years. Slidegeeks is here to make your presentations a breeze with Financial Projection Competitive Landscape Analysis Platform Pitch Deck With our easy-to-use and customizable templates, you can focus on delivering your ideas rather than worrying about formatting. With a variety of designs to choose from, you are sure to find one that suits your needs. And with animations and unique photos, illustrations, and fonts, you can make your presentation pop. So whether you are giving a sales pitch or presenting to the board, make sure to check out Slidegeeks first This slide highlights the financial performance projection of the competitive intelligence platform. It shows annual revenue growth in span of four years.
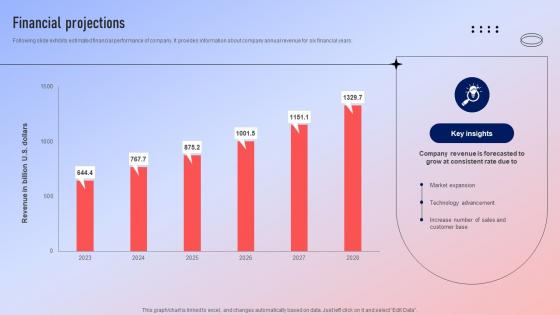
Financial Projections Fundraising Pitch Deck For Ecommerce Platform
Following slide exhibits estimated financial performance of company. It provides information about company annual revenue for six financial years. Present like a pro with Financial Projections Fundraising Pitch Deck For Ecommerce Platform. Create beautiful presentations together with your team, using our easy-to-use presentation slides. Share your ideas in real-time and make changes on the fly by downloading our templates. So whether you are in the office, on the go, or in a remote location, you can stay in sync with your team and present your ideas with confidence. With Slidegeeks presentation got a whole lot easier. Grab these presentations today. Following slide exhibits estimated financial performance of company. It provides information about company annual revenue for six financial years.
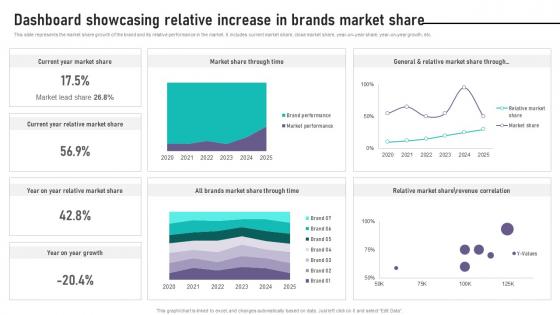
Brand Equity Management To Raise Dashboard Showcasing Relative Increase In Brands
This slide represents the market share growth of the brand and its relative performance in the market. It includes current market share, close market share, year-on-year share, year-on-year growth, etc. Crafting an eye-catching presentation has never been more straightforward. Let your presentation shine with this tasteful yet straightforward Brand Equity Management To Raise Dashboard Showcasing Relative Increase In Brands template. It offers a minimalistic and classy look that is great for making a statement. The colors have been employed intelligently to add a bit of playfulness while still remaining professional. Construct the ideal Brand Equity Management To Raise Dashboard Showcasing Relative Increase In Brands that effortlessly grabs the attention of your audience Begin now and be certain to wow your customers This slide represents the market share growth of the brand and its relative performance in the market. It includes current market share, close market share, year-on-year share, year-on-year growth, etc.
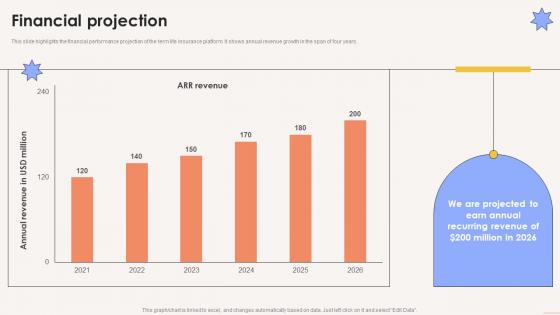
Financial Projection Term Life Insurance Platform Investor Funding Elevator Pitch Deck
This slide highlights the financial performance projection of the term life insurance platform. It shows annual revenue growth in the span of four years. Slidegeeks is here to make your presentations a breeze with Financial Projection Term Life Insurance Platform Investor Funding Elevator Pitch Deck With our easy-to-use and customizable templates, you can focus on delivering your ideas rather than worrying about formatting. With a variety of designs to choose from, you are sure to find one that suits your needs. And with animations and unique photos, illustrations, and fonts, you can make your presentation pop. So whether you are giving a sales pitch or presenting to the board, make sure to check out Slidegeeks first This slide highlights the financial performance projection of the term life insurance platform. It shows annual revenue growth in the span of four years.
Cryptocurrency Portfolio Tracking Dashboard Summary Cryptocurrency Management With Blockchain
This slide represents the cryptocurrency performance indicators for the individual. The key components include invested money, profit and loss, rate of investment ROI, current valuation of money, etc.Formulating a presentation can take up a lot of effort and time, so the content and message should always be the primary focus. The visuals of the PowerPoint can enhance the presenters message, so our Cryptocurrency Portfolio Tracking Dashboard Summary Cryptocurrency Management With Blockchain was created to help save time. Instead of worrying about the design, the presenter can concentrate on the message while our designers work on creating the ideal templates for whatever situation is needed. Slidegeeks has experts for everything from amazing designs to valuable content, we have put everything into Cryptocurrency Portfolio Tracking Dashboard Summary Cryptocurrency Management With Blockchain. This slide represents the cryptocurrency performance indicators for the individual. The key components include invested money, profit and loss, rate of investment ROI, current valuation of money, etc.
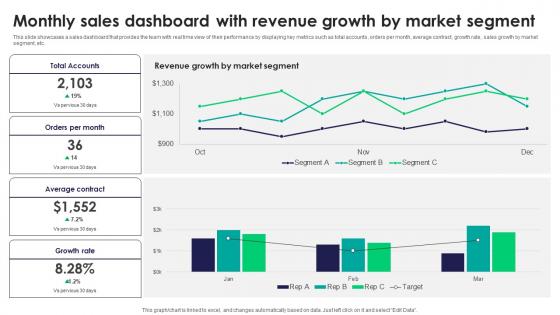
Monthly Sales Dashboard With Revenue Growth By Tactics For Improving Field Sales Team SA SS V
This slide showcases a sales dashboard that provides the team with real time view of their performance by displaying key metrics such as total accounts, orders per month, average contract, growth rate, sales growth by market segment, etc. The Monthly Sales Dashboard With Revenue Growth By Tactics For Improving Field Sales Team SA SS V is a compilation of the most recent design trends as a series of slides. It is suitable for any subject or industry presentation, containing attractive visuals and photo spots for businesses to clearly express their messages. This template contains a variety of slides for the user to input data, such as structures to contrast two elements, bullet points, and slides for written information. Slidegeeks is prepared to create an impression. This slide showcases a sales dashboard that provides the team with real time view of their performance by displaying key metrics such as total accounts, orders per month, average contract, growth rate, sales growth by market segment, etc.
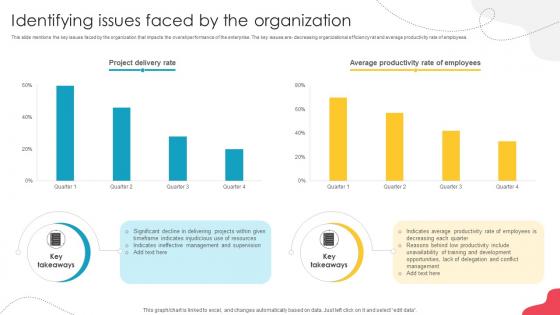
Unlocking Potential Enhancing Identifying Issues Faced By The Organization
This slide mentions the key issues faced by the organization that impacts the overall performance of the enterprise. The key issues are- decreasing organizational efficiency rat and average productivity rate of employees. If your project calls for a presentation, then Slidegeeks is your go-to partner because we have professionally designed, easy-to-edit templates that are perfect for any presentation. After downloading, you can easily edit Unlocking Potential Enhancing Identifying Issues Faced By The Organization and make the changes accordingly. You can rearrange slides or fill them with different images. Check out all the handy templates This slide mentions the key issues faced by the organization that impacts the overall performance of the enterprise. The key issues are- decreasing organizational efficiency rat and average productivity rate of employees.
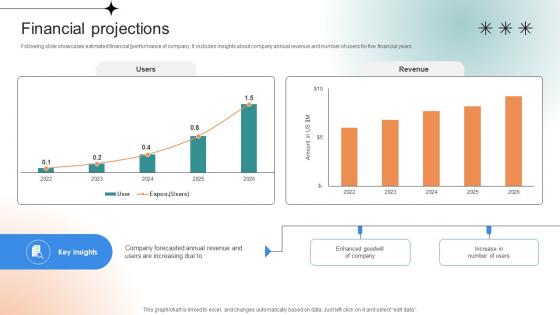
Financial Projections Professional Learning Platform Funding Pitch Deck
Following slide showcases estimated financial performance of company. It includes insights about company annual revenue and number of users for five financial years. Present like a pro with Financial Projections Professional Learning Platform Funding Pitch Deck. Create beautiful presentations together with your team, using our easy-to-use presentation slides. Share your ideas in real-time and make changes on the fly by downloading our templates. So whether you are in the office, on the go, or in a remote location, you can stay in sync with your team and present your ideas with confidence. With Slidegeeks presentation got a whole lot easier. Grab these presentations today. Following slide showcases estimated financial performance of company. It includes insights about company annual revenue and number of users for five financial years.
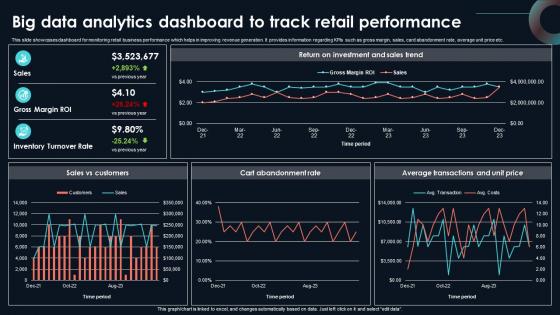
Big Data Analytics Dashboard To Track Developing Strategic Insights Using Big Data Analytics SS V
This slide showcases dashboard for monitoring retail business performance which helps in improving revenue generation. It provides information regarding KPIs such as gross margin, sales, card abandonment rate, average unit price etc. If your project calls for a presentation, then Slidegeeks is your go-to partner because we have professionally designed, easy-to-edit templates that are perfect for any presentation. After downloading, you can easily edit Big Data Analytics Dashboard To Track Developing Strategic Insights Using Big Data Analytics SS V and make the changes accordingly. You can rearrange slides or fill them with different images. Check out all the handy templates This slide showcases dashboard for monitoring retail business performance which helps in improving revenue generation. It provides information regarding KPIs such as gross margin, sales, card abandonment rate, average unit price etc.
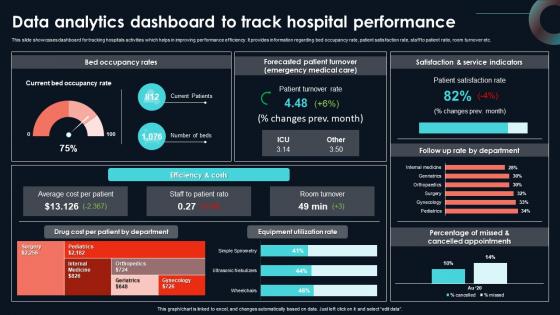
Data Analytics Dashboard To Track Hospital Developing Strategic Insights Using Big Data Analytics SS V
This slide showcases dashboard for tracking hospitals activities which helps in improving performance efficiency. It provides information regarding bed occupancy rate, patient satisfaction rate, staff to patient ratio, room turnover etc. The best PPT templates are a great way to save time, energy, and resources. Slidegeeks have 100 percent editable powerpoint slides making them incredibly versatile. With these quality presentation templates, you can create a captivating and memorable presentation by combining visually appealing slides and effectively communicating your message. Download Data Analytics Dashboard To Track Hospital Developing Strategic Insights Using Big Data Analytics SS V from Slidegeeks and deliver a wonderful presentation. This slide showcases dashboard for tracking hospitals activities which helps in improving performance efficiency. It provides information regarding bed occupancy rate, patient satisfaction rate, staff to patient ratio, room turnover etc.
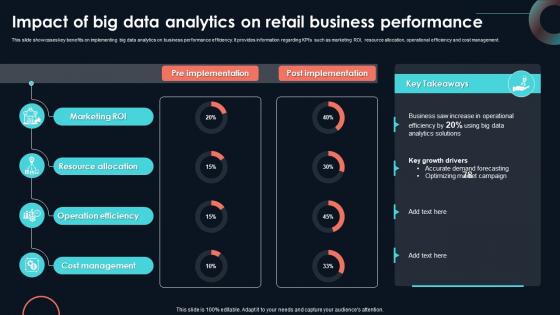
Impact Of Big Data Analytics On Retail Business Developing Strategic Insights Using Big Data Analytics SS V
This slide showcases key benefits on implementing big data analytics on business performance efficiency. It provides information regarding KPIs such as marketing ROI, resource allocation, operational efficiency and cost management. Do you know about Slidesgeeks Impact Of Big Data Analytics On Retail Business Developing Strategic Insights Using Big Data Analytics SS V These are perfect for delivering any kind od presentation. Using it, create PowerPoint presentations that communicate your ideas and engage audiences. Save time and effort by using our pre-designed presentation templates that are perfect for a wide range of topic. Our vast selection of designs covers a range of styles, from creative to business, and are all highly customizable and easy to edit. Download as a PowerPoint template or use them as Google Slides themes. This slide showcases key benefits on implementing big data analytics on business performance efficiency. It provides information regarding KPIs such as marketing ROI, resource allocation, operational efficiency and cost management.

Monthly Sales Dashboard With Revenue Efficient Sales Territory Management To Build SA SS V
This slide showcases a sales dashboard that provides the team with real time view of their performance by displaying key metrics such as total accounts, orders per month, average contract, growth rate, sales growth by market segment, etc. The Monthly Sales Dashboard With Revenue Efficient Sales Territory Management To Build SA SS V is a compilation of the most recent design trends as a series of slides. It is suitable for any subject or industry presentation, containing attractive visuals and photo spots for businesses to clearly express their messages. This template contains a variety of slides for the user to input data, such as structures to contrast two elements, bullet points, and slides for written information. Slidegeeks is prepared to create an impression. This slide showcases a sales dashboard that provides the team with real time view of their performance by displaying key metrics such as total accounts, orders per month, average contract, growth rate, sales growth by market segment, etc.
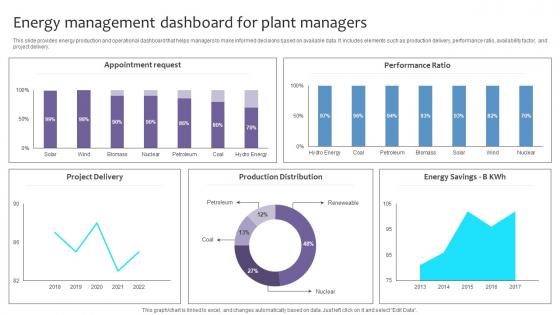
Empowering The Future Energy Management Dashboard For Plant Managers IoT SS V
This slide provides energy production and operational dashboard that helps managers to make informed decisions based on available data. It includes elements such as production delivery, performance ratio, availability factor, and project delivery. Crafting an eye-catching presentation has never been more straightforward. Let your presentation shine with this tasteful yet straightforward Empowering The Future Energy Management Dashboard For Plant Managers IoT SS V template. It offers a minimalistic and classy look that is great for making a statement. The colors have been employed intelligently to add a bit of playfulness while still remaining professional. Construct the ideal Empowering The Future Energy Management Dashboard For Plant Managers IoT SS V that effortlessly grabs the attention of your audience Begin now and be certain to wow your customers This slide provides energy production and operational dashboard that helps managers to make informed decisions based on available data. It includes elements such as production delivery, performance ratio, availability factor, and project delivery.
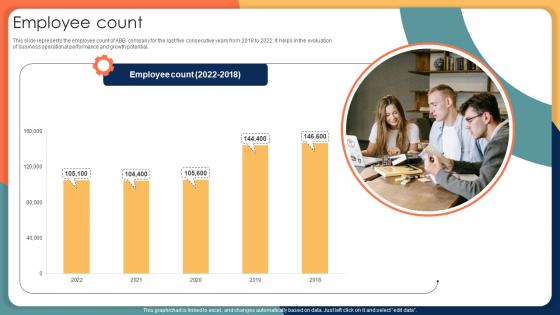
Employee Count Engineering Solution Provider Company Profile CP SS V
This slide represents the employee count of ABB company for the last five consecutive years from 2018 to 2022. It helps in the evaluation of business operational performance and growth potential. Find highly impressive Employee Count Engineering Solution Provider Company Profile CP SS V on Slidegeeks to deliver a meaningful presentation. You can save an ample amount of time using these presentation templates. No need to worry to prepare everything from scratch because Slidegeeks experts have already done a huge research and work for you. You need to download Employee Count Engineering Solution Provider Company Profile CP SS V for your upcoming presentation. All the presentation templates are 100 percent editable and you can change the color and personalize the content accordingly. Download now This slide represents the employee count of ABB company for the last five consecutive years from 2018 to 2022. It helps in the evaluation of business operational performance and growth potential.
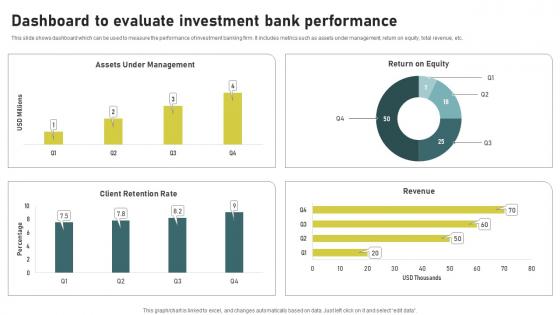
Dashboard To Evaluate Investment Bank Investment Banking Simplified Functions Fin SS V
This slide shows dashboard which can be used to measure the performance of investment banking firm. It includes metrics such as assets under management, return on equity, total revenue, etc. Find highly impressive Dashboard To Evaluate Investment Bank Investment Banking Simplified Functions Fin SS V on Slidegeeks to deliver a meaningful presentation. You can save an ample amount of time using these presentation templates. No need to worry to prepare everything from scratch because Slidegeeks experts have already done a huge research and work for you. You need to download Dashboard To Evaluate Investment Bank Investment Banking Simplified Functions Fin SS V for your upcoming presentation. All the presentation templates are 100 percent editable and you can change the color and personalize the content accordingly. Download now This slide shows dashboard which can be used to measure the performance of investment banking firm. It includes metrics such as assets under management, return on equity, total revenue, etc.
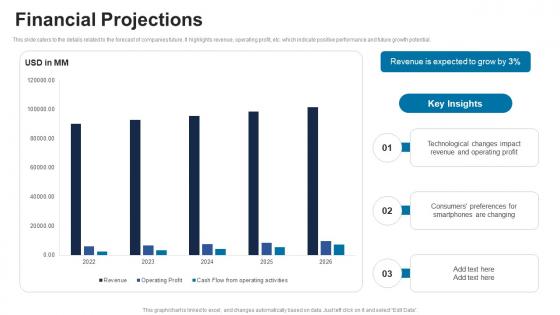
Financial Projections ICT Solutions Provider Investor Funding Elevator Pitch Deck
This slide caters to the details related to the forecast of companies future. It highlights revenue, operating profit, etc. which indicate positive performance and future growth potential. Slidegeeks is here to make your presentations a breeze with Financial Projections ICT Solutions Provider Investor Funding Elevator Pitch Deck With our easy-to-use and customizable templates, you can focus on delivering your ideas rather than worrying about formatting. With a variety of designs to choose from, you are sure to find one that suits your needs. And with animations and unique photos, illustrations, and fonts, you can make your presentation pop. So whether you are giving a sales pitch or presenting to the board, make sure to check out Slidegeeks first This slide caters to the details related to the forecast of companies future. It highlights revenue, operating profit, etc. which indicate positive performance and future growth potential.
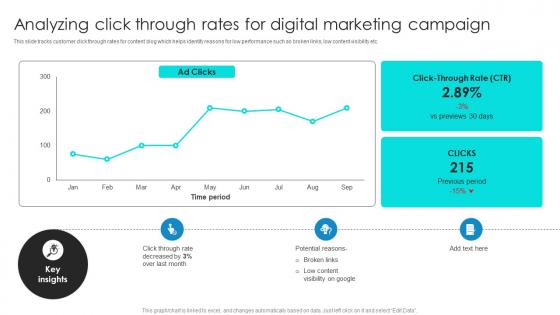
Project Benchmarking Process Analyzing Click Through Rates For Digital Marketing CRP DK SS V
This slide tracks customer click through rates for content blog which helps identify reasons for low performance such as broken links, low content visibility etc. Want to ace your presentation in front of a live audience Our Project Benchmarking Process Analyzing Click Through Rates For Digital Marketing CRP DK SS V can help you do that by engaging all the users towards you. Slidegeeks experts have put their efforts and expertise into creating these impeccable powerpoint presentations so that you can communicate your ideas clearly. Moreover, all the templates are customizable, and easy-to-edit and downloadable. Use these for both personal and commercial use. This slide tracks customer click through rates for content blog which helps identify reasons for low performance such as broken links, low content visibility etc.
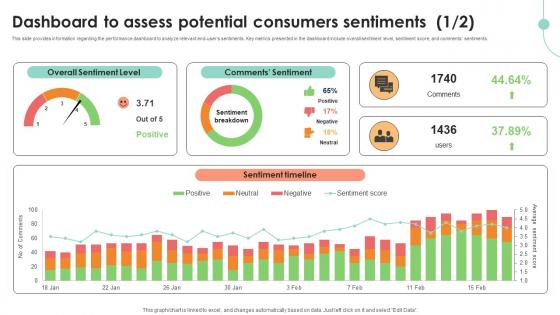
Dashboard To Assess Potential Consumers Decoding User Emotions In Depth Exploration AI SS V
This slide provides information regarding the performance dashboard to analyze relevant end-users sentiments. Key metrics presented in the dashboard include overall sentiment level, sentiment score, and comments sentiments. Do you have an important presentation coming up Are you looking for something that will make your presentation stand out from the rest Look no further than Dashboard To Assess Potential Consumers Decoding User Emotions In Depth Exploration AI SS V. With our professional designs, you can trust that your presentation will pop and make delivering it a smooth process. And with Slidegeeks, you can trust that your presentation will be unique and memorable. So why wait Grab Dashboard To Assess Potential Consumers Decoding User Emotions In Depth Exploration AI SS V today and make your presentation stand out from the rest This slide provides information regarding the performance dashboard to analyze relevant end-users sentiments. Key metrics presented in the dashboard include overall sentiment level, sentiment score, and comments sentiments.
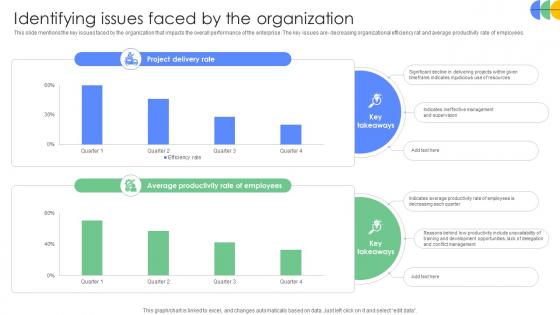
Driving Results Designing A Team Identifying Issues Faced By The Organization
This slide mentions the key issues faced by the organization that impacts the overall performance of the enterprise. The key issues are- decreasing organizational efficiency rat and average productivity rate of employees. Find highly impressive Driving Results Designing A Team Identifying Issues Faced By The Organization on Slidegeeks to deliver a meaningful presentation. You can save an ample amount of time using these presentation templates. No need to worry to prepare everything from scratch because Slidegeeks experts have already done a huge research and work for you. You need to download Driving Results Designing A Team Identifying Issues Faced By The Organization for your upcoming presentation. All the presentation templates are 100 percent editable and you can change the color and personalize the content accordingly. Download now This slide mentions the key issues faced by the organization that impacts the overall performance of the enterprise. The key issues are- decreasing organizational efficiency rat and average productivity rate of employees.
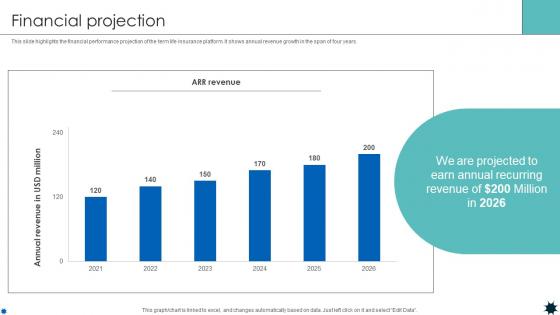
Financial Projection Life Coverage Platform Pitch Deck
This slide highlights the financial performance projection of the term life insurance platform. It shows annual revenue growth in the span of four years. Slidegeeks is here to make your presentations a breeze with Financial Projection Life Coverage Platform Pitch Deck With our easy-to-use and customizable templates, you can focus on delivering your ideas rather than worrying about formatting. With a variety of designs to choose from, you are sure to find one that suits your needs. And with animations and unique photos, illustrations, and fonts, you can make your presentation pop. So whether you are giving a sales pitch or presenting to the board, make sure to check out Slidegeeks first This slide highlights the financial performance projection of the term life insurance platform. It shows annual revenue growth in the span of four years.
Marketing Tech Stack Impact Tracking Dashboard Comprehensive Guide For Marketing Technology
Following slide demonstrates performance monitoring dashboard. It includes key KPIs such as website visits, blog traffic, social share, click through rate, conversion rate, bounce rate, and impressions. Slidegeeks is here to make your presentations a breeze with Marketing Tech Stack Impact Tracking Dashboard Comprehensive Guide For Marketing Technology With our easy-to-use and customizable templates, you can focus on delivering your ideas rather than worrying about formatting. With a variety of designs to choose from, you are sure to find one that suits your needs. And with animations and unique photos, illustrations, and fonts, you can make your presentation pop. So whether you are giving a sales pitch or presenting to the board, make sure to check out Slidegeeks first Following slide demonstrates performance monitoring dashboard. It includes key KPIs such as website visits, blog traffic, social share, click through rate, conversion rate, bounce rate, and impressions.
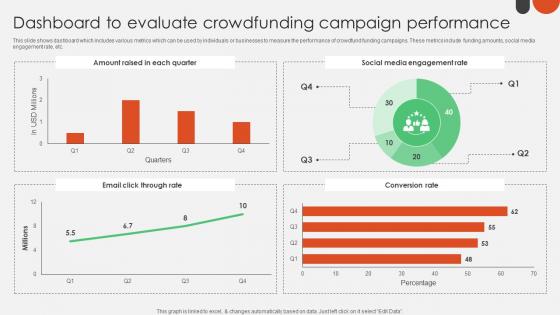
Dashboard To Evaluate Crowdfunding For Nonprofits To Support Fin SS V
This slide shows dashboard which includes various metrics which can be used by individuals or businesses to measure the performance of crowdfund funding campaigns. These metrics include funding amounts, social media engagement rate, etc. Find highly impressive Dashboard To Evaluate Crowdfunding For Nonprofits To Support Fin SS V on Slidegeeks to deliver a meaningful presentation. You can save an ample amount of time using these presentation templates. No need to worry to prepare everything from scratch because Slidegeeks experts have already done a huge research and work for you. You need to download Dashboard To Evaluate Crowdfunding For Nonprofits To Support Fin SS V for your upcoming presentation. All the presentation templates are 100 percent editable and you can change the color and personalize the content accordingly. Download now This slide shows dashboard which includes various metrics which can be used by individuals or businesses to measure the performance of crowdfund funding campaigns. These metrics include funding amounts, social media engagement rate, etc.

Graph Illustrating Impact Of Prescriptive Analytics Data Analytics SS V
This slide showcases graph highlighting impact analysis of prescriptive analytics on businesses via use of major performance indicators. It provides information total revenue, inventory levels and labour costs with key insights.Take your projects to the next level with our ultimate collection of Graph Illustrating Impact Of Prescriptive Analytics Data Analytics SS V. Slidegeeks has designed a range of layouts that are perfect for representing task or activity duration, keeping track of all your deadlines at a glance. Tailor these designs to your exact needs and give them a truly corporate look with your own brand colors they will make your projects stand out from the rest This slide showcases graph highlighting impact analysis of prescriptive analytics on businesses via use of major performance indicators. It provides information total revenue, inventory levels and labour costs with key insights.
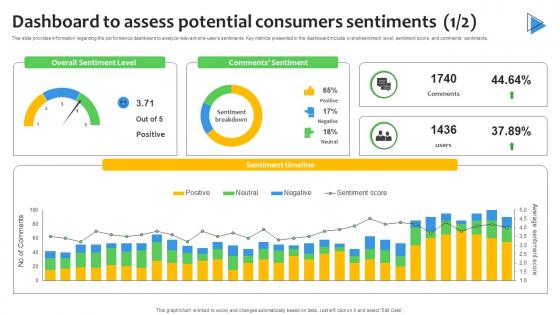
Dashboard To Assess Potential Consumers Sentiment Analysis Demystified Understanding AI SS V
This slide provides information regarding the performance dashboard to analyze relevant end-users sentiments. Key metrics presented in the dashboard include overall sentiment level, sentiment score, and comments sentiments. Do you have an important presentation coming up Are you looking for something that will make your presentation stand out from the rest Look no further than Dashboard To Assess Potential Consumers Sentiment Analysis Demystified Understanding AI SS V. With our professional designs, you can trust that your presentation will pop and make delivering it a smooth process. And with Slidegeeks, you can trust that your presentation will be unique and memorable. So why wait Grab Dashboard To Assess Potential Consumers Sentiment Analysis Demystified Understanding AI SS V today and make your presentation stand out from the rest This slide provides information regarding the performance dashboard to analyze relevant end-users sentiments. Key metrics presented in the dashboard include overall sentiment level, sentiment score, and comments sentiments.
Data Breach Prevention Status Tracking Dashboard Data Fortification Strengthening Defenses
This slide represents the critical cyber security performance indicators for the organization. The key components include application health, encryption status, license consumption, windows defender, etc.Are you in need of a template that can accommodate all of your creative concepts This one is crafted professionally and can be altered to fit any style. Use it with Google Slides or PowerPoint. Include striking photographs, symbols, depictions, and other visuals. Fill, move around, or remove text boxes as desired. Test out color palettes and font mixtures. Edit and save your work, or work with colleagues. Download Data Breach Prevention Status Tracking Dashboard Data Fortification Strengthening Defenses and observe how to make your presentation outstanding. Give an impeccable presentation to your group and make your presentation unforgettable. This slide represents the critical cyber security performance indicators for the organization. The key components include application health, encryption status, license consumption, windows defender, etc.
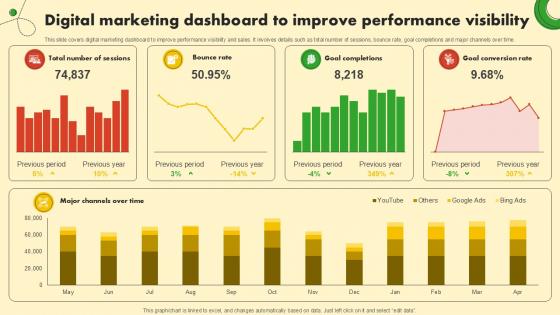
Digital Marketing Dashboard To Food And Grocery Retail Ppt Slide
This slide covers digital marketing dashboard to improve performance visibility and sales. It involves details such as total number of sessions, bounce rate, goal completions and major channels over time. Do you have an important presentation coming up Are you looking for something that will make your presentation stand out from the rest Look no further than Digital Marketing Dashboard To Food And Grocery Retail Ppt Slide. With our professional designs, you can trust that your presentation will pop and make delivering it a smooth process. And with Slidegeeks, you can trust that your presentation will be unique and memorable. So why wait Grab Digital Marketing Dashboard To Food And Grocery Retail Ppt Slide today and make your presentation stand out from the rest This slide covers digital marketing dashboard to improve performance visibility and sales. It involves details such as total number of sessions, bounce rate, goal completions and major channels over time.
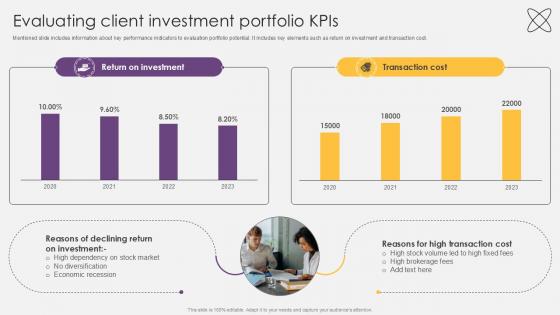
Evaluating Client Investment Portfolio KPIs Investment Fund PPT Presentation
Mentioned slide includes information about key performance indicators to evaluation portfolio potential.It includes key elements such as return on investment and transaction cost. Find highly impressive Evaluating Client Investment Portfolio KPIs Investment Fund PPT Presentation on Slidegeeks to deliver a meaningful presentation. You can save an ample amount of time using these presentation templates. No need to worry to prepare everything from scratch because Slidegeeks experts have already done a huge research and work for you. You need to download Evaluating Client Investment Portfolio KPIs Investment Fund PPT Presentation for your upcoming presentation. All the presentation templates are 100 percent editable and you can change the color and personalize the content accordingly. Download now Mentioned slide includes information about key performance indicators to evaluation portfolio potential.It includes key elements such as return on investment and transaction cost.

Impact Of Portfolio Expansion Of Returns And Cost Investment Fund PPT Example
Mentioned slide includes information about key performance indicators to evaluate portfolio potential.It includes key elements such as return on investment and transaction cost. Formulating a presentation can take up a lot of effort and time, so the content and message should always be the primary focus. The visuals of the PowerPoint can enhance the presenters message, so our Impact Of Portfolio Expansion Of Returns And Cost Investment Fund PPT Example was created to help save time. Instead of worrying about the design, the presenter can concentrate on the message while our designers work on creating the ideal templates for whatever situation is needed. Slidegeeks has experts for everything from amazing designs to valuable content, we have put everything into Impact Of Portfolio Expansion Of Returns And Cost Investment Fund PPT Example Mentioned slide includes information about key performance indicators to evaluate portfolio potential.It includes key elements such as return on investment and transaction cost.

Tata Motors Finance Luxury Automobile Vehicles PPT PowerPoint CP SS V
This slide showcases the Tata motors finance segments. It includes elements such as percentage share of consolidated revenues, FY22 performance review and focus areas. Slidegeeks is here to make your presentations a breeze with Tata Motors Finance Luxury Automobile Vehicles PPT PowerPoint CP SS V With our easy-to-use and customizable templates, you can focus on delivering your ideas rather than worrying about formatting. With a variety of designs to choose from, you are sure to find one that suits your needs. And with animations and unique photos, illustrations, and fonts, you can make your presentation pop. So whether you are giving a sales pitch or presenting to the board, make sure to check out Slidegeeks first This slide showcases the Tata motors finance segments. It includes elements such as percentage share of consolidated revenues, FY22 performance review and focus areas.
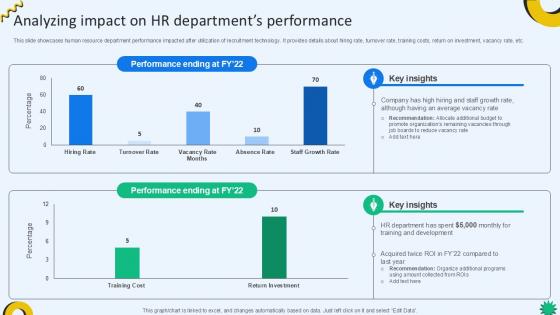
Analyzing Impact On HR Departments Cloud Recruiting Technologies PPT Template
This slide showcases human resource department performance impacted after utilization of recruitment technology. It provides details about hiring rate, turnover rate, training costs, return on investment, vacancy rate, etc. Boost your pitch with our creative Analyzing Impact On HR Departments Cloud Recruiting Technologies PPT Template. Deliver an awe-inspiring pitch that will mesmerize everyone. Using these presentation templates you will surely catch everyones attention. You can browse the ppts collection on our website. We have researchers who are experts at creating the right content for the templates. So you do not have to invest time in any additional work. Just grab the template now and use them. This slide showcases human resource department performance impacted after utilization of recruitment technology. It provides details about hiring rate, turnover rate, training costs, return on investment, vacancy rate, etc.
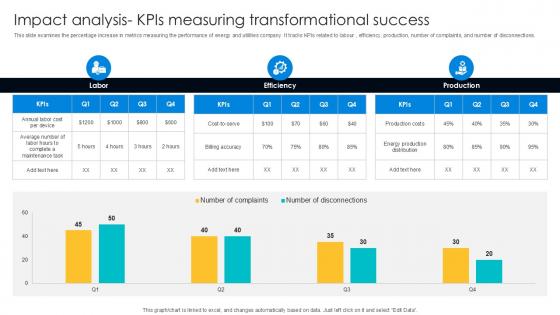
Impact Analysis KPIs Measuring Digital Transformation Journey PPT Presentation DT SS V
This slide examines the percentage increase in metrics measuring the performance of energy and utilities company. It tracks KPIs related to labour , efficiency, production, number of complaints, and number of disconnections. The Impact Analysis KPIs Measuring Digital Transformation Journey PPT Presentation DT SS V is a compilation of the most recent design trends as a series of slides. It is suitable for any subject or industry presentation, containing attractive visuals and photo spots for businesses to clearly express their messages. This template contains a variety of slides for the user to input data, such as structures to contrast two elements, bullet points, and slides for written information. Slidegeeks is prepared to create an impression. This slide examines the percentage increase in metrics measuring the performance of energy and utilities company. It tracks KPIs related to labour , efficiency, production, number of complaints, and number of disconnections.
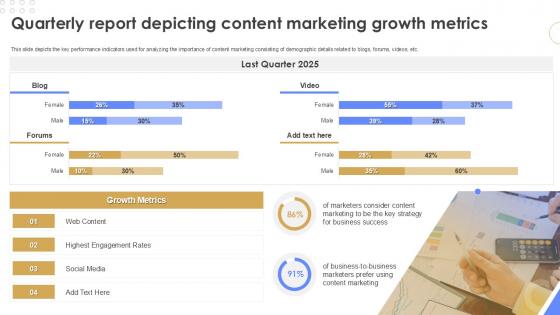
Quarterly Report Depicting Content Marketing Growth Metrics Quarterly Report Ppt Example
This slide depicts the key performance indicators used for analyzing the importance of content marketing consisting of demographic details related to blogs, forums, videos, etc. Slidegeeks is here to make your presentations a breeze with Quarterly Report Depicting Content Marketing Growth Metrics Quarterly Report Ppt Example With our easy-to-use and customizable templates, you can focus on delivering your ideas rather than worrying about formatting. With a variety of designs to choose from, you are sure to find one that suits your needs. And with animations and unique photos, illustrations, and fonts, you can make your presentation pop. So whether you are giving a sales pitch or presenting to the board, make sure to check out Slidegeeks first This slide depicts the key performance indicators used for analyzing the importance of content marketing consisting of demographic details related to blogs, forums, videos, etc.
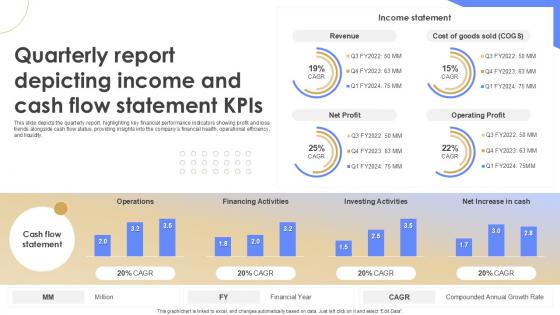
Quarterly Report Depicting Income And Cash Flow Statement KPIS Quarterly Report Ppt Example
This slide depicts the quarterly report, highlighting key financial performance indicators showing profit and loss trends alongside cash flow status, providing insights into the companys financial health, operational efficiency, and liquidity. Do you have an important presentation coming up Are you looking for something that will make your presentation stand out from the rest Look no further than Quarterly Report Depicting Income And Cash Flow Statement KPIS Quarterly Report Ppt Example With our professional designs, you can trust that your presentation will pop and make delivering it a smooth process. And with Slidegeeks, you can trust that your presentation will be unique and memorable. So why wait Grab Quarterly Report Depicting Income And Cash Flow Statement KPIS Quarterly Report Ppt Example today and make your presentation stand out from the rest This slide depicts the quarterly report, highlighting key financial performance indicators showing profit and loss trends alongside cash flow status, providing insights into the companys financial health, operational efficiency, and liquidity.
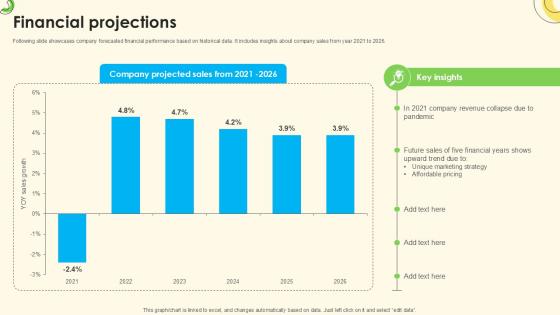
Financial Projections Sales Pitch Deck For Online Retail Ppt Powerpoint
Following slide showcases company forecasted financial performance based on historical data. It includes insights about company sales from year 2021 to 2026. Coming up with a presentation necessitates that the majority of the effort goes into the content and the message you intend to convey. The visuals of a PowerPoint presentation can only be effective if it supplements and supports the story that is being told. Keeping this in mind our experts created Financial Projections Sales Pitch Deck For Online Retail Ppt Powerpoint to reduce the time that goes into designing the presentation. This way, you can concentrate on the message while our designers take care of providing you with the right template for the situation. Following slide showcases company forecasted financial performance based on historical data. It includes insights about company sales from year 2021 to 2026.
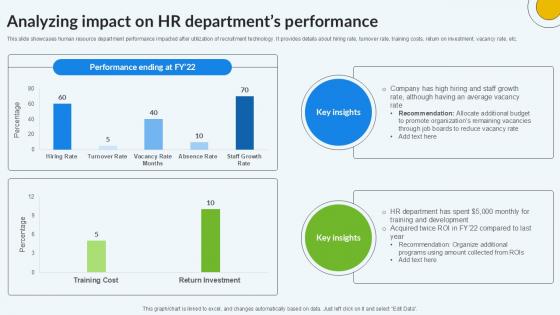
Analyzing Impact On HR Departments Enhancing Recruitment Process PPT Presentation
This slide showcases human resource department performance impacted after utilization of recruitment technology. It provides details about hiring rate, turnover rate, training costs, return on investment, vacancy rate, etc. Boost your pitch with our creative Analyzing Impact On HR Departments Enhancing Recruitment Process PPT Presentation. Deliver an awe-inspiring pitch that will mesmerize everyone. Using these presentation templates you will surely catch everyones attention. You can browse the ppts collection on our website. We have researchers who are experts at creating the right content for the templates. So you do not have to invest time in any additional work. Just grab the template now and use them. This slide showcases human resource department performance impacted after utilization of recruitment technology. It provides details about hiring rate, turnover rate, training costs, return on investment, vacancy rate, etc.


 Continue with Email

 Home
Home


