Performance Plan
Software Developer Playbook Kpi Dashboard For Tracking Project Team Performance Guidelines PDF
Following slide illustrates performance monitoring dashboard that can be used by managers to track their developers team efficiency. It also includes details about billable and non-billable hours along with task summary. Deliver an awe inspiring pitch with this creative software developer playbook kpi dashboard for tracking project team performance guidelines pdf bundle. Topics like task milestone, employee productivity, estimated time, actual time can be discussed with this completely editable template. It is available for immediate download depending on the needs and requirements of the user.
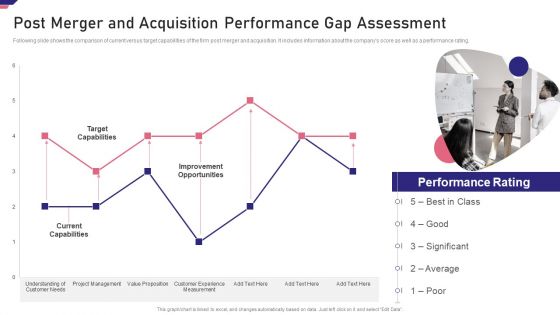
Mergers Acquisition Playbook Mergers Acquisition Playbook Post Merger Acquisition Performance Designs PDF
Following slide shows the comparison of current versus target capabilities of the firm post merger and acquisition. It includes information about the companys score as well as a performance rating.Deliver and pitch your topic in the best possible manner with this Mergers Acquisition Playbook Mergers Acquisition Playbook Post Merger Acquisition Performance Designs PDF Use them to share invaluable insights on Current Capabilities, Improvement Opportunities, Target Capabilities and impress your audience. This template can be altered and modified as per your expectations. So, grab it now.
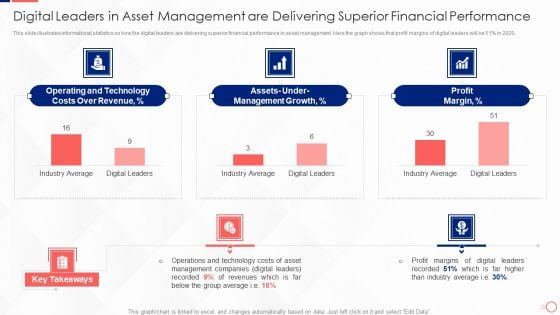
Digital Leaders In Asset Management Are Delivering Superior Financial Performance Structure PDF
This slide illustrates informational statistics on how the digital leaders are delivering superior financial performance in asset management. Here the graph shows that profit margins of digital leaders will be 51 percent in 2020. Deliver an awe inspiring pitch with this creative Digital Leaders In Asset Management Are Delivering Superior Financial Performance Structure PDF bundle. Topics like Operating And Technology, Management Growth, Profit Margin can be discussed with this completely editable template. It is available for immediate download depending on the needs and requirements of the user.
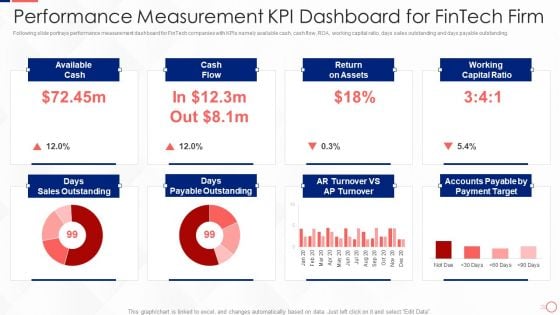
Investing In Tech Innovation Performance Measurement Kpi Dashboard For Fintech Firm Mockup PDF
Following slide portrays performance measurement dashboard for FinTech companies with KPIs namely available cash, cash flow, ROA, working capital ratio, days sales outstanding and days payable outstanding. Deliver and pitch your topic in the best possible manner with this Investing In Tech Innovation Performance Measurement Kpi Dashboard For Fintech Firm Mockup PDF. Use them to share invaluable insights on Available Cash, Cash Flow, Return on Assets, Working Capital Ratio and impress your audience. This template can be altered and modified as per your expectations. So, grab it now.
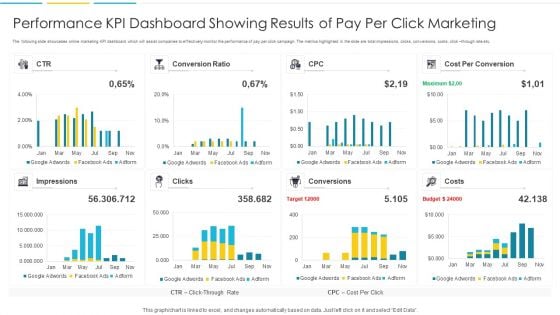
Performance KPI Dashboard Showing Results Of Pay Per Click Marketing Portrait PDF
The following slide showcases online marketing KPI dashboard which will assist companies to effectively monitor the performance of pay per click campaign. The metrics highlighted in the slide are total impressions, clicks, conversions, costs, click through rate etc. Pitch your topic with ease and precision using this Performance KPI Dashboard Showing Results Of Pay Per Click Marketing Portrait PDF. This layout presents information on Impressions, Target, Budget. It is also available for immediate download and adjustment. So, changes can be made in the color, design, graphics or any other component to create a unique layout.
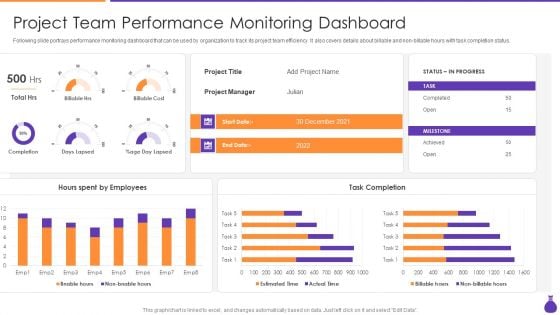
Why Is Agile Cost Effective IT Project Team Performance Monitoring Dashboard Sample PDF
Following slide portrays performance monitoring dashboard that can be used by organization to track its project team efficiency. It also covers details about billable and non-billable hours with task completion status. Deliver and pitch your topic in the best possible manner with this Why Is Agile Cost Effective IT Project Team Performance Monitoring Dashboard Sample PDF. Use them to share invaluable insights on Completion, Days Lapsed, Days Lapsed, Hours Spent By Employees and impress your audience. This template can be altered and modified as per your expectations. So, grab it now.
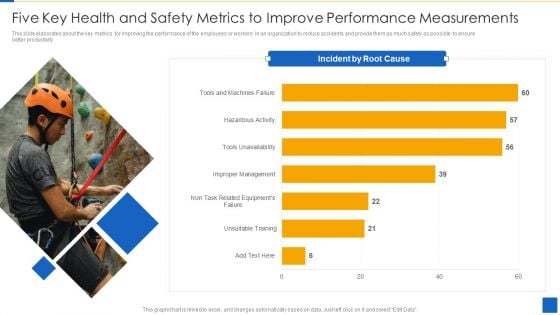
Five Key Health And Safety Metrics To Improve Performance Measurements Brochure PDF
This slide elaborates about the key metrics for improving the performance of the employees or workers in an organization to reduce accidents and provide them as much safety as possible to ensure better productivity.Showcasing this set of slides titled Five Key Health And Safety Metrics To Improve Performance Measurements Brochure PDF The topics addressed in these templates are Incidents Root Cause, Unsuitable Training, Improper Management All the content presented in this PPT design is completely editable. Download it and make adjustments in color, background, font etc. as per your unique business setting.
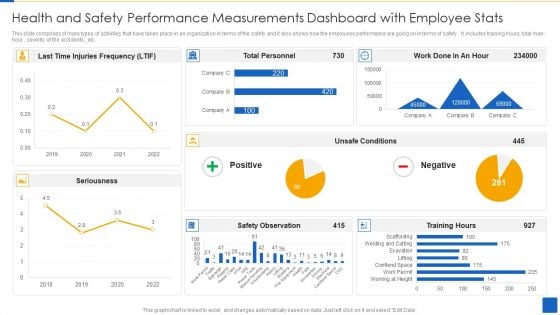
Health And Safety Performance Measurements Dashboard With Employee Stats Template PDF
This slide comprises of many types of activities that have taken place in an organization in terms of the safety and it also shows how the employees performance are going on in terms of safety . It includes training hours, total man-hour , severity of the accidents , etc.Pitch your topic with ease and precision using this Health And Safety Performance Measurements Dashboard With Employee Stats Template PDF This layout presents information on Safety Observation, Injuries Frequency, Unsafe Conditions It is also available for immediate download and adjustment. So, changes can be made in the color, design, graphics or any other component to create a unique layout.
BANT Sales Lead Qualification Model Analyzing And Understanding The Performance Icons PDF
Purpose of the following slide is to show the key performance indicators of the current sales process, the provided displays KPIs such as customer acquired, CAC, volume per customer etc. Deliver and pitch your topic in the best possible manner with this BANT Sales Lead Qualification Model Analyzing And Understanding The Performance Icons PDF. Use them to share invaluable insights on New Customer, Weekly Sales, Revenues Sales and impress your audience. This template can be altered and modified as per your expectations. So, grab it now.
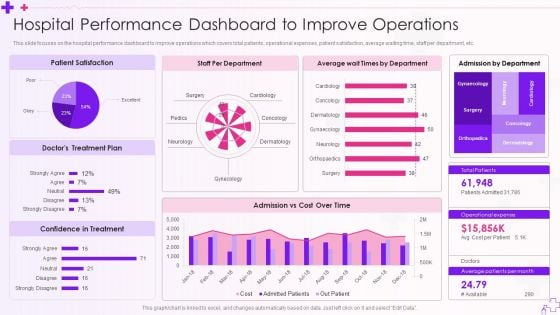
Integration Of Healthcare Center Administration System Hospital Performance Dashboard To Improve Operations Microsoft PDF
This slide focuses on the hospital performance dashboard to improve operations which covers total patients, operational expenses, patient satisfaction, average waiting time, staff per department, etc.Deliver and pitch your topic in the best possible manner with this Integration Of Healthcare Center Administration System Hospital Performance Dashboard To Improve Operations Microsoft PDF Use them to share invaluable insights on Patient Satisfaction, Confidence In Treatment, Admission By Department and impress your audience. This template can be altered and modified as per your expectations. So, grab it now.
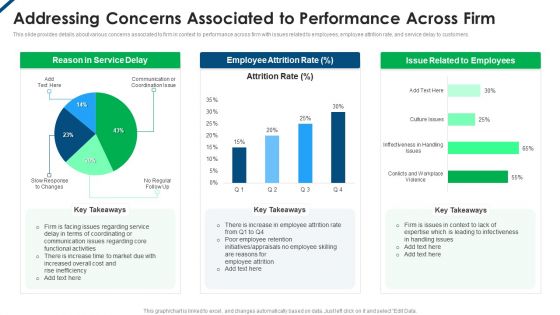
Contents Employee Productivity Management Addressing Concerns Associated To Performance Across Firm Information PDF
This slide provides details about various concerns associated to firm in context to performance across firm with issues related to employees, employee attrition rate, and service delay to customers.Deliver and pitch your topic in the best possible manner with this Contents Employee Productivity Management Addressing Concerns Associated To Performance Across Firm Information PDF Use them to share invaluable insights on Reason Service, Employee Attrition, Related Employees and impress your audience. This template can be altered and modified as per your expectations. So, grab it now.
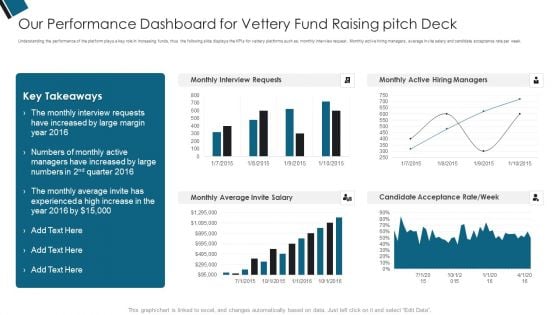
Our Performance Dashboard For Vettery Fund Raising Pitch Deck Ppt PowerPoint Presentation Professional Background PDF
Understanding the performance of the platform plays a key role in increasing funds, thus the following slide displays the KPIs for vettery platforms such as monthly interview request , Monthly active hiring managers, average invite salary and candidate acceptance rate per week. Deliver an awe inspiring pitch with this creative Our Performance Dashboard For Vettery Fund Raising Pitch Deck Ppt PowerPoint Presentation Professional Background PDF bundle. Topics like Monthly Interview, Managers Increased, Experienced A High can be discussed with this completely editable template. It is available for immediate download depending on the needs and requirements of the user.
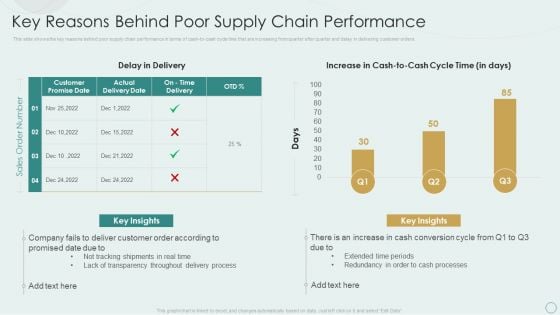
Learning Various Supply Chain Models Key Reasons Behind Poor Supply Chain Performance Guidelines PDF
This slide shows the key reasons behind poor supply chain performance in terms of cash-to-cash cycle time that are increasing from quarter after quarter and delay in delivering customer orders. Deliver and pitch your topic in the best possible manner with this Learning Various Supply Chain Models Key Reasons Behind Poor Supply Chain Performance Guidelines PDF. Use them to share invaluable insights on Delay Delivery, Extended Time Periods, Real Time and impress your audience. This template can be altered and modified as per your expectations. So, grab it now.
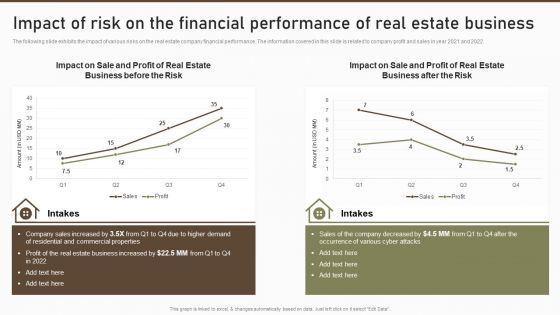
Impact Of Risk On The Financial Performance Of Real Estate Business Summary PDF
The following slide exhibits the impact of various risks on the real estate company financial performance. The information covered in this slide is related to company profit and sales in year 2021 and 2022. Deliver and pitch your topic in the best possible manner with this Impact Of Risk On The Financial Performance Of Real Estate Business Summary PDF. Use them to share invaluable insights on Commercial Properties, Estate Business, Real Estate and impress your audience. This template can be altered and modified as per your expectations. So, grab it now.
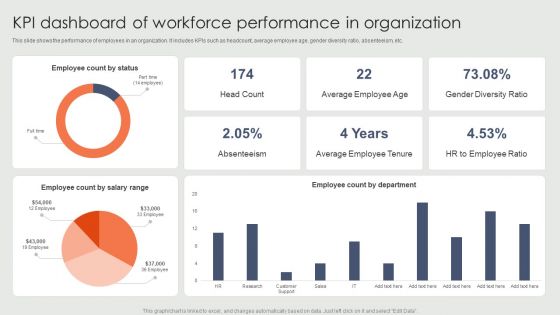
KPI Dashboard Of Workforce Performance In Organization Ppt Gallery Portfolio PDF
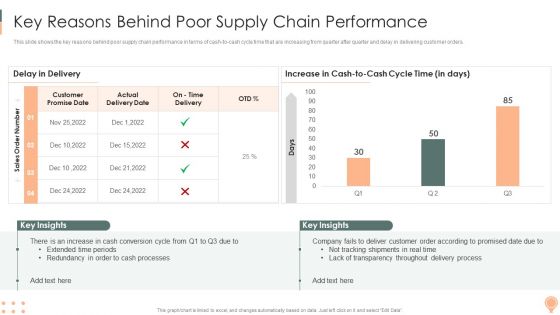
Supply Chain Approaches Key Reasons Behind Poorsupply Chain Performance Rules PDF
This slide shows the key reasons behind poor supply chain performance in terms of cash to cash cycle time that are increasing from quarter after quarter and delay in delivering customer orders.Deliver and pitch your topic in the best possible manner with this Supply Chain Approaches Key Reasons Behind Poorsupply Chain Performance Rules PDF. Use them to share invaluable insights on Customer Promise, Extended Time, Redundancy Cash and impress your audience. This template can be altered and modified as per your expectations. So, grab it now.
Online Customer Interaction Dashboard For Tracking Customer Service Team Performance Infographics PDF
This slide covers the KPI dashboard for analyzing the performance of client support department. It includes metrics such as first call resolution, unresolved calls, average response rate, the best day to call, average time to solve issues, etc. Deliver and pitch your topic in the best possible manner with this Online Customer Interaction Dashboard For Tracking Customer Service Team Performance Infographics PDF. Use them to share invaluable insights on Response Time, Issue Solving, Call Resolution and impress your audience. This template can be altered and modified as per your expectations. So, grab it now.
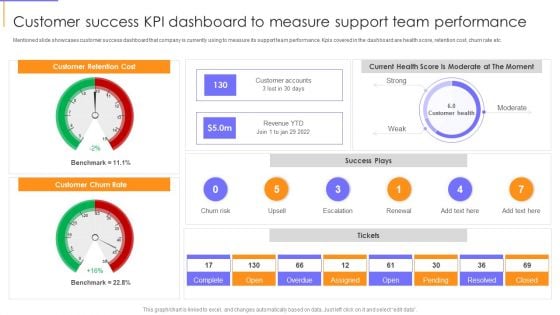
Guide To Client Success Customer Success KPI Dashboard To Measure Support Team Performance Topics PDF
Mentioned slide showcases customer success dashboard that company is currently using to measure its support team performance. Kpis covered in the dashboard are health score, retention cost, churn rate etc. Deliver an awe inspiring pitch with this creative Guide To Client Success Customer Success KPI Dashboard To Measure Support Team Performance Topics PDF bundle. Topics like Customer Churn Rate, Customer Retention Cost, Revenue can be discussed with this completely editable template. It is available for immediate download depending on the needs and requirements of the user.
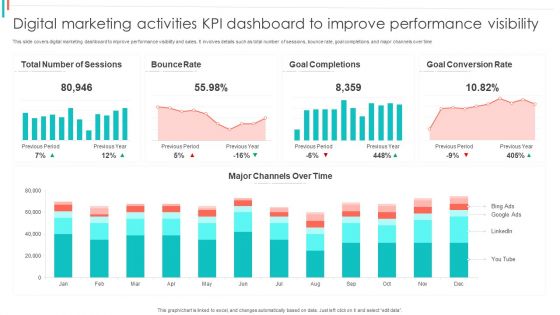
Digital Marketing Activities KPI Dashboard To Improve Performance Visibility Summary PDF
This slide covers digital marketing dashboard to improve performance visibility and sales. It involves details such as total number of sessions, bounce rate, goal completions and major channels over time.Showcasing this set of slides titled Digital Marketing Activities KPI Dashboard To Improve Performance Visibility Summary PDF. The topics addressed in these templates are Bounce Rate, Goal Completions, Goal Conversion. All the content presented in this PPT design is completely editable. Download it and make adjustments in color, background, font etc. as per your unique business setting.
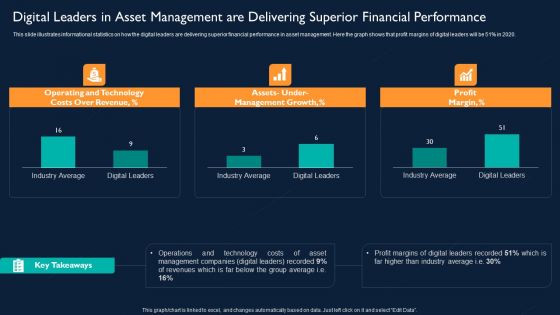
Digital Leaders In Asset Management Are Delivering Superior Financial Performance Designs PDF
This slide illustrates informational statistics on how the digital leaders are delivering superior financial performance in asset management. Here the graph shows that profit margins of digital leaders will be 51 percentage in 2020. Deliver and pitch your topic in the best possible manner with this Digital Leaders In Asset Management Are Delivering Superior Financial Performance Designs PDF. Use them to share invaluable insights on Operating And Technology Costs, Management Growth, Profit Margin and impress your audience. This template can be altered and modified as per your expectations. So, grab it now.
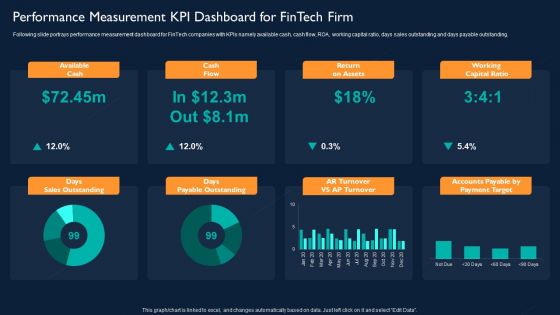
Technology Investment To Enhance Business Growth Performance Measurement KPI Dashboard For Fintech Firm Slides PDF
Following slide portrays performance measurement dashboard for FinTech companies with KPIs namely available cash, cash flow, ROA, working capital ratio, days sales outstanding and days payable outstanding. Deliver an awe inspiring pitch with this creative Technology Investment To Enhance Business Growth Performance Measurement KPI Dashboard For Fintech Firm Slides PDF bundle. Topics like Available Cash, Cash Flow, Return On Assets, Working Capital Ratio can be discussed with this completely editable template. It is available for immediate download depending on the needs and requirements of the user.
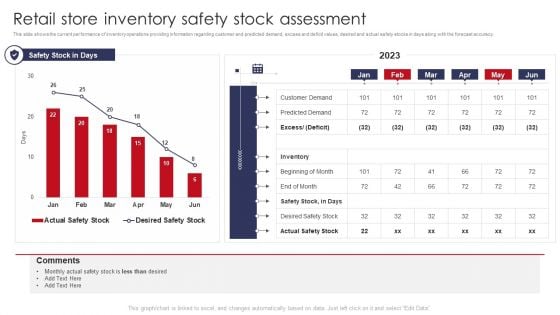
Retail Store Inventory Safety Stock Assessment Retail Outlet Operations Performance Evaluation Graphics PDF
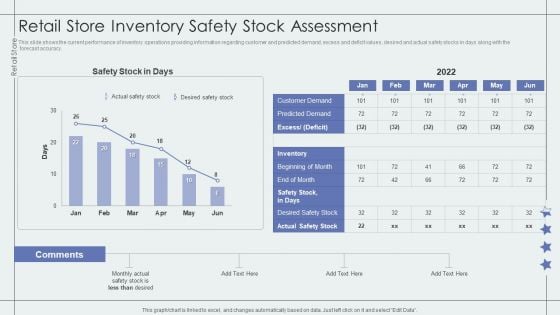
This slide shows the current performance of inventory operations providing information regarding customer and predicted demand, excess and deficit values, desired and actual safety stocks in days along with the forecast accuracy.Deliver and pitch your topic in the best possible manner with this Retail Store Inventory Safety Stock Assessment Retail Outlet Operations Performance Evaluation Graphics PDF. Use them to share invaluable insights on Predicted Demand, Customer Demand, Beginning and impress your audience. This template can be altered and modified as per your expectations. So, grab it now.
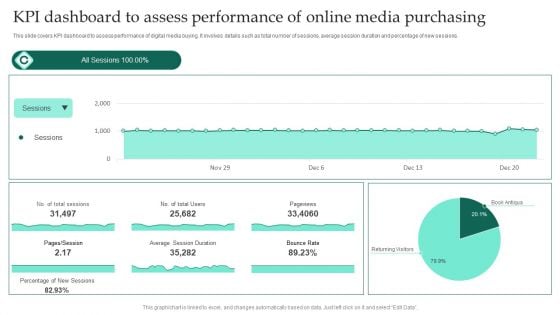
KPI Dashboard To Assess Performance Of Online Media Purchasing Ppt Professional Grid PDF
This slide covers KPI dashboard to assess performance of digital media buying. It involves details such as total number of sessions, average session duration and percentage of new sessions. Showcasing this set of slides titled KPI Dashboard To Assess Performance Of Online Media Purchasing Ppt Professional Grid PDF. The topics addressed in these templates are Average Session Duration, Bounce Rate, Pageviews. All the content presented in this PPT design is completely editable. Download it and make adjustments in color, background, font etc. as per your unique business setting.
Virtual Assets Investment Guide Understanding The Historical Performance Of Bitcoin Pictures PDF
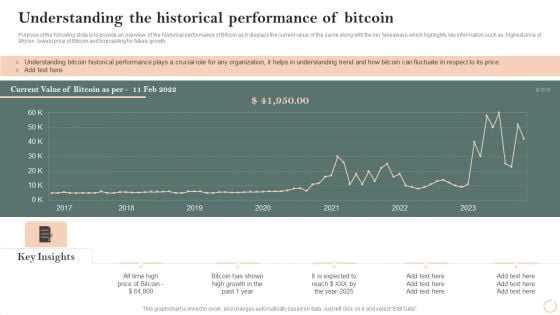
Purpose of the following slide is to provide an overview of the historical performance of Bitcoin as it displays the current value of the same along with the key takeaways which highlights key information such as highest price of Bitcoin, lowest price of Bitcoin and forecasting for future growth. Deliver and pitch your topic in the best possible manner with this Virtual Assets Investment Guide Understanding The Historical Performance Of Bitcoin Pictures PDF. Use them to share invaluable insights on Current Value, 2017 To 2023, High Price and impress your audience. This template can be altered and modified as per your expectations. So, grab it now.

Virtual Currency Investment Guide For Companies Understanding The Historical Performance Of Bitcoin Formats PDF
Purpose of the following slide is to provide an overview of the historical performance of Bitcoin as it displays the current value of the same along with the key takeaways which highlights key information such as highest price of Bitcoin, lowest price of Bitcoin and forecasting for future growth. Deliver an awe inspiring pitch with this creative Virtual Currency Investment Guide For Companies Understanding The Historical Performance Of Bitcoin Formats PDF bundle. Topics like Current Value, Bitcoin As Per, 2016 To 2022 can be discussed with this completely editable template. It is available for immediate download depending on the needs and requirements of the user.
Key Company Financial Operation Performance Metrics Ppt Infographic Template Example Introduction PDF
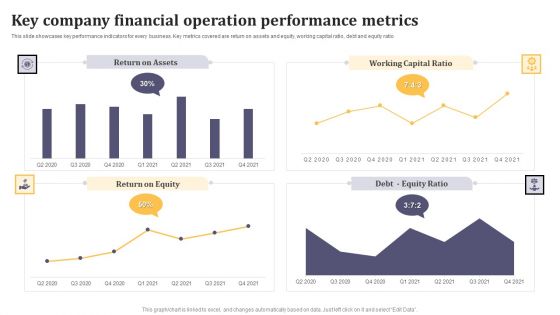
This slide showcases key performance indicators for every business. Key metrics covered are return on assets and equity, working capital ratio, debt and equity ratio. Showcasing this set of slides titled Key Company Financial Operation Performance Metrics Ppt Infographic Template Example Introduction PDF. The topics addressed in these templates are Return on Assets, Working Capital Ratio, Return on Equity. All the content presented in this PPT design is completely editable. Download it and make adjustments in color, background, font etc. as per your unique business setting.
Retail Store Inventory Safety Stock Assessment Retail Outlet Performance Assessment Themes PDF
This slide shows the current performance of inventory operations providing information regarding customer and predicted demand, excess and deficit values, desired and actual safety stocks in days along with the forecast accuracy.Deliver and pitch your topic in the best possible manner with this Retail Store Inventory Safety Stock Assessment Retail Outlet Performance Assessment Themes PDF. Use them to share invaluable insights on Customer Demand, Predicted Demand, Actual Safety and impress your audience. This template can be altered and modified as per your expectations. So, grab it now.
Vendor Management To Handle Purchase Impact Analysis Of Vendors Performance Improvement Designs PDF
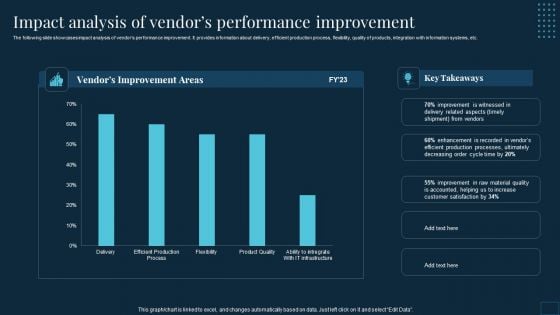
The following slide showcases impact analysis of vendors performance improvement. It provides information about delivery, efficient production process, flexibility, quality of products, integration with information systems, etc. Deliver and pitch your topic in the best possible manner with this Vendor Management To Handle Purchase Impact Analysis Of Vendors Performance Improvement Designs PDF. Use them to share invaluable insights on Improvement Areas, Improvement Witnessed, Production Processes and impress your audience. This template can be altered and modified as per your expectations. So, grab it now.
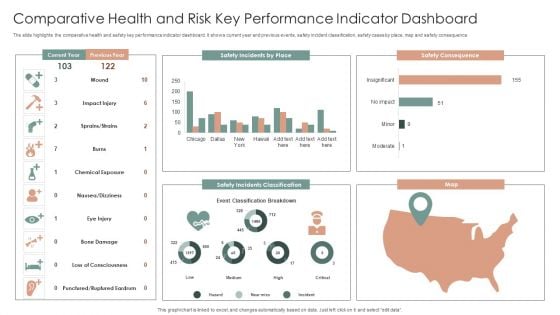
Comparative Health And Risk Key Performance Indicator Dashboard Ppt Portfolio Slide PDF
The slide highlights the comparative health and safety key performance indicator dashboard. It shows current year and previous events, safety incident classification, safety cases by place, map and safety consequence. Showcasing this set of slides titled Comparative Health And Risk Key Performance Indicator Dashboard Ppt Portfolio Slide PDF. The topics addressed in these templates are Safety Consequence, Safety Incidents Classification, Map. All the content presented in this PPT design is completely editable. Download it and make adjustments in color, background, font etc. as per your unique business setting.
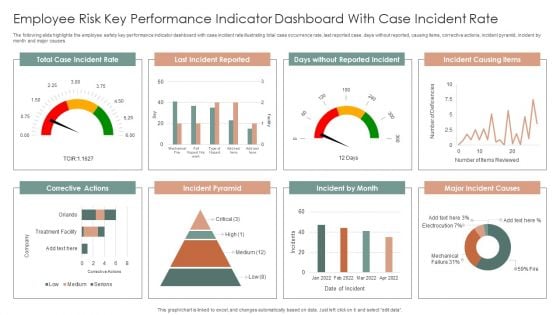
Employee Risk Key Performance Indicator Dashboard With Case Incident Rate Ppt Professional Information PDF
The following slide highlights the employee safety key performance indicator dashboard with case incident rate illustrating total case occurrence rate, last reported case, days without reported, causing items, corrective actions, incident pyramid, incident by month and major causes. Pitch your topic with ease and precision using this Employee Risk Key Performance Indicator Dashboard With Case Incident Rate Ppt Professional Information PDF. This layout presents information on Total Case, Incident Rate, Last Incident Reported, Incident Causing Items. It is also available for immediate download and adjustment. So, changes can be made in the color, design, graphics or any other component to create a unique layout.
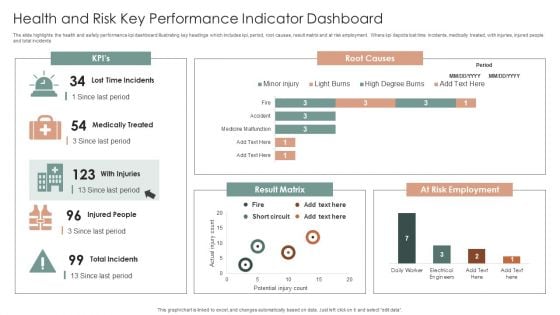
Health And Risk Key Performance Indicator Dashboard Ppt Layouts Graphics Design PDF
The slide highlights the health and safety performance kpi dashboard illustrating key headings which includes kpi, period, root causes, result matrix and at risk employment. Where kpi depicts lost time incidents, medically treated, with injuries, injured people and total incidents. Showcasing this set of slides titled Health And Risk Key Performance Indicator Dashboard Ppt Layouts Graphics Design PDF. The topics addressed in these templates are Root Causes, Result Matrix, At Risk Employment. All the content presented in this PPT design is completely editable. Download it and make adjustments in color, background, font etc. as per your unique business setting.
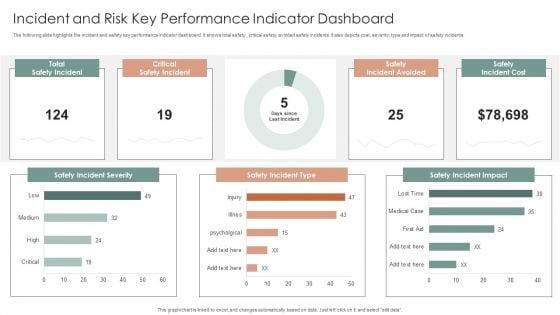
Incident And Risk Key Performance Indicator Dashboard Ppt Gallery Mockup PDF
The following slide highlights the incident and safety key performance indicator dashboard. It shows total safety, critical safety, avoided safety incidents. It also depicts cost, severity, type and impact of safety incidents. Showcasing this set of slides titled Incident And Risk Key Performance Indicator Dashboard Ppt Gallery Mockup PDF. The topics addressed in these templates are Safety Incident Severity, Safety Incident Type, Safety Incident Impact. All the content presented in this PPT design is completely editable. Download it and make adjustments in color, background, font etc. as per your unique business setting.

Patient Health And Risk Key Performance Indicator Dashboard Ppt Infographic Template Summary PDF
The following slide highlights the patient health and safety key performance indicator dashboard illustrating admission by department, admission by cost, patient satisfaction, total patients, operations cost, patient density, total staff, waiting time, treatment satisfaction and treatment confidence. Pitch your topic with ease and precision using this Patient Health And Risk Key Performance Indicator Dashboard Ppt Infographic Template Summary PDF. This layout presents information on Admission By Department, Admission Vs Cost, Patient Satisfaction. It is also available for immediate download and adjustment. So, changes can be made in the color, design, graphics or any other component to create a unique layout.
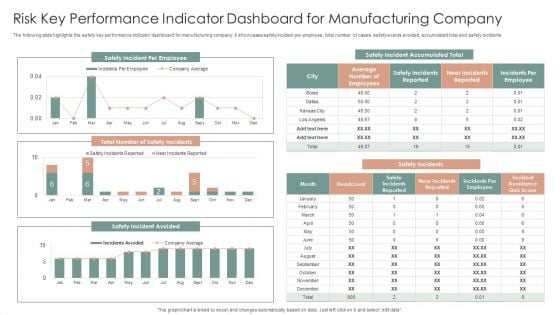
Risk Key Performance Indicator Dashboard For Manufacturing Company Ppt Gallery Graphics Design PDF
The following slide highlights the safety key performance indicator dashboard for manufacturing company. It showcases safety incident per employee, total number of cases, safety events avoided, accumulated total and safety incidents. Pitch your topic with ease and precision using this Risk Key Performance Indicator Dashboard For Manufacturing Company Ppt Gallery Graphics Design PDF. This layout presents information on Safety Incidents, Safety Incident Avoided, Safety Incident Accumulated. It is also available for immediate download and adjustment. So, changes can be made in the color, design, graphics or any other component to create a unique layout.
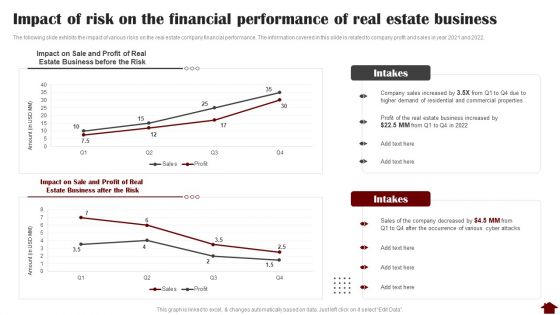
Impact Of Risk On The Financial Performance Of Real Estate Business Graphics PDF
The following slide exhibits the impact of various risks on the real estate company financial performance. The information covered in this slide is related to company profit and sales in year 2021 and 2022. Deliver an awe inspiring pitch with this creative Impact Of Risk On The Financial Performance Of Real Estate Business Graphics PDF bundle. Topics like Sale And Profit, Estate Business, Risk can be discussed with this completely editable template. It is available for immediate download depending on the needs and requirements of the user.
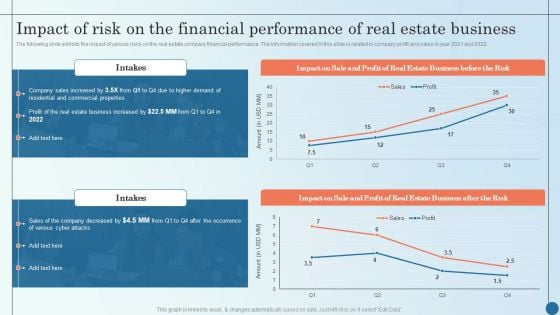
Impact Of Risk On The Financial Performance Of Real Managing Commercial Property Risks Sample PDF
The following slide exhibits the impact of various risks on the real estate company financial performance. The information covered in this slide is related to company profit and sales in year 2021 and 2022. Deliver and pitch your topic in the best possible manner with this Impact Of Risk On The Financial Performance Of Real Managing Commercial Property Risks Sample PDF. Use them to share invaluable insights on Estate Business, Business Increased, Company Decreased and impress your audience. This template can be altered and modified as per your expectations. So, grab it now.
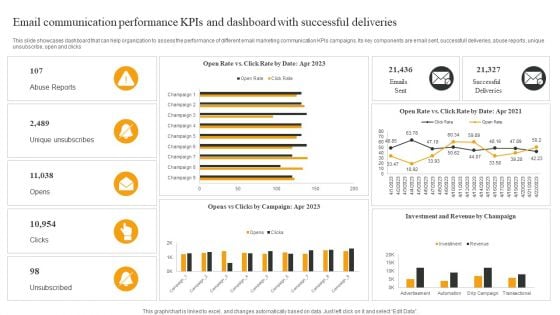
Email Communication Performance Kpis And Dashboard With Successful Deliveries Elements PDF
This slide showcases dashboard that can help organization to assess the performance of different email marketing communication KPIs campaigns. Its key components are email sent, successfull deliveries, abuse reports, unique unsubscribe, open and clicks. Showcasing this set of slides titled Email Communication Performance Kpis And Dashboard With Successful Deliveries Elements PDF. The topics addressed in these templates are Abuse Reports, Unique Unsubscribes, Opens. All the content presented in this PPT design is completely editable. Download it and make adjustments in color, background, font etc. as per your unique business setting.
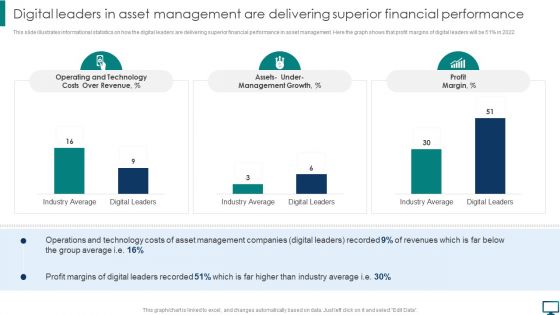
Digital Leaders In Asset Management Are Delivering Superior Financial Performance Topics PDF
This slide illustrates informational statistics on how the digital leaders are delivering superior financial performance in asset management. Here the graph shows that profit margins of digital leaders will be 51 percent in 2022. Take your projects to the next level with our ultimate collection of Digital Leaders In Asset Management Are Delivering Superior Financial Performance Topics PDF. Slidegeeks has designed a range of layouts that are perfect for representing task or activity duration, keeping track of all your deadlines at a glance. Tailor these designs to your exact needs and give them a truly corporate look with your own brand colors they will make your projects stand out from the rest.
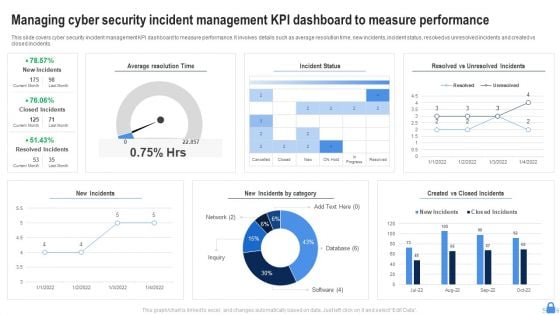
Managing Cyber Security Incident Management KPI Dashboard To Measure Performance Download PDF
This slide covers cyber security incident management KPI dashboard to measure performance. It involves details such as average resolution time, new incidents, incident status, resolved vs unresolved incidents and created vs closed incidents. Showcasing this set of slides titled Managing Cyber Security Incident Management KPI Dashboard To Measure Performance Download PDF. The topics addressed in these templates are Average Resolution Time, Incident Status, New Incidents. All the content presented in this PPT design is completely editable. Download it and make adjustments in color, background, font etc. as per your unique business setting.
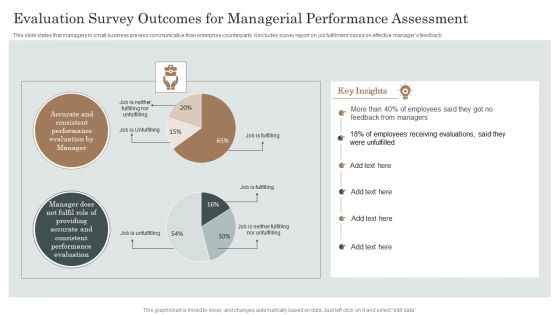
Evaluation Survey Outcomes For Managerial Performance Assessment Ppt Gallery Graphics PDF
This slide states that managers in small business are less communicative than enterprise counterparts. It includes survey report on job fulfilment based on effective managers feedback. Showcasing this set of slides titled Evaluation Survey Outcomes For Managerial Performance Assessment Ppt Gallery Graphics PDF. The topics addressed in these templates are Employees Receiving Evaluations, Feedback From Managers, Performance Evaluation. All the content presented in this PPT design is completely editable. Download it and make adjustments in color, background, font etc. as per your unique business setting.
Performance Tracking Dashboard For 5G Technology Difference Between 4G And 5G Network Introduction PDF
This slide describes the performance tracking dashboard for 5G technology by covering the details of subscribers, qoe, consumption, customer support, coverage, devices, and dimensions.Find a pre-designed and impeccable Performance Tracking Dashboard For 5G Technology Difference Between 4G And 5G Network Introduction PDF. The templates can ace your presentation without additional effort. You can download these easy-to-edit presentation templates to make your presentation stand out from others. So, what are you waiting for Download the template from Slidegeeks today and give a unique touch to your presentation.
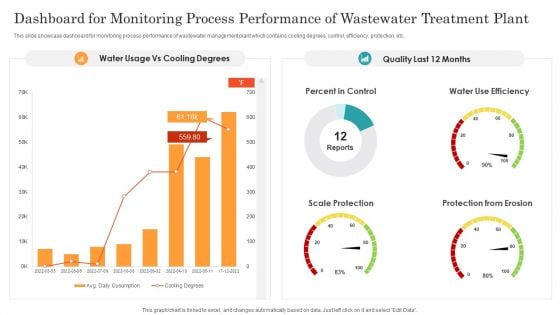
Dashboard For Monitoring Process Performance Of Wastewater Treatment Plant Ppt Infographic Template Demonstration PDF
This slide showcase dashboard for monitoring process performance of wastewater management plant which contains cooling degrees, control, efficiency, protection, etc. Showcasing this set of slides titled Dashboard For Monitoring Process Performance Of Wastewater Treatment Plant Ppt Infographic Template Demonstration PDF. The topics addressed in these templates are Percent Control, Water Use Efficiency, Scale Protection, Protection From Erosion. All the content presented in this PPT design is completely editable. Download it and make adjustments in color, background, font etc. as per your unique business setting.
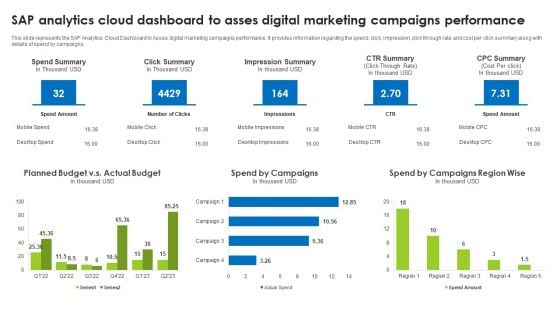
Sap Analytics Cloud Dashboard To Asses Digital Marketing Campaigns Performance Ideas PDF
This slide represents the SAP Analytics Cloud Dashboard to Asses digital marketing campaigns performance. It provides information regarding the spend, click, impression, click through rate and cost per click summary along with details of spend by campaigns. The best PPT templates are a great way to save time, energy, and resources. Slidegeeks have 100 percent editable powerpoint slides making them incredibly versatile. With these quality presentation templates, you can create a captivating and memorable presentation by combining visually appealing slides and effectively communicating your message. Download Sap Analytics Cloud Dashboard To Asses Digital Marketing Campaigns Performance Ideas PDF from Slidegeeks and deliver a wonderful presentation.
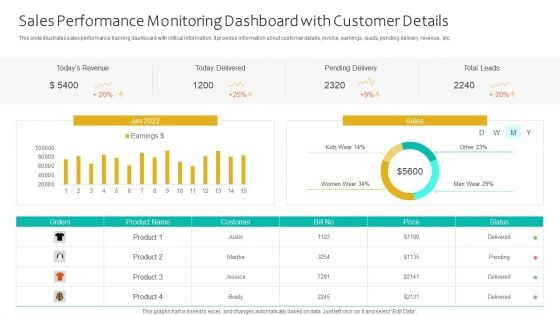
Sales Performance Monitoring Dashboard With Customer Details Ppt Infographics Themes PDF
This slide illustrates sales performance tracking dashboard with critical information. It provides information about customer details, invoice, earnings, leads, pending delivery, revenue, etc. Pitch your topic with ease and precision using this Sales Performance Monitoring Dashboard With Customer Details Ppt Infographics Themes PDF. This layout presents information on Todays Revenue, Today Delivered, Pending Delivery, Total Leads. It is also available for immediate download and adjustment. So, changes can be made in the color, design, graphics or any other component to create a unique layout.
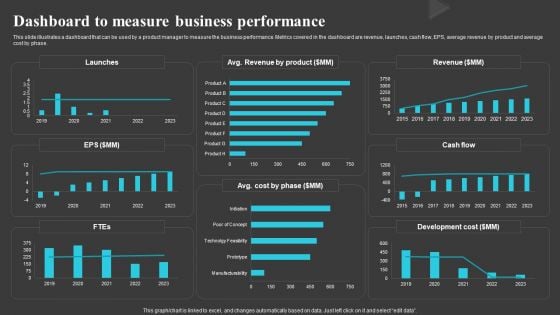
Dashboard To Measure Business Performance Creating And Offering Multiple Product Ranges In New Business Introduction PDF
This slide illustrates a dashboard that can be used by a product manager to measure the business performance. Metrics covered in the dashboard are revenue, launches, cash flow, EPS, average revenue by product and average cost by phase.There are so many reasons you need a Dashboard To Measure Business Performance Creating And Offering Multiple Product Ranges In New Business Introduction PDF. The first reason is you can notspend time making everything from scratch, Thus, Slidegeeks has made presentation templates for you too. You can easily download these templates from our website easily.
Reverse Proxy Web Server Dashboard For Reverse Proxy Performance Tracking Elements PDF
This slide represents the dashboard for reverse proxy performance tracking by covering details of CPU load, available memory, and connections. If your project calls for a presentation, then Slidegeeks is your go-to partner because we have professionally designed, easy-to-edit templates that are perfect for any presentation. After downloading, you can easily edit Reverse Proxy Web Server Dashboard For Reverse Proxy Performance Tracking Elements PDF and make the changes accordingly. You can rearrange slides or fill them with different images. Check out all the handy templates
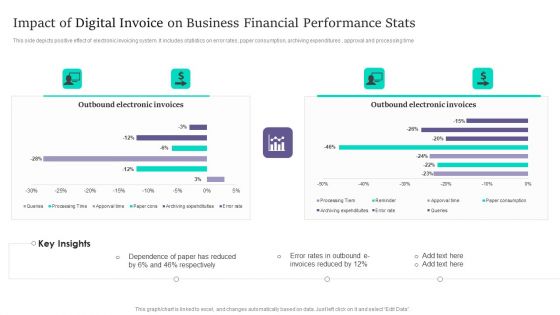
Impact Of Digital Invoice On Business Financial Performance Stats Infographics PDF
This side depicts positive effect of electronic invoicing system. It includes statistics on error rates, paper consumption, archiving expenditures , approval and processing time. Pitch your topic with ease and precision using this Impact Of Digital Invoice On Business Financial Performance Stats Infographics PDF. This layout presents information on Impact Of Digital Invoice, Business Financial Performance Stats. It is also available for immediate download and adjustment. So, changes can be made in the color, design, graphics or any other component to create a unique layout.
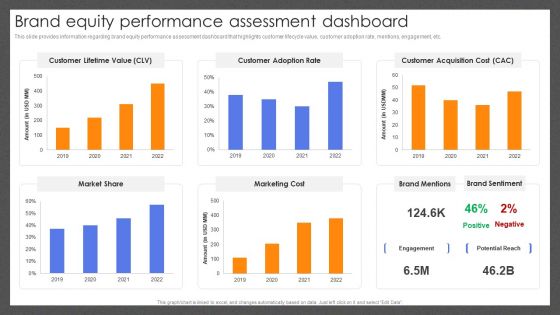
Guide For Effective Brand Brand Equity Performance Assessment Dashboard Diagrams PDF
This slide provides information regarding brand equity performance assessment dashboard that highlights customer lifecycle value, customer adoption rate, mentions, engagement, etc. Present like a pro with Guide For Effective Brand Brand Equity Performance Assessment Dashboard Diagrams PDF Create beautiful presentations together with your team, using our easy-to-use presentation slides. Share your ideas in real-time and make changes on the fly by downloading our templates. So whether youre in the office, on the go, or in a remote location, you can stay in sync with your team and present your ideas with confidence. With Slidegeeks presentation got a whole lot easier. Grab these presentations today.
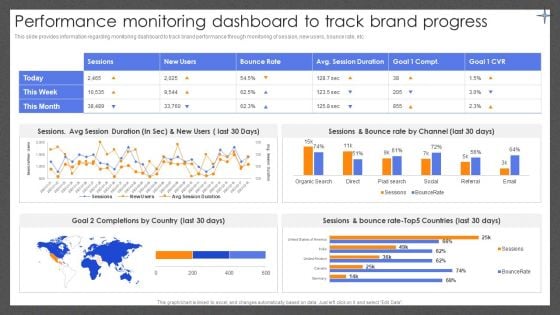
Guide For Effective Brand Performance Monitoring Dashboard To Track Brand Progress Ideas PDF
This slide provides information regarding monitoring dashboard to track brand performance through monitoring of session, new users, bounce rate, etc. Want to ace your presentation in front of a live audience Our Guide For Effective Brand Performance Monitoring Dashboard To Track Brand Progress Ideas PDF can help you do that by engaging all the users towards you. Slidegeeks experts have put their efforts and expertise into creating these impeccable powerpoint presentations so that you can communicate your ideas clearly. Moreover, all the templates are customizable, and easy-to-edit and downloadable. Use these for both personal and commercial use.
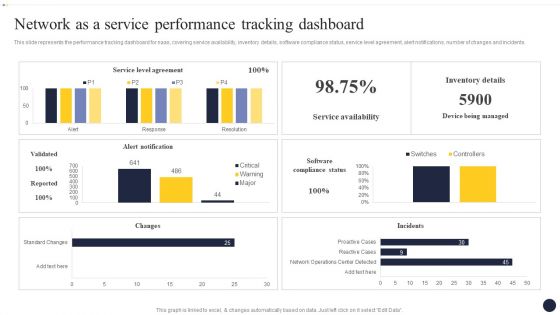
Integrating Naas Service Model To Enhance Network As A Service Performance Topics PDF
This slide represents the performance tracking dashboard for naas, covering service availability, inventory details, software compliance status, service level agreement, alert notifications, number of changes and incidents. Slidegeeks is one of the best resources for PowerPoint templates. You can download easily and regulate Integrating Naas Service Model To Enhance Network As A Service Performance Topics PDF for your personal presentations from our wonderful collection. A few clicks is all it takes to discover and get the most relevant and appropriate templates. Use our Templates to add a unique zing and appeal to your presentation and meetings. All the slides are easy to edit and you can use them even for advertisement purposes.
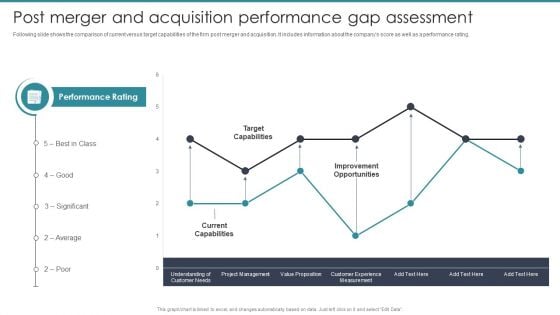
Guide To Mergers And Acquisitions Post Merger And Acquisition Performance Gap Assessment Template PDF
Following slide shows the comparison of current versus target capabilities of the firm post merger and acquisition. It includes information about the companys score as well as a performance rating. Take your projects to the next level with our ultimate collection of Guide To Mergers And Acquisitions Post Merger And Acquisition Performance Gap Assessment Template PDF. Slidegeeks has designed a range of layouts that are perfect for representing task or activity duration, keeping track of all your deadlines at a glance. Tailor these designs to your exact needs and give them a truly corporate look with your own brand colors they will make your projects stand out from the rest.
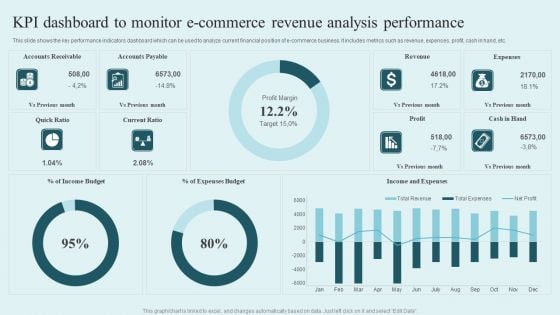
KPI Dashboard To Monitor E Commerce Revenue Analysis Performance Mockup PDF
This slide shows the key performance indicators dashboard which can be used to analyze current financial position of e-commerce business. It includes metrics such as revenue, expenses, profit, cash in hand, etc. Showcasing this set of slides titled KPI Dashboard To Monitor E Commerce Revenue Analysis Performance Mockup PDF. The topics addressed in these templates are Accounts Receivable, Accounts Payable, Revenue, Expenses. All the content presented in this PPT design is completely editable. Download it and make adjustments in color, background, font etc. as per your unique business setting.
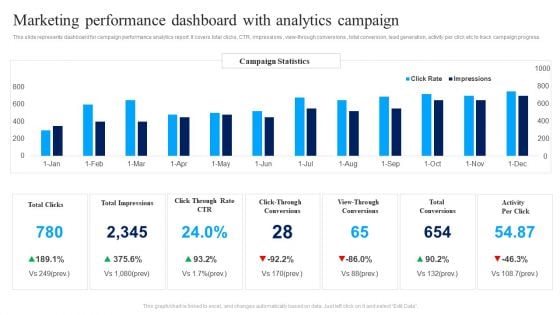
Marketing Performance Dashboard With Analytics Campaign Ppt Infographics Background Images PDF
This slide represents dashboard for campaign performance analytics report. It covers total clicks, CTR, impressions , view-through conversions , total conversion, lead generation, activity per click etc to track campaign progress. Showcasing this set of slides titled Marketing Performance Dashboard With Analytics Campaign Ppt Infographics Background Images PDF. The topics addressed in these templates are Total Clicks, Total Impressions, Total Conversions, Activity Per Click. All the content presented in this PPT design is completely editable. Download it and make adjustments in color, background, font etc. as per your unique business setting.
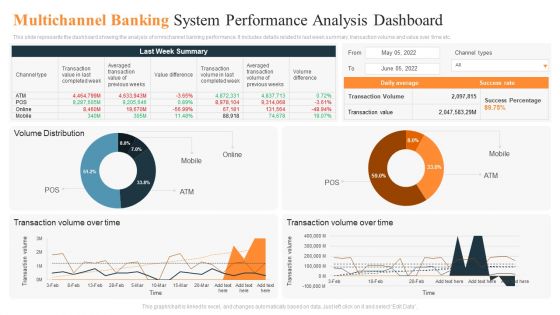
Multichannel Banking System Performance Analysis Dashboard Ppt Pictures Background Designs PDF
This slide represents the dashboard showing the analysis of omnichannel banking performance. It includes details related to last week summary, transaction volume and value over time etc. Showcasing this set of slides titled Multichannel Banking System Performance Analysis Dashboard Ppt Pictures Background Designs PDF. The topics addressed in these templates are Last Week Summary, Transaction Volume, Over Time. All the content presented in this PPT design is completely editable. Download it and make adjustments in color, background, font etc. as per your unique business setting.
You Tube Advertising Campaign Performance Analytics Dashboard Ppt Icon Diagrams PDF
This slide represents dashboard showing analytics of performance of you tube marketing campaign. It includes data related to no. of visitors, qualified leads, customers and annual recurring revenue, lifetime value, gross volume etc generated through the campaign. Showcasing this set of slides titled You Tube Advertising Campaign Performance Analytics Dashboard Ppt Icon Diagrams PDF. The topics addressed in these templates are Monthly Recurring Revenue, Bounce Rate, Customer Churn Rate. All the content presented in this PPT design is completely editable. Download it and make adjustments in color, background, font etc. as per your unique business setting.
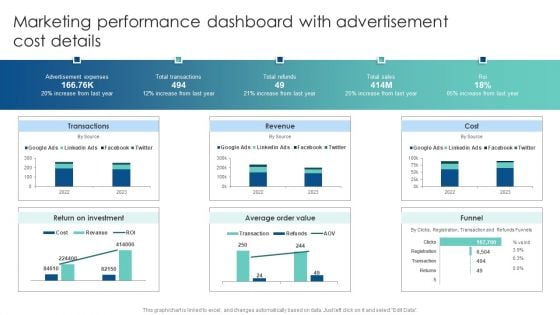
Marketing Performance Dashboard With Advertisement Cost Details Customer Acquisition Through Advertising Guidelines PDF
Explore a selection of the finest Marketing Performance Dashboard With Advertisement Cost Details Customer Acquisition Through Advertising Guidelines PDF here. With a plethora of professionally designed and pre-made slide templates, you can quickly and easily find the right one for your upcoming presentation. You can use our Marketing Performance Dashboard With Advertisement Cost Details Customer Acquisition Through Advertising Guidelines PDF to effectively convey your message to a wider audience. Slidegeeks has done a lot of research before preparing these presentation templates. The content can be personalized and the slides are highly editable. Grab templates today from Slidegeeks.
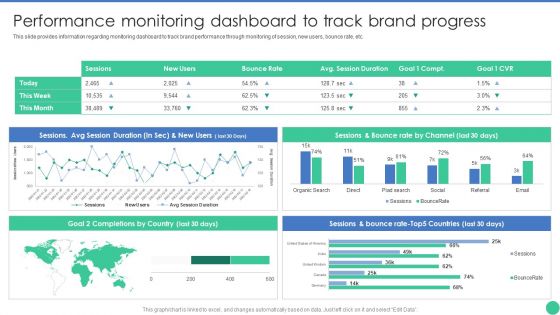
Brand Management To Enhance Performance Monitoring Dashboard To Track Brand Pictures PDF
This slide provides information regarding monitoring dashboard to track brand performance through monitoring of session, new users, bounce rate, etc. Do you know about Slidesgeeks Brand Management To Enhance Performance Monitoring Dashboard To Track Brand Pictures PDF These are perfect for delivering any kind od presentation. Using it, create PowerPoint presentations that communicate your ideas and engage audiences. Save time and effort by using our pre-designed presentation templates that are perfect for a wide range of topic. Our vast selection of designs covers a range of styles, from creative to business, and are all highly customizable and easy to edit. Download as a PowerPoint template or use them as Google Slides themes.
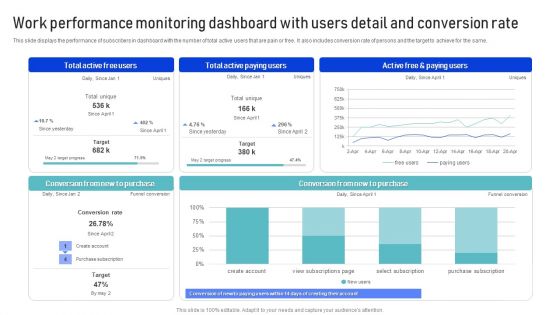
Work Performance Monitoring Dashboard With Users Detail And Conversion Rate Template PDF
This slide displays the performance of subscribers in dashboard with the number of total active users that are pain or free. It also includes conversion rate of persons and the target to achieve for the same. Showcasing this set of slides titled Work Performance Monitoring Dashboard With Users Detail And Conversion Rate Template PDF. The topics addressed in these templates are Purchase, Conversion Rate, Target. All the content presented in this PPT design is completely editable. Download it and make adjustments in color, background, font etc. as per your unique business setting.
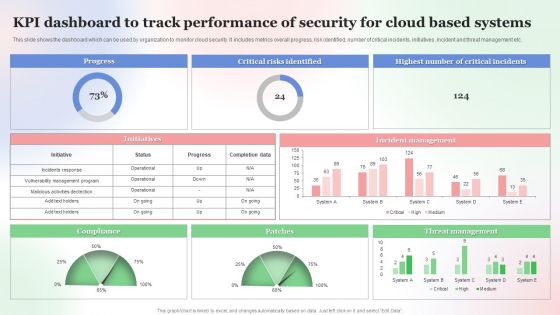
KPI Dashboard To Track Performance Of Security For Cloud Based Systems Clipart PDF
This slide shows the dashboard which can be used by organization to monitor cloud security. It includes metrics overall progress, risk identified, number of critical incidents, initiatives, incident and threat management etc. Showcasing this set of slides titled KPI Dashboard To Track Performance Of Security For Cloud Based Systems Clipart PDF. The topics addressed in these templates are Kpi Dashboard To Track, Performance Of Security, Cloud Based Systems . All the content presented in this PPT design is completely editable. Download it and make adjustments in color, background, font etc. as per your unique business setting.
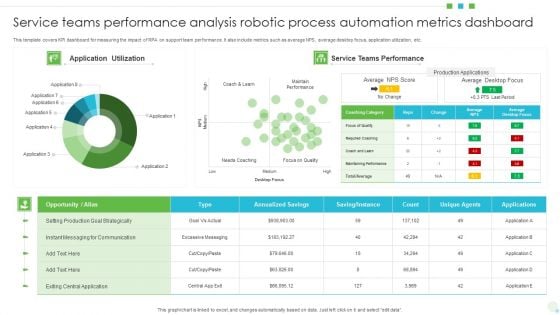
Service Teams Performance Analysis Robotic Process Automation Metrics Dashboard Brochure PDF
This template covers KPI dashboard for measuring the impact of RPA on support team performance. It also include metrics such as average NPS, average desktop focus, application utilization, etc. Showcasing this set of slides titled Service Teams Performance Analysis Robotic Process Automation Metrics Dashboard Brochure PDF. The topics addressed in these templates are Opportunity, Production Goal Strategically, Application Utilization. All the content presented in this PPT design is completely editable. Download it and make adjustments in color, background, font etc. as per your unique business setting.


 Continue with Email

 Home
Home


