Phase Chart
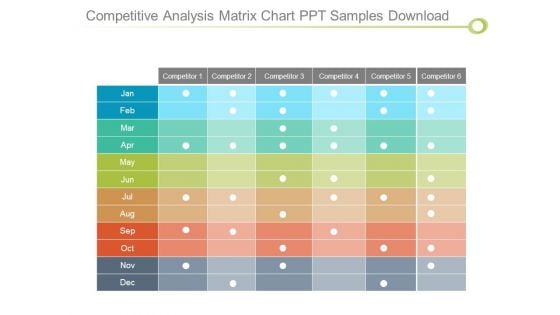
Competitive Analysis Matrix Chart Ppt Samples Download
This is a competitive analysis matrix chart ppt samples download. This is a six stage process. The stages in this process are competitor, jan, feb, mar, apr, may, jun, jul, aug, sep, oct, nov, dec.
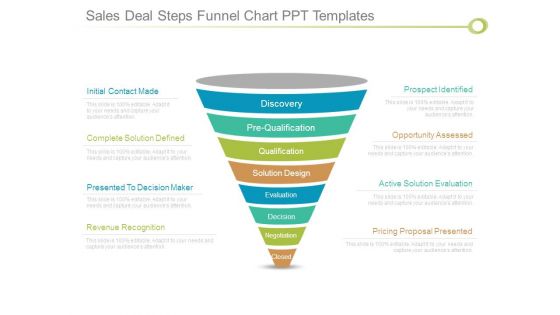
Sales Deal Steps Funnel Chart Ppt Templates
This is a sales deal steps funnel chart ppt templates. This is a eight stage process. The stages in this process are discovery, pre qualification, qualification, solution design, evaluation, decision, negotiation, closed.
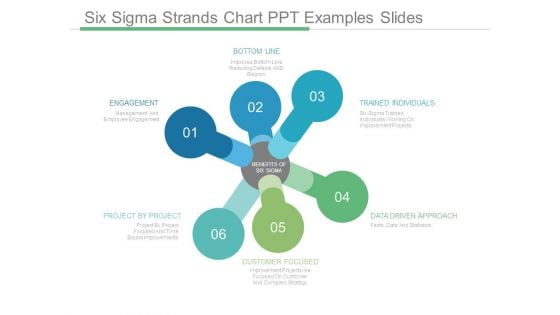
Six Sigma Strands Chart Ppt Examples Slides
This is a six sigma strands chart ppt examples slides. This is a six stage process. The stages in this process are bottom line, trained individuals, data driven approach, customer focused, project by project, engagement, benefits of six sigma.
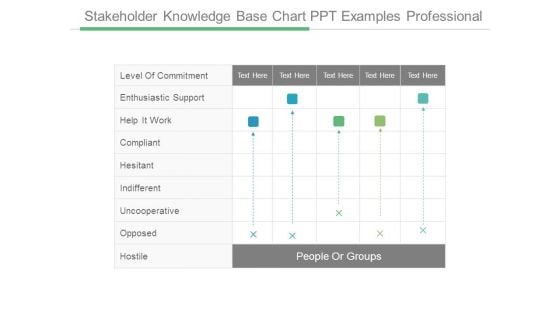
Stakeholder Knowledge Base Chart Ppt Examples Professional
This is a stakeholder knowledge base chart ppt examples professional. This is a five stage process. The stages in this process are people or groups, level of commitment, enthusiastic support, help it work, compliant, hesitant, indifferent, uncooperative, opposed, hostile.
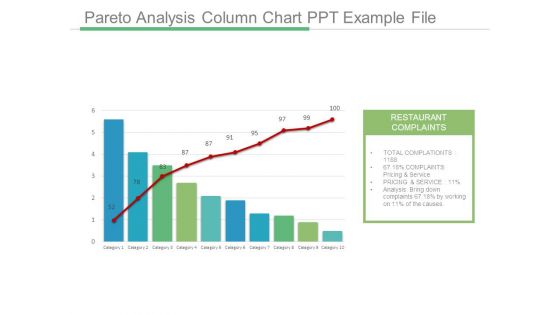
Pareto Analysis Column Chart Ppt Example File
This is a pareto analysis column chart ppt example file. This is a ten stage process. The stages in this process are restaurant complaints, total complaints, complaints pricing and service, pricing and service, analysis bring down complaints, category.
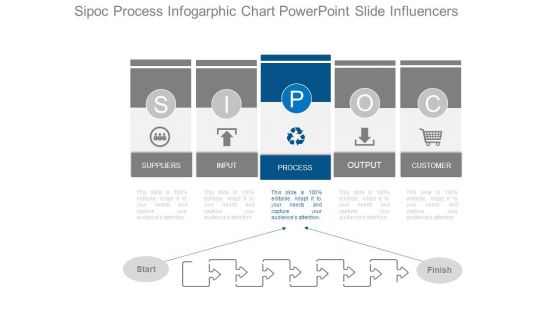
Sipoc Process Infogarphic Chart Powerpoint Slide Influencers
This is a sipoc process infogarphic chart powerpoint slide influencers. This is a five stage process. The stages in this process are suppliers, input, process, output, customer, start, finish, sipoc.

Six Sigma Circle Chart Powerpoint Slide Information
This is a six sigma circle chart powerpoint slide information. This is a five stage process. The stages in this process are bottom line, trained individuals, engagement, project by project, customer focused.
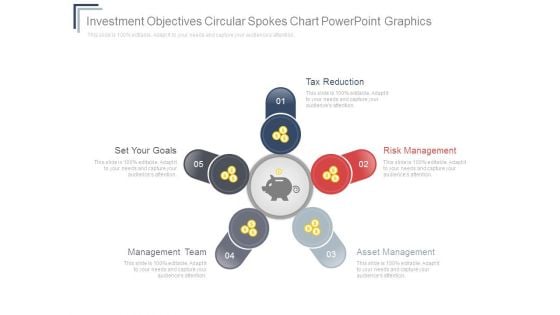
Investment Objectives Circular Spokes Chart Powerpoint Graphics
This is a investment objectives circular spokes chart powerpoint graphics. This is a five stage process. The stages in this process are tax reduction, set your goals, management team, asset management, risk management.
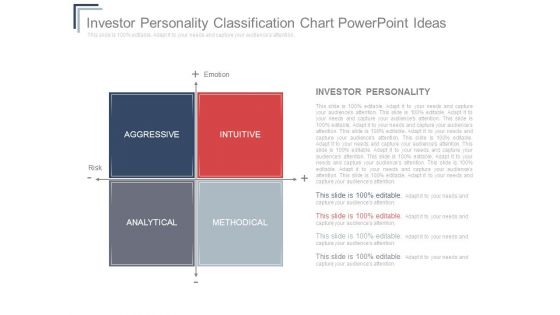
Investor Personality Classification Chart Powerpoint Ideas
This is a investor personality classification chart powerpoint ideas. This is a four stage process. The stages in this process are aggressive, intuitive, analytical, methodical, emotion, risk, investor personality.
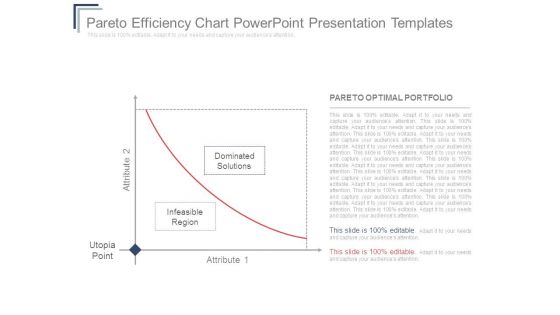
Pareto Efficiency Chart Powerpoint Presentation Templates
This is a pareto efficiency chart powerpoint presentation templates. This is a two stage process. The stages in this process are attribute 2, utopia, point, infeasible region, dominated, solutions, attribute 1, pareto optimal portfolio.
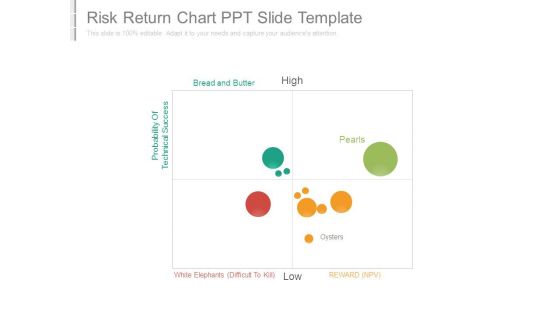
Risk Return Chart Ppt Slide Template
This is a risk return chart ppt slide template. This is a four stage process. The stages in this process are probability of technical success, bread and butter, pearls, oysters.
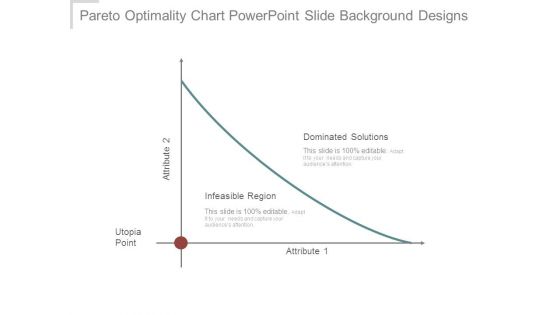
Pareto Optimality Chart Powerpoint Slide Background Designs
This is a pareto optimality chart powerpoint slide background designs. This is a one stage process. The stages in this process are dominated solutions, infeasible region, utopia point, attribute.
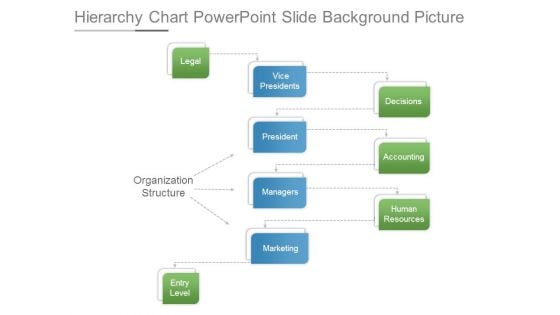
Hierarchy Chart Powerpoint Slide Background Picture
This is a hierarchy chart powerpoint slide background picture. This is a eight stage process. The stages in this process are organization structure, legal, vice presidents, decisions, president, managers, marketing, accounting, human resources, entry level.
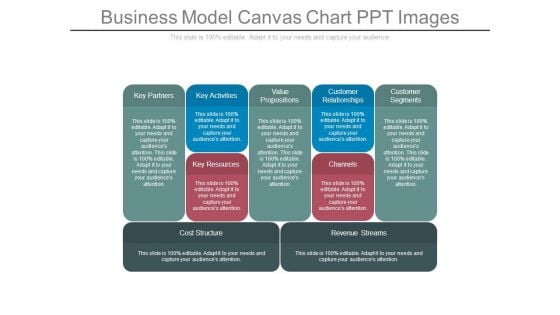
Business Model Canvas Chart Ppt Images
This is a business model canvas chart ppt images. This is a five stage process. The stages in this process are key partners, key activities, value propositions, customer relationships, customer segments, key resources, channels, cost structure, revenue streams.
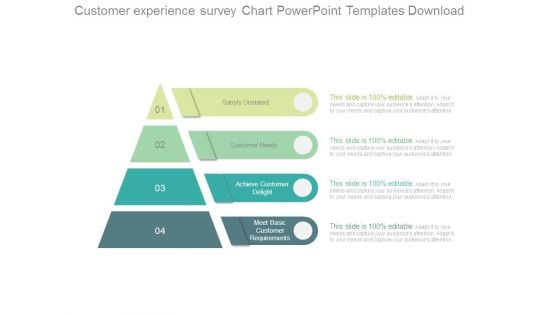
Customer Experience Survey Chart Powerpoint Templates Download
This is a customer experience survey chart powerpoint templates download. This is a four stage process. The stages in this process are satisfy unstated, customer needs, achieve customer delight, meet basic, customer requirements.
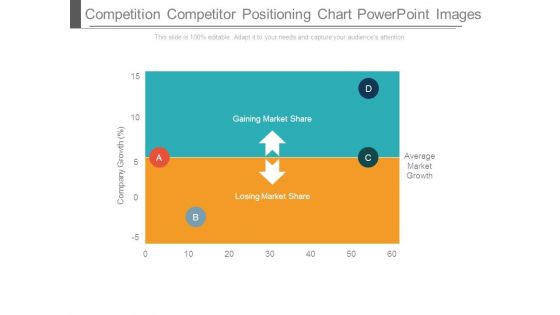
Competition Competitor Positioning Chart Powerpoint Images
This is a competition competitor positioning chart powerpoint images. This is a four stage process. The stages in this process are gaining market share, losing market share, average market growth, company growth.
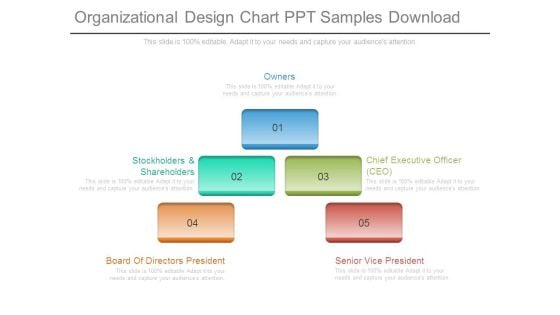
Organizational Design Chart Ppt Samples Download
This is a organizational design chart ppt samples download. This is a five stage process. The stages in this process are owners, stockholders and shareholders, board of directors president, chief, executive officer ceo, senior vice president.
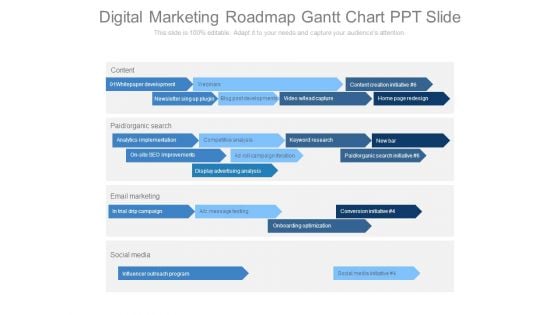
Digital Marketing Roadmap Gantt Chart Ppt Slide
This is a digital marketing roadmap gantt chart ppt slide. This is a five stage process. The stages in this process are content, paid organic search, email marketing, social media.
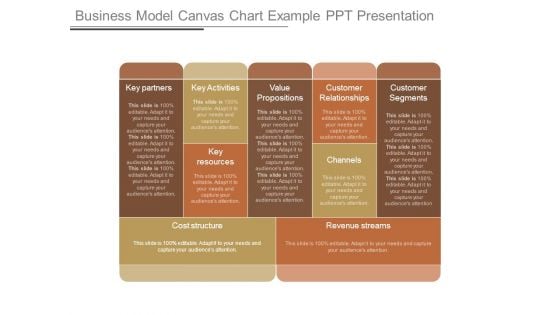
Business Model Canvas Chart Example Ppt Presentation
This is a business model canvas chart example ppt presentation. This is a five stage process. The stages in this process are key partners, key activities, value propositions, customer relationships, customer segments, key resources, channels, cost structure, revenue streams.
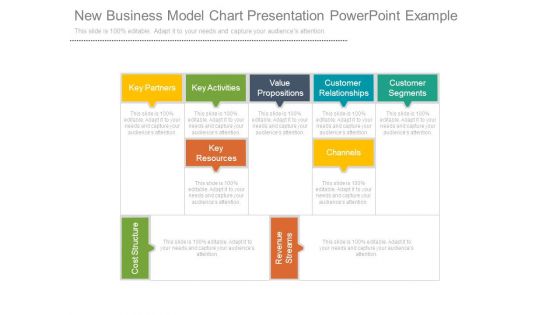
New Business Model Chart Presentation Powerpoint Example
This is a new business model chart presentation powerpoint example. This is a five stage process. The stages in this process are key partners, key activities, value propositions, customer, relationships, customer segments, key resources, channels, cost structure, revenue streams.
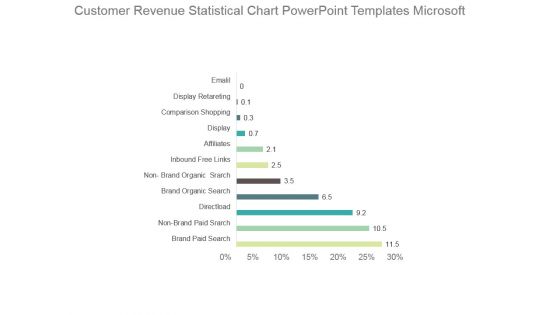
Customer Revenue Statistical Chart Powerpoint Templates Microsoft
This is a customer revenue statistical chart powerpoint templates microsoft. This is a ten stage process. The stages in this process are email, display retargeting, comparison shopping, display, affiliates, inbound free links, brand organic search, brand paid search.
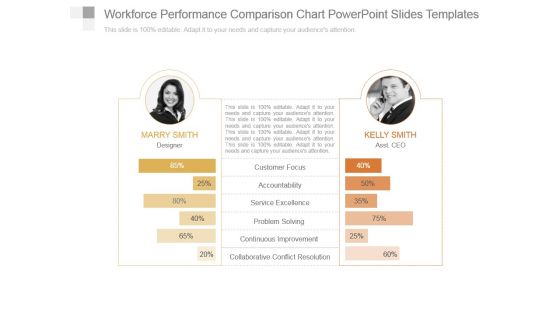
Workforce Performance Comparison Chart Powerpoint Slides Templates
This is a workforce performance comparison chart powerpoint slides templates. This is a two stage process. The stages in this process are customer focus, accountability, service excellence, problem solving, continuous improvement, collaborative conflict resolution.
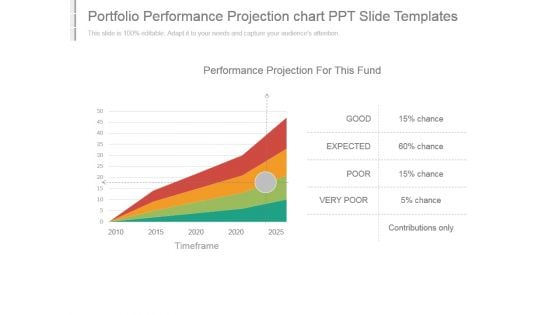
Portfolio Performance Projection Chart Ppt Slide Templates
This is a portfolio performance projection chart ppt slide templates. This is a four stage process. The stages in this process are performance projection for this fund, good, expected, poor, very poor, contributions only, timeframe.
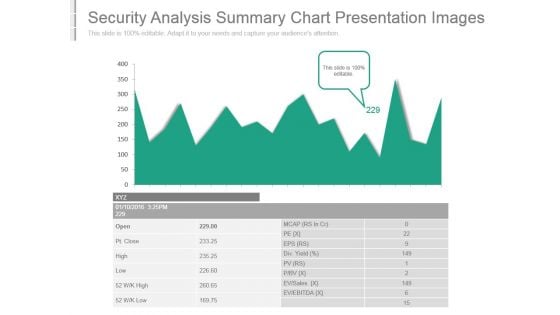
Security Analysis Summary Chart Presentation Images
This is a security analysis summary chart presentation images. This is a one stage process. The stages in this process are ev ebitda, ev sales, div yield, open, pt close, high, low, mcap, eps.
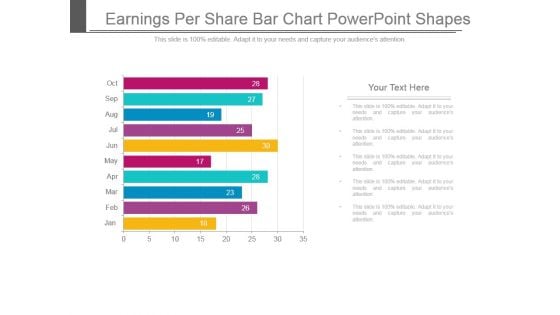
Earnings Per Share Bar Chart Powerpoint Shapes
This is a earnings per share bar chart powerpoint shapes. This is a ten stage process. The stages in this process are jan, feb, mar, apr, may, jun, jul, aug, sep, oct.
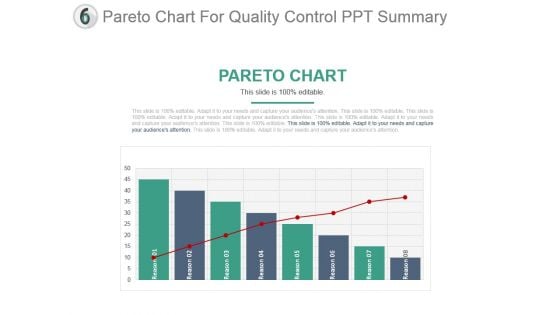
Pareto Chart For Quality Control Ppt Summary
This is a pareto chart for quality control ppt summary. This is a eight stage process. The stages in this process are business, success, marketing, strategy, growth, graphic design.
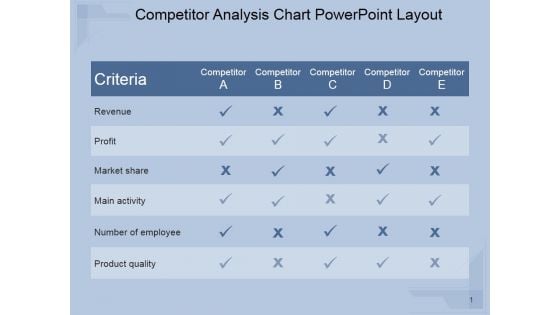
Competitor Analysis Chart Ppt PowerPoint Presentation Visuals
This is a competitor analysis chart ppt powerpoint presentation visuals. This is a five stage process. The stages in this process are revenue, profit, market share, main activity, number of employee, product quality.
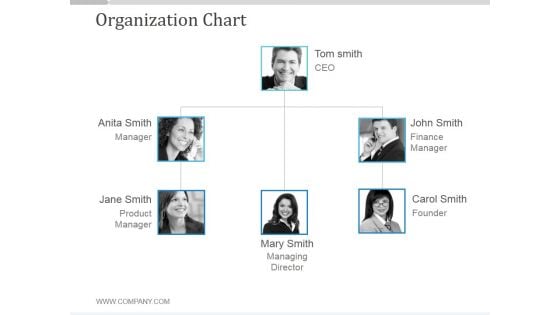
Organization Chart Ppt PowerPoint Presentation Backgrounds
This is a organization chart ppt powerpoint presentation backgrounds. This is a three stage process. The stages in this process are tom smith ceo, john smith finance manager, john smith finance manager, john smit finance manager.
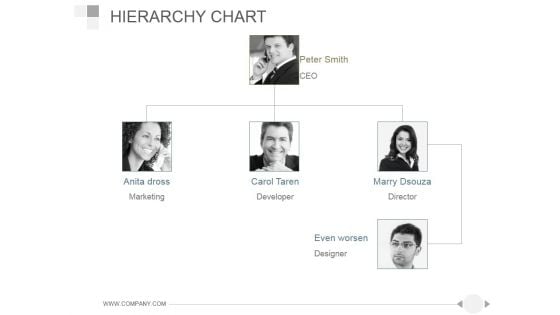
Hierarchy Chart Ppt PowerPoint Presentation Ideas
This is a hierarchy chart ppt powerpoint presentation ideas. This is a three stage process. The stages in this process are peter smith, anita dross, carol taren, marry dsouza, even worsen.
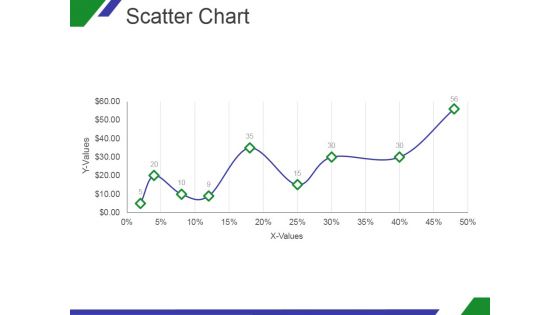
Scatter Chart Ppt PowerPoint Presentation Designs Download
This is a scatter chart ppt powerpoint presentation designs download. This is a nine stage process. The stages in this process are x values, y values, graph, growth, success.
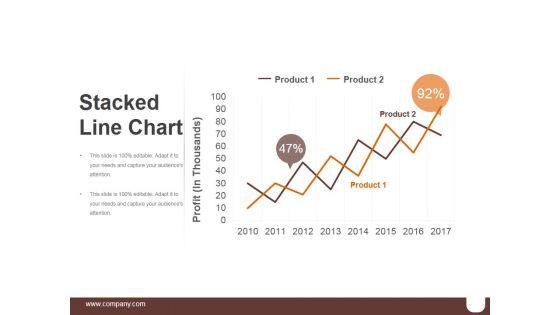
Stacked Line Chart Ppt PowerPoint Presentation Shapes
This is a stacked line chart ppt powerpoint presentation shapes. This is a two stage process. The stages in this process are product, profit in thousands, finance, analysis, growth.
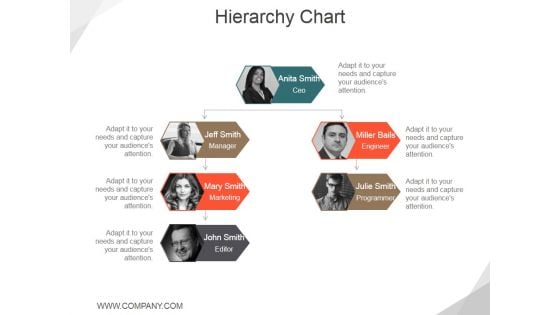
Hierarchy Chart Ppt PowerPoint Presentation Outline Ideas
This is a hierarchy chart ppt powerpoint presentation outline ideas. This is a two stage process. The stages in this process are anita smith ceo, jeff smith manager, miller bails engineer.
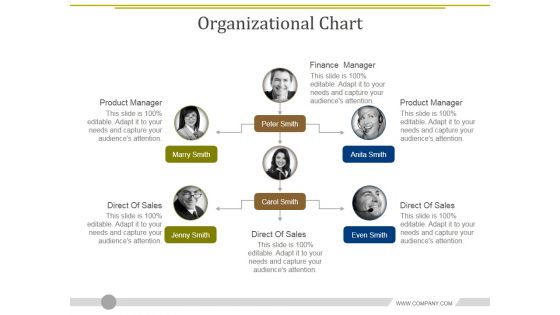
Organizational Chart Ppt PowerPoint Presentation Layouts Demonstration
This is a organizational chart ppt powerpoint presentation layouts demonstration. This is a six stage process. The stages in this process are finance manager, product manager, direct of sales, direct of sales, direct of sales.
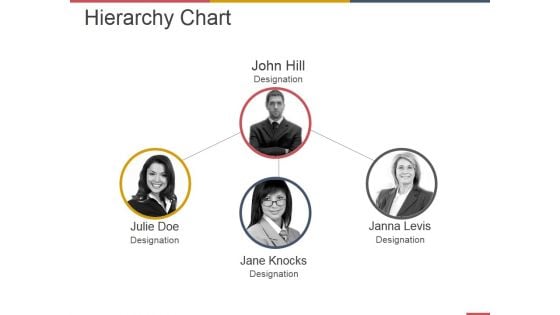
Hierarchy Chart Ppt PowerPoint Presentation Model Maker
This is a hierarchy chart ppt powerpoint presentation model maker. This is a four stage process. The stages in this process are business, strategy, marketing, communication, work management, teamwork.
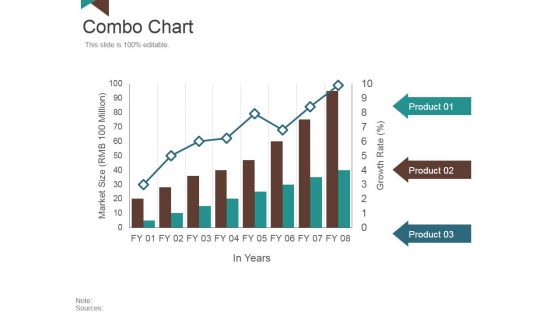
Combo Chart Ppt PowerPoint Presentation Inspiration Images
This is a combo chart ppt powerpoint presentation inspiration images. This is a three stage process. The stages in this process are market size, in years, growth rate, product.
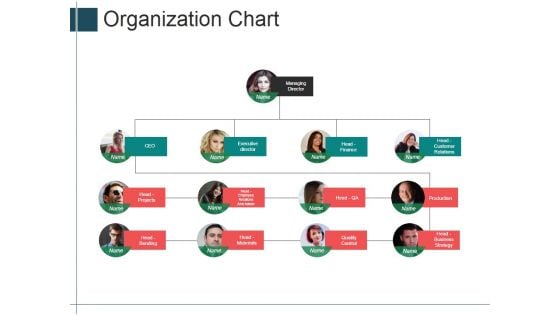
Organization Chart Ppt PowerPoint Presentation Portfolio Shapes
This is a organization chart ppt powerpoint presentation portfolio shapes. This is a four stage process. The stages in this process are managing director, executive director, head finance, head projects.
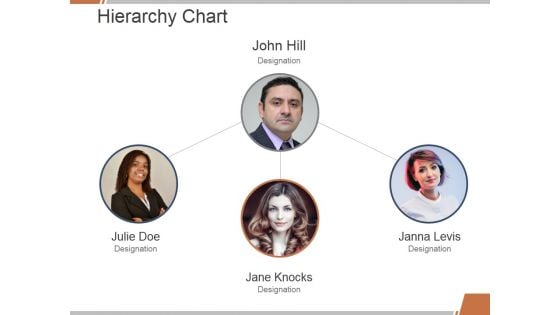
Hierarchy Chart Ppt PowerPoint Presentation Summary Deck
This is a hierarchy chart ppt powerpoint presentation summary deck. This is a three stage process. The stages in this process are john hill, julie doe, jane knocks, janna levis.
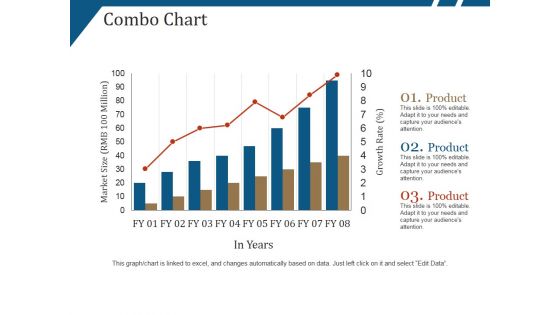
Combo Chart Ppt PowerPoint Presentation Summary Ideas
This is a combo chart ppt powerpoint presentation summary ideas. This is a eight stage process. The stages in this process are market size, growth rate, product, in years.
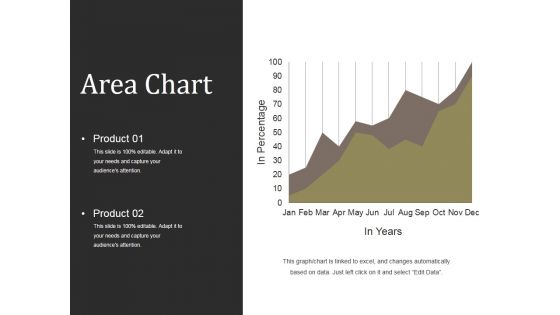
Area Chart Ppt PowerPoint Presentation Professional Designs
This is a area chart ppt powerpoint presentation professional designs. This is a two stage process. The stages in this process are in percentage, product, in years, strategy, business, marketing.
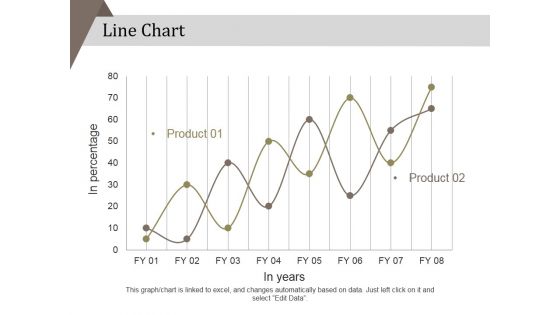
Line Chart Ppt PowerPoint Presentation Layouts Professional
This is a line chart ppt powerpoint presentation layouts professional. This is a two stage process. The stages in this process are in percentage, product, in years, strategy, marketing, business.
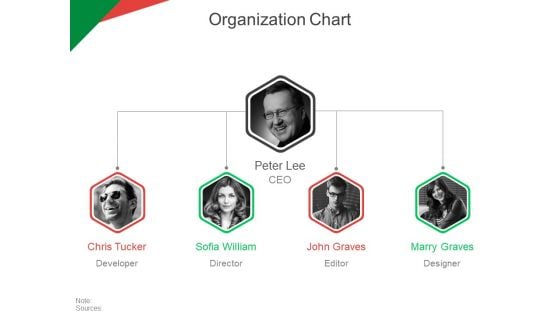
Organization Chart Ppt PowerPoint Presentation Ideas Tips
This is a organization chart ppt powerpoint presentation ideas tips. This is a four stage process. The stages in this process are peter lee, john graves, marry graves, sofia william, chris tucker.
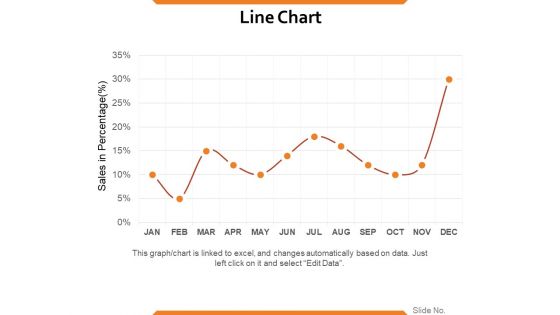
Line Chart Ppt PowerPoint Presentation Summary Samples
This is a line chart ppt powerpoint presentation summary samples. This is a one stage process. The stages in this process are sales in percentage, percentage, business, marketing, strategy.
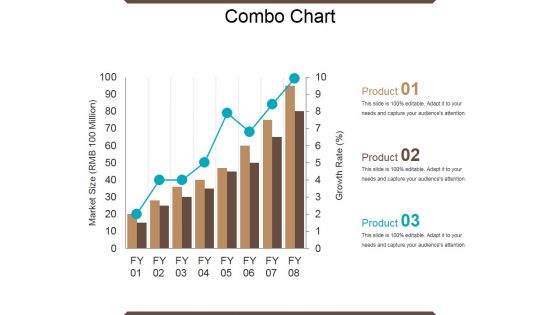
Combo Chart Ppt PowerPoint Presentation Outline Model
This is a combo chart ppt powerpoint presentation outline model. This is a eight stage process. The stages in this process are market size, growth rate, growth, success, graph.
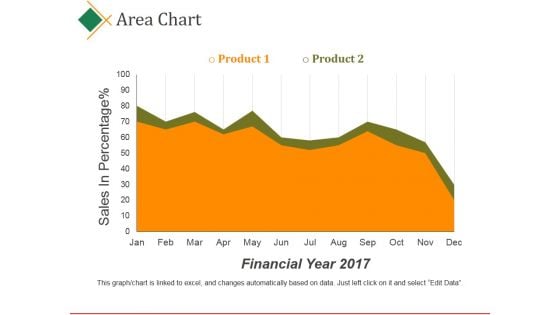
Area Chart Ppt PowerPoint Presentation Pictures Files
This is a area chart ppt powerpoint presentation pictures files. This is a two stage process. The stages in this process are product, sales, in percentage, financial year, business.
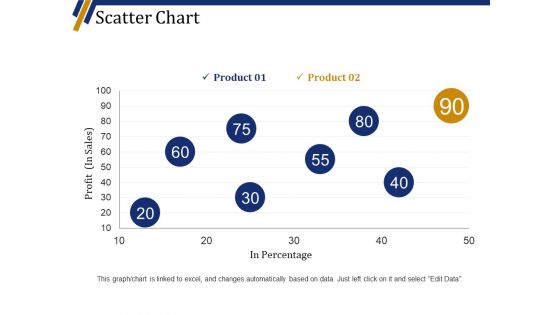
Scatter Chart Ppt PowerPoint Presentation Summary Visuals
This is a scatter chart ppt powerpoint presentation summary visuals. This is a eight stage process. The stages in this process are product, profit in sales, in percentage, finance, business.
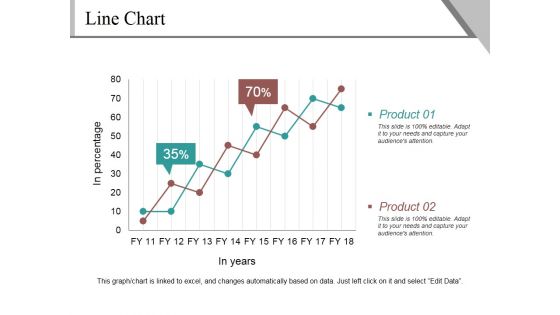
Line Chart Ppt PowerPoint Presentation Infographics Example
This is a line chart ppt powerpoint presentation infographics example. This is a two stage process. The stages in this process are product, in percentage, in years, finance, growth.
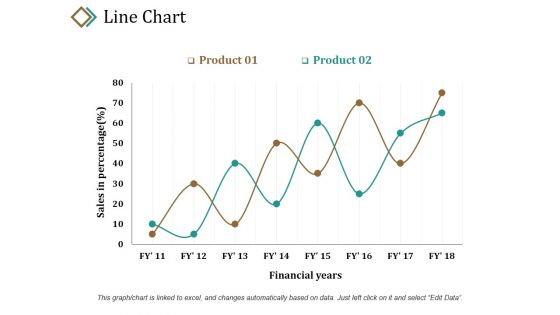
Line Chart Ppt PowerPoint Presentation Layouts Example
This is a line chart ppt powerpoint presentation layouts example. This is a two stage process. The stages in this process are sales in percentage, product, financial years, growth, success.
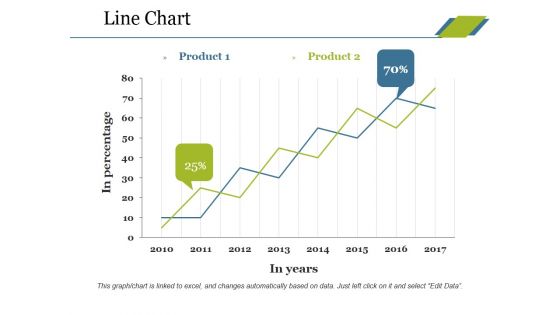
Line Chart Ppt PowerPoint Presentation Professional Tips
This is a line chart ppt powerpoint presentation professional tips. This is a two stage process. The stages in this process are product, in percentage, in years, growth, success.
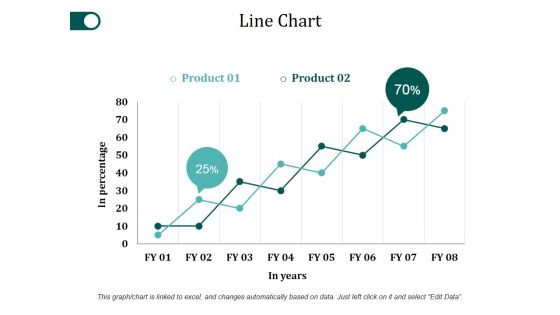
Line Chart Ppt PowerPoint Presentation Slides Ideas
This is a line chart ppt powerpoint presentation slides ideas. This is a two stage process. The stages in this process are product, in percentage, in years, growth, success.

Line Chart Ppt PowerPoint Presentation Show Guide
This is a line chart ppt powerpoint presentation show guide. This is a two stage process. The stages in this process are product, sales in percentage, financial years, growth, success.
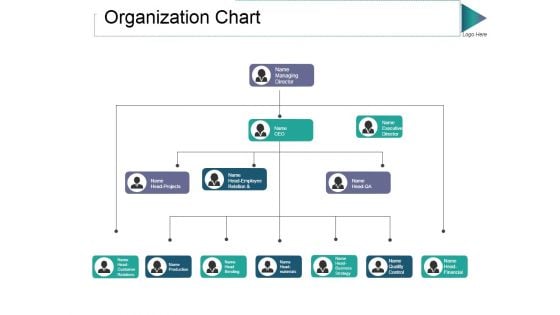
Organization Chart Ppt PowerPoint Presentation Gallery Ideas
This is a organization chart ppt powerpoint presentation gallery ideas. This is a four stage process. The stages in this process are managing director, ceo, head projects, head bending.
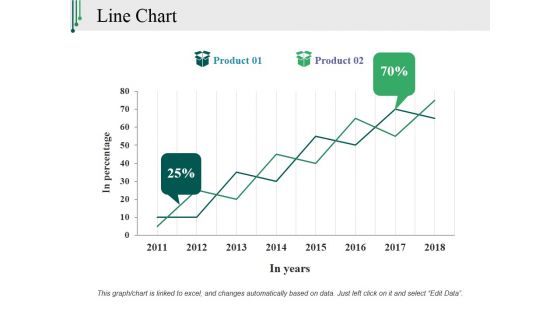
Line Chart Ppt PowerPoint Presentation Slides Mockup
This is a line chart ppt powerpoint presentation slides mockup. This is a two stage process. The stages in this process are in percentage, in years, product, growth, success.
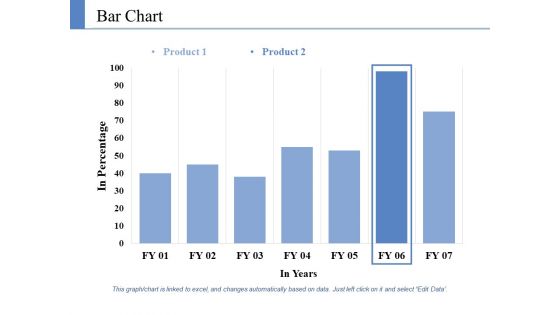
Bar Chart Ppt PowerPoint Presentation Ideas Deck
This is a bar chart ppt powerpoint presentation ideas deck. This is a two stage process. The stages in this process are product, in percentage, in years, financial, business.
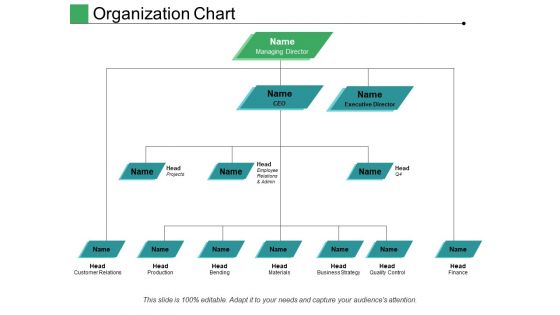
Organization Chart Ppt PowerPoint Presentation Pictures Structure
This is a organization chart ppt powerpoint presentation pictures structure. This is a three stage process. The stages in this process are managing director, executive director, head, ceo, finance.
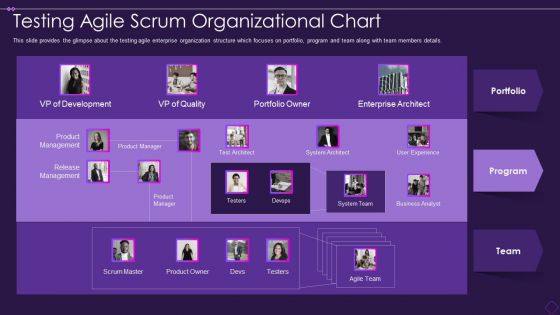
Testing Agile Scrum Organizational Chart Clipart PDF
This slide provides the glimpse about the testing agile enterprise organization structure which focuses on portfolio, program and team along with team members details. Deliver an awe inspiring pitch with this creative testing agile scrum organizational chart clipart pdf bundle. Topics like testing agile scrum organizational chart can be discussed with this completely editable template. It is available for immediate download depending on the needs and requirements of the user.
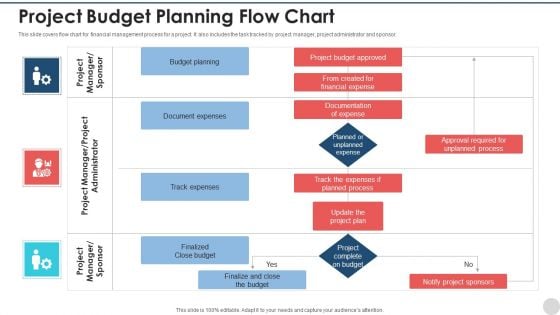
Project Budget Planning Flow Chart Inspiration PDF
This slide covers flow chart for financial management process for a project. It also includes the task tracked by project manager, project administrator and sponsor. Showcasing this set of slides titled project budget planning flow chart inspiration pdf. The topics addressed in these templates are budget planning, document expenses, track expenses, finalized close budget. All the content presented in this PPT design is completely editable. Download it and make adjustments in color, background, font etc. as per your unique business setting.
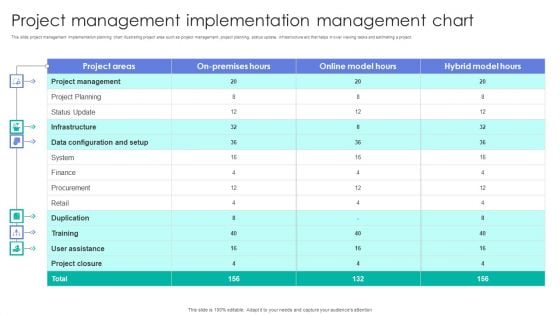
Project Management Implementation Management Chart Microsoft PDF
This slide project management implementation planning chart illustrating project area such as project management, project planning, status update, infrastructure etc that helps in over viewing tasks and estimating a project. Showcasing this set of slides titled Project Management Implementation Management Chart Microsoft PDF. The topics addressed in these templates are Retail, Finance, System. All the content presented in this PPT design is completely editable. Download it and make adjustments in color, background, font etc. as per your unique business setting.
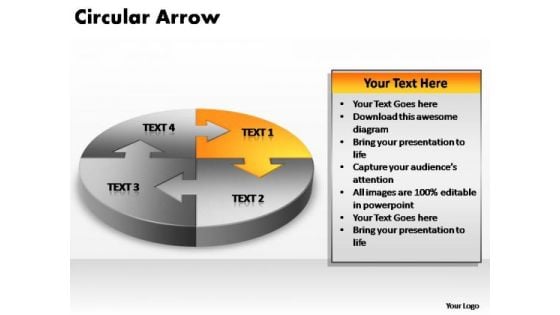
PowerPoint Process Chart Circular Arrow Ppt Design
PowerPoint Process Chart Circular Arrow PPT Design-Explore the various directions and layers existing in your in your plans and processes. Unravel the desired and essential elements of your overall strategy. Explain the relevance of the different layers and stages and directions in getting down to your core competence, ability and desired result. Dont make your presetations long and boring. Make them to the point with our PowerPoint Process Chart Circular Arrow Ppt Design. You will be at the top of your game.
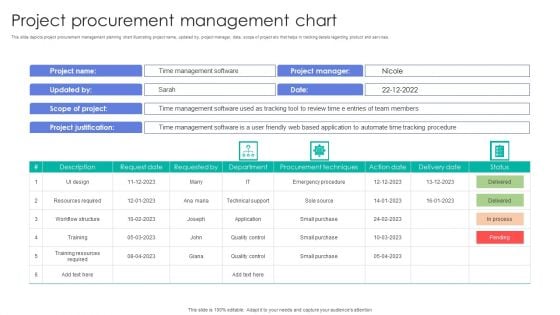
Project Procurement Management Chart Elements PDF
This slide depicts project procurement management planning chart illustrating project name, updated by, project manager, date, scope of project etc that helps in tracking details regarding product and services. Showcasing this set of slides titled Project Procurement Management Chart Elements PDF. The topics addressed in these templates are Design, Resources Required, Quality Control. All the content presented in this PPT design is completely editable. Download it and make adjustments in color, background, font etc. as per your unique business setting.
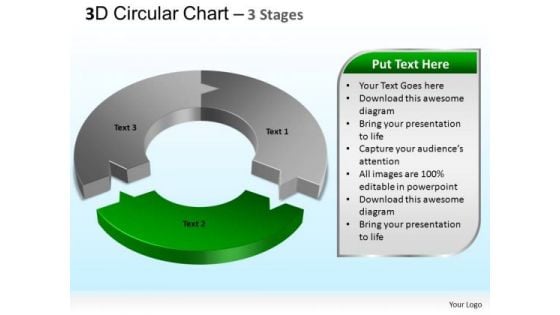
PowerPoint Process Process Circular Chart Ppt Slides
PowerPoint Process Process circular chart PPT Slides-The Circle of Life - a concept emmbedded in our minds and hence easy to comprehend. Life and Business is made up of processes comprising stages that flow from one to another. An excellent graphic to attract the attention of and understanding by your audience to improve earnings. Generate equity with our PowerPoint Process Process Circular Chart Ppt Slides. The stocks of your company will be on the rise.


 Continue with Email

 Home
Home


