Phase Chart
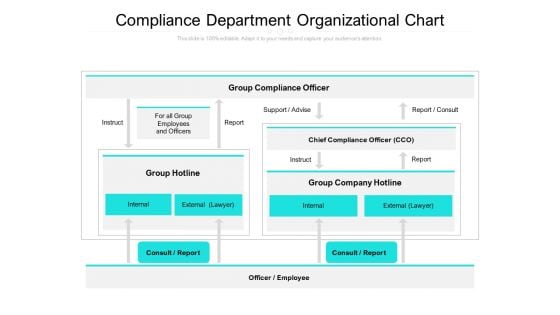
Compliance Department Organizational Chart Ppt Gallery Influencers PDF
Presenting this set of slides with name compliance department organizational chart ppt gallery influencers pdf. This is a one stage process. The stages in this process are group hotline, group company hotline, chief compliance officer, internal, external, employee, instruct, employees. This is a completely editable PowerPoint presentation and is available for immediate download. Download now and impress your audience.
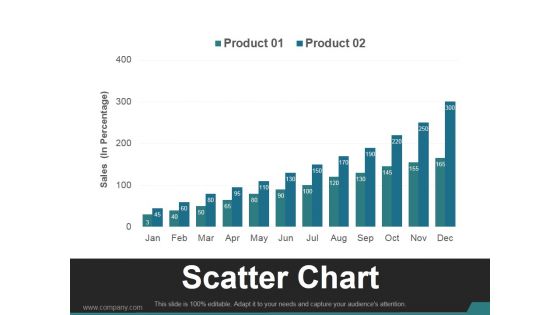
Scatter Chart Template 1 Ppt PowerPoint Presentation Visual Aids
This is a scatter chart template 1 ppt powerpoint presentation visual aids. This is a twelve stage process. The stages in this process are business, marketing, growth, finance, management.
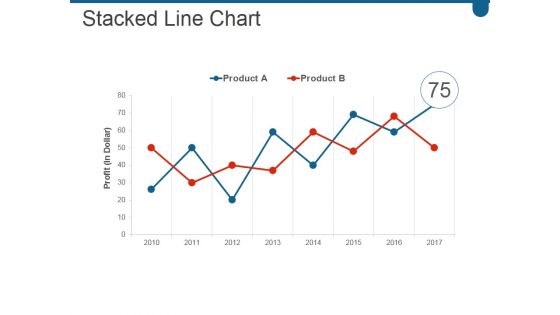
Stacked Line Chart Ppt PowerPoint Presentation Infographic Template Show
This is a stacked line chart ppt powerpoint presentation infographic template show. This is a two stage process. The stages in this process are business, marketing, growth, success, line.
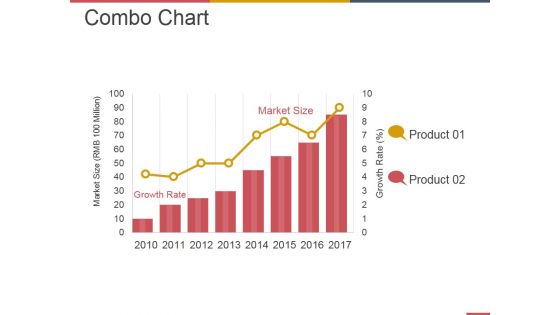
Combo Chart Ppt PowerPoint Presentation Infographic Template Deck
This is a combo chart ppt powerpoint presentation infographic template deck. This is a eight stage process. The stages in this process are business, strategy, marketing, analysis, growth strategy, market size.

Combo Chart Ppt PowerPoint Presentation Infographic Template Influencers
This is a combo chart ppt powerpoint presentation infographic template influencers. This is a three stage process. The stages in this process are market size rmb million, growth rate.
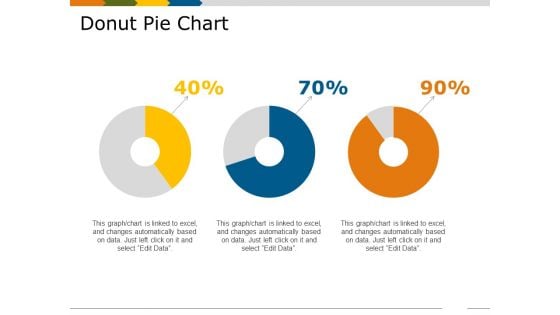
Donut Pie Chart Template 2 Ppt PowerPoint Presentation Show Skills
This is a donut pie chart template 2 ppt powerpoint presentation show skills. This is a three stage process. The stages in this process are percentage, business, marketing, process, finance.
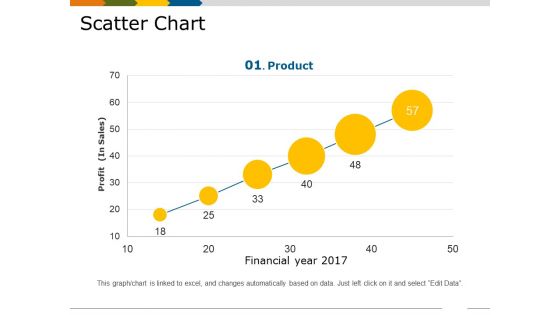
Scatter Chart Template 1 Ppt PowerPoint Presentation Show Slides
This is a scatter chart template 1 ppt powerpoint presentation show slides. This is a six stage process. The stages in this process are financial year, profit in sales, growth, business, marketing, product.
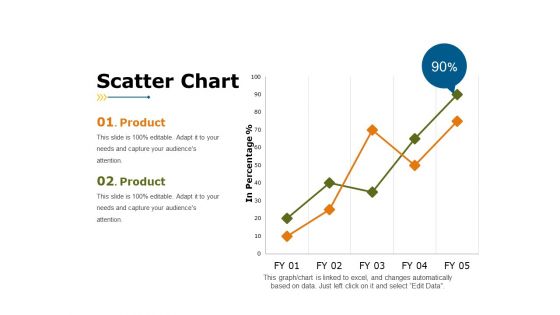
Scatter Chart Template 2 Ppt PowerPoint Presentation Styles Visual Aids
This is a scatter chart template 2 ppt powerpoint presentation styles visual aids. This is a two stage process. The stages in this process are product, business, marketing, in percentage, growth.
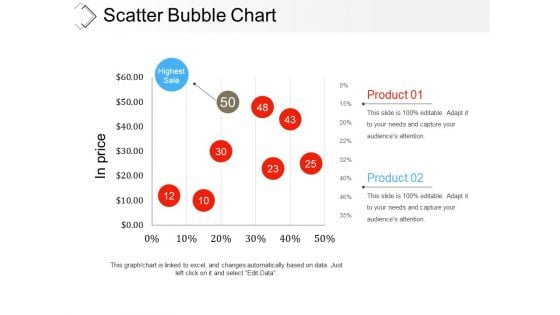
Scatter Bubble Chart Ppt PowerPoint Presentation Infographic Template Examples
This is a scatter bubble chart ppt powerpoint presentation infographic template examples. This is a two stage process. The stages in this process are highest sale, product, in price, finance, business.
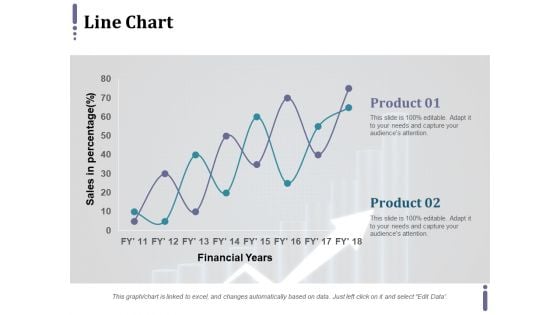
Line Chart Ppt PowerPoint Presentation Infographic Template Master Slide
This is a line chart ppt powerpoint presentation infographic template master slide. This is a two stage process. The stages in this process are product, financial years, sales in percentage.
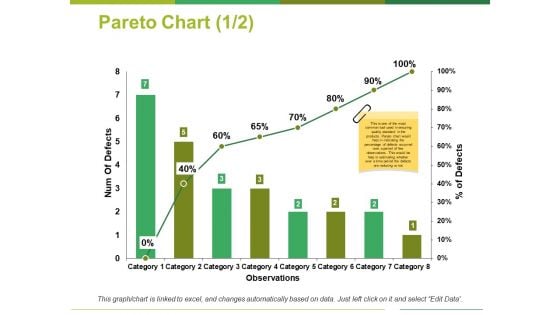
Pareto Chart Template 1 Ppt PowerPoint Presentation Outline Show
This is a pareto chart template 1 ppt powerpoint presentation outline show. This is a eight stage process. The stages in this process are num of defects, percentage of defects, observations, category.
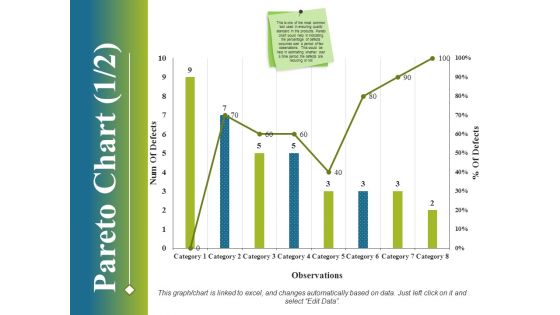
Pareto Chart Template 1 Ppt PowerPoint Presentation File Ideas
This is a pareto chart template 1 ppt powerpoint presentation file ideas. This is a eight stage process. The stages in this process are business, finance, marketing, strategy, analysis.
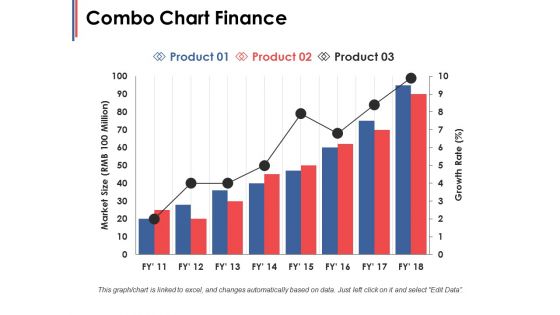
Combo Chart Finance Ppt PowerPoint Presentation Infographic Template Microsoft
This is a combo chart finance ppt powerpoint presentation infographic template microsoft. This is a three stage process. The stages in this process are finance, marketing, management, investment, analysis.
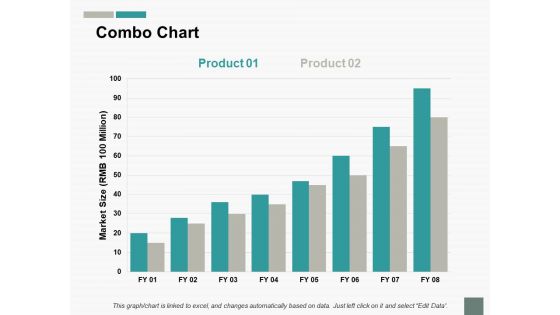
Combo Chart Finance Ppt PowerPoint Presentation Infographic Template Graphics
This is a combo chart finance ppt powerpoint presentation infographic template graphics. This is a two stage process. The stages in this process are growth, finance, marketing, management, investment.
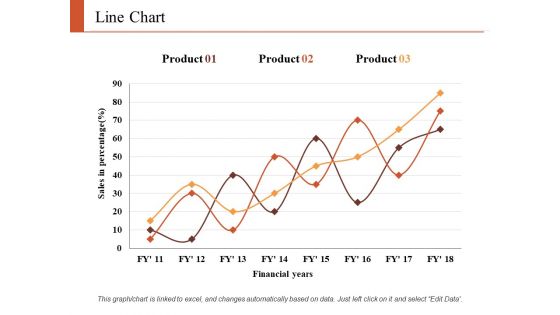
Line Chart Finance Ppt PowerPoint Presentation Infographic Template Graphics Tutorials
This is a line chart finance ppt powerpoint presentation infographic template graphics tutorials. This is a three stage process. The stages in this process are finance, marketing, analysis, business, investment.
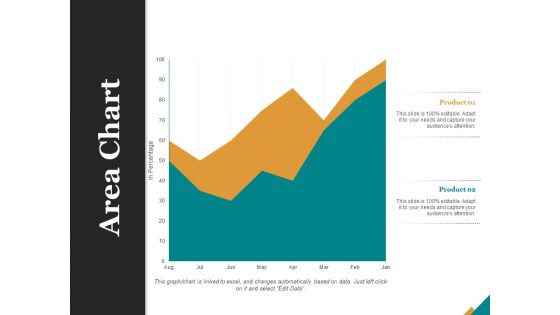
Area Chart Finance Ppt PowerPoint Presentation Summary Design Templates
This is a area chart finance ppt powerpoint presentation summary design templates. This is a two stage process. The stages in this process are finance, marketing, management, investment, analysis.
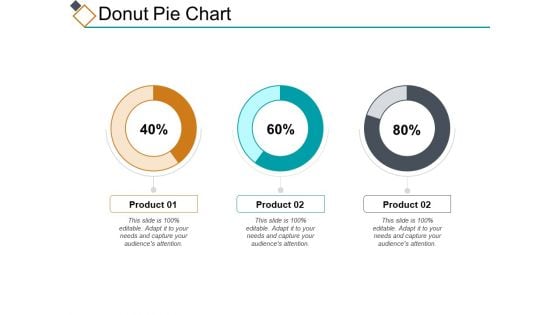
Donut Pie Chart Ppt PowerPoint Presentation Infographic Template Slides
This is a donut pie chart ppt powerpoint presentation infographic template slides. This is a three stage process. The stages in this process are percentage, product, business, management, marketing.
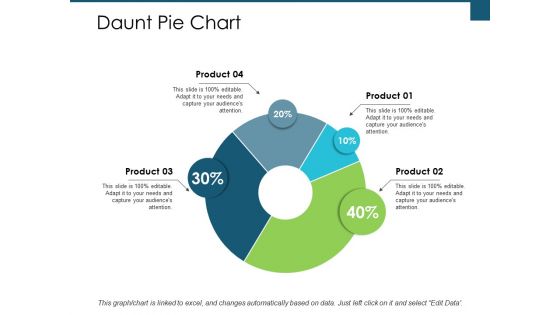
Daunt Pie Chart Investment Ppt PowerPoint Presentation Infographic Template Aids
This is a daunt pie chart investment ppt powerpoint presentation infographic template aids. This is a four stage process. The stages in this process are finance, analysis, business, investment, marketing.
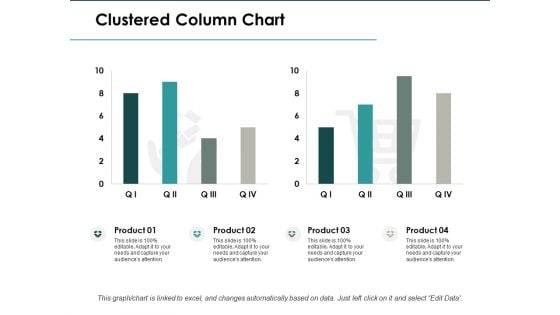
Clustered Column Chart Investment Ppt PowerPoint Presentation Infographic Template Clipart
This is a clustered column chart investment ppt powerpoint presentation infographic template clipart. This is a four stage process. The stages in this process are finance, analysis, business, investment, marketing.
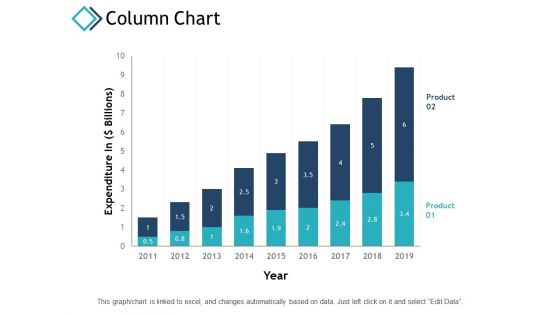
Column Chart Finance Investment Ppt PowerPoint Presentation Inspiration Template
This is a column chart finance investment ppt powerpoint presentation inspiration template. This is a two stage process. The stages in this process are finance, analysis, business, investment, marketing.
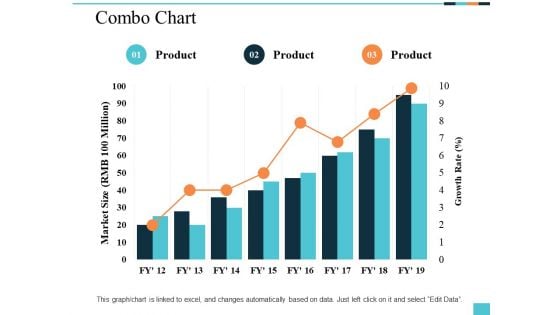
Combo Chart Product Ppt PowerPoint Presentation Professional Graphics Template
This is a combo chart product ppt powerpoint presentation professional graphics template. This is a three stage process. The stages in this process are finance, marketing, management, investment, product.
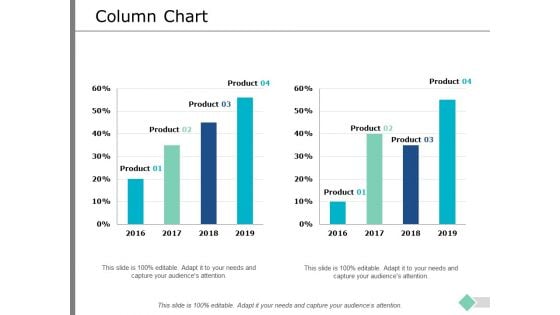
Column Chart Marketing Finance Ppt PowerPoint Presentation Infographic Template Rules
This is a column chart marketing finance ppt powerpoint presentation infographic template rules. This is a two stage process. The stages in this process are finance, analysis, business, investment, marketing.
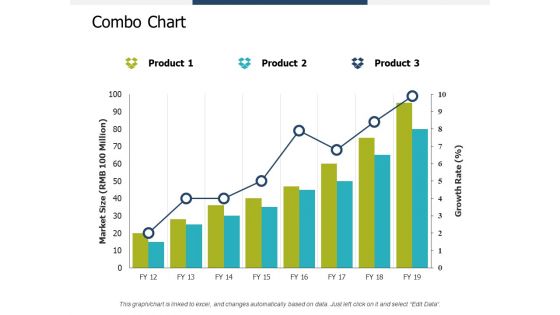
Combo Chart Investment Ppt PowerPoint Presentation Summary Infographic Template
This is a combo chart investment ppt powerpoint presentation summary infographic template. This is a three stage process. The stages in this process are finance, analysis, business, investment, marketing.
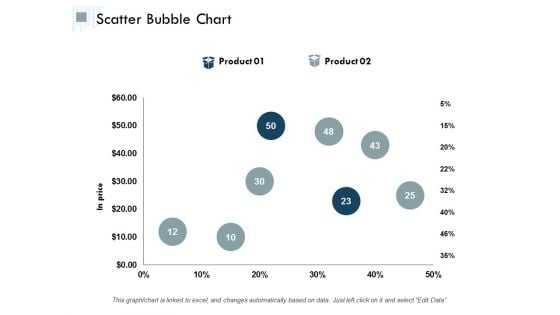
Scatter Bubble Chart Ppt PowerPoint Presentation Infographic Template Graphics Design
This is a scatter bubble chart ppt powerpoint presentation infographic template graphics design. This is a two stage process. The stages in this process are finance, analysis, business, investment, marketing.
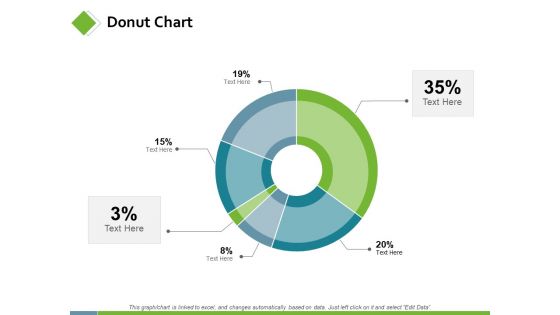
Donut Chart Marketing Planning Ppt PowerPoint Presentation Model Slideshow
This is a donut chart marketing planning ppt powerpoint presentation model slideshow. This is a six stage process. The stages in this process are finance, analysis, business, investment, marketing.
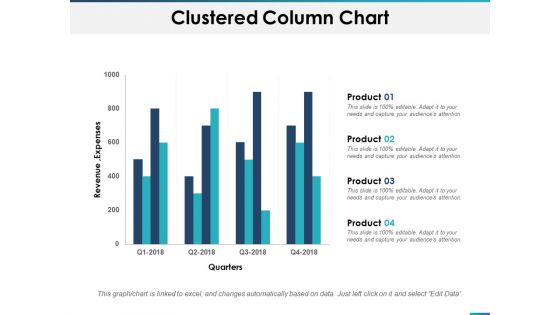
Clustered Column Chart Planning Ppt PowerPoint Presentation Portfolio Information
This is a clustered column chart planning ppt powerpoint presentation portfolio information. This is a four stage process. The stages in this process are finance, marketing, analysis, business, investment.
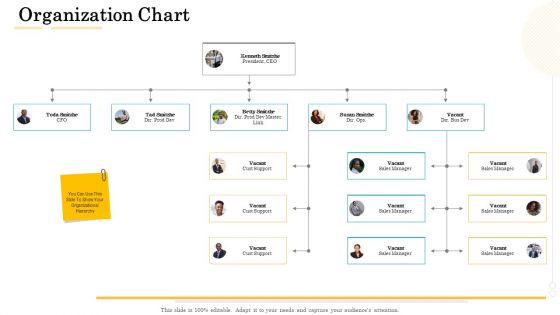
Administrative Regulation Organization Chart Ppt PowerPoint Presentation Styles Themes PDF
This is a administrative regulation organization chart ppt powerpoint presentation styles themes pdf template with various stages. Focus and dispense information on five stages using this creative set, that comes with editable features. It contains large content boxes to add your information on topics like president, ceo, cust support, sales manager. You can also showcase facts, figures, and other relevant content using this PPT layout. Grab it now.
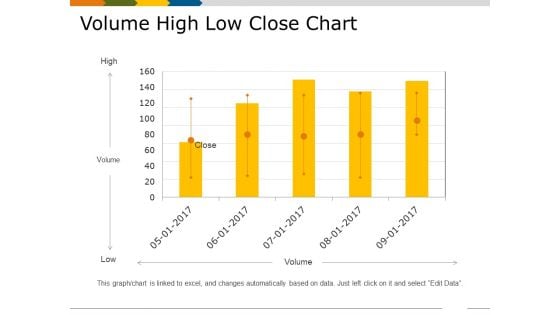
Volume High Low Close Chart Ppt PowerPoint Presentation Gallery Ideas
This is a volume high low close chart ppt powerpoint presentation gallery ideas. This is a five stage process. The stages in this process are high, volume, low, graph, business.
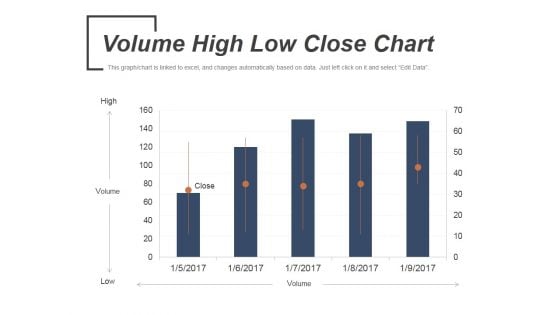
Volume High Low Close Chart Ppt PowerPoint Presentation Slides Portrait
This is a volume high low close chart ppt powerpoint presentation slides portrait. This is a five stage process. The stages in this process are volume, low, high, open, close.

High Low Close Chart Ppt PowerPoint Presentation Inspiration Professional
This is a high low close chart ppt powerpoint presentation inspiration professional. This is a ten stage process. The stages in this process are business, strategy, analysis, planning, high, volume, low.
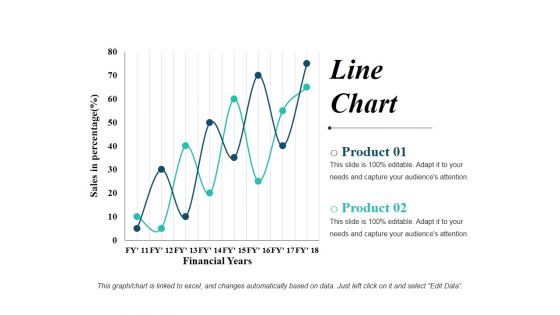
Line Chart Ppt PowerPoint Presentation Show Graphics Design
This is a line chart ppt powerpoint presentation show graphics design. This is a two stage process. The stages in this process are line graph, business, marketing, finance, planning.
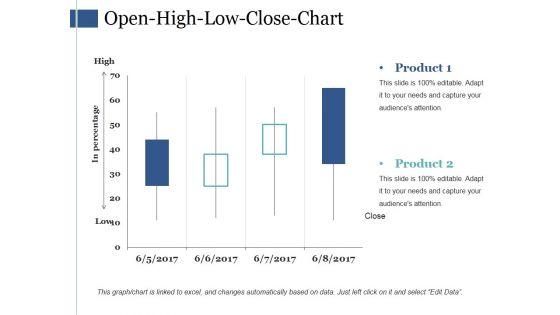
Open High Low Close Chart Ppt PowerPoint Presentation Styles Example
This is a open high low close chart ppt powerpoint presentation styles example. This is a four stage process. The stages in this process are business, marketing, finance, strategy, planning.
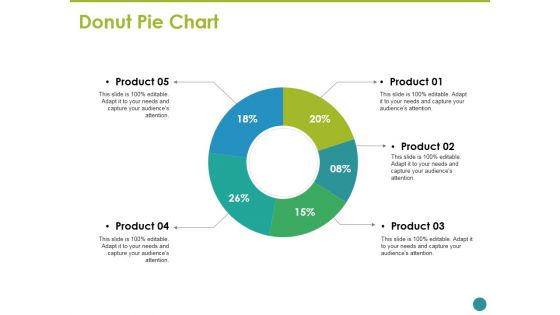
Donut Pie Chart Ppt PowerPoint Presentation Inspiration Graphic Images
This is a donut pie chart ppt powerpoint presentation inspiration graphic images. This is a five stage process. The stages in this process are business, marketing, strategy, planning, donut.
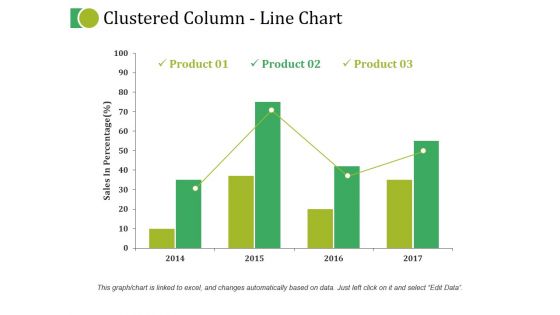
Clustered Column Line Chart Ppt PowerPoint Presentation Inspiration Graphics Pictures
This is a clustered column line chart ppt powerpoint presentation inspiration graphics pictures. This is a four stage process. The stages in this process are business, marketing, strategy, planning, finance.
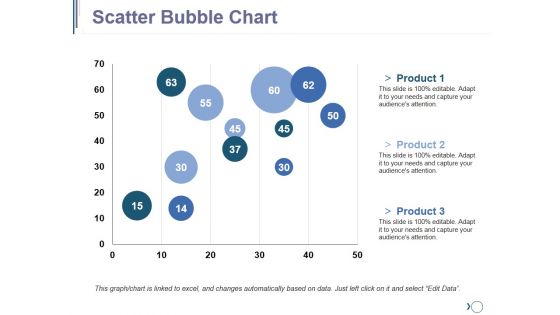
Scatter Bubble Chart Ppt PowerPoint Presentation Outline Graphics Pictures
This is a scatter bubble chart ppt powerpoint presentation outline graphics pictures. This is a three stage process. The stages in this process are finance, planning, business, marketing, strategy.
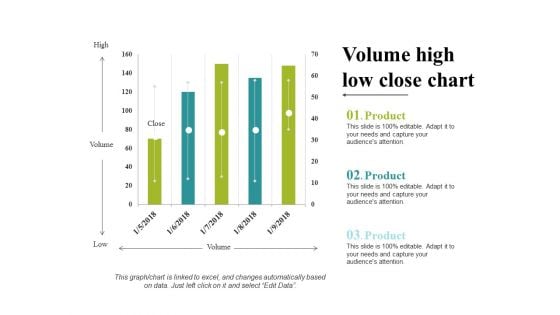
Volume High Low Close Chart Ppt PowerPoint Presentation Portfolio Clipart
This is a volume high low close chart ppt powerpoint presentation portfolio clipart. This is a five stage process. The stages in this process are business, marketing, strategy, planning, finance.
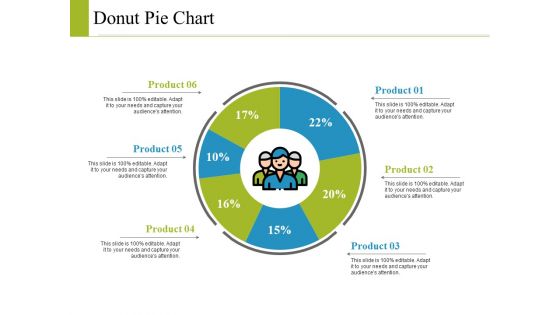
Donut Pie Chart Ppt PowerPoint Presentation Model Graphics Example
This is a donut pie chart ppt powerpoint presentation model graphics example. This is a six stage process. The stages in this process are business, marketing, strategy, planning, finance.
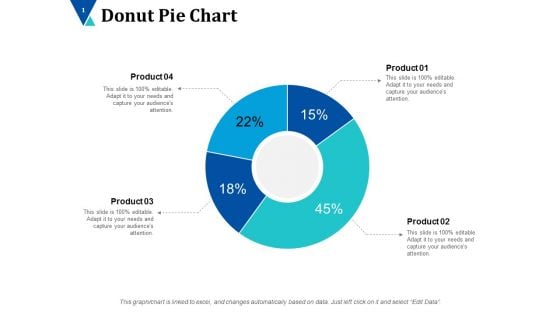
Donut Pie Chart Ppt PowerPoint Presentation Inspiration Designs Download
This is a donut pie chart ppt powerpoint presentation inspiration designs download. This is a four stage process. The stages in this process are donut, business, planning, marketing, finance.
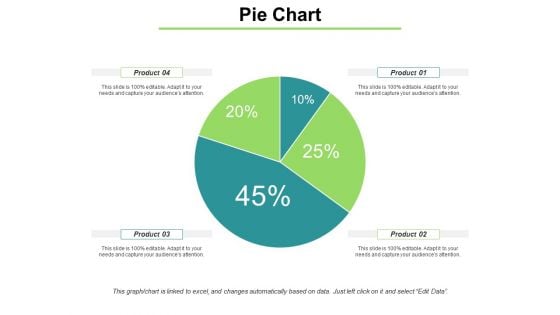
Pie Chart With Distrubation Ppt PowerPoint Presentation Model Ideas
This is a pie chart with distrubation ppt powerpoint presentation model ideas. This is a four stage process. The stages in this process are pie, finance, marketing, strategy, planning.
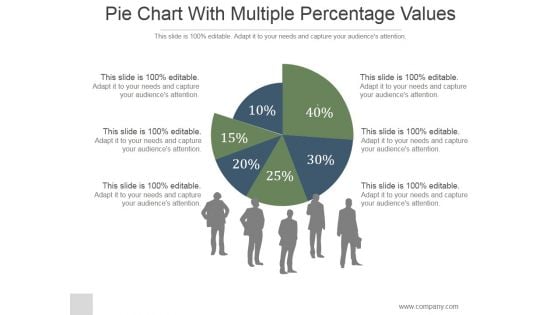
Pie Chart With Multiple Percentage Values Ppt PowerPoint Presentation Show
This is a pie chart with multiple percentage values ppt powerpoint presentation show. This is a six stage process. The stages in this process are pie, finance, people, silhouettes, communication.
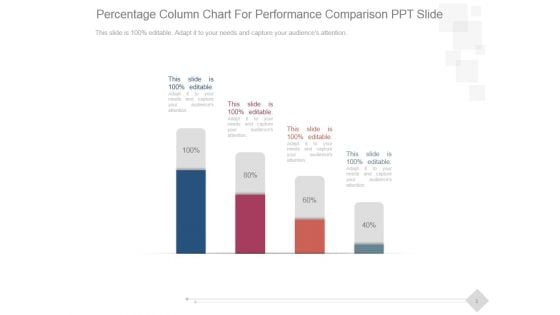
Percentage Column Chart For Performance Comparison Ppt PowerPoint Presentation Good
This is a percentage column chart for performance comparison ppt powerpoint presentation good. This is a four stage process. The stages in this process are business, marketing, technology, presentation, management.
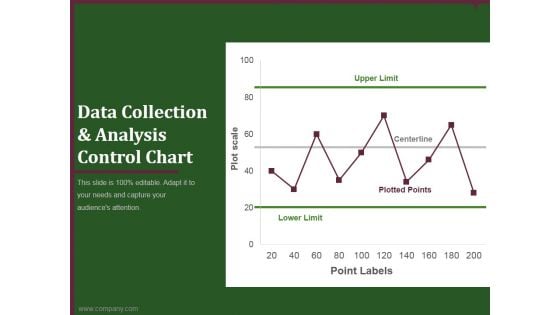
data collection and analysis control chart ppt powerpoint presentation styles
This is a data collection and analysis control chart ppt powerpoint presentation styles. This is a one stage process. The stages in this process are upper limit, centerline, plotted points, lower limit, point labels.
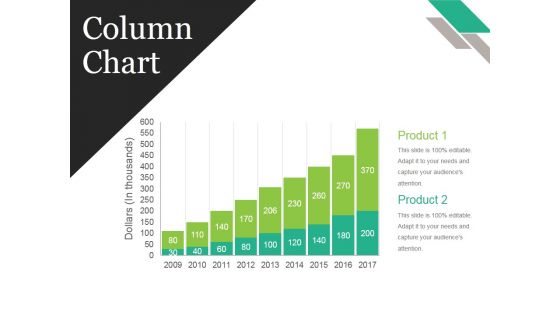
Column Chart Ppt PowerPoint Presentation Show Background Images
This is a column chart ppt powerpoint presentation show background images. This is a nine stage process. The stages in this process are business, strategy, marketing, analysis, growth strategy.
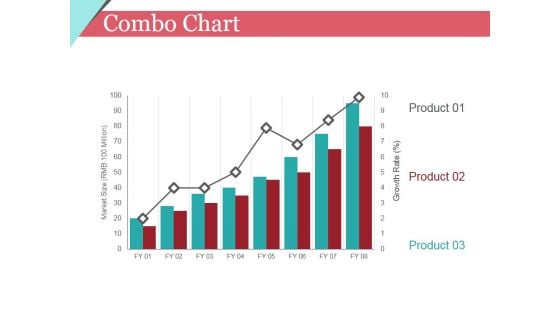
Combo Chart Ppt PowerPoint Presentation Summary Graphics Tutorials
This is a combo chart ppt powerpoint presentation summary graphics tutorials. This is a eight stage process. The stages in this process are product, growth rate, market size, business.
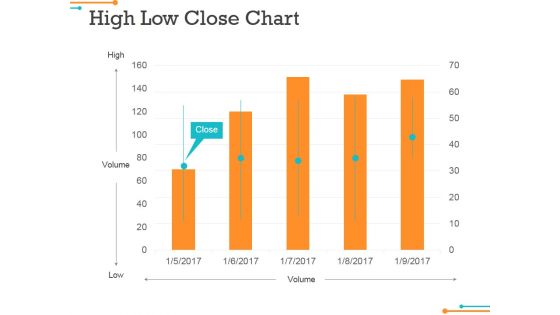
High Low Close Chart Ppt Powerpoint Presentation Gallery Slides
This is a high low close chart ppt powerpoint presentation gallery slides. This is a five stage process. The stages in this process are close, volume, high, low, graph.
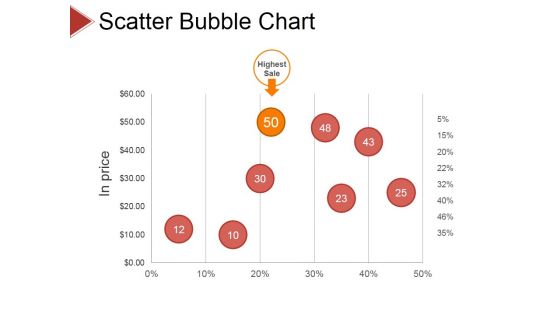
Scatter Bubble Chart Ppt PowerPoint Presentation Pictures Show
This is a scatter bubble chart ppt powerpoint presentation pictures show. This is a eight stage process. The stages in this process are business, strategy, analysis, pretention, highest sale.
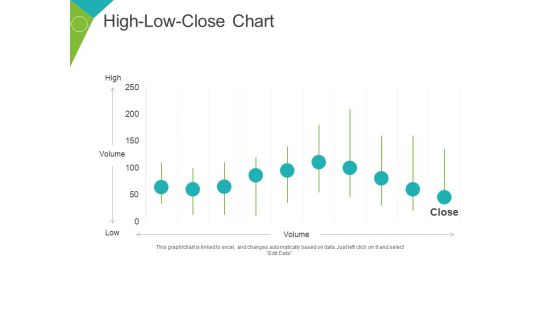
High Low Close Chart Ppt PowerPoint Presentation Layouts Guide
This is a high low close chart ppt powerpoint presentation layouts guide. This is a ten stage process. The stages in this process are high, volume, low, business, marketing, finance.
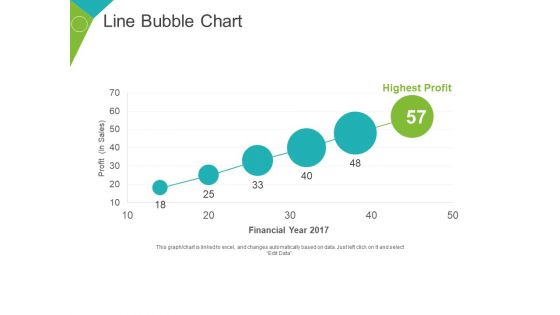
Line Bubble Chart Ppt PowerPoint Presentation Portfolio Slide Portrait
This is a line bubble chart ppt powerpoint presentation portfolio slide portrait. This is a six stage process. The stages in this process are highest profit, financial year, profit in sales, growth, business.
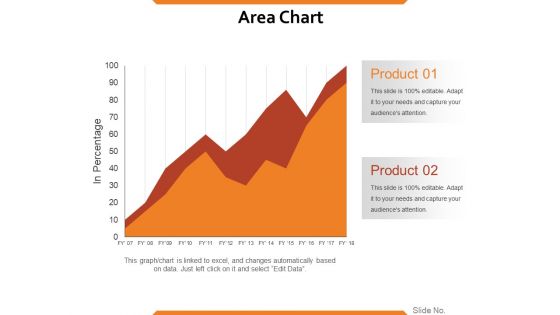
Area Chart Ppt PowerPoint Presentation Inspiration Slide Download
This is a area chart ppt powerpoint presentation inspiration slide download. This is a two stage process. The stages in this process are product, in percentage, business, growth, strategy, finance.
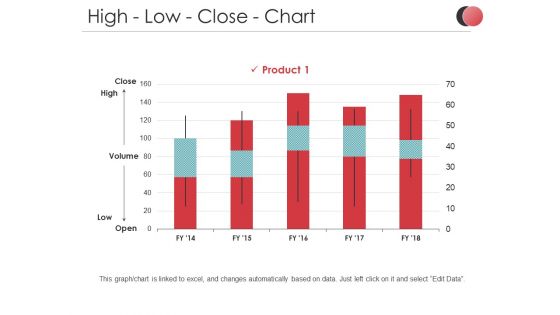
High Low Close Chart Ppt PowerPoint Presentation Ideas Brochure
This is a high low close chart ppt powerpoint presentation ideas brochure. This is a three stage process. The stages in this process are in percentage, product, business, marketing, finance.
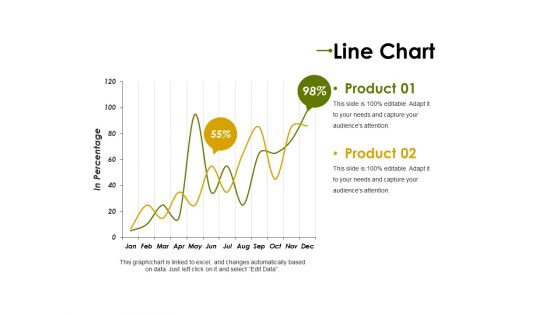
Line Chart Ppt PowerPoint Presentation Professional Clipart Images
This is a line chart ppt powerpoint presentation professional clipart images. This is a two stage process. The stages in this process are product, in percentage, graph, percentage, finance, business.
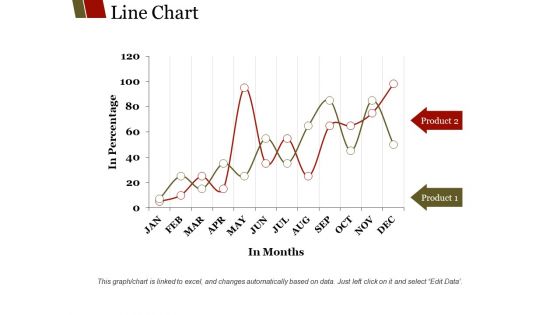
Line Chart Ppt PowerPoint Presentation Show Background Designs
This is a line chart ppt powerpoint presentation show background designs. This is a two stage process. The stages in this process are product, in months, in percentage, business.
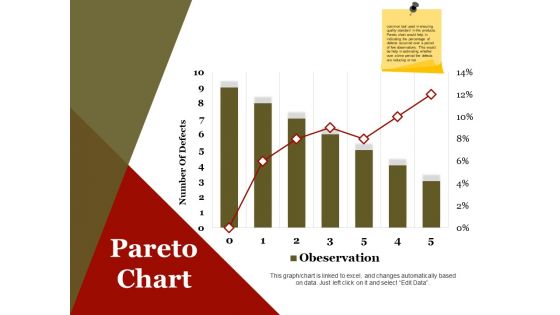
Pareto Chart Ppt PowerPoint Presentation Infographics Design Inspiration
This is a pareto chart ppt powerpoint presentation infographics design inspiration. This is a seven stage process. The stages in this process are number of defects, business, marketing, finance.
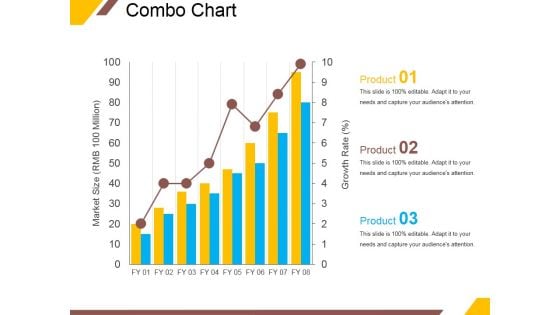
Combo Chart Ppt PowerPoint Presentation Professional Slide Download
This is a combo chart ppt powerpoint presentation professional slide download. This is a three stage process. The stages in this process are market size, growth rate, product, graph, growth.
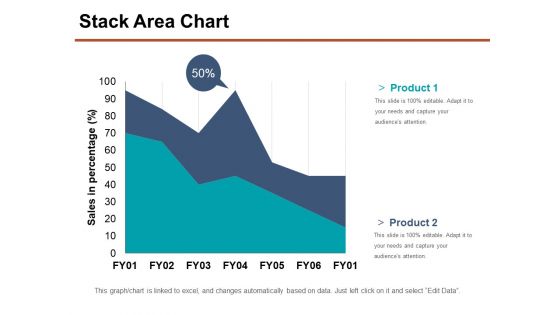
Stack Area Chart Ppt PowerPoint Presentation Show Samples
This is a stack area chart ppt powerpoint presentation show samples. This is a two stage process. The stages in this process are product, sales in percentage, business, marketing, percentage.
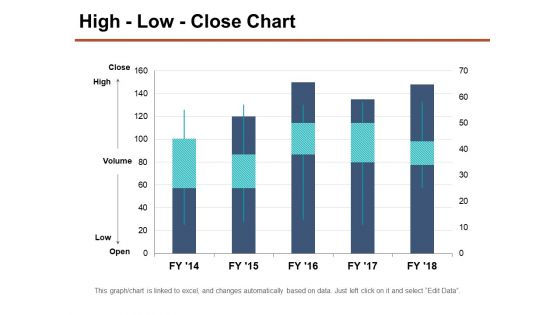
High Low Close Chart Ppt PowerPoint Presentation Layouts Objects
This is a high low close chart ppt powerpoint presentation layouts objects. This is a five stage process. The stages in this process are high, volume, low, business, marketing.
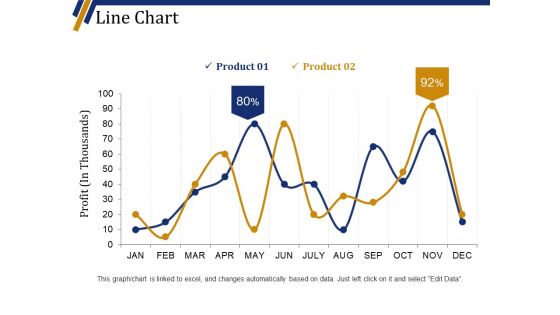
Line Chart Ppt PowerPoint Presentation Portfolio Background Designs
This is a line chart ppt powerpoint presentation portfolio background designs. This is a two stage process. The stages in this process are product, business, finance, marketing, profit in thousands.
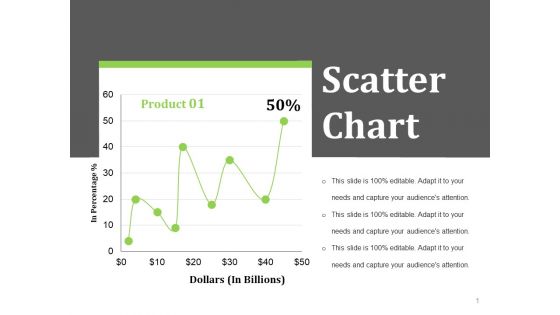
Scatter Chart Ppt PowerPoint Presentation Styles Layout Ideas
This is a scatter chart ppt powerpoint presentation styles layout ideas. This is a one stage process. The stages in this process are dollars in billions, in percentage, business, finance.
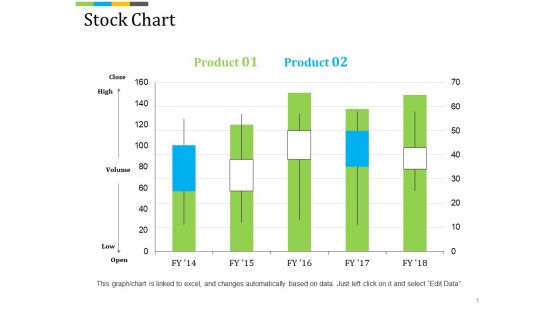
Stock Chart Ppt PowerPoint Presentation Professional Background Image
This is a stock chart ppt powerpoint presentation professional background image. This is a five stage process. The stages in this process are high, volume, low, finance, business, marketing.
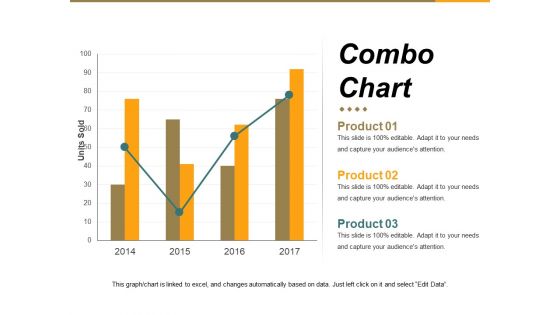
Combo Chart Ppt PowerPoint Presentation Infographics Example Introduction
This is a combo chart ppt powerpoint presentation infographics example introduction. This is a four stage process. The stages in this process are units sold, business, marketing, graph, growth.


 Continue with Email

 Home
Home


