Phases
Vector Showing Financial Ratio Evaluation Chart Icon Ppt PowerPoint Presentation Gallery Inspiration PDF
Persuade your audience using this vector showing financial ratio evaluation chart icon ppt powerpoint presentation gallery inspiration pdf. This PPT design covers three stages, thus making it a great tool to use. It also caters to a variety of topics including vector showing financial ratio evaluation chart icon. Download this PPT design now to present a convincing pitch that not only emphasizes the topic but also showcases your presentation skills.
Equity Stock Market Chart On Laptop Vector Icon Ppt PowerPoint Presentation Model Portrait PDF
Persuade your audience using this equity stock market chart on laptop vector icon ppt powerpoint presentation model portrait pdf. This PPT design covers three stages, thus making it a great tool to use. It also caters to a variety of topics including equity stock market chart on laptop vector icon. Download this PPT design now to present a convincing pitch that not only emphasizes the topic but also showcases your presentation skills.
Manager Analyzing Trends From Financial Modelling Chart Vector Icon Portrait PDF
Persuade your audience using this manager analyzing trends from financial modelling chart vector icon portrait pdf. This PPT design covers three stages, thus making it a great tool to use. It also caters to a variety of topics including manager analyzing trends from financial modelling chart vector icon. Download this PPT design now to present a convincing pitch that not only emphasizes the topic but also showcases your presentation skills.
Data Consumption Pie Chart With Arrows Vector Icon Ppt PowerPoint Presentation File Example Introduction PDF
Persuade your audience using this data consumption pie chart with arrows vector icon ppt powerpoint presentation file example introduction pdf. This PPT design covers three stages, thus making it a great tool to use. It also caters to a variety of topics including data consumption pie chart with arrows vector icon. Download this PPT design now to present a convincing pitch that not only emphasizes the topic but also showcases your presentation skills.
Organization Annual Performance Review Chart Vector Icon Ppt Pictures Shapes PDF
Persuade your audience using this organization annual performance review chart vector icon ppt pictures shapes pdf. This PPT design covers three stages, thus making it a great tool to use. It also caters to a variety of topics including organization annual performance review chart vector icon. Download this PPT design now to present a convincing pitch that not only emphasizes the topic but also showcases your presentation skills.
Quarterly Sales By Areas Report With Pie Chart Vector Icon Ppt PowerPoint Presentation Layouts Gallery PDF
Pitch your topic with ease and precision using this quarterly sales by areas report with pie chart vector icon ppt powerpoint presentation layouts gallery pdf. This layout presents information on quarterly sales by areas report with pie chart vector icon. It is also available for immediate download and adjustment. So, changes can be made in the color, design, graphics or any other component to create a unique layout.
Project Efficiency Status Dashboard Icon With Graphs And Charts Demonstration PDF
Persuade your audience using this Project Efficiency Status Dashboard Icon With Graphs And Charts Demonstration PDF. This PPT design covers three stages, thus making it a great tool to use. It also caters to a variety of topics including Project Efficiency Status Dashboard Icon WITH Graphs AND Charts. Download this PPT design now to present a convincing pitch that not only emphasizes the topic but also showcases your presentation skills.
Icon For Companygs Key Stakeholders Evaluation Plan And Charts Pictures PDF
Persuade your audience using this Icon For Companygs Key Stakeholders Evaluation Plan And Charts Pictures PDF. This PPT design covers three stages, thus making it a great tool to use. It also caters to a variety of topics including Icon For Companygs, Key Stakeholders, Evaluation, Plan And Charts. Download this PPT design now to present a convincing pitch that not only emphasizes the topic but also showcases your presentation skills.
Decision Making Flow Chart Icon With Arrows Ppt Layouts Graphics Design PDF
Persuade your audience using this Decision Making Flow Chart Icon With Arrows Ppt Layouts Graphics Design PDF. This PPT design covers four stages, thus making it a great tool to use. It also caters to a variety of topics including Decision Making, Flow Chart, Icon With Arrows. Download this PPT design now to present a convincing pitch that not only emphasizes the topic but also showcases your presentation skills.
Accounting Ratio Assessment With Growth Chart Icon Ppt PowerPoint Presentation Show Inspiration PDF
Persuade your audience using this Accounting Ratio Assessment With Growth Chart Icon Ppt PowerPoint Presentation Show Inspiration PDF. This PPT design covers three stages, thus making it a great tool to use. It also caters to a variety of topics including Accounting Ratio, Assessment Growth, Chart Icon. Download this PPT design now to present a convincing pitch that not only emphasizes the topic but also showcases your presentation skills.
Internal Corporate Audit Schedule Plan Chart By Departments Icon Ideas PDF
Persuade your audience using this Internal Corporate Audit Schedule Plan Chart By Departments Icon Ideas PDF. This PPT design covers three stages, thus making it a great tool to use. It also caters to a variety of topics including Departments Icon, Plan Chart, Internal Corporate Audit Schedule. Download this PPT design now to present a convincing pitch that not only emphasizes the topic but also showcases your presentation skills.
5 Years Mutual Funds Performance Comparative Analysis Chart Icon Ppt Show Gridlines PDF
Persuade your audience using this 5 Years Mutual Funds Performance Comparative Analysis Chart Icon Ppt Show Gridlines PDF. This PPT design covers three stages, thus making it a great tool to use. It also caters to a variety of topics including 5 Years, Mutual Funds, Performance Comparative, Analysis, Chart Icon. Download this PPT design now to present a convincing pitch that not only emphasizes the topic but also showcases your presentation skills.
Marketing And Sales Risk Evaluation Icon With Pie Chart Rules PDF
Persuade your audience using this Marketing And Sales Risk Evaluation Icon With Pie Chart Rules PDF. This PPT design covers three stages, thus making it a great tool to use. It also caters to a variety of topics including Marketing And Sales Risk, Evaluation Icon, Pie Chart. Download this PPT design now to present a convincing pitch that not only emphasizes the topic but also showcases your presentation skills.
E Commerce Website Development Flow Chart Icon Ppt Styles Layout Ideas PDF
Persuade your audience using this E Commerce Website Development Flow Chart Icon Ppt Styles Layout Ideas PDF. This PPT design covers three stages, thus making it a great tool to use. It also caters to a variety of topics including E Commerce, Website Development, Flow Chart, Icon. Download this PPT design now to present a convincing pitch that not only emphasizes the topic but also showcases your presentation skills.
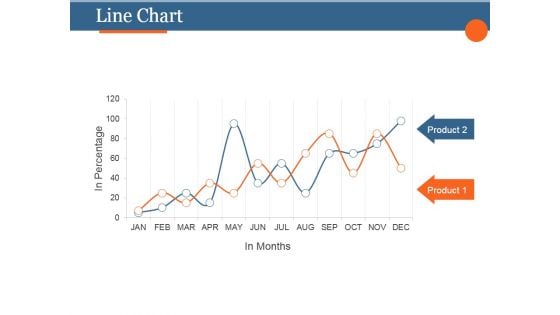
Line Chart Ppt PowerPoint Presentation Background Image
This is a line chart ppt powerpoint presentation background image. This is a two stage process. The stages in this process are product, planning, strategy, marketing, management.
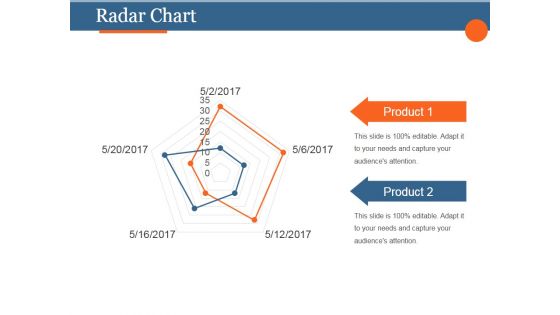
Radar Chart Ppt PowerPoint Presentation Slide
This is a radar chart ppt powerpoint presentation slide. This is a two stage process. The stages in this process are product, strategy, marketing, management, business.
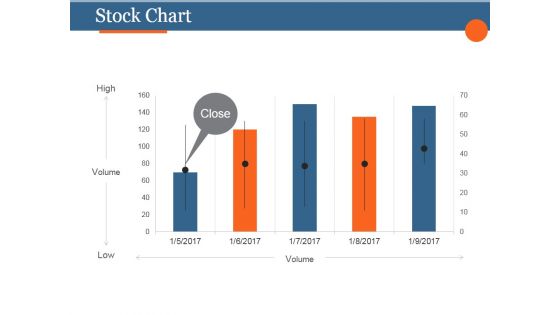
Stock Chart Ppt PowerPoint Presentation Clipart
This is a stock chart ppt powerpoint presentation clipart. This is a five stage process. The stages in this process are high, volume, low, close.
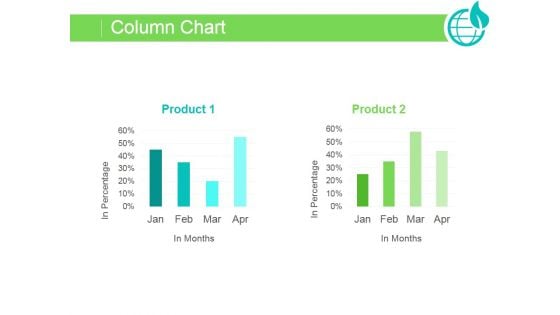
Column Chart Ppt PowerPoint Presentation Slide Download
This is a column chart ppt powerpoint presentation slide download. This is a two stage process. The stages in this process are business, marketing, graph, success, growth.
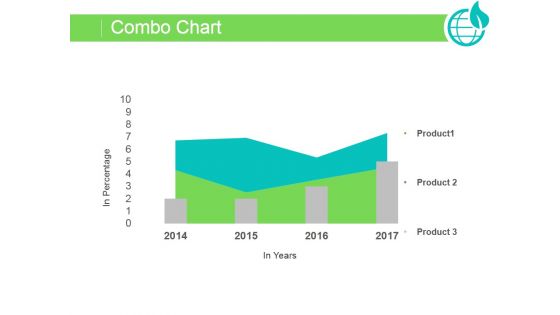
Combo Chart Ppt PowerPoint Presentation Pictures
This is a combo chart ppt powerpoint presentation pictures. This is a three stage process. The stages in this process are graph, success, growth, business, marketing.
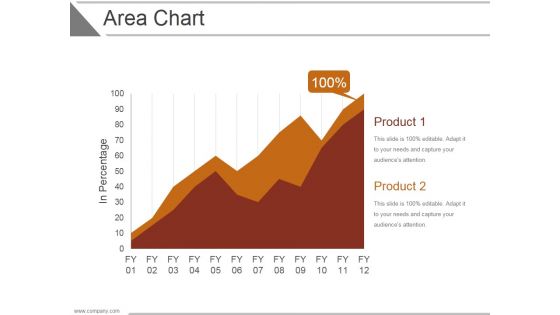
Area Chart Ppt PowerPoint Presentation Deck
This is a area chart ppt powerpoint presentation deck. This is a two stage process. The stages in this process are business, strategy, analysis, marketing, growth strategy.
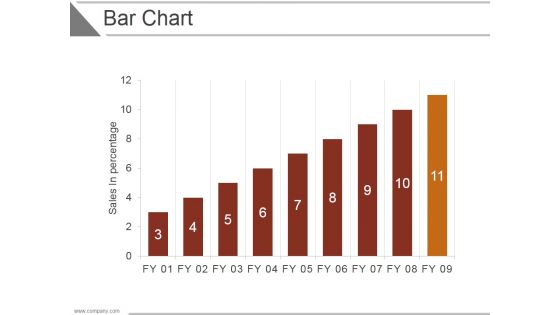
Bar Chart Ppt PowerPoint Presentation Inspiration
This is a bar chart ppt powerpoint presentation inspiration. This is a nine stage process. The stages in this process are business, strategy, analysis, marketing, growth strategy.
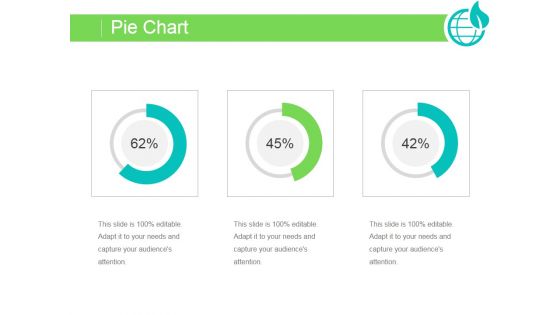
Pie Chart Ppt PowerPoint Presentation Template
This is a pie chart ppt powerpoint presentation template. This is a three stage process. The stages in this process are business, strategy, marketing, analysis, finance.
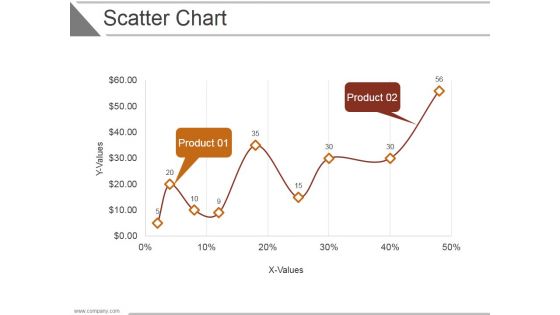
Scatter Chart Ppt PowerPoint Presentation Backgrounds
This is a scatter chart ppt powerpoint presentation backgrounds. This is a two stage process. The stages in this process are product, strategy, business, marketing, management.
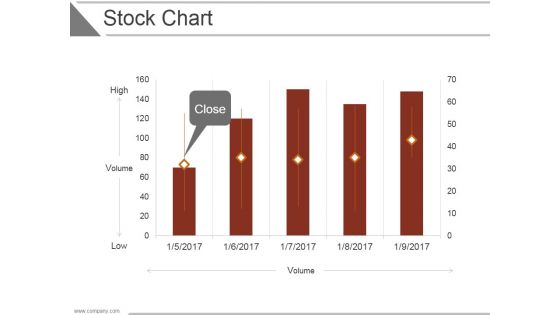
Stock Chart Ppt PowerPoint Presentation Introduction
This is a stock chart ppt powerpoint presentation introduction. This is a five stage process. The stages in this process are planning, strategy, business, marketing, management.
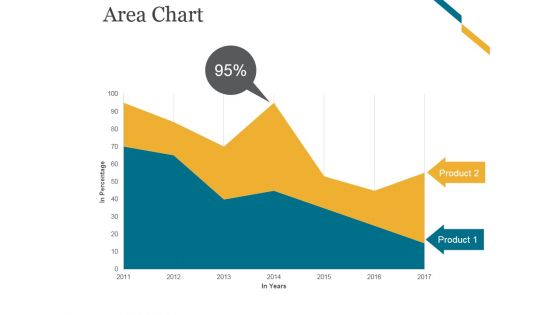
Area Chart Ppt PowerPoint Presentation Summary
This is a area chart ppt powerpoint presentation summary. This is a two stage process. The stages in this process are business, marketing, finance, timeline, product.
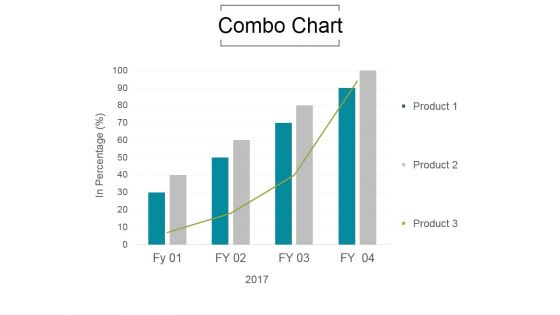
Combo Chart Ppt PowerPoint Presentation Information
This is a combo chart ppt powerpoint presentation information. This is a four stage process. The stages in this process are growth, product, in percentage.
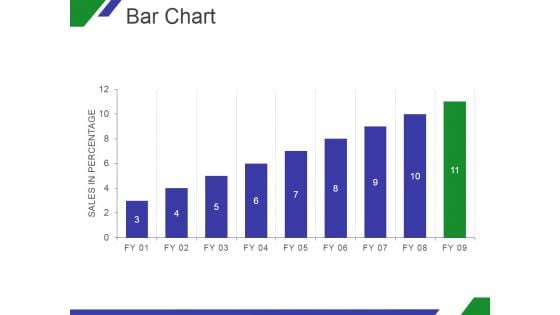
Bar Chart Ppt PowerPoint Presentation Ideas
This is a bar chart ppt powerpoint presentation ideas. This is a nine stage process. The stages in this process are graph, in percentage, growth, business, marketing.

Column Chart Ppt PowerPoint Presentation Deck
This is a column chart ppt powerpoint presentation deck. This is a nine stage process. The stages in this process are business, marketing, product, graph, growth.
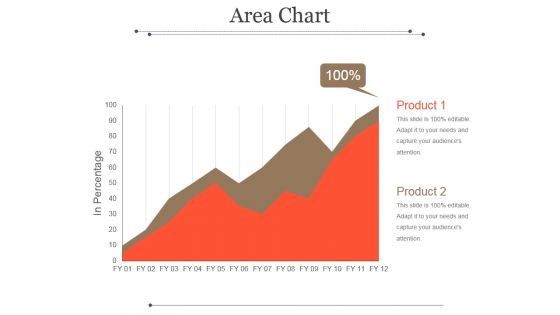
Area Chart Ppt PowerPoint Presentation Picture
This is a area chart ppt powerpoint presentation picture. This is a two stage process. The stages in this process are product, in percentage, graph, management, business.
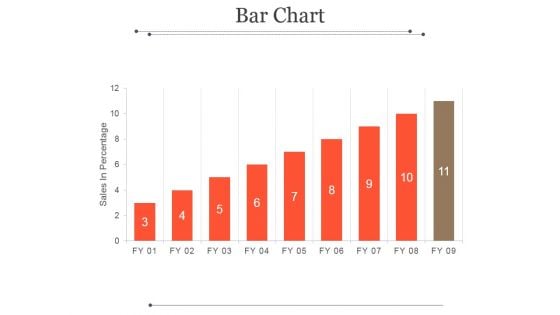
Bar Chart Ppt PowerPoint Presentation Microsoft
This is a bar chart ppt powerpoint presentation microsoft. This is a eleven stage process. The stages in this process are sales in percentage, fy, graph, success, business.

Combo Chart Ppt PowerPoint Presentation Sample
This is a combo chart ppt powerpoint presentation sample. This is a eight stage process. The stages in this process are product, market size, business, marketing, growth.
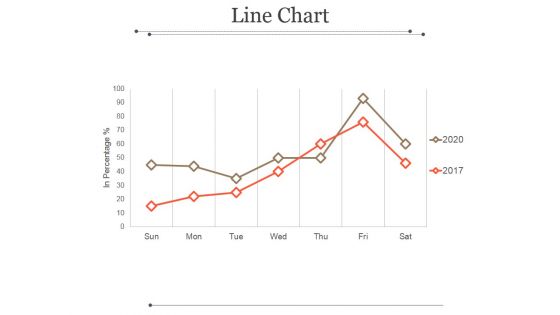
Line Chart Ppt PowerPoint Presentation Ideas
This is a line chart ppt powerpoint presentation ideas. This is a two stage process. The stages in this process are marketing, in percentage, sun, mon, tue, wed.
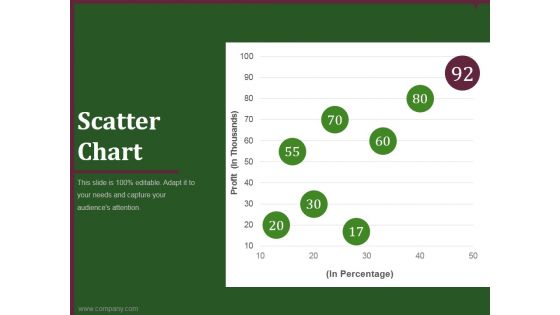
Scatter Chart Ppt PowerPoint Presentation Outline
This is a scatter chart ppt powerpoint presentation outline. This is a five stage process. The stages in this process are business, marketing, graph, percentage, finance.
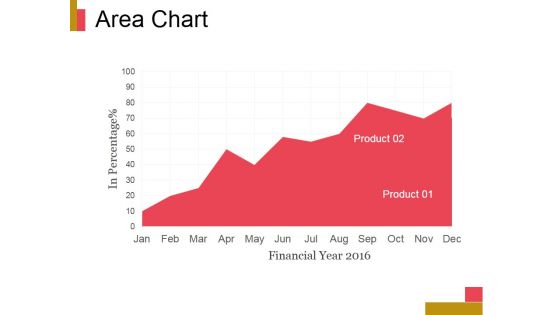
Area Chart Ppt PowerPoint Presentation Professional
This is a area chart ppt powerpoint presentation professional. This is a one stage process. The stages in this process are product, in percentage, jan, feb, mar, apr.
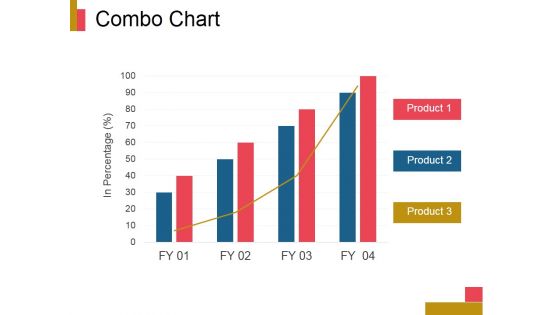
Combo Chart Ppt PowerPoint Presentation Template
This is a combo chart ppt powerpoint presentation template. This is a four stage process. The stages in this process are product, growth, graph, management, business.
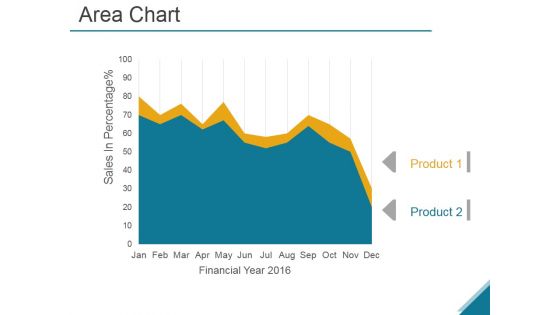
Area Chart Ppt PowerPoint Presentation Show
This is a area chart ppt powerpoint presentation show. This is a two stage process. The stages in this process are sales in percentage, business, marketing, analysis, success.
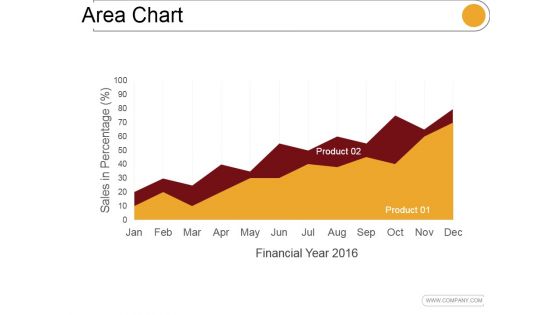
Area Chart Ppt PowerPoint Presentation Samples
This is a area chart ppt powerpoint presentation samples. This is a two stage process. The stages in this process are financial year, sales in percentage, jan, feb.
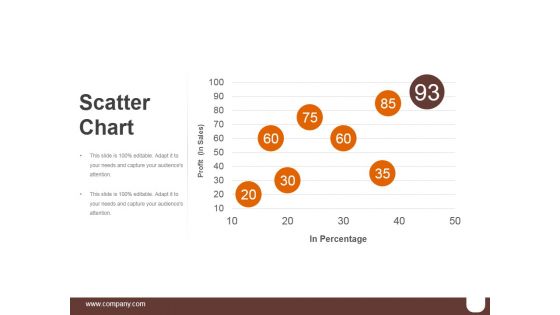
Scatter Chart Ppt PowerPoint Presentation Graphics
This is a scatter chart ppt powerpoint presentation graphics. This is a five stage process. The stages in this process are business, marketing, percentage, success, finance.
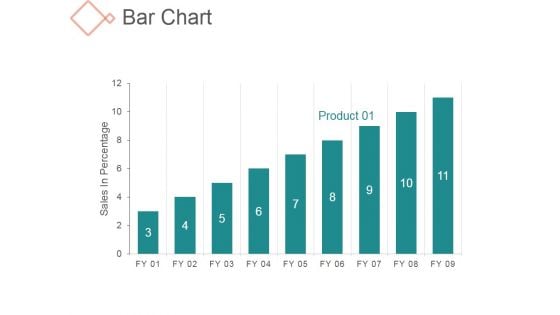
Bar Chart Ppt PowerPoint Presentation Styles
This is a bar chart ppt powerpoint presentation styles. This is a nine stage process. The stages in this process are business, management, sales in percentage, growth.
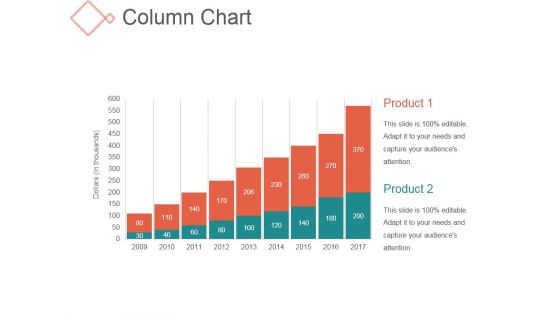
Column Chart Ppt PowerPoint Presentation Professional
This is a column chart ppt powerpoint presentation professional. This is a nine stage process. The stages in this process are product, growth, marketing, management.
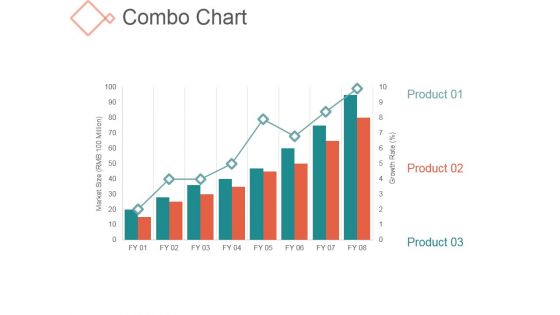
Combo Chart Ppt PowerPoint Presentation Tips
This is a combo chart ppt powerpoint presentation tips. This is a eight stage process. The stages in this process are product, growth, marketing, management.
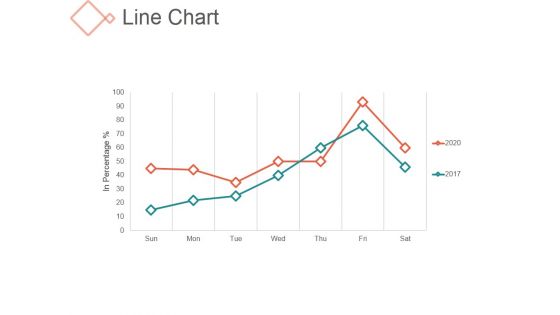
Line Chart Ppt PowerPoint Presentation Show
This is a line chart ppt powerpoint presentation show. This is a seven stage process. The stages in this process are sun, mon, tue, wed.
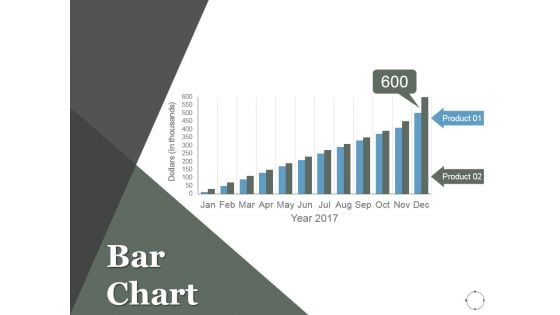
Bar Chart Ppt PowerPoint Presentation Model
This is a bar chart ppt powerpoint presentation model. This is a two stage process. The stages in this process are business, marketing, product, planning, management.
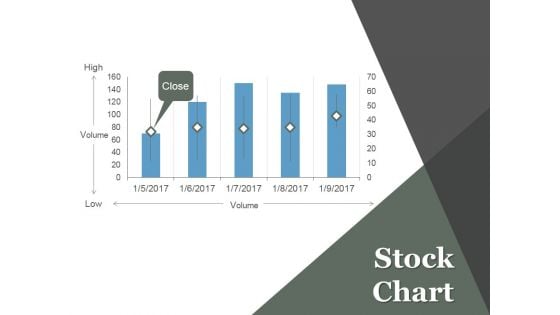
Stock Chart Ppt PowerPoint Presentation Information
This is a stock chart ppt powerpoint presentation information. This is a five stage process. The stages in this process are projects, marketing, high, volume, low.
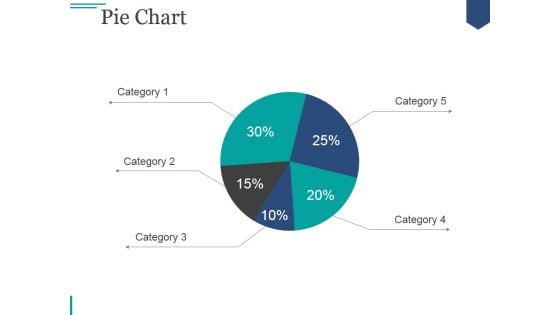
Pie Chart Ppt PowerPoint Presentation Visual Aids
This is a pie chart ppt powerpoint presentation visual aids. This is a five stage process. The stages in this process are pie, finance, analysis, division, percentage.
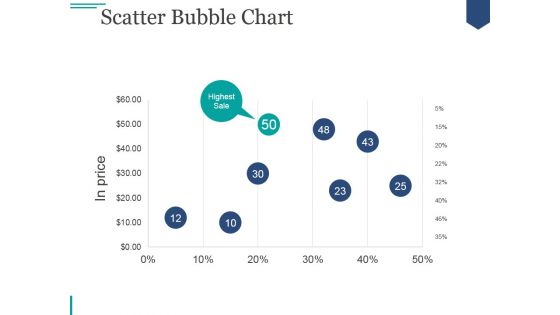
Scatter Bubble Chart Ppt PowerPoint Presentation Ideas
This is a scatter bubble chart ppt powerpoint presentation ideas. This is a five stage process. The stages in this process are highest sale, business, marketing, strategy, price.
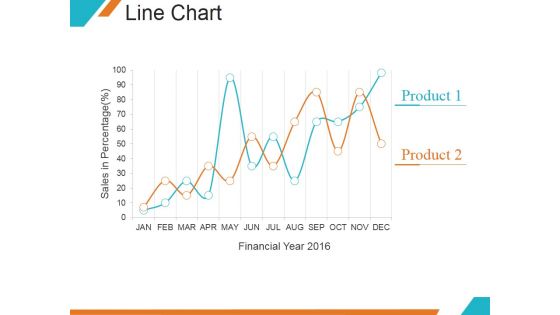
Line Chart Ppt PowerPoint Presentation Samples
This is a line chart ppt powerpoint presentation samples. This is a two stage process. The stages in this process are financial year, product, growth, marketing.
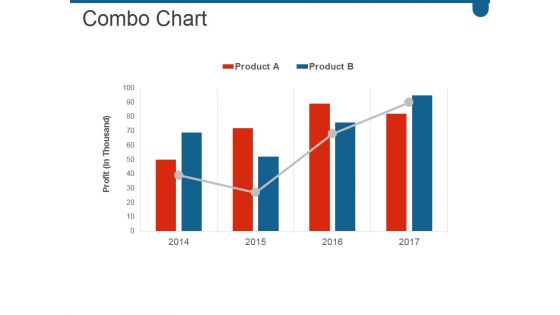
Combo Chart Ppt PowerPoint Presentation Samples
This is a combo chart ppt powerpoint presentation samples. This is a four stage process. The stages in this process are business, marketing, strategy, success, growth.
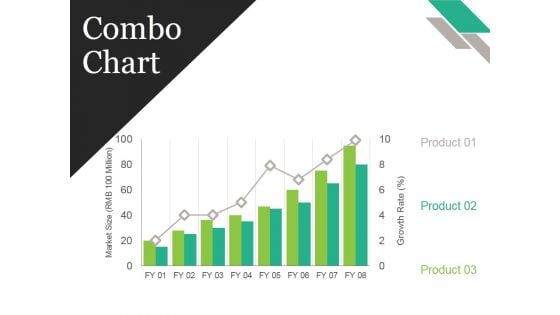
Combo Chart Ppt PowerPoint Presentation Pictures Gallery
This is a combo chart ppt powerpoint presentation pictures gallery. This is a eight stage process. The stages in this process are business, strategy, marketing, analysis, growth strategy.
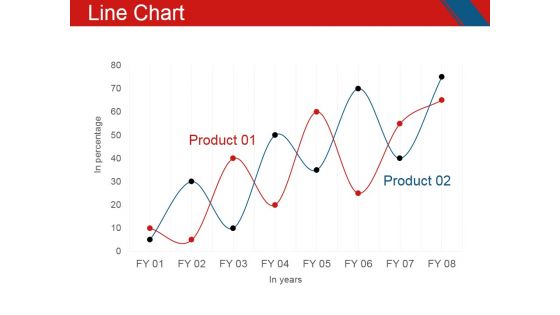
Line Chart Ppt PowerPoint Presentation File Layout
This is a line chart ppt powerpoint presentation file layout. This is a two stage process. The stages in this process are business, management, growth, product, marketing.
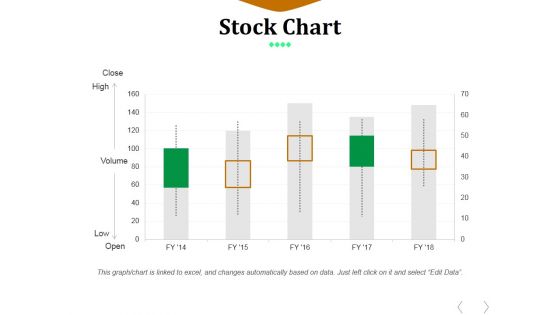
Stock Chart Ppt PowerPoint Presentation Professional Maker
This is a stock chart ppt powerpoint presentation professional maker. This is a five stage process. The stages in this process are close, high, volume, low, open.
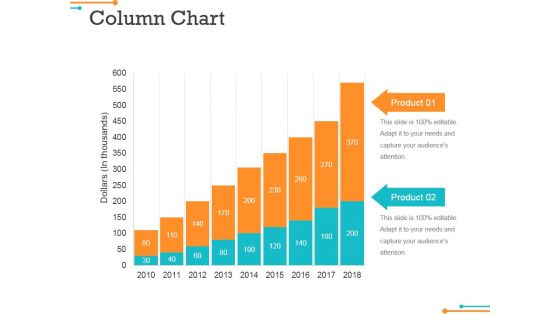
Column Chart Ppt Powerpoint Presentation Professional Model
This is a column chart ppt powerpoint presentation professional model. This is a two stage process. The stages in this process are product, dollars in thousands, graph, growth.
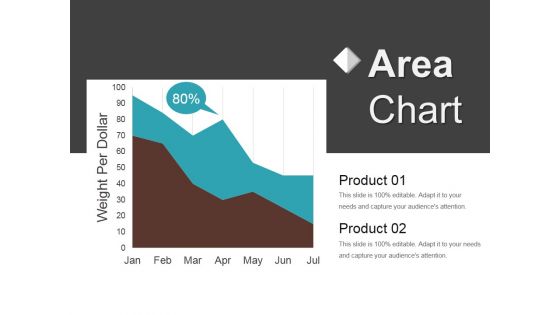
Area Chart Ppt PowerPoint Presentation Show Slide
This is a area chart ppt powerpoint presentation show slide. This is a two stage process. The stages in this process are business, marketing, finance, management, strategy.
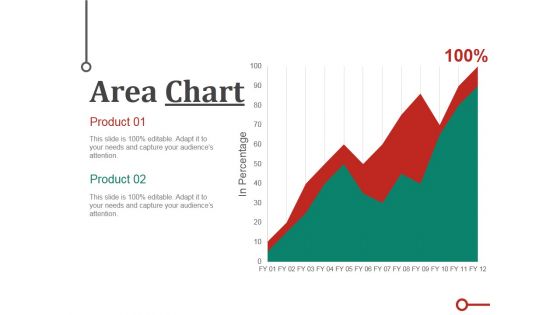
Area Chart Ppt PowerPoint Presentation Ideas Files
This is a area chart ppt powerpoint presentation ideas files. This is a two stage process. The stages in this process are graph, growth, success, business, marketing.
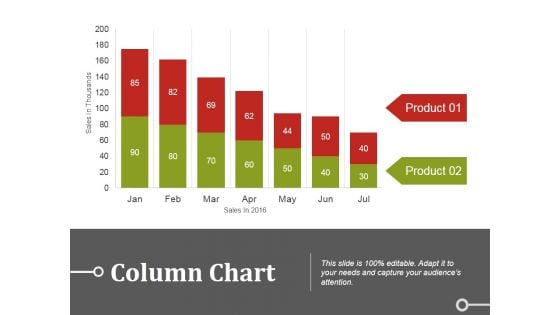
Column Chart Ppt PowerPoint Presentation Summary Introduction
This is a column chart ppt powerpoint presentation summary introduction. This is a two stage process. The stages in this process are business, marketing, bar, graph, finance.
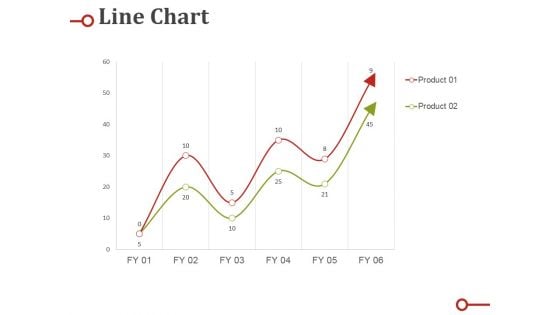
Line Chart Ppt PowerPoint Presentation Layouts Microsoft
This is a line chart ppt powerpoint presentation layouts microsoft. This is a two stage process. The stages in this process are business, marketing, strategy, line, success.

Column Chart Ppt PowerPoint Presentation Ideas Format
This is a column chart ppt powerpoint presentation ideas format. This is a two stage process. The stages in this process are business, strategy, marketing, planning, finance.

Scatter Chart Ppt PowerPoint Presentation File Example
This is a scatter chart ppt powerpoint presentation file example. This is a twelve stage process. The stages in this process are business, strategy, marketing, analysis, finance.
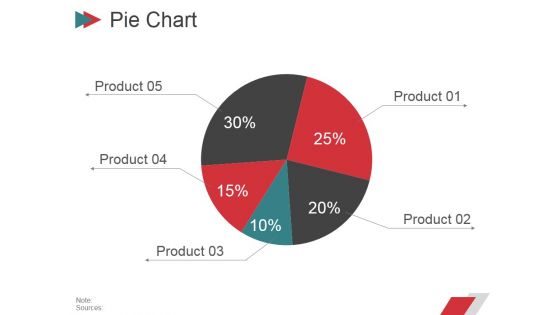
Pie Chart Ppt PowerPoint Presentation Deck
This is a pie chart ppt powerpoint presentation deck. This is a five stage process. The stages in this process are business, pie, finance, percentage, product.
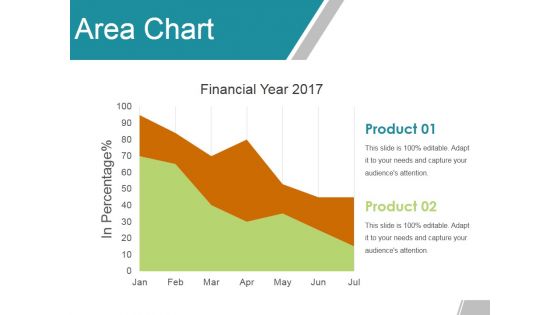
Area Chart Ppt Powerpoint Presentation Ideas Templates
This is a area chart ppt powerpoint presentation ideas templates. This is a two stage process. The stages in this process are product, financial year, in percentage, graph.


 Continue with Email

 Home
Home


