Phases
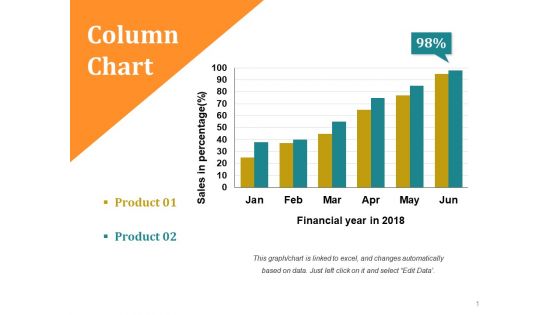
Column Chart Ppt PowerPoint Presentation Slides Smartart
This is a column chart ppt powerpoint presentation slides smartart. This is a two stage process. The stages in this process are sales in percentage, financial year in, business, growth, strategy.
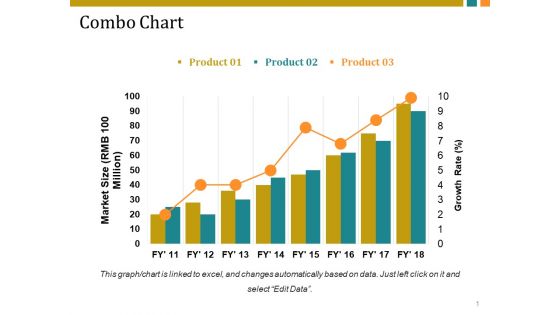
Combo Chart Ppt PowerPoint Presentation Guide
This is a combo chart ppt powerpoint presentation guide. This is a three stage process. The stages in this process are market size, growth rate, business, growth, graph, strategy.
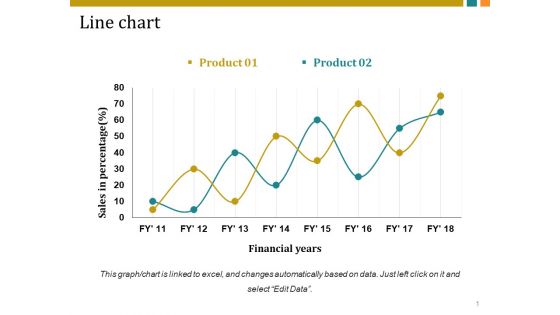
Line Chart Ppt PowerPoint Presentation Inspiration Vector
This is a line chart ppt powerpoint presentation inspiration vector. This is a two stage process. The stages in this process are sales in percentage, financial years, business, marketing, growth.
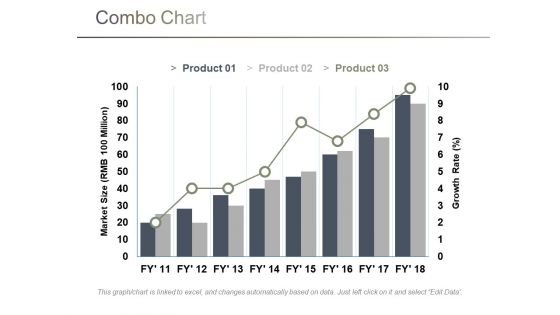
Combo Chart Ppt PowerPoint Presentation Pictures Shapes
This is a combo chart ppt powerpoint presentation pictures shapes. This is a three stage process. The stages in this process are market size, growth rate, business, marketing, graph.
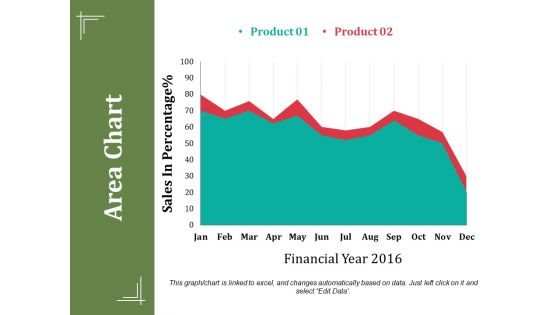
Area Chart Ppt PowerPoint Presentation Summary Show
This is a area chart ppt powerpoint presentation summary show. This is a two stage process. The stages in this process are sales in percentage, financial year, business, marketing, finance.
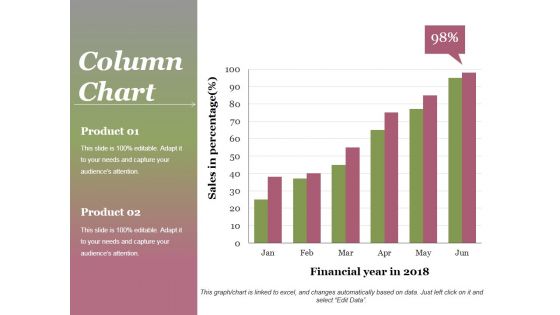
Column Chart Ppt PowerPoint Presentation Gallery Background
This is a column chart ppt powerpoint presentation gallery background. This is a two stage process. The stages in this process are product, sales in percentage, financial year, graph, success.
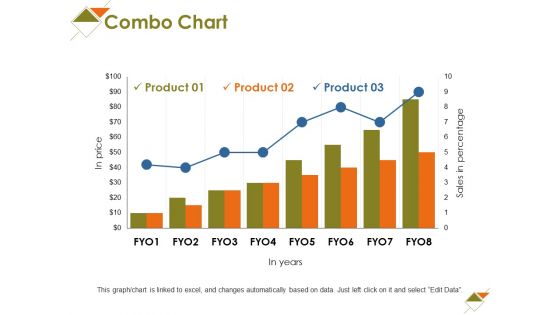
Combo Chart Ppt PowerPoint Presentation Show Elements
This is a combo chart ppt powerpoint presentation show elements. This is a three stage process. The stages in this process are in price, in years, business, marketing, growth.
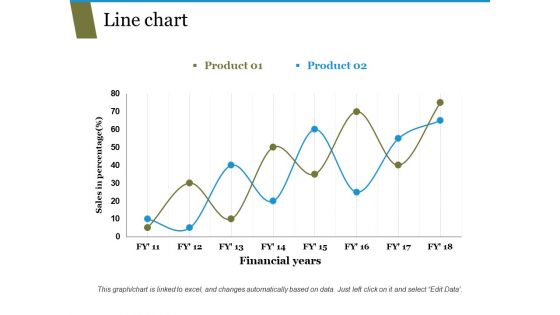
Line Chart Ppt PowerPoint Presentation Pictures Templates
This is a line chart ppt powerpoint presentation pictures templates. This is a two stage process. The stages in this process are sales in percentage, financial years, business, marketing, growth.
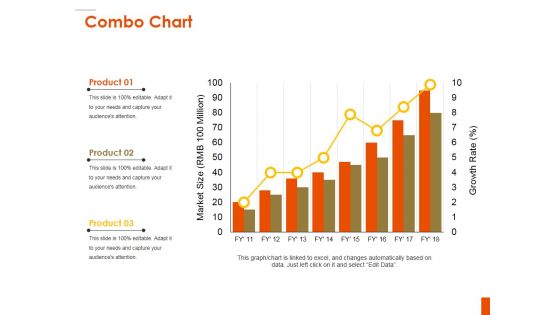
Combo Chart Ppt PowerPoint Presentation Inspiration Background
This is a combo chart ppt powerpoint presentation inspiration background. This is a three stage process. The stages in this process are product, bar graph, market size, growth, growth rate.
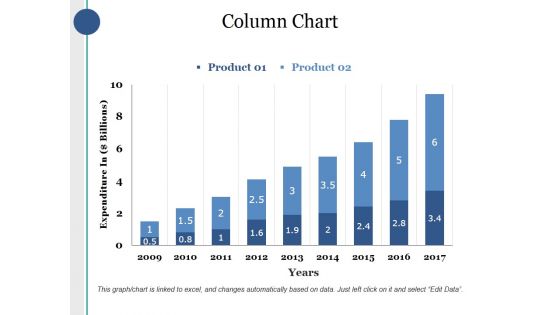
Column Chart Ppt PowerPoint Presentation Infographics Deck
This is a column chart ppt powerpoint presentation infographics deck. This is a two stage process. The stages in this process are product, expenditure in, years, bar graph, growth.
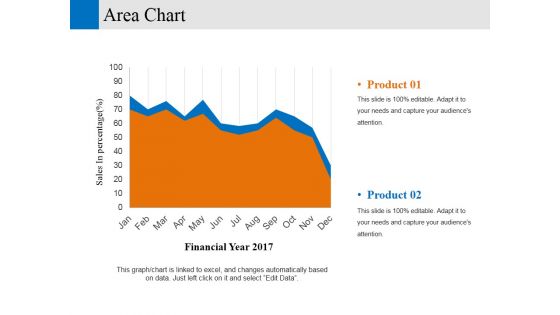
area chart ppt powerpoint presentation professional elements
This is a area chart ppt powerpoint presentation professional elements. This is a two stage process. The stages in this process are financial year sales in percentage, business, marketing, graph.
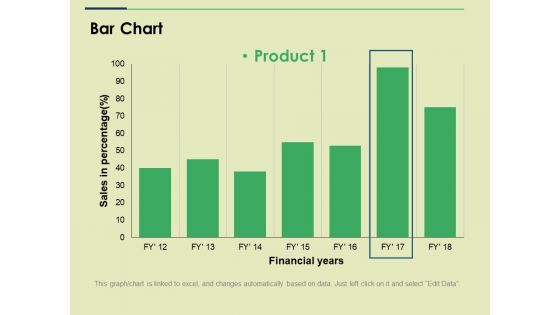
Bar Chart Ppt PowerPoint Presentation File Slide
This is a bar chart ppt powerpoint presentation file slide. This is a one stage process. The stages in this process are sales in percentage financial years, business, marketing, strategy, graph.
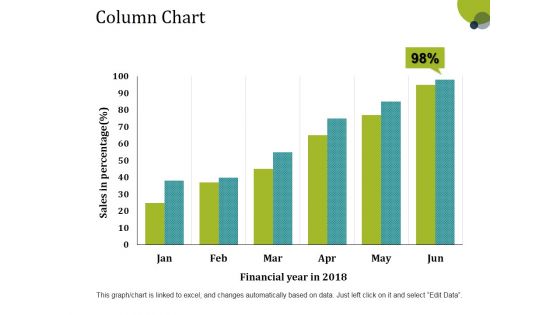
Column Chart Ppt PowerPoint Presentation Layouts Tips
This is a column chart ppt powerpoint presentation layouts tips. This is a six stage process. The stages in this process are sales in percentage, financial year, bar graph, growth, success.
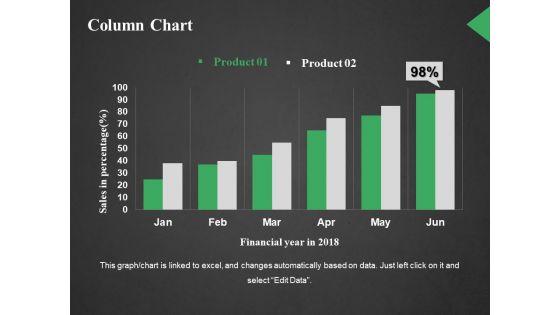
Column Chart Ppt PowerPoint Presentation Outline Styles
This is a column chart ppt powerpoint presentation outline styles. This is a two stage process. The stages in this process are sales in percentage, financial year in, business, marketing, graph.
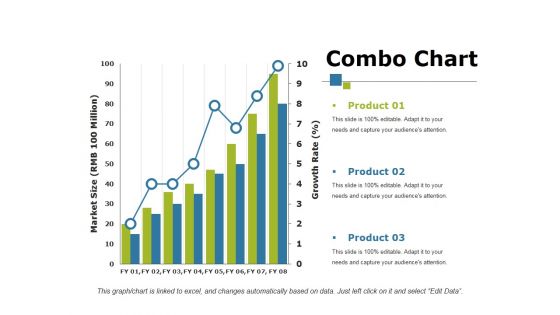
Combo Chart Ppt PowerPoint Presentation Show Influencers
This is a combo chart ppt powerpoint presentation show influencers. This is a three stage process. The stages in this process are product, bar graph, growth, growth rate, market size.
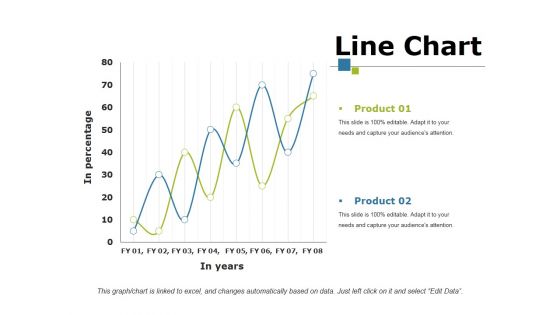
Line Chart Ppt PowerPoint Presentation Portfolio Mockup
This is a line chart ppt powerpoint presentation portfolio mockup. This is a two stage process. The stages in this process are product, in percentage, in year, growth, success.
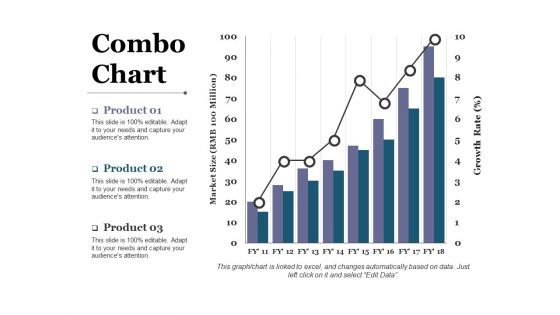
Combo Chart Ppt PowerPoint Presentation Gallery Layout
This is a combo chart ppt powerpoint presentation gallery layout. This is a three stage process. The stages in this process are business, marketing, graph, market size, growth rate.
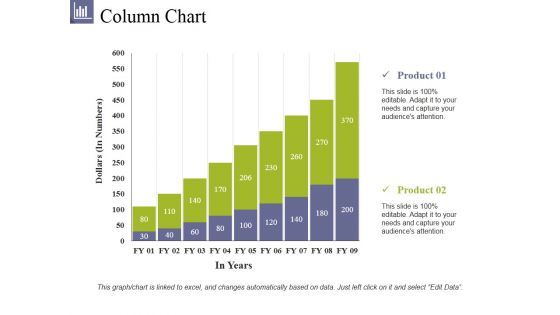
Column Chart Ppt PowerPoint Presentation File Summary
This is a column chart ppt powerpoint presentation file summary. This is a two stage process. The stages in this process are product, dollars, in years, bar graph, growth.
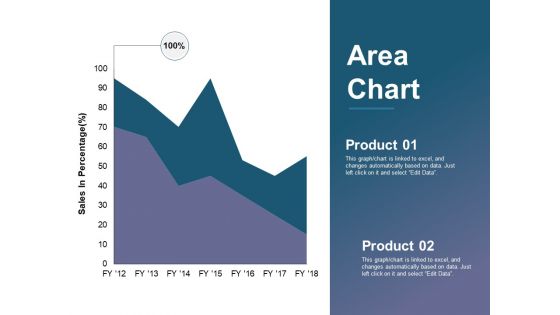
Area Chart Ppt PowerPoint Presentation Summary Information
This is a area chart ppt powerpoint presentation summary information. This is a two stage process. The stages in this process are business, sales in percentage, percentage, marketing, graph.
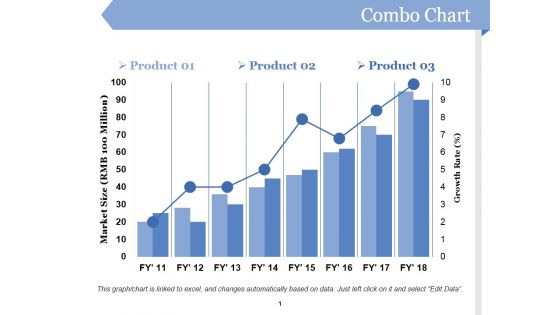
Combo Chart Ppt PowerPoint Presentation Ideas Professional
This is a combo chart ppt powerpoint presentation ideas professional. This is a three stage process. The stages in this process are business, marketing, market size, growth rate, graph.
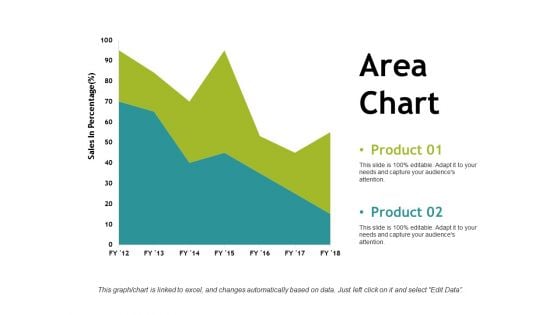
Area Chart Ppt PowerPoint Presentation File Visuals
This is a area chart ppt powerpoint presentation file visuals. This is a two stage process. The stages in this process are business, sales in percentage, marketing, graph, strategy, finance.
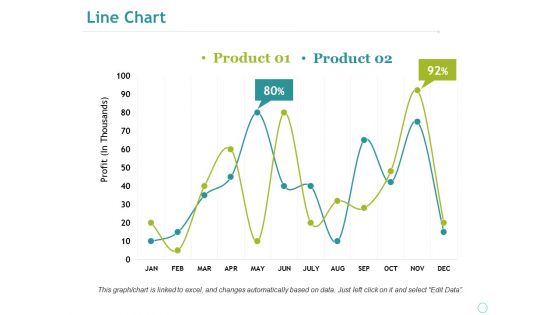
Line Chart Ppt PowerPoint Presentation Professional Portfolio
This is a line chart ppt powerpoint presentation professional portfolio. This is a two stage process. The stages in this process are business, marketing, profit, percentage, graph, strategy, finance.
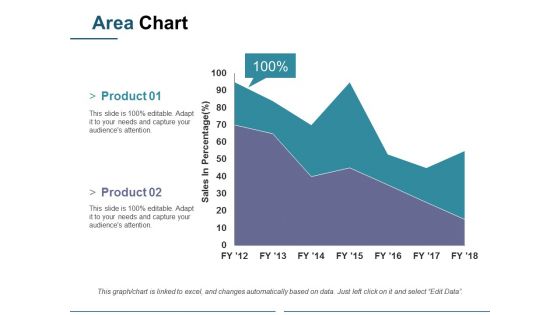
Area Chart Ppt PowerPoint Presentation Pictures Vector
This is a area chart ppt powerpoint presentation pictures vector. This is a two stage process. The stages in this process are sales in percentage, business, marketing, graph, percentage.
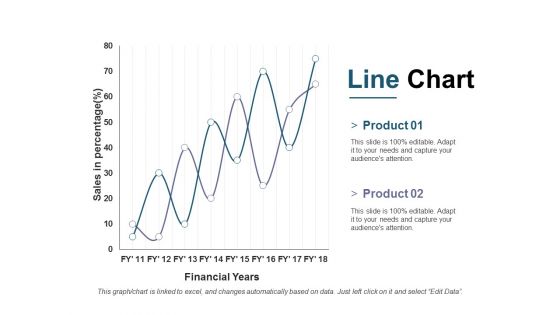
Line Chart Ppt PowerPoint Presentation Outline Ideas
This is a line chart ppt powerpoint presentation outline ideas. This is a two stage process. The stages in this process are business, marketing, financial years, sales in percentage, strategy.
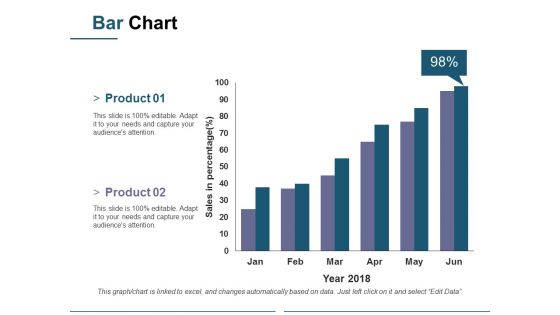
Bar Chart Ppt PowerPoint Presentation Model Sample
This is a bar chart ppt powerpoint presentation model sample. This is a two stage process. The stages in this process are sales in percentage, business, marketing, graph, percentage, year.
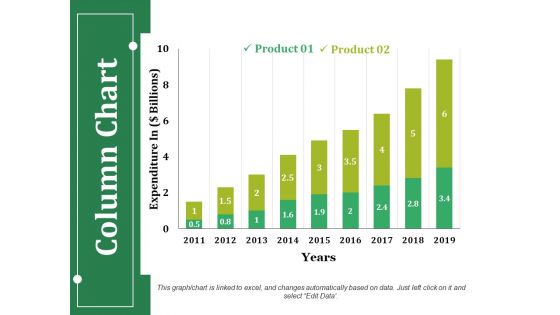
Column Chart Ppt PowerPoint Presentation Infographics Guidelines
This is a column chart ppt powerpoint presentation infographics guidelines. This is a two stage process. The stages in this process are product, expenditure in, years, business, bar graph.
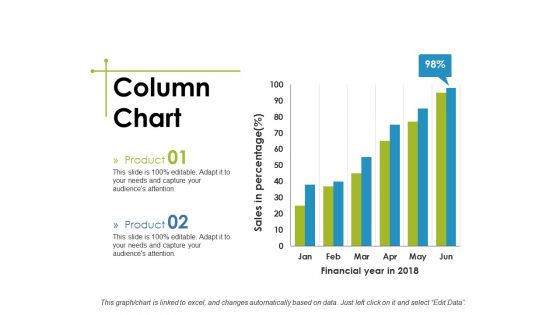
Column Chart Ppt PowerPoint Presentation Show Structure
This is a column chart ppt powerpoint presentation show structure. This is a two stage process. The stages in this process are business, financial year in, sales in percentage, marketing, graph.
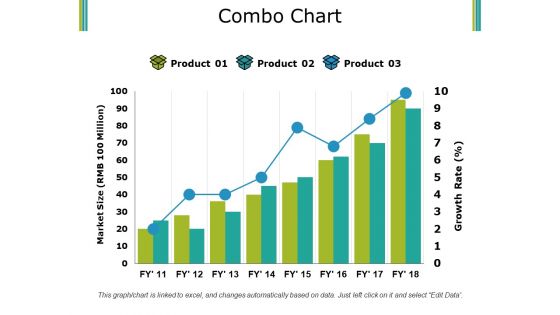
Combo Chart Ppt PowerPoint Presentation Pictures Summary
This is a combo chart ppt powerpoint presentation pictures summary. This is a three stage process. The stages in this process are product, market size, growth rate, bar graph, success.
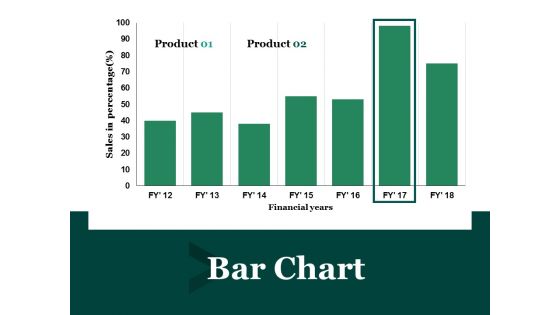
Bar Chart Ppt PowerPoint Presentation Layouts Template
This is a bar chart ppt powerpoint presentation layouts template. This is a two stage process. The stages in this process are financial year, sales in percentage, business, marketing, finance.
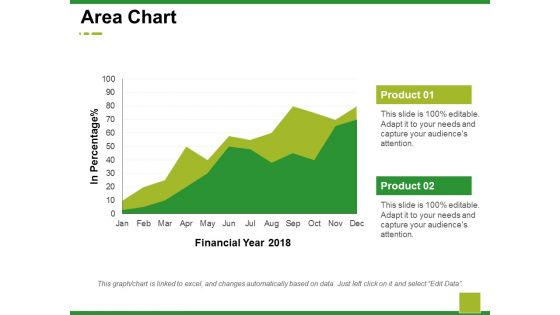
Area Chart Ppt PowerPoint Presentation Model Demonstration
This is a area chart ppt powerpoint presentation model demonstration. This is a two stage process. The stages in this process are business, marketing, financial year, in percentage, graph.
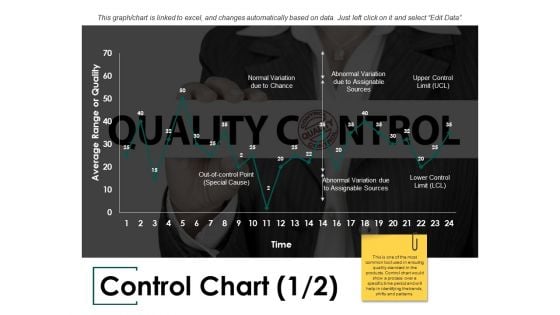
Control Chart Ppt PowerPoint Presentation Infographics Slide
This is a control chart ppt powerpoint presentation infographics slide. This is a two stage process. The stages in this process are normal variation due to chance, abnormal variation due to assignable sources, average range or quality.
Incident And Issue Management Procedure Gantt Chart With Project Progress Bar Ppt Icon Influencers PDF
This slide provides the glimpse about the project progress bar graph in gantt chart form which covers the general release, open and closed beta and development. Deliver and pitch your topic in the best possible manner with this Incident And Issue Management Procedure Gantt Chart With Project Progress Bar Ppt Icon Influencers pdf. Use them to share invaluable insights on gantt chart with project progress bar and impress your audience. This template can be altered and modified as per your expectations. So, grab it now.
Input Process Output Chart For Evaluating And Selecting Supplier Icons PDF
This slide depicts the IPO input-process-output chart used to select supplier. The purpose of this IPO chart is to take make or buy decision depending on the resources required in an organization. It includes information related to the materials, supplier bids, etc. Persuade your audience using this Input Process Output Chart For Evaluating And Selecting Supplier Icons PDF. This PPT design covers Four stages, thus making it a great tool to use. It also caters to a variety of topics including Processing Activities, Outputs, Clients. Download this PPT design now to present a convincing pitch that not only emphasizes the topic but also showcases your presentation skills.
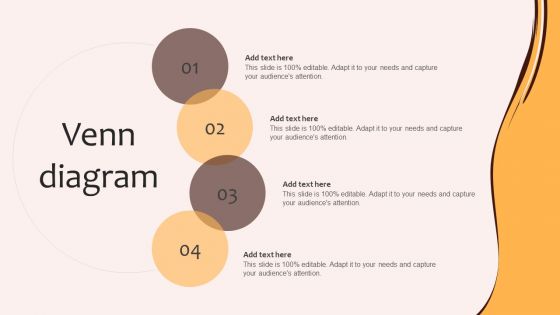
Venn Diagram Digital Marketing Plan For Restaurant Business Diagrams PDF
Slidegeeks is one of the best resources for PowerPoint templates. You can download easily and regulate Venn Diagram Digital Marketing Plan For Restaurant Business Diagrams PDF for your personal presentations from our wonderful collection. A few clicks is all it takes to discover and get the most relevant and appropriate templates. Use our Templates to add a unique zing and appeal to your presentation and meetings. All the slides are easy to edit and you can use them even for advertisement purposes.
Business Charts PowerPoint Templates Music Smiley Emoticon With Guitar Sales
Business Charts PowerPoint templates music smiley emoticon with guitar Sales-BORED!!Want some Entertainment in Life? Here it is Use this Music based Smiley PowerPoint Diagram to give a new start. This Diagram can be used for the following purposes: cappella, acoustic, bop, chamber, classical, folk, fusion, hard rock, harmony, hymn, instrumental, jazz, measure, melody, modern, opera, piece, plainsong, popular, ragtime, rap, refrain, rock, rock and roll, singing, song, soul, swing, tune. Dont make your presetations long and boring. Make them to the point with our Business Charts PowerPoint Templates Music Smiley Emoticon With Guitar Sales. You will be at the top of your game.

PowerPoint Presentation Chart Christianity Ppt Designs
PowerPoint_Presentation_Chart_Christianity_PPT_Designs.pptx- Extend an invitation with our PowerPoint Presentation Chart Christianity Ppt Designs. Allow the audience into your thoughts.
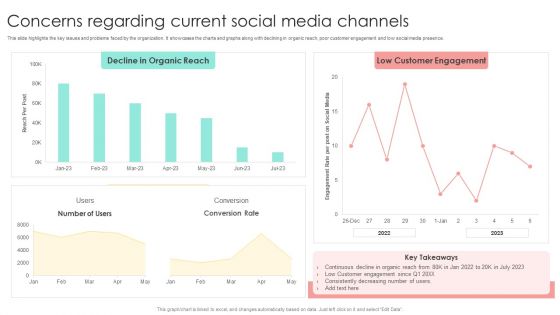
Media Advertising Concerns Regarding Current Social Media Channels Diagrams PDF
This slide highlights the key issues and problems faced by the organization. It showcases the charts and graphs along with declining in organic reach, poor customer engagement and low social media presence. If you are looking for a format to display your unique thoughts, then the professionally designed Media Advertising Concerns Regarding Current Social Media Channels Diagrams PDF is the one for you. You can use it as a Google Slides template or a PowerPoint template. Incorporate impressive visuals, symbols, images, and other charts. Modify or reorganize the text boxes as you desire. Experiment with shade schemes and font pairings. Alter, share or cooperate with other people on your work. Download Media Advertising Concerns Regarding Current Social Media Channels Diagrams PDF and find out how to give a successful presentation. Present a perfect display to your team and make your presentation unforgettable.
Employee Hiring And Induction Process With Icon Ppt PowerPoint Presentation Icon Layout Ideas PDF
Persuade your audience using this employee hiring and induction process with icon ppt powerpoint presentation icon layout ideas pdf. This PPT design covers four stages, thus making it a great tool to use. It also caters to a variety of topics including new employee, recruitment committee, vp of hr, project leaders. Download this PPT design now to present a convincing pitch that not only emphasizes the topic but also showcases your presentation skills.
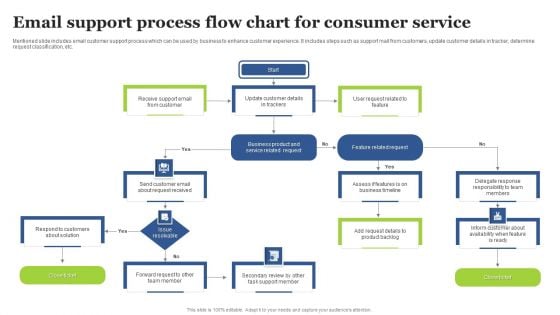
Email Support Process Flow Chart For Consumer Service Background PDF
Presenting Email Support Process Flow Chart For Consumer Service Background PDF to dispense important information. This template comprises Eleven stages. It also presents valuable insights into the topics including Email Support, Process Flow Chart, Consumer Service. This is a completely customizable PowerPoint theme that can be put to use immediately. So, download it and address the topic impactfully.
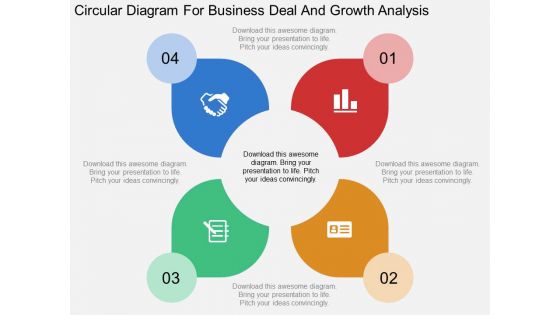
Circular Diagram For Business Deal And Growth Analysis Powerpoint Template
This PowerPoint template has been designed with graphics of circular diagram. You may download this PPT diagram slide to display business deal and growth analysis. Chart the course you intend to take with this slide
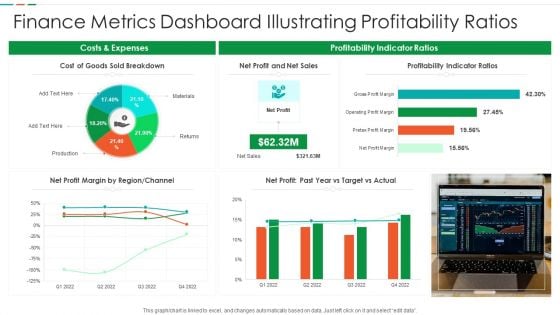
Finance Metrics Dashboard Illustrating Profitability Ratios Diagrams PDF
This graph or chart is linked to excel, and changes automatically based on data. Just left click on it and select edit data. Pitch your topic with ease and precision using this Finance Metrics Dashboard Illustrating Profitability Ratios Diagrams PDF. This layout presents information on Cost Goods Sold, Net Profit Net, Sales Profitability Indicator. It is also available for immediate download and adjustment. So, changes can be made in the color, design, graphics or any other component to create a unique layout.
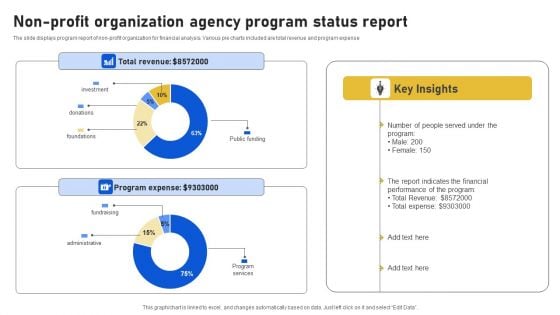
Non-Profit Organization Agency Program Status Report Diagrams PDF
The slide displays program report of non-profit organization for financial analysis. Various pie charts included are total revenue and program expense. Showcasing this set of slides titled Non-Profit Organization Agency Program Status Report Diagrams PDF. The topics addressed in these templates are Total Revenue, Program Expense, Report Indicates. All the content presented in this PPT design is completely editable. Download it and make adjustments in color, background, font etc. as per your unique business setting.
Goals Sights Icons PowerPoint Slides
Goals Sights Icons PowerPoint Slides-These high quality, editable pre-designed powerpoint slides have been carefully created by our professional team to help you impress your audience. Each graphic in every slide is vector based and is 100% editable in powerpoint. Each and every property of any slide - color, size, shading etc can be modified to build an effective powerpoint presentation. Use these slides to convey complex business concepts in a simplified manner. Any text can be entered at any point in the powerpoint slide. Simply DOWNLOAD, TYPE and PRESENT! Our Goals Sights Icons PowerPoint Slides are a complete customer delight. They deliver on every account.
Business Diagram 3d Graphic Of Business Icons Diagram PowerPoint Ppt Presentation
This diagram displays 3d graphic of business icons. Use this business icon diagram to present business reports. This diagram is also useful to present your information in graphical manner.
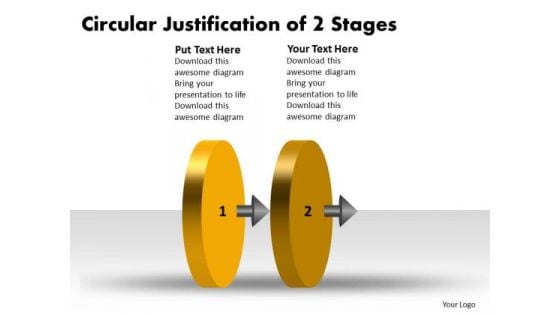
Circular Justification Of 2 Stages Flow Chart System PowerPoint Slides
We present our circular justification of 2 stages flow chart system PowerPoint Slides.Use our Circle Charts PowerPoint Templates because, You can Show them how to churn out fresh ideas. Use our Arrows PowerPoint Templates because,Getting it done may not be enough. Use our Symbol PowerPoint Templates because,This slide represents the Tools of the Trade. Use our Business PowerPoint Templates because,This template helps you to grab the attention of your listeners. Use our Process and Flows PowerPoint Templates because,you can see In any endeavour people matter most.Use these PowerPoint slides for presentations relating to 3d, arrow, background, chart, circle, circular, circulation, clipart, colorful, connection, continuity, cyclic, diagram, direction, empty, flow, graph, icon, illustration, isolated, loop, motion, presentation, process, progress, report, result, ring, rotation, round, section, step, sticker, symbol, teamwork, template, vector. The prominent colors used in the PowerPoint template are Yellow, Brown, Gray. People tell us our circular justification of 2 stages flow chart system PowerPoint Slides are Multicolored. The feedback we get is that our circular PowerPoint templates and PPT Slides will get their audience's attention. People tell us our circular justification of 2 stages flow chart system PowerPoint Slides are Elevated. Presenters tell us our chart PowerPoint templates and PPT Slides are topically designed to provide an attractive backdrop to any subject. The feedback we get is that our circular justification of 2 stages flow chart system PowerPoint Slides are Perfect. Professionals tell us our clipart PowerPoint templates and PPT Slides are Stylish. Our Circular Justification Of 2 Stages Flow Chart System PowerPoint Slides are never far from you. They will come to your assistance in a click.
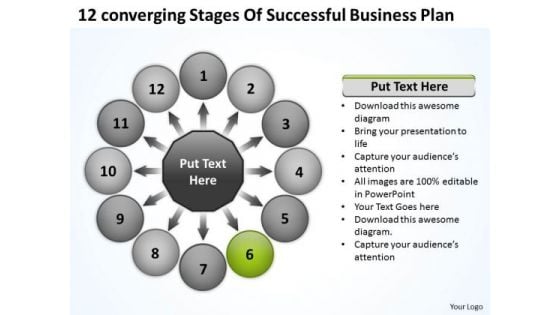
New Business PowerPoint Presentation Plan Circular Flow Spoke Chart Templates
We present our new business powerpoint presentation plan Circular Flow Spoke Chart templates.Download and present our Business PowerPoint Templates because you have analysed many global markets and come up with possibilities. Highlight the pros and cons of other likely business oppurtunities. Download and present our Circle Charts PowerPoint Templates because these slides are the triggers of our growth. Download and present our Shapes PowerPoint Templates because support groups are an essential element of the on going struggle against cancer. Present our Arrows PowerPoint Templates because you can Churn the wheels of the brains of your colleagues. Present our Process and Flows PowerPoint Templates because you can Educate your team with the attention to be paid.Use these PowerPoint slides for presentations relating to Arrows, Blank, Business, Central, Centralized, Chart, Circle, Circular, Circulation, Concept, Conceptual, Converging, Design, Diagram, Empty, Executive, Icon, Idea, Illustration, Management, Map, Mapping, Model, Numbers, Organization, Outwards, Pointing, Procedure, Process, Radial, Radiating, Relationship, Resource, Sequence, Sequential, Seven, Square, Strategy, Template. The prominent colors used in the PowerPoint template are Green, Gray, Black. We assure you our new business powerpoint presentation plan Circular Flow Spoke Chart templates will generate and maintain the level of interest you desire. They will create the impression you want to imprint on your audience. We assure you our Circle PowerPoint templates and PPT Slides will save the presenter time. Customers tell us our new business powerpoint presentation plan Circular Flow Spoke Chart templates are Radiant. Presenters tell us our Circle PowerPoint templates and PPT Slides are Spiffy. You can be sure our new business powerpoint presentation plan Circular Flow Spoke Chart templates are Flirty. The feedback we get is that our Chart PowerPoint templates and PPT Slides are Awesome. Prove your equity with our New Business PowerPoint Presentation Plan Circular Flow Spoke Chart Templates. Display the sound judgement of your thoughts.
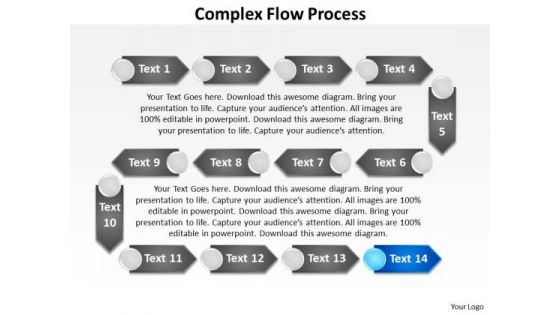
Ppt Complex Flow Process Charts PowerPoint Slides Templates
PPT complex flow process charts powerpoint slides Templates-This magnificent chart helps to show the most complex functions and classes. Present your views using our innovative slides and be assured of leaving a lasting impression.-PPT complex flow process charts powerpoint slides Templates-Advice, Analyze, Arrow, Background, Business, Chart, Concept, Creativity, Decision, Design, Determination, Diagram, Draw, Education, Flowchart, Graphic, Idea, Means, Method, Office, Plan, Pointing, Presentation, Process, Sign, Strategy, Technology Capture success with our Ppt Complex Flow Process Charts PowerPoint Slides Templates. Download without worries with our money back guaranteee.
Business Diagram Timeline With Year Icons Info Graphic Presentation Template
This slide contains timeline with year icons info graphic presentation template. This power point template has been crafted with graphic of timeline diagram. This timeline diagram displays the year icons info graphics. Use this diagram for time management process display in any business presentations.

Business Diagram Diagram Showing Process Of Producing Electricity Using Nuclear Power Plant Presenta
This diagram showing process of producing electricity using nuclear power plant. This exclusive diagram has been designed with graphic of electricity production in nuclear plant. Use this step by step process flow diagram to exhibit electricity production for nuclear plant. Use this diagram to explain the process of electricity production.
Business Diagram Illustration Of Medical Symbols And Icons Presentation Slide Template
Various medical symbols have been used to decorate this power point diagram slide. This diagram slide can be used for medical theme based topics. Use these icons and symbols in your medical presentation and display heart and homeopathy related topics.
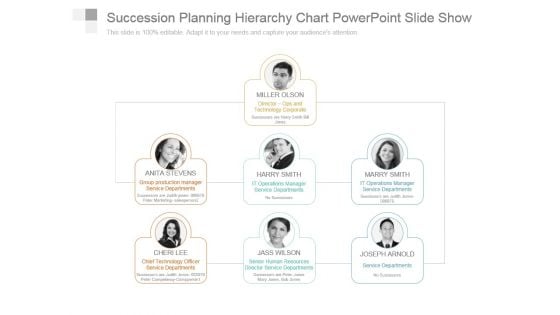
Succession Planning Hierarchy Chart Powerpoint Slide Show
This is a succession planning hierarchy chart powerpoint slide show. This is a three stage process. The stages in this process are miller olson director ops and technology corporate, anita stevens group production manager service departments, harry smith it operations manager service departments, marry smith it operations manager service departments, cheri lee chief technology officer service departments, jass wilson senior human resources director service departments, joseph arnold service departments.
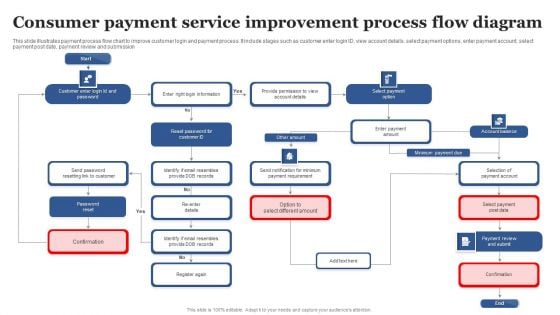
Consumer Payment Service Improvement Process Flow Diagram Infographics PDF
Presenting Consumer Payment Service Improvement Process Flow Diagram Infographics PDF to dispense important information. This template comprises One stage. It also presents valuable insights into the topics including Improvement Process, Flow Diagram. This is a completely customizable PowerPoint theme that can be put to use immediately. So, download it and address the topic impactfully.
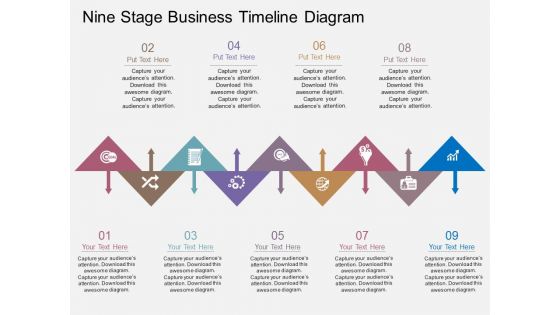
Nine Stage Business Timeline Diagram Powerpoint Template
Our professionally designed business diagram is as an effective tool for communicating business ideas and strategies for corporate planning. This PPT slide contains nine stage business timeline diagram. Download this template to build interactive presentation.
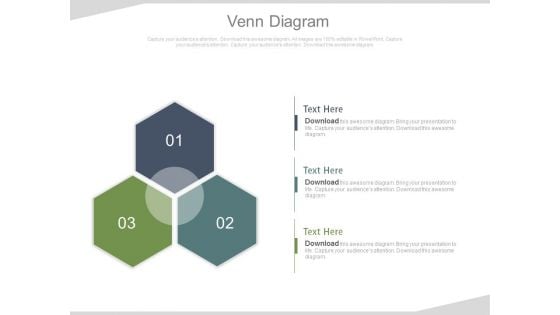
Venn Diagram With Three Steps Powerpoint Slides
This power point template has been designed with graphic of Venn diagram. Use this Venn diagram to display three planning steps. Illustrate your ideas and imprint them in the minds of your team with this template.
Career Management Icons Slide Ppt PowerPoint Presentation Outline Diagrams
Presenting this set of slides containing editable icons for topic career management icons slide ppt powerpoint presentation outline diagrams. All icons in this slide are 100 percent editable. You can replace icons in your deck with any of these icons. Download now and impress your audience.
Icons Slide For Sales Strategy Consulting Proposal Diagrams PDF
Presenting this set of slides containing editable icons for topic icons slide for sales strategy consulting proposal diagrams pdf. All icons in this slide are 100 percent editable. You can replace icons in your deck with any of these icons. Download now and impress your audience.

Arrow Diagram Moving Up Over Dollar Sign Business PowerPoint Templates And PowerPoint Themes 0812
Arrow Diagram Moving Up Over Dollar Sign Business PowerPoint Templates And PowerPoint Themes 0812-Microsoft Powerpoint Templates and Background with arrow moving up over dollar signs Be an eyeopener with our Arrow Diagram Moving Up Over Dollar Sign Business PowerPoint Templates And PowerPoint Themes 0812. Educate your audience on the decisive details.
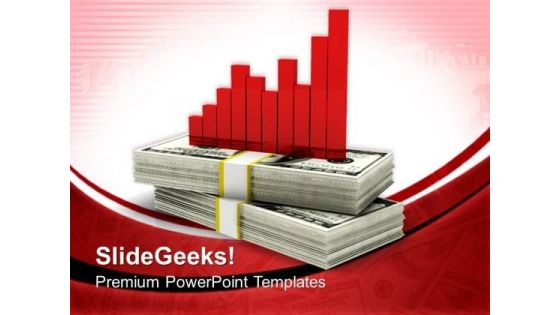
Business Diagram And Dollars Finance PowerPoint Templates And PowerPoint Themes 0812
Business Diagram And Dollars Finance PowerPoint Templates And PowerPoint Themes 0812-Microsoft Powerpoint Templates and Background with graph and dollar Project your exercise regimen on our Business Diagram And Dollars Finance PowerPoint Templates And PowerPoint Themes 0812. Elaborate on the benefits of each set.
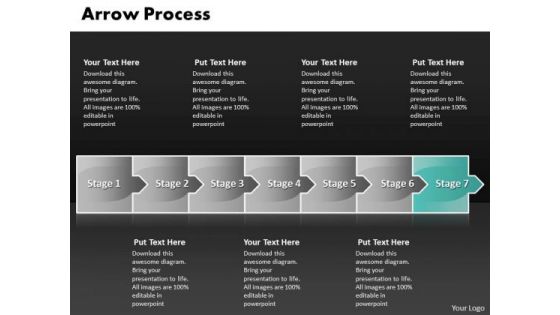
Process Ppt Theme Arrow 7 States Diagram Time Management PowerPoint 8 Graphic
process PPT Theme arrow 7 states diagram time management powerpoint 8 Graphic-Amplify your views, ideas and thoughts from very basic aspects to Our Process Ppt Theme Arrow 7 States Diagram Time Management PowerPoint 8 Graphic are concept driven. They create ideas destined to achieve.

Mba Models And Frameworks Ladder Style With Goal Achievement Theme Marketing Diagram
Document Your Views On Our MBA models and frameworks Ladder Style With Goal Achievement Theme marketing diagram Powerpoint Templates. They Will Create A Strong Impression. Plan Your Documentary Shot By Shot. Break Them Down On Our MBA models and frameworks Ladder Style With Goal Achievement Theme marketing diagram Powerpoint Templates.


 Continue with Email

 Home
Home


