Phases
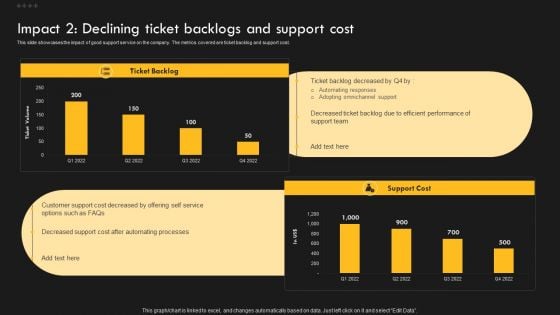
Service Improvement Techniques For Client Retention Impact 2 Declining Ticket Backlogs And Support Diagrams PDF
This slide showcases the impact of good support service on the company. The metrics covered are customer satisfaction and retention. Explore a selection of the finest Service Improvement Techniques For Client Retention Impact 2 Declining Ticket Backlogs And Support Diagrams PDF here. With a plethora of professionally designed and pre-made slide templates, you can quickly and easily find the right one for your upcoming presentation. You can use our Service Improvement Techniques For Client Retention Impact 2 Declining Ticket Backlogs And Support Diagrams PDF to effectively convey your message to a wider audience. Slidegeeks has done a lot of research before preparing these presentation templates. The content can be personalized and the slides are highly editable. Grab templates today from Slidegeeks.
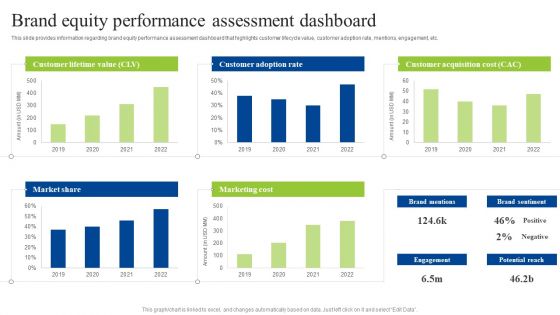
Brand Personality Improvement To Increase Profits Brand Equity Performance Assessment Dashboard Diagrams PDF
This slide provides information regarding brand equity performance assessment dashboard that highlights customer lifecycle value, customer adoption rate, mentions, engagement, etc. Do you have to make sure that everyone on your team knows about any specific topic I yes, then you should give Brand Personality Improvement To Increase Profits Brand Equity Performance Assessment Dashboard Diagrams PDF a try. Our experts have put a lot of knowledge and effort into creating this impeccable Brand Personality Improvement To Increase Profits Brand Equity Performance Assessment Dashboard Diagrams PDF. You can use this template for your upcoming presentations, as the slides are perfect to represent even the tiniest detail. You can download these templates from the Slidegeeks website and these are easy to edit. So grab these today.
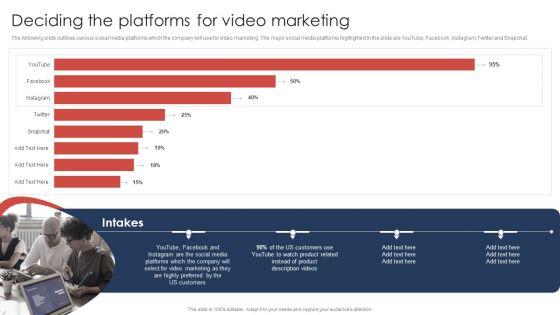
Effective Video Promotional Strategies For Brand Awareness Deciding The Platforms For Video Marketing Diagrams PDF
The following slide outlines various social media platforms which the company will use for video marketing. The major social media platforms highlighted in the slide are YouTube, Facebook, Instagram,Twitter and Snapchat. Here you can discover an assortment of the finest PowerPoint and Google Slides templates. With these templates, you can create presentations for a variety of purposes while simultaneously providing your audience with an eye catching visual experience. Download Effective Video Promotional Strategies For Brand Awareness Deciding The Platforms For Video Marketing Diagrams PDF to deliver an impeccable presentation. These templates will make your job of preparing presentations much quicker, yet still, maintain a high level of quality. Slidegeeks has experienced researchers who prepare these templates and write high quality content for you. Later on, you can personalize the content by editing the Effective Video Promotional Strategies For Brand Awareness Deciding The Platforms For Video Marketing Diagrams PDF.
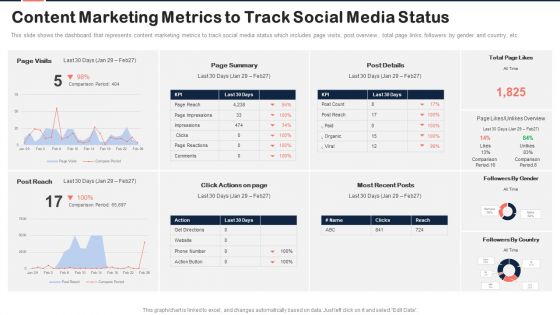
Implementing Content Marketing Plan To Nurture Leads Content Marketing Metrics To Track Diagrams PDF
This slide shows the dashboard that represents content marketing metrics to track social media status which includes page visits, post overview, total page links, followers by gender and country, etc. Crafting an eye catching presentation has never been more straightforward. Let your presentation shine with this tasteful yet straightforward Implementing Content Marketing Plan To Nurture Leads Content Marketing Metrics To Track Diagrams PDF template. It offers a minimalistic and classy look that is great for making a statement. The colors have been employed intelligently to add a bit of playfulness while still remaining professional. Construct the ideal Implementing Content Marketing Plan To Nurture Leads Content Marketing Metrics To Track Diagrams PDF that effortlessly grabs the attention of your audience Begin now and be certain to wow your customers.
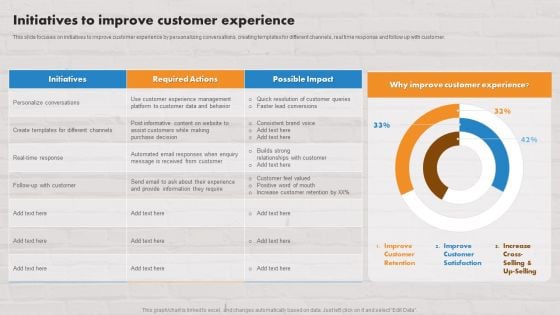
Customer Service Plan To Improve Sales Initiatives To Improve Customer Experience Diagrams PDF
This slide focuses on initiatives to improve customer experience by personalizing conversations, creating templates for different channels, real time response and follow up with customer. Crafting an eye catching presentation has never been more straightforward. Let your presentation shine with this tasteful yet straightforward Customer Service Plan To Improve Sales Initiatives To Improve Customer Experience Diagrams PDF template. It offers a minimalistic and classy look that is great for making a statement. The colors have been employed intelligently to add a bit of playfulness while still remaining professional. Construct the ideal Customer Service Plan To Improve Sales Initiatives To Improve Customer Experience Diagrams PDF that effortlessly grabs the attention of your audience Begin now and be certain to wow your customers.
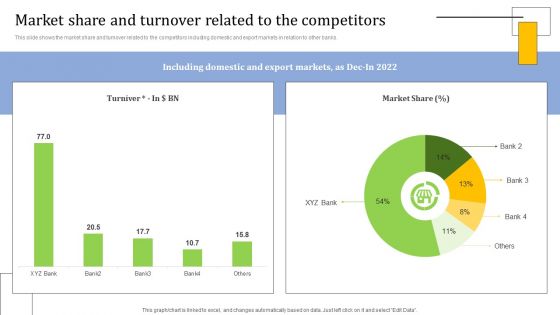
Strategies For Credit Risk Management Market Share And Turnover Related To The Diagrams PDF
This slide shows the market share and turnover related to the competitors including domestic and export markets in relation to other banks. Do you have an important presentation coming up Are you looking for something that will make your presentation stand out from the rest Look no further than Strategies For Credit Risk Management Market Share And Turnover Related To The Diagrams PDF. With our professional designs, you can trust that your presentation will pop and make delivering it a smooth process. And with Slidegeeks, you can trust that your presentation will be unique and memorable. So why wait Grab Strategies For Credit Risk Management Market Share And Turnover Related To The Diagrams PDF today and make your presentation stand out from the rest.

Developing Content Marketing Impact Of Ineffective Content Marketing Strategy Diagrams PDF
This slide covers the impact of ineffective content marketing strategies which shows increase in bounce rate and decline in marketing ROI due to disengaging content, misleading title tag, etc. which results in reduction in company sales. Find highly impressive Developing Content Marketing Impact Of Ineffective Content Marketing Strategy Diagrams PDF on Slidegeeks to deliver a meaningful presentation. You can save an ample amount of time using these presentation templates. No need to worry to prepare everything from scratch because Slidegeeks experts have already done a huge research and work for you. You need to download Developing Content Marketing Impact Of Ineffective Content Marketing Strategy Diagrams PDF for your upcoming presentation. All the presentation templates are 100 percent editable and you can change the color and personalize the content accordingly. Download now.
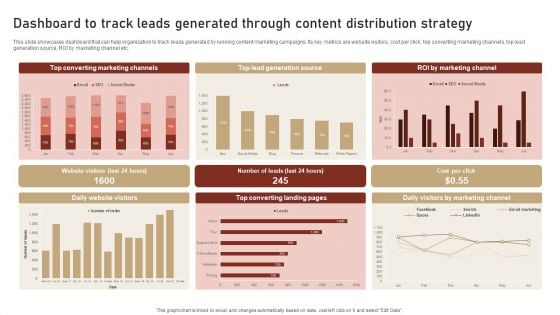
Content Delivery And Promotion Dashboard To Track Leads Generated Through Content Diagrams PDF
This slide showcases dashboard that can help organization to track leads generated by running content marketing campaigns. Its key metrics are website visitors, cost per click, top converting marketing channels, top lead generation source, ROI by marketing channel etc. Do you have an important presentation coming up Are you looking for something that will make your presentation stand out from the rest Look no further than Content Delivery And Promotion Dashboard To Track Leads Generated Through Content Diagrams PDF. With our professional designs, you can trust that your presentation will pop and make delivering it a smooth process. And with Slidegeeks, you can trust that your presentation will be unique and memorable. So why wait Grab Content Delivery And Promotion Dashboard To Track Leads Generated Through Content Diagrams PDF today and make your presentation stand out from the rest.
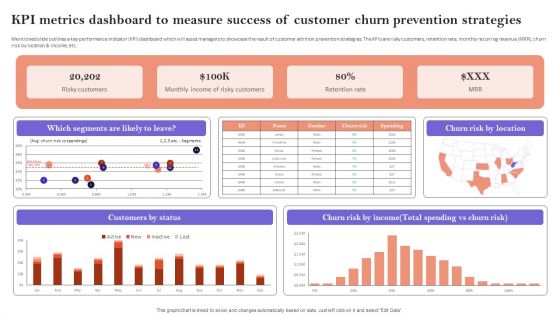
KPI Metrics Dashboard To Measure Success Of Customer Churn Prevention Strategies Diagrams PDF
Mentioned slide outlines a key performance indicator KPI dashboard which will assist managers to showcase the result of customer attrition prevention strategies. The KPIs are risky customers, retention rate, monthly recurring revenue MRR, churn risk by location and income, etc. This KPI Metrics Dashboard To Measure Success Of Customer Churn Prevention Strategies Diagrams PDF is perfect for any presentation, be it in front of clients or colleagues. It is a versatile and stylish solution for organizing your meetings. The KPI Metrics Dashboard To Measure Success Of Customer Churn Prevention Strategies Diagrams PDF features a modern design for your presentation meetings. The adjustable and customizable slides provide unlimited possibilities for acing up your presentation. Slidegeeks has done all the homework before launching the product for you. So, do not wait, grab the presentation templates today
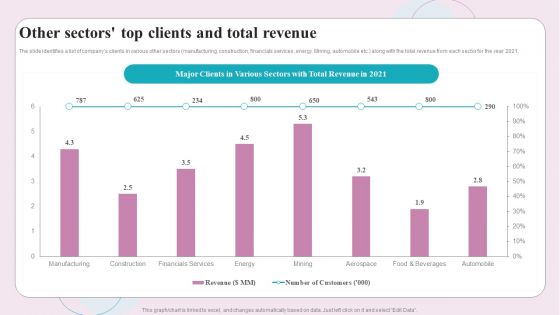
Buy Side M And A Service Other Sectors Top Clients And Total Revenue Diagrams PDF
The slide identifies a list of companys clients in various other sectors manufacturing, construction, financials services, energy. Mining, automobile etc. along with the total revenue from each sector for the year 2021. Do you have to make sure that everyone on your team knows about any specific topic I yes, then you should give Buy Side M And A Service Other Sectors Top Clients And Total Revenue Diagrams PDF a try. Our experts have put a lot of knowledge and effort into creating this impeccable Buy Side M And A Service Other Sectors Top Clients And Total Revenue Diagrams PDF. You can use this template for your upcoming presentations, as the slides are perfect to represent even the tiniest detail. You can download these templates from the Slidegeeks website and these are easy to edit. So grab these today
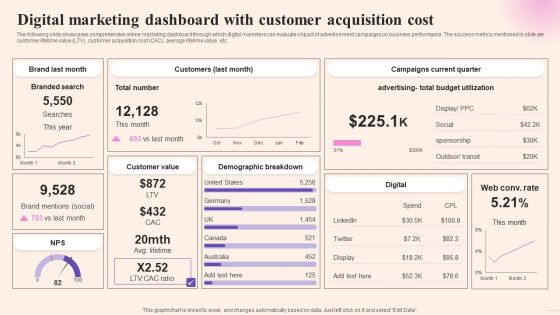
Comprehensive Guide To Build Marketing Digital Marketing Dashboard With Customer Acquisition Diagrams PDF
The following slide showcases comprehensive online marketing dashboard through which digital marketers can evaluate impact of advertisement campaigns on business performance. The success metrics mentioned in slide are customer lifetime value LTV, customer acquisition cost CAC, average lifetime value, etc. Do you have an important presentation coming up Are you looking for something that will make your presentation stand out from the rest Look no further than Comprehensive Guide To Build Marketing Digital Marketing Dashboard With Customer Acquisition Diagrams PDF. With our professional designs, you can trust that your presentation will pop and make delivering it a smooth process. And with Slidegeeks, you can trust that your presentation will be unique and memorable. So why wait Grab Comprehensive Guide To Build Marketing Digital Marketing Dashboard With Customer Acquisition Diagrams PDF today and make your presentation stand out from the rest.
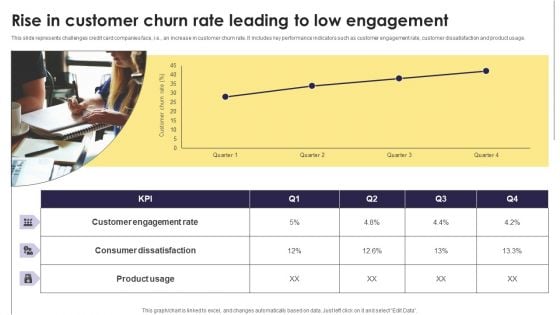
Implementation Of An Efficient Credit Card Promotion Plan Rise In Customer Churn Rate Leading Diagrams PDF
This slide represents challenges credit card companies face, i.e., an increase in customer churn rate. It includes key performance indicators such as customer engagement rate, customer dissatisfaction and product usage. Explore a selection of the finest Implementation Of An Efficient Credit Card Promotion Plan Rise In Customer Churn Rate Leading Diagrams PDF here. With a plethora of professionally designed and pre made slide templates, you can quickly and easily find the right one for your upcoming presentation. You can use our Implementation Of An Efficient Credit Card Promotion Plan Rise In Customer Churn Rate Leading Diagrams PDF to effectively convey your message to a wider audience. Slidegeeks has done a lot of research before preparing these presentation templates. The content can be personalized and the slides are highly editable. Grab templates today from Slidegeeks.
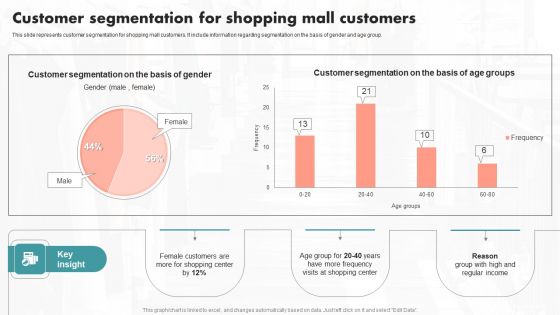
Customer Segmentation For Shopping Mall Customers Ppt PowerPoint Presentation File Diagrams PDF
This slide represents customer segmentation for shopping mall customers. It include information regarding segmentation on the basis of gender and age group. Formulating a presentation can take up a lot of effort and time, so the content and message should always be the primary focus. The visuals of the PowerPoint can enhance the presenters message, so our Customer Segmentation For Shopping Mall Customers Ppt PowerPoint Presentation File Diagrams PDF was created to help save time. Instead of worrying about the design, the presenter can concentrate on the message while our designers work on creating the ideal templates for whatever situation is needed. Slidegeeks has experts for everything from amazing designs to valuable content, we have put everything into Customer Segmentation For Shopping Mall Customers Ppt PowerPoint Presentation File Diagrams PDF
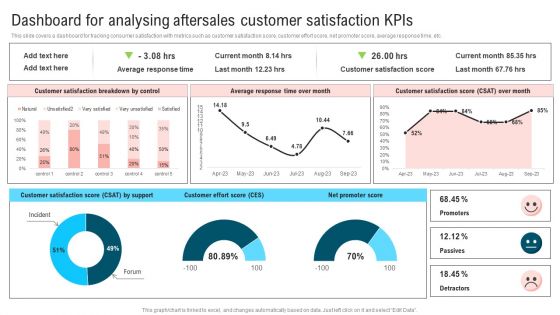
Ultimate Guide To Improve Customer Support And Services Dashboard For Analysing Aftersales Customer Diagrams PDF
This slide covers a dashboard for tracking consumer satisfaction with metrics such as customer satisfaction score, customer effort score, net promoter score, average response time, etc. Find highly impressive Ultimate Guide To Improve Customer Support And Services Dashboard For Analysing Aftersales Customer Diagrams PDF on Slidegeeks to deliver a meaningful presentation. You can save an ample amount of time using these presentation templates. No need to worry to prepare everything from scratch because Slidegeeks experts have already done a huge research and work for you. You need to download Ultimate Guide To Improve Customer Support And Services Dashboard For Analysing Aftersales Customer Diagrams PDF for your upcoming presentation. All the presentation templates are 100 percent editable and you can change the color and personalize the content accordingly. Download now.
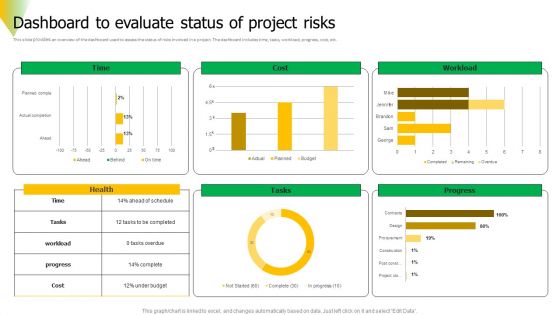
Risk Assessment Dashboard To Evaluate Status Of Project Risks Diagrams PDF
This slide provides an overview of the dashboard used to assess the status of risks involved in a project. The dashboard includes time, tasks, workload, progress, cost, etc. Get a simple yet stunning designed Risk Assessment Dashboard To Evaluate Status Of Project Risks Diagrams PDF. It is the best one to establish the tone in your meetings. It is an excellent way to make your presentations highly effective. So, download this PPT today from Slidegeeks and see the positive impacts. Our easy to edit Risk Assessment Dashboard To Evaluate Status Of Project Risks Diagrams PDF can be your go to option for all upcoming conferences and meetings. So, what are you waiting for Grab this template today.
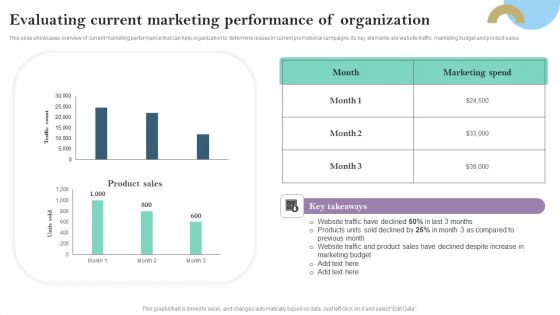
Evaluating Current Marketing Performance Of Organization Ppt PowerPoint Presentation Diagram Templates PDF
This slide showcases overview of current marketing performance that can help organization to determine issues in current promotional campaigns. Its key elements are website traffic, marketing budget and product sales Explore a selection of the finest Evaluating Current Marketing Performance Of Organization Ppt PowerPoint Presentation Diagram Templates PDF here. With a plethora of professionally designed and pre made slide templates, you can quickly and easily find the right one for your upcoming presentation. You can use our Evaluating Current Marketing Performance Of Organization Ppt PowerPoint Presentation Diagram Templates PDF to effectively convey your message to a wider audience. Slidegeeks has done a lot of research before preparing these presentation templates. The content can be personalized and the slides are highly editable. Grab templates today from Slidegeeks.
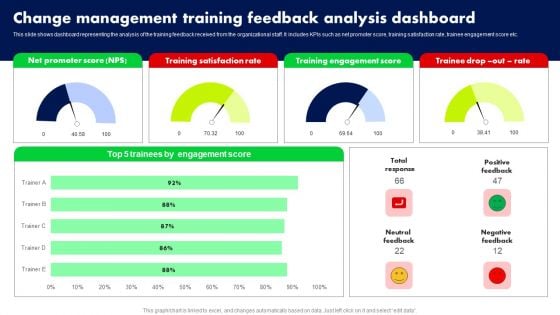
Change Management Training Feedback Analysis Dashboard Ppt PowerPoint Presentation File Diagrams PDF
This slide shows dashboard representing the analysis of the training feedback received from the organizational staff. It includes KPIs such as net promoter score, training satisfaction rate, trainee engagement score etc. Get a simple yet stunning designed Change Management Training Feedback Analysis Dashboard Ppt PowerPoint Presentation File Diagrams PDF. It is the best one to establish the tone in your meetings. It is an excellent way to make your presentations highly effective. So, download this PPT today from Slidegeeks and see the positive impacts. Our easy to edit Change Management Training Feedback Analysis Dashboard Ppt PowerPoint Presentation File Diagrams PDF can be your go to option for all upcoming conferences and meetings. So, what are you waiting for Grab this template today.
Influencers Marketing Campaign Performance Tracking Dashboard Ppt PowerPoint Presentation Diagram Lists PDF
This slide covers performance monitoring dashboard of influencer based referral marketing program. It includes elements such as impressions on Instagram, likes, comments, clicks, sales generated along with value calculators and campaign breakdown based on gender and age. Formulating a presentation can take up a lot of effort and time, so the content and message should always be the primary focus. The visuals of the PowerPoint can enhance the presenters message, so our Influencers Marketing Campaign Performance Tracking Dashboard Ppt PowerPoint Presentation Diagram Lists PDF was created to help save time. Instead of worrying about the design, the presenter can concentrate on the message while our designers work on creating the ideal templates for whatever situation is needed. Slidegeeks has experts for everything from amazing designs to valuable content, we have put everything into Influencers Marketing Campaign Performance Tracking Dashboard Ppt PowerPoint Presentation Diagram Lists PDF
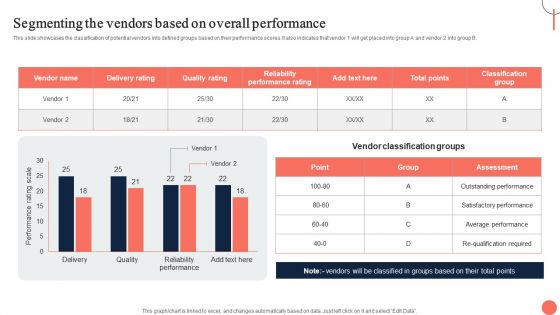
Strategies For Dynamic Supply Chain Agility Segmenting The Vendors Based On Overall Performance Diagrams PDF
This slide showcases the classification of potential vendors into defined groups based on their performance scores. It also indicates that vendor 1 will get placed into group A and vendor 2 into group B. Do you have to make sure that everyone on your team knows about any specific topic I yes, then you should give Strategies For Dynamic Supply Chain Agility Segmenting The Vendors Based On Overall Performance Diagrams PDF a try. Our experts have put a lot of knowledge and effort into creating this impeccable Strategies For Dynamic Supply Chain Agility Segmenting The Vendors Based On Overall Performance Diagrams PDF. You can use this template for your upcoming presentations, as the slides are perfect to represent even the tiniest detail. You can download these templates from the Slidegeeks website and these are easy to edit. So grab these today.
Reinforcement Learning Techniques And Applications Performance Tracking Dashboard Reinforcement Diagrams PDF
This slide shows the roadmap for the reinforcement learning project, including the list of tasks to be performed from March 2023 to February 2024. The tasks include initializing the values table, observing the current state, choosing an action for that state, and so on. Formulating a presentation can take up a lot of effort and time, so the content and message should always be the primary focus. The visuals of the PowerPoint can enhance the presenters message, so our Reinforcement Learning Techniques And Applications Performance Tracking Dashboard Reinforcement Diagrams PDF was created to help save time. Instead of worrying about the design, the presenter can concentrate on the message while our designers work on creating the ideal templates for whatever situation is needed. Slidegeeks has experts for everything from amazing designs to valuable content, we have put everything into Reinforcement Learning Techniques And Applications Performance Tracking Dashboard Reinforcement Diagrams PDF
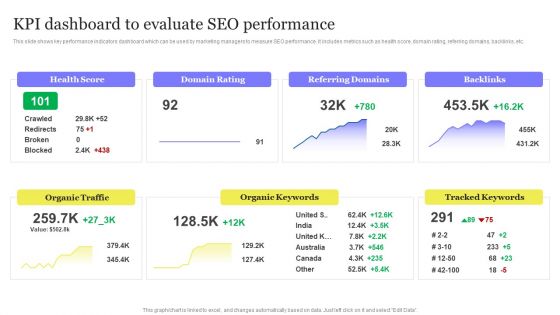
Enhancing Digital Visibility Using SEO Content Strategy KPI Dashboard To Evaluate SEO Performance Diagrams PDF
This slide shows key performance indicators dashboard which can be used by marketing managers to measure SEO performance. It includes metrics such as health score, domain rating, referring domains, backlinks, etc. This Enhancing Digital Visibility Using SEO Content Strategy KPI Dashboard To Evaluate SEO Performance Diagrams PDF is perfect for any presentation, be it in front of clients or colleagues. It is a versatile and stylish solution for organizing your meetings. The Enhancing Digital Visibility Using SEO Content Strategy KPI Dashboard To Evaluate SEO Performance Diagrams PDF features a modern design for your presentation meetings. The adjustable and customizable slides provide unlimited possibilities for acing up your presentation. Slidegeeks has done all the homework before launching the product for you. So, do not wait, grab the presentation templates today
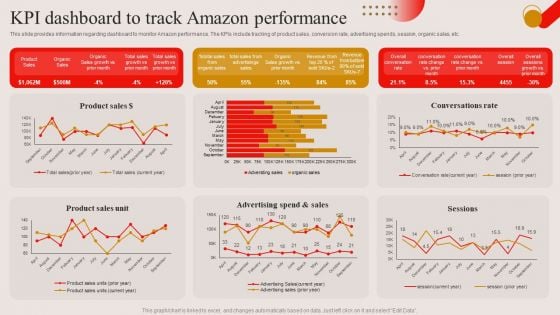
KPI Dashboard To Track Amazon Performance Ppt PowerPoint Presentation Diagram Lists PDF
This slide provides information regarding dashboard to monitor Amazon performance. The KPIs include tracking of product sales, conversion rate, advertising spends, session, organic sales, etc. Explore a selection of the finest KPI Dashboard To Track Amazon Performance Ppt PowerPoint Presentation Diagram Lists PDF here. With a plethora of professionally designed and pre made slide templates, you can quickly and easily find the right one for your upcoming presentation. You can use our KPI Dashboard To Track Amazon Performance Ppt PowerPoint Presentation Diagram Lists PDF to effectively convey your message to a wider audience. Slidegeeks has done a lot of research before preparing these presentation templates. The content can be personalized and the slides are highly editable. Grab templates today from Slidegeeks.
Online Marketing Analytics To Enhance Business Growth Kpi Dashboard For Tracking Paid Ad Campaign Diagrams PDF
This slide covers the dashboard for analyzing paid search metrics such as ad cost, clicks, impressions, click-through rate, cost per conversion, conversion rate, cost per click, etc. Do you have to make sure that everyone on your team knows about any specific topic I yes, then you should give Online Marketing Analytics To Enhance Business Growth Kpi Dashboard For Tracking Paid Ad Campaign Diagrams PDF a try. Our experts have put a lot of knowledge and effort into creating this impeccable Online Marketing Analytics To Enhance Business Growth Kpi Dashboard For Tracking Paid Ad Campaign Diagrams PDF. You can use this template for your upcoming presentations, as the slides are perfect to represent even the tiniest detail. You can download these templates from the Slidegeeks website and these are easy to edit. So grab these today.
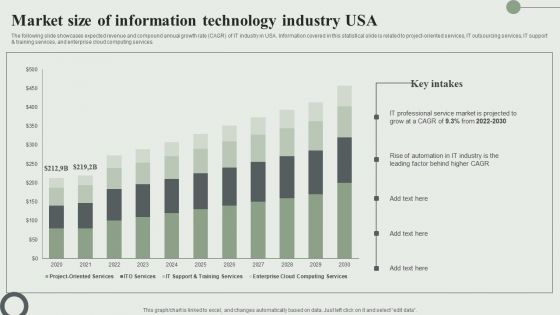
Market Size Of Information Technology Industry USA Ppt PowerPoint Presentation Diagram Lists PDF
The following slide showcases expected revenue and compound annual growth rate CAGR of IT industry in USA. Information covered in this statistical slide is related to project oriented services, IT outsourcing services, IT support and training services, and enterprise cloud computing services. Get a simple yet stunning designed Market Size Of Information Technology Industry USA Ppt PowerPoint Presentation Diagram Lists PDF. It is the best one to establish the tone in your meetings. It is an excellent way to make your presentations highly effective. So, download this PPT today from Slidegeeks and see the positive impacts. Our easy to edit Market Size Of Information Technology Industry USA Ppt PowerPoint Presentation Diagram Lists PDF can be your go to option for all upcoming conferences and meetings. So, what are you waiting for Grab this template today.
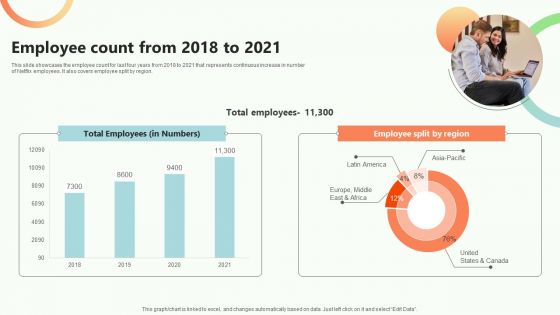
Online Video Content Provider Business Profile Employee Count From 2018 To 2021 Diagrams PDF
This slide showcases the employee count for last four years from 2018 to 2021 that represents continuous increase in number of Netflix employees. It also covers employee split by region. Do you have to make sure that everyone on your team knows about any specific topic I yes, then you should give Online Video Content Provider Business Profile Employee Count From 2018 To 2021 Diagrams PDF a try. Our experts have put a lot of knowledge and effort into creating this impeccable Online Video Content Provider Business Profile Employee Count From 2018 To 2021 Diagrams PDF. You can use this template for your upcoming presentations, as the slides are perfect to represent even the tiniest detail. You can download these templates from the Slidegeeks website and these are easy to edit. So grab these today.
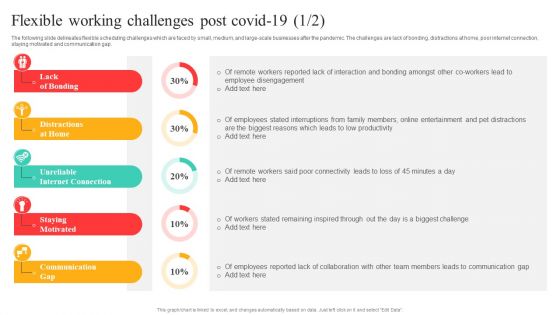
Flexible Working Policies And Guidelines Flexible Working Challenges Post Covid 19 Diagrams PDF
The following slide delineates flexible scheduling challenges which are faced by small, medium, and large-scale businesses after the pandemic. The challenges are lack of bonding, distractions at home, poor internet connection, staying motivated and communication gap. Formulating a presentation can take up a lot of effort and time, so the content and message should always be the primary focus. The visuals of the PowerPoint can enhance the presenters message, so our Flexible Working Policies And Guidelines Flexible Working Challenges Post Covid 19 Diagrams PDF was created to help save time. Instead of worrying about the design, the presenter can concentrate on the message while our designers work on creating the ideal templates for whatever situation is needed. Slidegeeks has experts for everything from amazing designs to valuable content, we have put everything into Flexible Working Policies And Guidelines Flexible Working Challenges Post Covid 19 Diagrams PDF
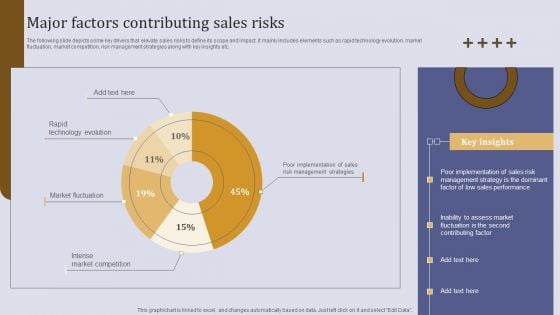
Executing Sales Risk Administration Procedure Major Factors Contributing Sales Risks Diagrams PDF
The following slide depicts some key drivers that elevate sales risks to define its scope and impact. It mainly includes elements such as rapid technology evolution, market fluctuation, market competition, risk management strategies along with key insights etc. Get a simple yet stunning designed Executing Sales Risk Administration Procedure Major Factors Contributing Sales Risks Diagrams PDF. It is the best one to establish the tone in your meetings. It is an excellent way to make your presentations highly effective. So, download this PPT today from Slidegeeks and see the positive impacts. Our easy to edit Executing Sales Risk Administration Procedure Major Factors Contributing Sales Risks Diagrams PDF can be your go to option for all upcoming conferences and meetings. So, what are you waiting for Grab this template today.
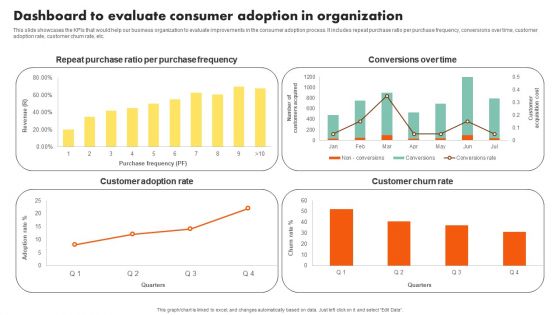
Examining Customer Experience Path To Enhance Adoption Rate Dashboard To Evaluate Consumer Adoption Diagrams PDF
This slide showcases the KPIs that would help our business organization to evaluate improvements in the consumer adoption process. It includes repeat purchase ratio per purchase frequency, conversions over time, customer adoption rate, customer churn rate, etc. Create an editable Examining Customer Experience Path To Enhance Adoption Rate Dashboard To Evaluate Consumer Adoption Diagrams PDF that communicates your idea and engages your audience. Whether youre presenting a business or an educational presentation, pre designed presentation templates help save time. Examining Customer Experience Path To Enhance Adoption Rate Dashboard To Evaluate Consumer Adoption Diagrams PDF is highly customizable and very easy to edit, covering many different styles from creative to business presentations. Slidegeeks has creative team members who have crafted amazing templates. So, go and get them without any delay.
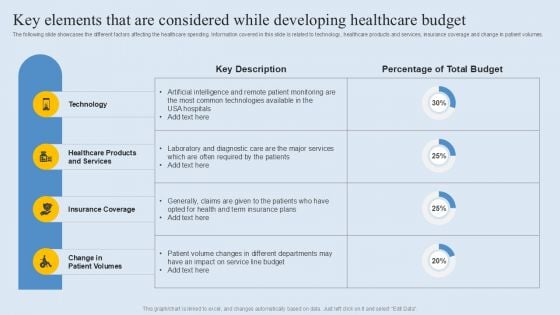
Key Elements That Are Considered While Developing Healthcare Budget Diagrams PDF
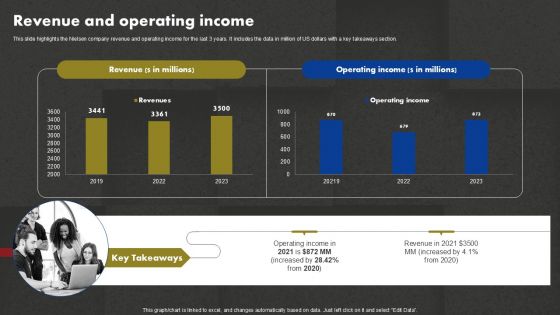
Data And Customer Analysis Company Outline Revenue And Operating Income Diagrams PDF
Enterprise SMS Marketing Subscribers Tracking Dashboard Ppt PowerPoint Presentation Diagram PDF
This slide represents the key metrics dashboard to monito and track the SMS marketing subscribers of the enterprise. It includes details related to KPIs such as total subscribers, new subscribers, total unsubscribes etc. Do you have an important presentation coming up Are you looking for something that will make your presentation stand out from the rest Look no further than Enterprise SMS Marketing Subscribers Tracking Dashboard Ppt PowerPoint Presentation Diagram PDF. With our professional designs, you can trust that your presentation will pop and make delivering it a smooth process. And with Slidegeeks, you can trust that your presentation will be unique and memorable. So why wait Grab Enterprise SMS Marketing Subscribers Tracking Dashboard Ppt PowerPoint Presentation Diagram PDF today and make your presentation stand out from the rest.
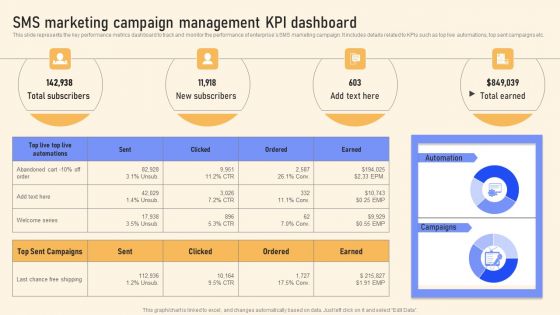
SMS Marketing Campaign Management KPI Dashboard Ppt PowerPoint Presentation Diagram Templates PDF
This slide represents the key performance metrics dashboard to track and monitor the performance of enterprises SMS marketing campaign. It includes details related to KPIs such as top live automations, top sent campaigns etc. Get a simple yet stunning designed SMS Marketing Campaign Management KPI Dashboard Ppt PowerPoint Presentation Diagram Templates PDF. It is the best one to establish the tone in your meetings. It is an excellent way to make your presentations highly effective. So, download this PPT today from Slidegeeks and see the positive impacts. Our easy to edit SMS Marketing Campaign Management KPI Dashboard Ppt PowerPoint Presentation Diagram Templates PDF can be your go to option for all upcoming conferences and meetings. So, what are you waiting for Grab this template today.
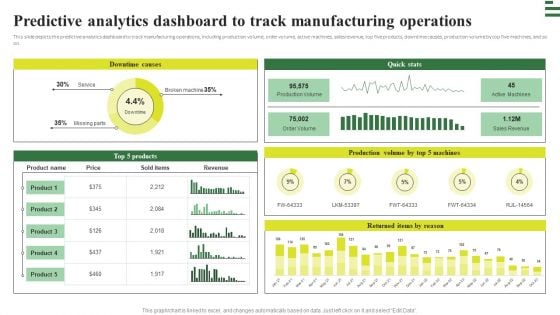
Transforming Manufacturing With Automation Predictive Analytics Dashboard To Track Diagrams PDF
This slide depicts the predictive analytics dashboard to track manufacturing operations, including production volume, order volume, active machines, sales revenue, top five products, downtime causes, production volume by top five machines, and so on. Get a simple yet stunning designed Transforming Manufacturing With Automation Predictive Analytics Dashboard To Track Diagrams PDF. It is the best one to establish the tone in your meetings. It is an excellent way to make your presentations highly effective. So, download this PPT today from Slidegeeks and see the positive impacts. Our easy to edit Transforming Manufacturing With Automation Predictive Analytics Dashboard To Track Diagrams PDF can be your go to option for all upcoming conferences and meetings. So, what are you waiting for Grab this template today.
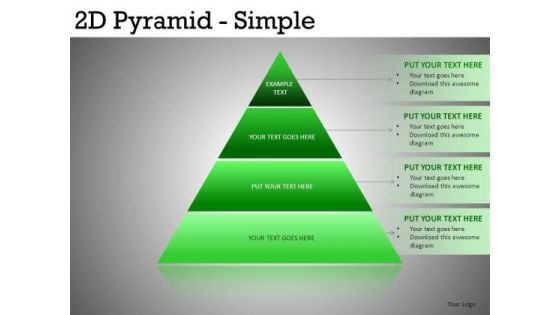
Pyramid Diagrams For PowerPoint
Pyramid Diagrams for PowerPoint-These high quality powerpoint pre-designed slides and powerpoint templates have been carefully created by our professional team to help you impress your audience. All slides have been created and are 100% editable in powerpoint. Each and every property of any graphic - color, size, orientation, shading, outline etc. can be modified to help you build an effective powerpoint presentation. Any text can be entered at any point in the powerpoint template or slide. Simply DOWNLOAD, TYPE and PRESENT! Beat criticism with our Pyramid Diagrams For PowerPoint. You will come out on top.
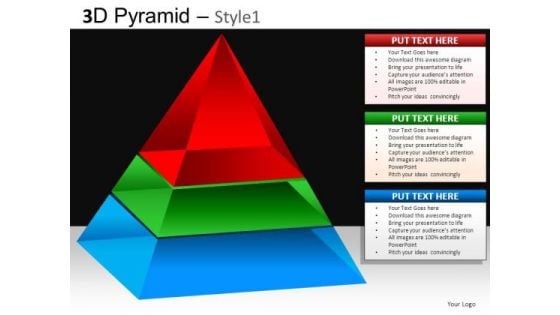
Process Diagram Pyramid Ppt
Process Diagram Pyramid PPT-These high quality powerpoint pre-designed slides and powerpoint templates have been carefully created by our professional team to help you impress your audience. All slides have been created and are 100% editable in powerpoint. Each and every property of any graphic - color, size, orientation, shading, outline etc. can be modified to help you build an effective powerpoint presentation. Any text can be entered at any point in the powerpoint template or slide. Simply DOWNLOAD, TYPE and PRESENT! With our Process Diagram Pyramid Ppt you won't be ambivalent. Decide on a definite direction to follow.
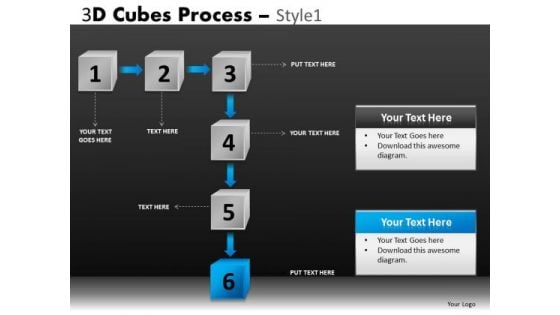
Business Flow Diagram Ppt
Business Flow Diagram PPT-These high quality powerpoint pre-designed slides and powerpoint templates have been carefully created by our professional team to help you impress your audience. All slides have been created and are 100% editable in powerpoint. Each and every property of any graphic - color, size, orientation, shading, outline etc. can be modified to help you build an effective powerpoint presentation. Any text can be entered at any point in the powerpoint template or slide. Simply DOWNLOAD, TYPE and PRESENT! Be productive with our Business Flow Diagram Ppt. You will come out on top.

Cube Diagram PowerPoint Slides
Cube Diagram PowerPoint Slides-These high quality powerpoint pre-designed slides and powerpoint templates have been carefully created by our professional team to help you impress your audience. All slides have been created and are 100% editable in powerpoint. Each and every property of any graphic - color, size, orientation, shading, outline etc. can be modified to help you build an effective powerpoint presentation. Any text can be entered at any point in the powerpoint template or slide. Simply DOWNLOAD, TYPE and PRESENT! Our Cube Diagram PowerPoint Slides take you from "concept to can". Make theprocess an amazing one.

Checklist Diagram PowerPoint
Checklist Diagram PowerPointThese high quality powerpoint pre-designed slides and powerpoint templates have been carefully created by our professional team to help you impress your audience. All slides have been created and are 100% editable in powerpoint. Each and every property of any graphic - color, size, orientation, shading, outline etc. can be modified to help you build an effective powerpoint presentation. Any text can be entered at any point in the powerpoint template or slide. Simply DOWNLOAD, TYPE and PRESENT! List your core competencies with our Checklist Diagram PowerPoint. They will make you look good.
Books Diagrams For PowerPoint
Books Diagrams for PowerPoint-These high quality powerpoint pre-designed slides and powerpoint templates have been carefully created by our professional team to help you impress your audience. All slides have been created and are 100% editable in powerpoint. Each and every property of any graphic - color, size, orientation, shading, outline etc. can be modified to help you build an effective powerpoint presentation. Any text can be entered at any point in the powerpoint template or slide. Simply DOWNLOAD, TYPE and PRESENT! Arrive at your desired destination. Complete the distance with our Books Diagrams For PowerPoint.
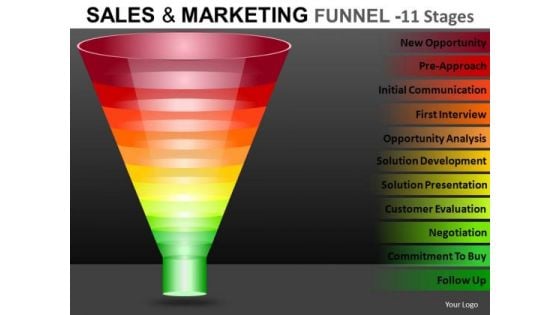
Funnel Diagram PowerPoint Templates
Funnel Diagram PowerPoint Templates-These high quality powerpoint pre-designed slides and powerpoint templates have been carefully created by our professional team to help you impress your audience. All slides have been created and are 100% editable in powerpoint. Each and every property of any graphic - color, size, orientation, shading, outline etc. can be modified to help you build an effective powerpoint presentation. Any text can be entered at any point in the powerpoint template or slide. Simply DOWNLOAD, TYPE and PRESENT! Our Funnel Diagram PowerPoint Templates are associated with ambition. They encourage you to dream big.
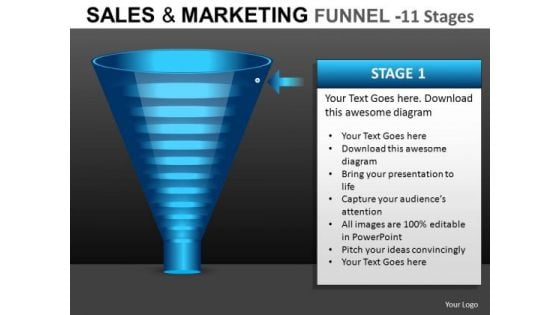
Funnel PowerPoint Diagrams
Funnel PowerPoint Diagrams-These high quality powerpoint pre-designed slides and powerpoint templates have been carefully created by our professional team to help you impress your audience. All slides have been created and are 100% editable in powerpoint. Each and every property of any graphic - color, size, orientation, shading, outline etc. can be modified to help you build an effective powerpoint presentation. Any text can be entered at any point in the powerpoint template or slide. Simply DOWNLOAD, TYPE and PRESENT! Our Funnel PowerPoint Diagrams are like a deep breath. They ensure your ideas endure.
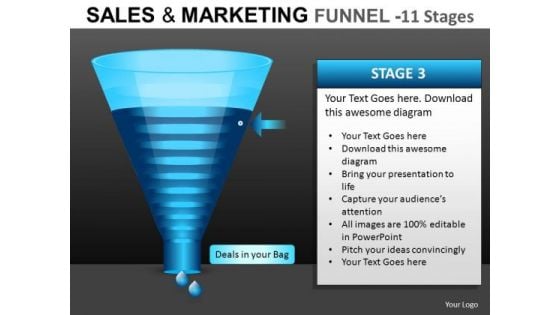
PowerPoint Diagrams Funnel Slides
PowerPoint Diagrams Funnel Slides-These high quality powerpoint pre-designed slides and powerpoint templates have been carefully created by our professional team to help you impress your audience. All slides have been created and are 100% editable in powerpoint. Each and every property of any graphic - color, size, orientation, shading, outline etc. can be modified to help you build an effective powerpoint presentation. Any text can be entered at any point in the powerpoint template or slide. Simply DOWNLOAD, TYPE and PRESENT! Excavate away with our PowerPoint Diagrams Funnel Slides. Explore new depths and ways to go.
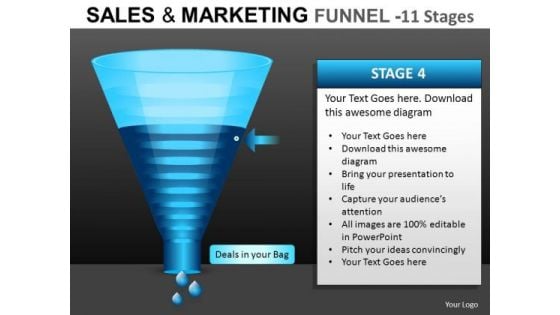
Ppt Slides Funnel Diagrams
Slides Funnel Diagrams-These high quality powerpoint pre-designed slides and powerpoint templates have been carefully created by our professional team to help you impress your audience. All slides have been created and are 100% editable in powerpoint. Each and every property of any graphic - color, size, orientation, shading, outline etc. can be modified to help you build an effective powerpoint presentation. Any text can be entered at any point in the powerpoint template or slide. Simply DOWNLOAD, TYPE and PRESENT! See your plans begin to crystallize. Our Ppt Slides Funnel Diagrams make it feasible.

Water Funnels PowerPoint Diagrams
Water Funnels PowerPoint Diagrams-These high quality powerpoint pre-designed slides and powerpoint templates have been carefully created by our professional team to help you impress your audience. All slides have been created and are 100% editable in powerpoint. Each and every property of any graphic - color, size, orientation, shading, outline etc. can be modified to help you build an effective powerpoint presentation. Any text can be entered at any point in the powerpoint template or slide. Simply DOWNLOAD, TYPE and PRESENT! Our Water Funnels PowerPoint Diagrams will exhibit your ability. Demonstrate your talent to one and all.
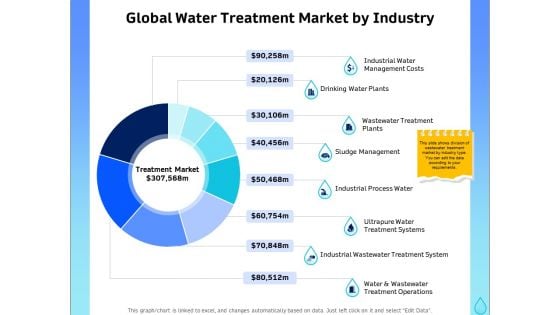
Integrated Water Resource Management Global Water Treatment Market By Industry Diagrams PDF
Presenting this set of slides with name integrated water resource management global water treatment market by industry diagrams pdf. The topics discussed in these slides are industrial water management costs, drinking water plants, wastewater treatment plants, sludge management, industrial process water, ultrapure water treatment systems, industrial wastewater treatment system, water and wastewater treatment operations. This is a completely editable PowerPoint presentation and is available for immediate download. Download now and impress your audience.
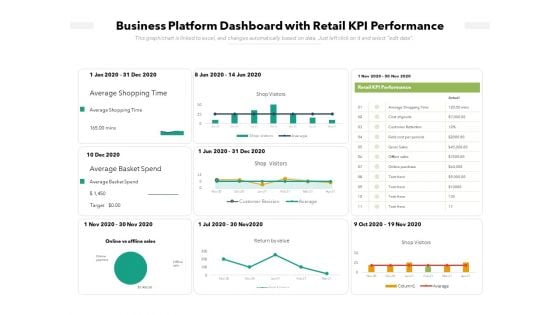
Business Platform Dashboard With Retail KPI Performance Ppt PowerPoint Presentation Slides Diagrams PDF
Pitch your topic with ease and precision using this business platform dashboard with retail kpi performance ppt powerpoint presentation slides diagrams pdf. This layout presents information on retail kpi performance, business platform dashboard with retail kpi performance, online vs offline sales, shop visitors. It is also available for immediate download and adjustment. So, changes can be made in the color, design, graphics or any other component to create a unique layout.
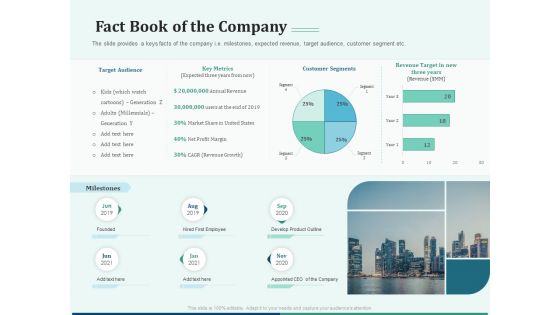
Early Stage Funding Fact Book Of The Company Ppt Outline Diagrams PDF
The slide provides a keys facts of the company i.e. milestones, expected revenue, target audience, customer segment etc. Deliver and pitch your topic in the best possible manner with this early stage funding fact book of the company ppt outline diagrams pdf. Use them to share invaluable insights on target audience, annual revenue, market, net profit margin, develop product outline and impress your audience. This template can be altered and modified as per your expectations. So, grab it now.
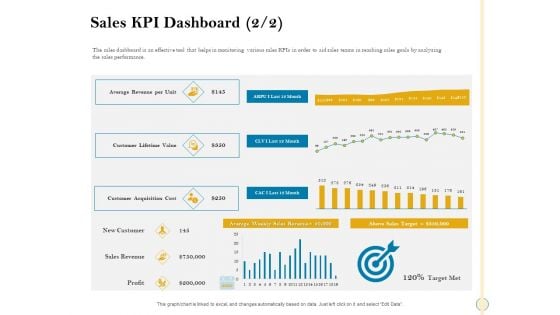
Sales Optimization Best Practices To Close More Deals Sales KPI Dashboard Revenue Diagrams PDF
The sales dashboard is an effective tool that helps in monitoring various sales KPIs in order to aid sales teams in reaching sales goals by analyzing the sales performance. Deliver an awe inspiring pitch with this creative sales optimization best practices to close more deals sales kpi dashboard revenue diagrams pdf bundle. Topics like sales kpi dashboard can be discussed with this completely editable template. It is available for immediate download depending on the needs and requirements of the user.
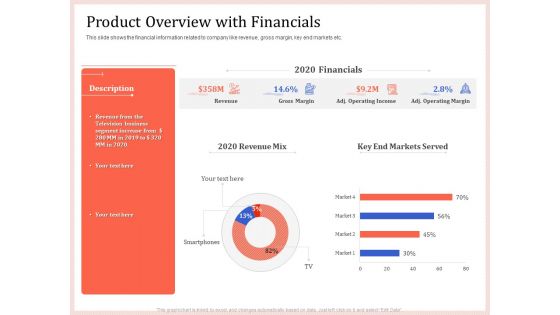
Pitch Deck To Raise Capital From Product Pooled Funding Product Overview With Financials Diagrams PDF
This slide shows the financial information related to company like revenue, gross margin, key end markets etc. Deliver and pitch your topic in the best possible manner with this pitch deck to raise capital from product pooled funding product overview with financials diagrams pdf. Use them to share invaluable insights on revenue, gross margin, operating income, operating margin and impress your audience. This template can be altered and modified as per your expectations. So, grab it now.
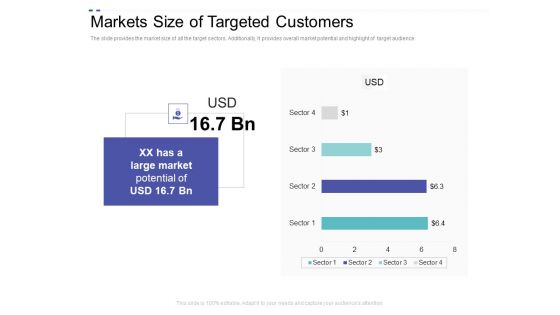
Crowd Sourced Equity Funding Pitch Deck Markets Size Of Targeted Customers Ppt Inspiration Diagrams PDF
The slide provides the market size of all the target sectors. Additionally, it provides overall market potential and highlight of target audience. Deliver an awe inspiring pitch with this creative crowd sourced equity funding pitch deck markets size of targeted customers ppt inspiration diagrams pdf bundle. Topics like markets size of targeted customers can be discussed with this completely editable template. It is available for immediate download depending on the needs and requirements of the user.
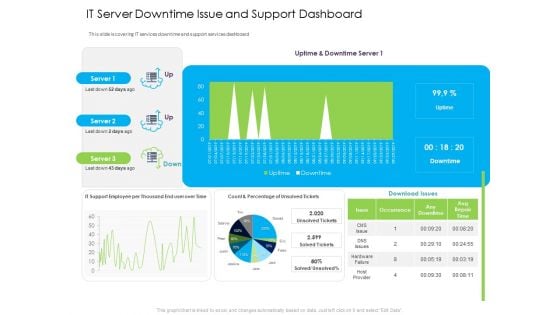
Managed IT Services Pricing Model IT Server Downtime Issue And Support Dashboard Diagrams PDF
This slide is covering IT services downtime and support services dashboard. Deliver and pitch your topic in the best possible manner with this managed it services pricing model it server downtime issue and support dashboard diagrams pdf. Use them to share invaluable insights on issue, occurrence, any downtime and impress your audience. This template can be altered and modified as per your expectations. So, grab it now.
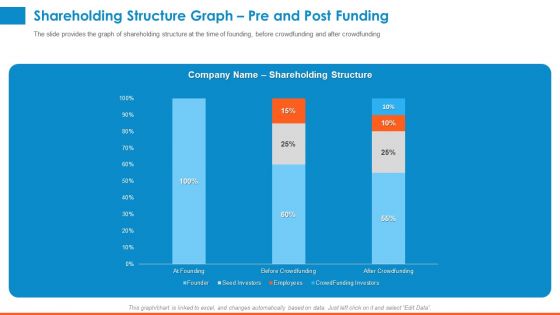
Raising Company Capital From Public Funding Sources Shareholding Structure Graph Pre And Post Funding Diagrams PDF
The slide provides the graph of shareholding structure at the time of founding, before crowdfunding and after crowdfunding. Deliver an awe-inspiring pitch with this creative raising company capital from public funding sources shareholding structure graph pre and post funding diagrams pdf bundle. Topics like founder, seed investors, employees, crowdfunding investors, before crowdfunding, after crowdfunding can be discussed with this completely editable template. It is available for immediate download depending on the needs and requirements of the user.
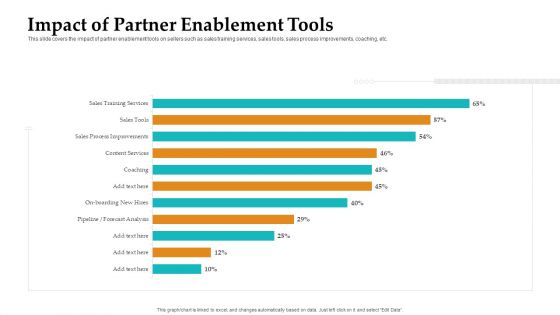
Sales Facilitation Partner Management Impact Of Partner Enablement Tools Diagrams PDF
This slide covers the impact of partner enablement tools on sellers such as sales training services, sales tools, sales process improvements, coaching, etc. Deliver and pitch your topic in the best possible manner with this sales facilitation partner management impact of partner enablement tools diagrams pdf. Use them to share invaluable insights on sales, training, process, service, coaching and impress your audience. This template can be altered and modified as per your expectations. So, grab it now.
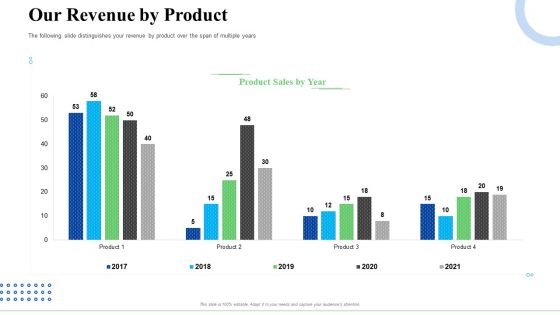
Strategic Plan For Business Expansion And Growth Our Revenue By Product Diagrams PDF
The following slide distinguishes your revenue by product over the span of multiple years. Deliver and pitch your topic in the best possible manner with this strategic plan for business expansion and growth our revenue by product diagrams pdf. Use them to share invaluable insights on our revenue by product and impress your audience. This template can be altered and modified as per your expectations. So, grab it now.
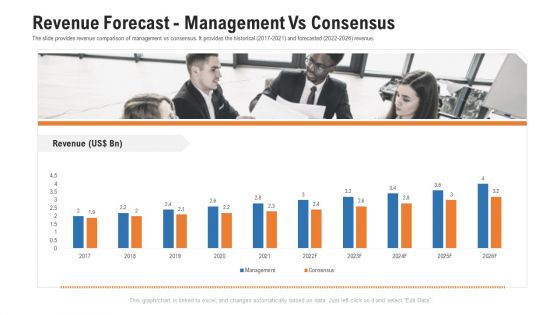
Pitch Deck For Procurement Deal Revenue Forecast Management Vs Consensus Diagrams PDF
The slide provides revenue comparison of management vs consensus. It provides the historical 2017-2021 and forecasted 2022-2026 revenue. Deliver an awe inspiring pitch with this creative pitch deck for procurement deal revenue forecast management vs consensus diagrams pdf bundle. Topics like revenue forecast management vs consensus can be discussed with this completely editable template. It is available for immediate download depending on the needs and requirements of the user.
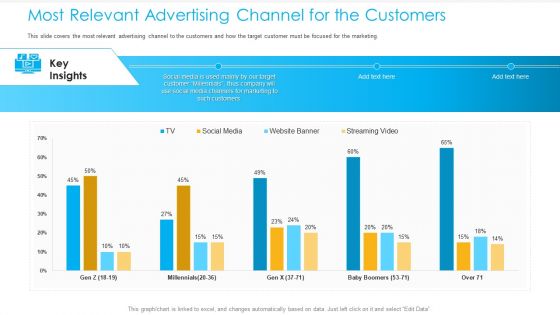
Unified Business Consumer Marketing Strategy Most Relevant Advertising Channel Customers Diagrams PDF
This slide covers the most relevant advertising channel to the customers and how the target customer must be focused for the marketing Deliver and pitch your topic in the best possible manner with this unified business consumer marketing strategy most relevant advertising channel customers diagrams pdf. Use them to share invaluable insights on key insights, marketing to such customers, millennials and impress your audience. This template can be altered and modified as per your expectations. So, grab it now.
Inculcating Supplier Operation Improvement Plan Inventory Turnover Tracking Dashboard Diagrams PDF
This slide displays inventory turnover tracking dashboard. It includes information about achievable and target inventory, it also shows various reasons for product or package return. Deliver an awe inspiring pitch with this creative inculcating supplier operation improvement plan inventory turnover tracking dashboard diagrams pdf bundle. Topics like inventory turnover tracking dashboard can be discussed with this completely editable template. It is available for immediate download depending on the needs and requirements of the user.
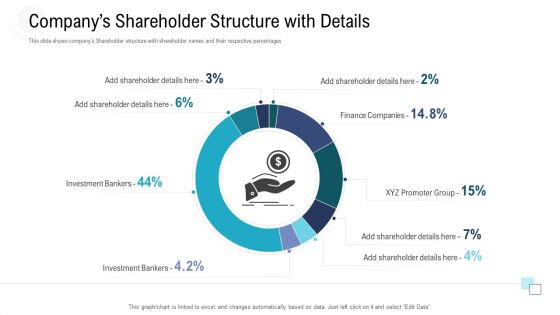
Investor Pitch Deck To Procure Federal Debt From Banks Companys Shareholder Structure With Details Diagrams PDF
This slide shows companys Shareholder structure with shareholder names and their respective percentages. Deliver and pitch your topic in the best possible manner with this investor pitch deck to procure federal debt from banks companys shareholder structure with details diagrams pdf. Use them to share invaluable insights on finance companies, investment bankers, companys shareholder structure with details and impress your audience. This template can be altered and modified as per your expectations. So, grab it now.
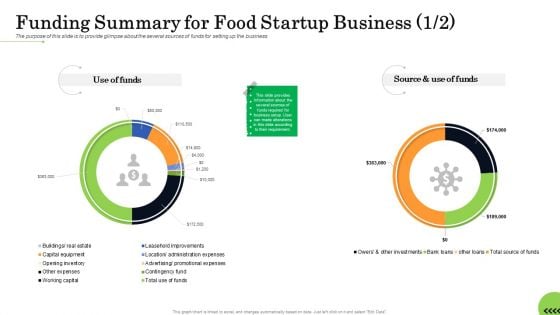
Business Plan For Fast Food Restaurant Funding Summary For Food Startup Business Bank Diagrams PDF
The purpose of this slide is to provide glimpse about the several sources of funds for setting up the business. Deliver an awe inspiring pitch with this creative business plan for fast food restaurant funding summary for food startup business bank diagrams pdf bundle. Topics like source, inventory, improvement, investment can be discussed with this completely editable template. It is available for immediate download depending on the needs and requirements of the user.

Past Trends In Revenue Of XYZ Logistic Company Worldwide Diagrams PDF
This slide shows the past trends in revenue of XYZ Logistic Company worldwide. The graph shows a constant decline in sales since 2017.Deliver and pitch your topic in the best possible manner with this past trends in revenue of xyz logistic company worldwide diagrams pdf. Use them to share invaluable insights on past trends in revenue of xyz logistic company worldwide and impress your audience. This template can be altered and modified as per your expectations. So, grab it now.


 Continue with Email

 Home
Home


